Article

Area-Wide Prediction of Vertebrate and Invertebrate Hole Density and Depth across a Climate Gradient in Chile Based on UAV and Machine Learning

1
Laboratory for Climatology and Remote Sensing, Department of Geography, University of Marburg, 35037 Marburg, Germany
2
Soil Geography and Landscape, Department of Environmental Sciences, Wageningen University & Research, 6700 AA Wageningen, The Netherlands
3
Conservation Ecology, Department of Biology, University of Marburg, 35032 Marburg, Germany
4
Earth System Dynamics, Department of Geosciences, University of Tübingen, 72076 Tübingen, Germany
5
Facultad de Agronomía, Universitad de Concepción, Chillán 3780000, Chile
6
Facultad de Historia, Geografía y Ciencia Política, Instituto de Geografía, Pontificia Universidad Católica de Chile, Santiago 7820436, Chile
7
Departamento de Ecología, Facultad de Ciencias Biológicas, Pontificia Universidad Católica de Chile, Santiago 8331150, Chile
8
Center of Applied Ecology and Sustainability (CAPES), Pontificia Universidad Católica de Chile, Santiago 8331150, Chile
9
Animal Ecology, Department of Biology, University of Marburg, 35032 Marburg, Germany
*
Author to whom correspondence should be addressed.
Drones 2021, 5(3), 86; https://doi.org/10.3390/drones5030086
Submission received: 20 July 2021 / Revised: 20 August 2021 / Accepted: 25 August 2021 / Published: 30 August 2021
(This article belongs to the Special Issue Advances in Civil Applications of Unmanned Aircraft Systems)

Abstract

:
Burrowing animals are important ecosystem engineers affecting soil properties, as their burrowing activity leads to the redistribution of nutrients and soil carbon sequestration. The magnitude of these effects depends on the spatial density and depth of such burrows, but a method to derive this type of spatially explicit data is still lacking. In this study, we test the potential of using consumer-oriented UAV RGB imagery to determine the density and depth of holes created by burrowing animals at four study sites along a climate gradient in Chile, by combining UAV data with empirical field plot observations and machine learning techniques. To enhance the limited spectral information in RGB imagery, we derived spatial layers representing vegetation type and height and used landscape textures and diversity to predict hole parameters. Across-site models for hole density generally performed better than those for depth, where the best-performing model was for the invertebrate hole density (R2 = 0.62). The best models at individual study sites were obtained for hole density in the arid climate zone (R2 = 0.75 and 0.68 for invertebrates and vertebrates, respectively). Hole depth models only showed good to fair performance. Regarding predictor importance, the models heavily relied on vegetation height, texture metrics, and diversity indices.

1. Introduction

Terrestrial burrowing vertebrates and invertebrates are important ecosystem engineers. Through their burrowing activity, they increase soil porosity and permeability, thus affecting the infiltration and erosion rates [1,2,3,4,5]. The construction of underground burrows leads to the redistribution and concentration of nutrients [6,7,8]. Their burrowing positively influences soil carbon storage [9,10] and decreases the ratio of stable and unstable carbonate aggregates in the soil [11]. The mixing of soil shifts the soil horizons and drives soil production and pedogenesis on a long-term basis [12,13,14]. To understand the abundance of burrowing animals, their burrowing behavior and their potential distribution patterns is thus of importance.
The habitat preferences of burrowing animals in regard to the vegetation distribution were shown to be species dependent [10,15,16,17,18] The distribution of single burrowing animal species was associated with cacti [19], herbs [20], perennial grass or dense shrubs [21,22], skeleton [23] or increased landscape heterogeneity [24]. Due to the important role of burrowing animals as ecosystem engineers and the contradictory habitat preferences of burrowing animals, a spatial analysis showing the dependence of the burrowing intensity on vegetation patterns across the species and climate zones is needed. For this, a suitable approach for the area-wide prediction of burrowing intensity, which can be expressed by the density and depth of holes created by all present burrowing animals, must be developed.
As taking in situ hole density and depth measurements is labor-intensive, remote sensing can serve as a more practical approach, as it provides opportunities for effective area-wide spatial estimates. Previous studies have used UAVs to directly map the burrows and mounds created by burrowing animals. However, these studies were conducted in areas where the burrows could be directly recognized in images, were limited to vertebrates, and focused on single species. The burrows were then mapped using image segmentation [25] or classification approaches [17,26,27,28]. The detection success predominantly depended on the vegetation density and height. Even within grassland areas with low vegetation cover, significantly more burrows were counted in ground-truth surveys than were detected in UAV-obtained orthomosaic images [27]. If burrows were not visible in the images because they were partly or completely overlaid by vegetation, previous authors did not estimate the density and depth of burrows, but only defined areas with or without burrows. In these cases, MaxEnt models [29] based on predictors from vegetation [30] or Digital Surface Models (DSMs) generated from UAV images [31] have been applied. However, beyond hole detection, none of the previous studies has estimated the area-wide density and depth of holes created by all vertebrate and invertebrate burrowing animals, regardless of the vegetation coverage and taxa, or tested their approach in several climate zones. As demonstrated in this study, a combination of ecological in situ measurements, geospatial information, and application of machine learning techniques offers possibilities for the prediction of the area-wide hole density and depth, even in areas with dense vegetation coverage.
UAVs offer here a suitable solution to identify environmental parameters which might be linked to the animal burrowing intensity. UAV-estimated vegetation height and volume have previously been used as predictors to delineate vertebrate habitats [32]. Similarly, land-use and the distribution of single vegetation types have been derived from UAV images and were associated with animal distribution [33,34] or used as predictors for the estimation of population sizes [35]. In cases where the landscape structure is of major importance, texture metrics and diversity indices have been shown to be suitable predictors for area-wide predictions of species richness in diverse ecosystems [36,37,38,39]. The texture metrics obtained from high-resolution UAV images notably improved the estimation of habitat structures [40,41].
For this study, we developed, applied, and tested machine learning approaches based on consumer-oriented UAV RGB (Red–Green–Blue spectral range) imagery, in order to predict the density and depth of holes created by all present burrowing vertebrates and invertebrates. We tested several predictor sets and included 3D landscape structures, their textures, land-cover fractions, and diversity as predictors, in addition to spectral bands, topography, and climate, which can only be obtained by UAVs at such high resolution. We analyzed the model performance and identified the most important predictors, and the performance of models trained for the vertebrate and invertebrate hole density and depth was determined across a climate gradient and at individual climate sites. Finally, we present the area-wide prediction of hole density and depth along the climate gradient.

2. Materials and Methods

We hypothesize that the animal burrowing intensity is dependent on vegetation patterns and can be spatially predicted by UAV-obtained data. We measured the density and depth of holes within plots created by local communities of vertebrate and invertebrate burrowing animals across four study sites in Chile. We first tested if there is a high correlation between in situ vegetation patterns and our targeted variables by setting up linear models and using data from ground vegetation survey as predictors. We then collected high-resolution UAV imagery of the study sites and trained machine learning models to predict the density and depth of holes (Figure 1). We used climate, topography, spectral bands, vegetation indices, land-cover fractions and diversity indices derived from land-cover classification, vegetation height, texture metrics derived from vegetation height, and texture metrics derived from spectral bands as predictors in our models. Then, we fitted one random forest (RF) model for the whole study area and one RF model per study site, and estimated the most important predictors. To test the impact of various predictor sets on the model performance, we separately tested models using different predictor sets consisting of several predictors describing similar environmental parameters. We present the predicted hole density and depth across the four study sites and their association with the estimated land-cover and vegetation height diversity.

2.1. Study Area

Our study was performed along a climate and vegetation gradient in Chile, comprising four study sites in the Chilean Coastal Cordillera: Pan de Azúcar (PdA) National Park (NP), Santa Gracia (SG), La Campana (LC) NP, and Nahuelbuta (NA) NP (Figure 2). PdA NP is located in the arid zone in a fog-laden environment in the southern part of the Atacama Desert, with almost no precipitation. The vegetation cover is less than 5% and dominated by small desert shrubs, several types of cacti and biocrusts [42]. SG is a natural reserve located in the semi-arid zone near La Serena, which is dominated by goat grazing. The vegetation consists of shrubs and cacti, covering up to 40% of the study area. LC NP is part of the Mediterranean-type climatezone in the Valparaiso Region and is also affected by cattle. The study site is dominated by an evergreen sclerophyllous forest with endemic palms. The canopy reaches a height of up to 9 m, and the understory consists of deciduous shrubs and herbs. NA is located in the humid-temperate zone and characterized by a dense evergreen Araucaria forest comprising broadleaved trees with heights of up to 14 m. The ground is covered by bamboo, shrubs, and herbs [43,44]. There are at least 45 vertebrate and 345 invertebrate species in Chile which exhibit burrowing behavior [45]. The most common vertebrate burrowing animals are in PdA carnivores (Lycalopex culpaeus, Lycalopex griseus); marsupials (Didelphis marsupialis, Didelphis albiventris) and rodents (Phyllotis xanthopygus, Phyllotis limatus, Abrothrix andinus) [46,47]; in SG marsupials (Thylamys elegans) and rodents (Phyllotis darwini, Abrothrix olivaceus, Octodon degus, Abrocoma bennetti, Rattus rattus) [19]; in LC and NA rodents (Octodon degus, Rattus norvegicus and Phyllotis darwini) and carnivores (Lycalopex griseus) [48]. The most commoninvertebrate burrowing animals are in PdA Curculionida and Tenebrionidae [49]; in SG Araucomyrmex goetschi, Brachymyrmex giardia and Solenopsis gayi [50]; in LC Arthroconus elongates and Nycterinus rugicep [49]; and in NA Staphylinidae, Curculionidae and Cerambycidae [51].

2.2. In Situ Data

The response data were collected during a field campaign from September to November 2019 in 13–20 10 m × 10 m plots dispersed randomly on one north-facing and one south-facing hillside per study site (68 plots in total, Figure 1). The distance between the plots was at least 20 m. Within each plot, we counted the number of holes created by burrowing animals and measured the diameter and depth (tunnel length until first obstacle) of each hole (Table S1, Figure S7). We assumed that holes with a diameter equal to or greater than 2.5 cm were created by vertebrates and that holes with a diameter less than 2.5 cm were created by invertebrates [45]. We created four response data sets: Density of vertebrate holes, density of invertebrate holes, depth of vertebrate holes, and depth of invertebrate holes.
Additionally, we mapped the ground land cover within each plot. We estimated the abundance, coverage, size (diameter and height) and position of all vegetation individuals and skeleton. We classified the mapped vegetation into herbs, shrubs, cacti and trees. We mapped only the skeleton with a diameter of 0.20 m and above. For trees, we measured the diameter of the stem and the height to the top of the crown. The height of vegetation individuals below 2.5 m was measured. Ten plots included at least one individual with a height of above 2.5 m. In this case, we guessed the height of the individual. The coverage of each class was estimated by multiplying the average cover by the number of individuals for each class. The vegetation cover was the sum of the calculated cover of each class. Additionally, we calculated the average vegetation height of each class and of all vegetation.
The climate data were measured in project-specific climate stations, located either directly on the studied hillsides or within a 1 km distance [42,52]. The average air temperature [°C], average soil temperature [°C], and cumulative precipitation [mm] for the year 2019 were calculated for each site.

2.3. Linear Regression Models

We first tested if the response data sets can be predicted by the in situ measured vegetation patterns. We calculated 24 predictors from the land cover data estimated in plots. We used the soil, vegetation and skeleton coverage, average vegetation height as well as the coverage, height, diameter and abundance of individuals for each class as predictors. Additionally, we calculated the heterogeneity of each plot, by estimating the variance of measured vegetation height, abundance, size and coverage between the classes. Lastly, we included the site as a predictor, to be able to examine the predictor strength on the response variable per site.
We first applied a backward stepwise elimination to remove the redundant predictors and then fitted linear mixed effect regression models [53]. We validated the models by implemented Leave-One-Out cross validation [54].

2.4. UAV Data

The UAV flights were conducted during the same field campaign from September to November 2019. We obtained UAV images of one north-facing and one south-facing hillside per study site, which included the 68 plots (Figure 3). We used a 3D Robotics SOLO quadrocopter equipped with a GoPRO Hero 4 Black RGB camera. Eight flights were conducted for each hillside (total of 64 flights). The flight plans were created using the Mission Planner version 1.3.700 software [55]. Flight altitude was set at 20 m above the drone starting and landing points, and the flights were conducted downward from this point. The width and length of the overflown areas were set with respect to the hillside inclination and canopy level, in order to ensure that the maximum drone altitude above the ground did not exceed 40 m. Two flights were performed with opposite flying angles over every area, in order to ensure full coverage and to create a 3D model of the landscape afterwards. The flying speed was 5 m/s, the overlap was set to 90%, and the site overlap was at least 70%. The camera angle was 10°, and a photo was taken every 0.74 s during the mission. The photos were geo-tagged using CAM messages from the data-flash protocol. The images were then used to create an orthophoto and a Digital Surface Model (DSM) of each hillside. The processing was carried out using the Agisoft Metashape Professional version 1.5.5.9097 software. The photos were aligned using a generic pre-selection method, and a point cloud was created. The DSM was calculated from the point cloud, and the orthophotos were built from the aligned photos. The ground sampling distance of the DSM and orthophotos varied between 1.76 and 3.7 cm. The orthophotos were resampled to a uniform ground sampling distance of 3.7 cm, in order to allow for a comparison of model performance between the study sites (Table S2).

2.5. Calculation of the Predictors

We used several predictor sets in the models to determine spatial hole densities and depths (Table 1). The predictor sets included climate, topography, spectral bands, vegetation indices, land-cover, vegetation height, texture metrics (calculated from two vegetation indices, spectral bands and vegetation height), and diversity indices calculated from land-cover classification.
The ‘red’ (R), ‘green’ (G), and ‘blue’ (B) spectral bands were extracted from orthophotos. The following vegetation indices were calculated using the relative data extracted directly from GoPro: The red–green–blue vegetation index (RGBVI) [57], green-leaf-index (GLI) [58], visible atmospherically resistant index (VARI) [59], normalized green-red difference index (NGRDI) [60], vegetation dryness index (VDI) [61], excess green vegetation index (EXG) [62], and green chromatic coordinate (GCC) [63]. These indices were selected due to their various vegetation detection abilities under diverse environmental conditions, which are possibly related to the disturbances caused by burrowing animals [57,58,59,60,61,62,63].
The land-cover fractions were obtained through land-cover classification. The basis for calculating the fractions of land-cover per 10 m × 10 m pixels was the land-cover classification at 3.7 ground sampling distance. One pixel-based supervised classification per study site was conducted using Random Forest Classification from the R ‘caret’ package [72]. The RF algorithm is based on building several uncorrelated decision trees during training, then merging them together and providing an output, which is calculated as the mean predicted value of the individual trees [73]. We used the DSM, RGB bands, and vegetation indices as predictors. We specified six main classes and divided them into sub-classes. The main classes were soil, skeleton, herbs, shrubs, cacti, and trees. The sub-classes varied between sites (Table S3). In PdA, soil was sub-divided into soil largely covered by soil crusts, weathered granite soil, and saprolite soil, while cacti were sub-divided into classes of the genera Copiapoa and Eulychnia. In SG, the soil was sub-divided into two sub-classes, and cacti were classified into the genus Eulychnia and other genera. In NA, skeleton was classified into rocks (equal to or less than 25.5 cm in diameter) and boulders (greater than 25.5 cm in diameter), while trees were sub-divided into the genera Araucaria and others. No trees were classified in PdA, and no cacti in LC and NA. Training areas for the land-cover classification were visually identified in the orthophotos. Approximately 200 pixels per land-cover class per site were tagged, in order to create the training/testing data set. This data set was randomly split into 70% training and 30% testing data. The land-cover classification model was trained using the 70% training data and validated using 30% test pixels. Classification performance was estimated by Cohen’s Kappa and Sensitivity. Sensitivity was calculated separately for each land-cover class. The performance of the land-cover models varied along the climate gradient (in PdA: κ = 0.81; in SG: κ = 0.72; in LC: κ = 0.81; in NA: κ = 0.76). The highest sensitivity was observed for the classes soil, cacti, and trees (Table S4), which were correctly classified in more than 80% of cases. In SG, all soil pixels were classified accordingly. The sensitivity was lower for the class skeleton, which was often misclassified as soil. Cacti were misclassified as shrubs or herbs in roughly 10% of all cases, but the model almost always correctly differentiated between the various types of cacti. The predictability of the shrubs and herbs classes varied. Overall, the sensitivity of both was 70%. However, in NA, the model misclassified 40% of herbs as shrubs; meanwhile, in SG, 75% of shrubs were classified as herbs. The study sites were then classified using the trained models. The resolution of the classification output layer was downscaled to 10 m, and the soil fraction, herb fraction, shrub fraction, tree fraction, cacti fraction, and skeleton fraction were calculated as the percent coverage per pixel. Additionally, the vegetation fraction was calculated as the percent coverage of any vegetation type per pixel.
The elevation predictor was obtained by calculating the digital elevation model (DEM) using the DSM and the land-cover classification. A masked DSM layer was created by removing all pixels classified as any class other than soil or skeleton in the corresponding land-cover classification. The remaining pixels were used to fit a thin plate spline (TPS) model, by applying the TPS regression algorithm from the ‘fields’ R package [74]. The distribution of pixels used for the regression fit was uniform across the elevation gradient on hillsides in PdA, SG, and LC. However, in NA, most of the pixels at lower altitudes were masked. The TPS models were trained separately for each site. The smoothing parameter was chosen using generalized cross-validation. The mean absolute error (MAE) of the regression model was the lowest in NA (MAE = 0.05), SG (MAE = 0.08), and PdA (MAE = 0.11), and the highest in LC (MAE = 0.41). The DEM was created by applying the fitted TPS models for the interpolation of the masked DSM using the function ‘interpolate’ from the R ‘raster’ package [75]. The inclination and aspect predictors were calculated from the DEM [56]. The number of neighbors was 8.
The vegetation height predictor was calculated by subtracting the DEM from the DSM. The height was additionally calculated for each vegetation type (herbs, shrubs, trees, and cacti) separately. For this, the corresponding difference values classified as the respective vegetation type in the land-cover classification were used, while all other values were set to zero.
As burrowing animals are expected to increase landscape heterogeneity [76,77], we calculated several texture metrics and diversity indices. The texture metrics were calculated from the spectral bands, two vegetation indices, and the vegetation height predictor, and were derived from gray-level co-occurrence matrices using the ‘glcm’ R-package [78]. We used a moving window of 108 × 108 pixels, which is equal to 10 m × 10 m, corresponding to the size of the plots. The texture metrics applied were ‘variance’, ‘entropy’, ‘homogeneity’, ‘second moment’, ‘correlation’, ‘dissimilarity’, and ‘contrast’ [64] (Table S7). These metrics determine the heterogeneity of habitats [79,80], particularly in relation to vegetation structure [81]. The texture metrics mean, variance, and correlation were least correlated with each other. There was a higher positive correlation between the entropy, dissimilarity, and contrast metrics, which were negatively correlated with homogeneity and second moment [82]. We calculated several diversity indices from the land-cover classifications using the ‘rasterDiv’ package [65]; namely, Shannon’s Diversity [66], Pielou’s Evenness [67], the Berger–Parker Index [68], Cumulative Residual Entropy [70], Rao’s quadratic entropy [69], Hill’s number [71], and Rényi’s index [83]. The window size was also 10 m × 10 m (or 108 × 108 pixels), corresponding to the size of the plots. These indices were selected due to their various representations of diversity (in our case, the land-cover class diversity), which is expected to be largely affected by burrowing animals [24,84].
A cumulative error developed during the calculation of the predictors. The DEM layers were created with an R2 = 0.95. The land cover classifications had an average R2 = 0.80. The vegetation height layers thus have a cumulative error of R2 = 0.95 × 0.80 = 0.76. The diversity predictors have R2 = 0.76 (when derived from vegetation height) till R2 = 0.80 (when derived from land cover classification).

2.6. Model Setup

To obtain the best-fit models for the whole study area for each response data set, we first selected the predictors, then tuned the hyperparameters and, finally, trained the models.
To select the predictors, we first calculated Pearson’s correlation between all predictors and removed all redundant predictors with an absolute correlation of ≥0.75. Using the remaining predictors with an absolute correlation of <0.75, we applied a recursive feature elimination algorithm (RFE). The RFE first trains a model and estimates the importance of the predictors. Then, the RFE iteratively removes predictors with the least importance and trains the models using the remaining predictors. The outcome of the RFE is the number and composition of predictors that were used in the best-performing model, based on the specified model performance metrics [72]. Within the RFE, we used an RF selection function and validated the models by performing repeated 5-fold cross-validation. We selected the predictors used in the model through use of the lowest root-mean-square error (RMSE).
After the RFE, hyperparameter tuning was conducted. We used the ‘tuneRF’ function, which enables the training of several RF models with varying hyperparameter values, and then examined the performance of the models. The tuning consisted of selecting the optimal number of trees after each split (ntree) and the optimal number of predictors randomly selected at each split (mtry) [72]. We gradually tested ‘ntree’ with values between 50 and 1000 (in steps of 50) and selected the ‘ntree’ value leading to the highest model performance. We selected the ideal ‘mtry’ by selecting the model with the lowest Out-of-bag Error (OOB Error). We started at mtry = 1 and increased it stepwise by 1, and continued as long as the OOB Error decreased by at least 1e-5 [64].
Additionally, we trained models for each response data set separately for each study site. We followed the same predictor selection and parameter tuning workflow. To test the impact of individual predictor sets on model performance, we trained models using only spectral bands, vegetation indices, topography, climate, texture metrics, diversity indices, land-cover fractions, and vegetation height predictors.
The models were validated by independent data (data not used for the model training). We implemented a Leave-One-Out cross validation. During this validation, the model step-wise uses one instance of the dataset for testing and the remaining instances for training. This validation method was used due to limited number of plots [54].
We used the models trained for the whole study area for the prediction. As the plots had a size of 10 m × 10 m, we aggregated the predictors to a spatial resolution of 10 m. We predicted the vertebrate and invertebrate hole density and depth on all eight hillsides and present 32 maps.

3. Results

3.1. Model Performance

The linear mixed effect regression models trained using in situ measured vegetation patterns achieved high accuracy. The best results were obtained for vertebrate hole depth (R2 = 0.84, p < 0.001) and vertebrate hole density (R2 = 0.83, p < 0.001). The models for the invertebrate hole density (R2 = 0.76, p < 0.001) and hole depth (R2 = 0.64, p < 0.001) achieved good performance.
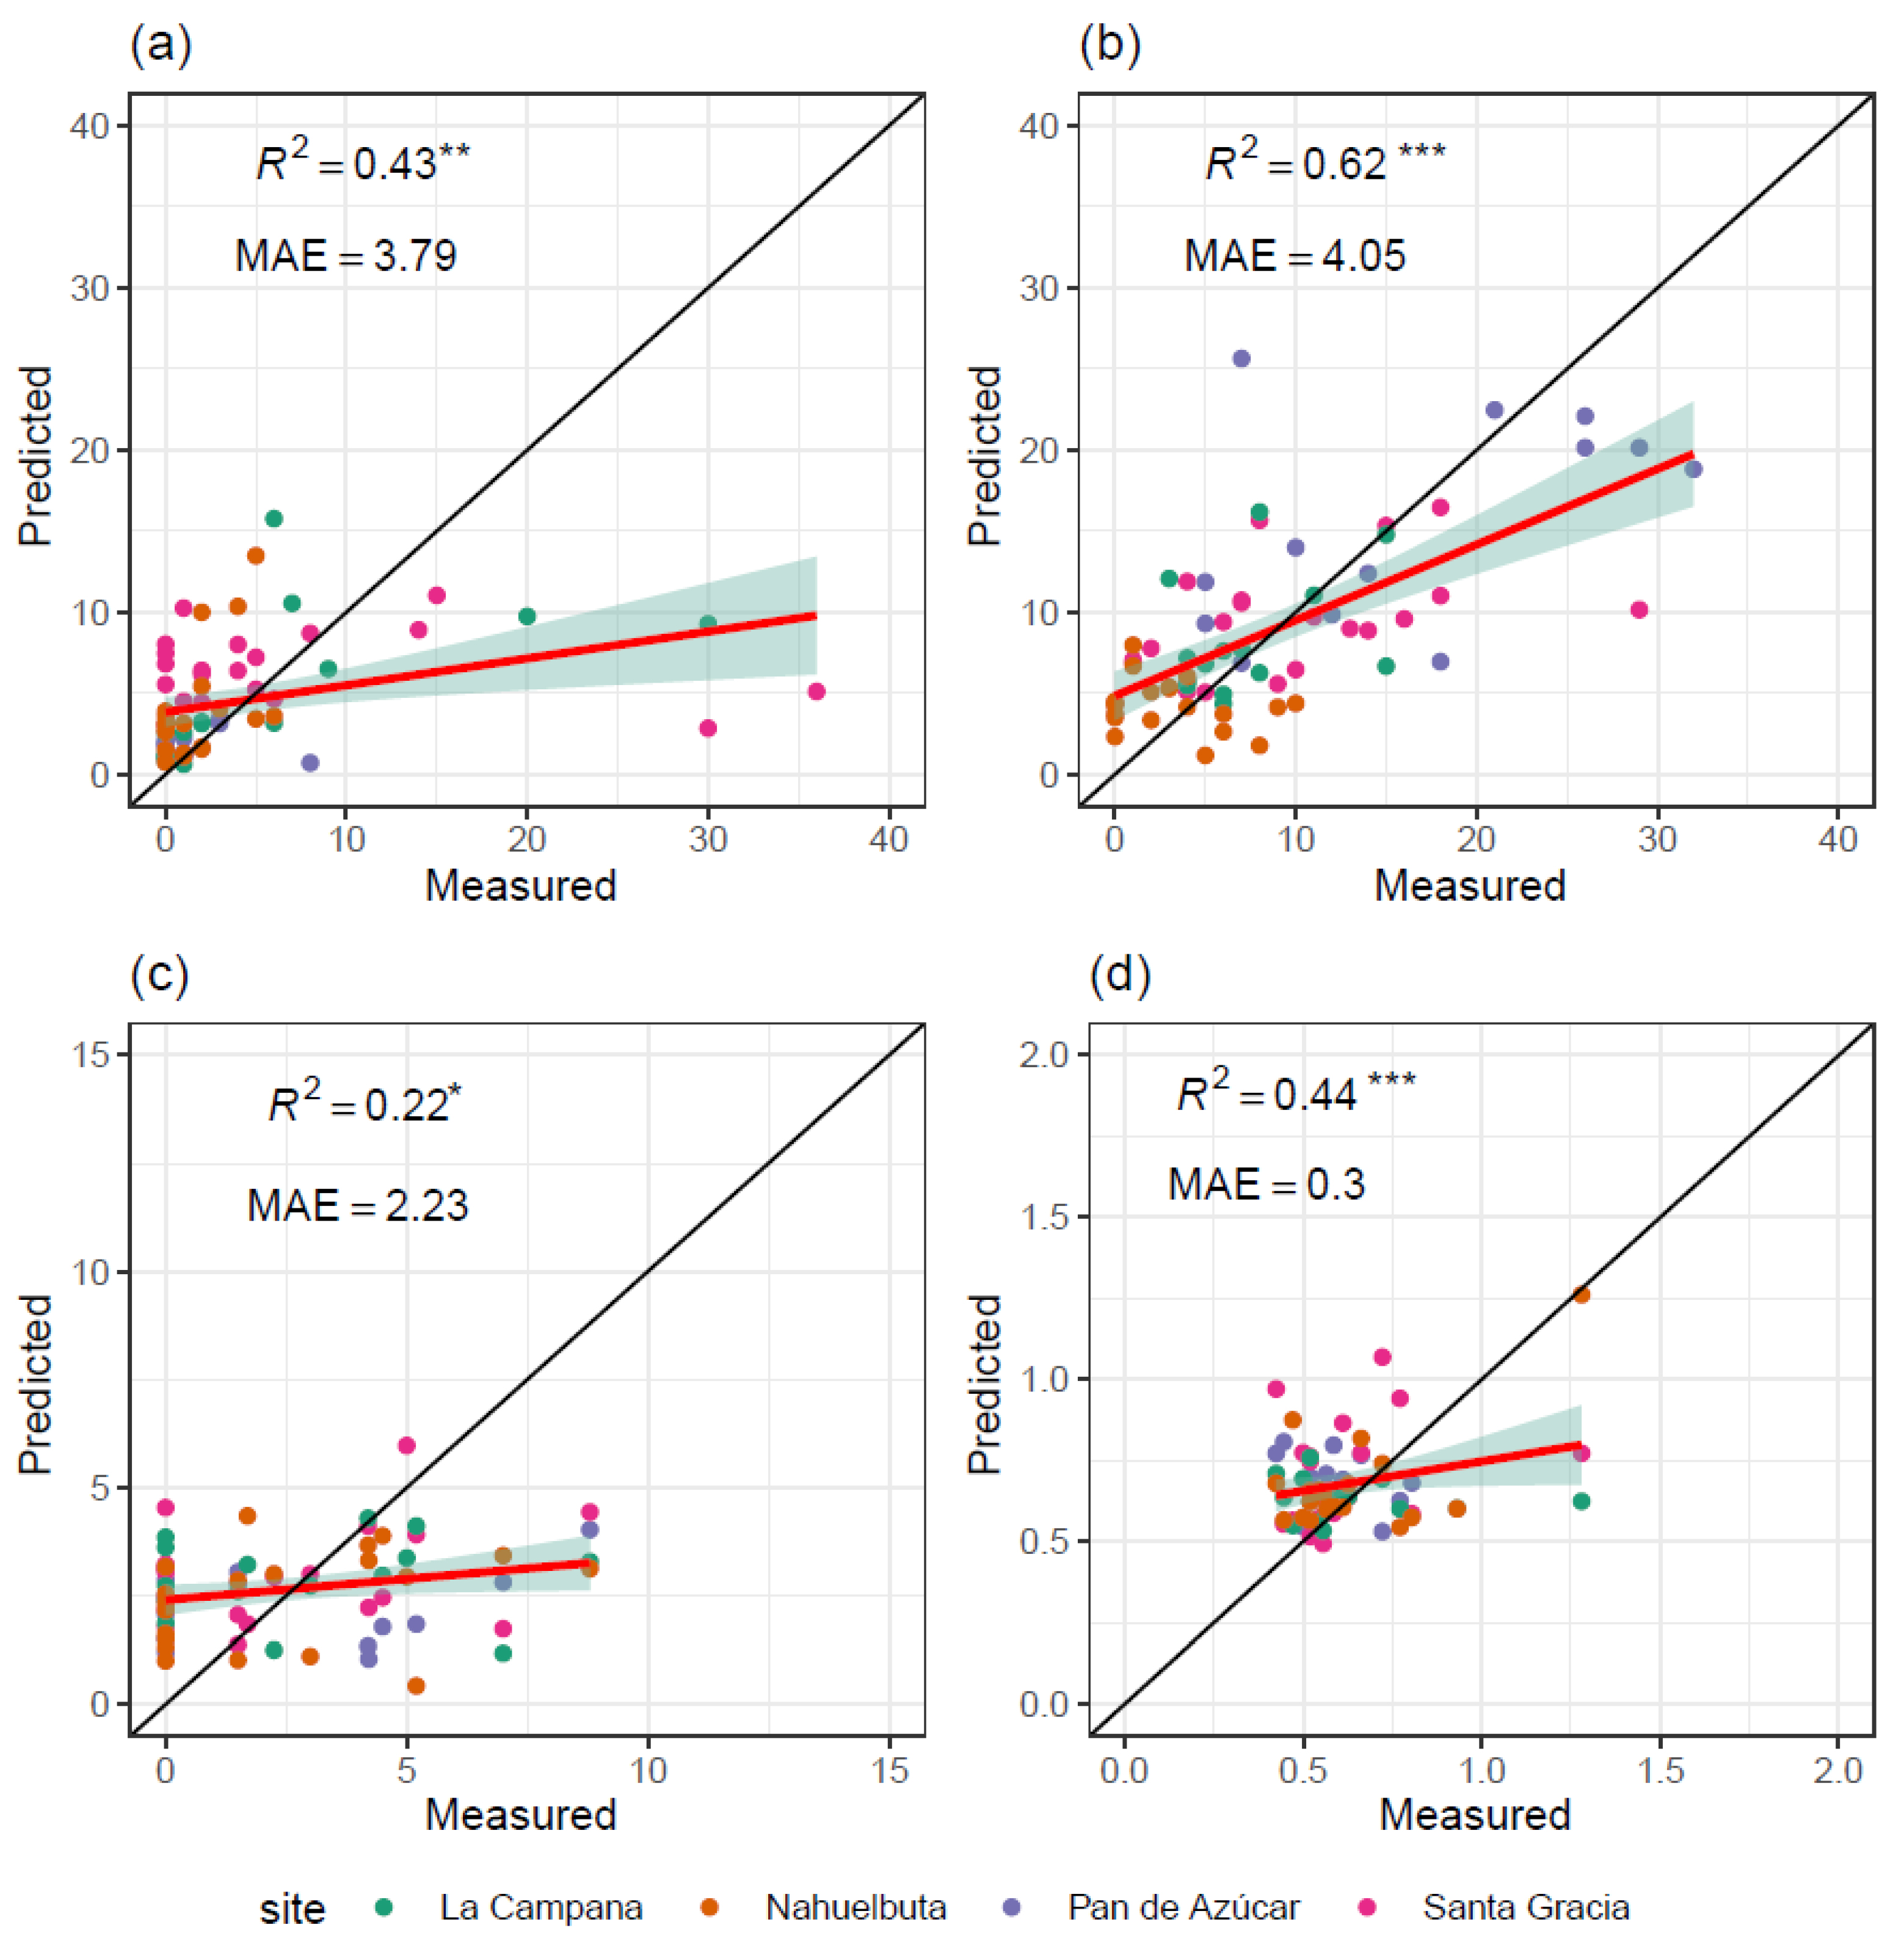
The random forest models trained using vegetation patterns obtained by UAV achieved varying performances. Of the models trained for the whole study area, the highest performance was achieved by the invertebrate hole density prediction model (R2 = 0.62, p < 0.001, MAE = 4.05), followed by the invertebrate hole depth model (R2 = 0.44, p < 0.001, MAE = 0.3). The model for the vertebrate hole density had a similar performance (R2 = 0.43, p < 0.01, MAE = 3.79). The model for the vertebrate hole depth performed worse than the other three models (R2 = 0.22, p < 0.05, MAE = 2.23; Figure 3, Table 2).
The performance of the significant models trained for the study sites varied strongly (from R2 = 0.29 to R2 = 0.75). The best results were obtained in the models trained for PdA, in terms of vertebrate hole density (R2 = 0.75, p < 0.001, MAE = 1.29) and invertebrate hole density (R2 = 0.68, p < 0.001, MAE = 4.5). In SG, none of the models reached an R2 above 0.30; while, in LC, only the model for the vertebrate hole depth reached an R2 exceeding 0.30 (R2 = 0.66, p < 0.001, MAE = 0.81). In NA, all models showed a significant relationship between the predicted and measured data. The highest performance was achieved by the model for the prediction of vertebrate hole density (R2 = 0.46, p < 0.01; Table 2.
The performance of the models trained separately with each of the predictor sets ranged from R2 = 0.05 to R2 = 0.32. For all response variables, the best results were achieved with the following predictor sets: Vegetation height (for the invertebrate hole depth), diversity indices (for the vertebrate hole depth), land-cover fractions (for the invertebrate hole density), and texture metrics (for the vertebrate hole density); see Table S5.
The models underestimate the hole density and depth for plots with higher hole density and deeper holes and overestimate the hole density and depth for the plots with lower hole density and less deep holes.

3.2. Predictor Selection and Importance

The significant predictors describing in situ measured vegetation patterns which were selected during backward feature selection and used in the linear regression models varied between the models (Tables S6–S9). For the hole density, site SG was not selected as significant while for hole depth, all sites were significant. The significant predictors for the vertebrate hole density were vegetation cover, skeleton cover and diameter of shrubs. The significant predictors for the invertebrate hole density were cacti height, cacti abundance and the vegetation cover in PdA. The significant predictors for vertebrate hole depth were vegetation cover and the cover of the single classes as well as heterogeneity. Lastly, the significant predictors for invertebrate hole depth were heterogeneity, shrub height and diameter.
Following predictors calculated from the UAV-data and used in random forest models were selected. Of 76 predictors, 40 were highly correlated with each other and were removed before further analysis. The retained indices were all land-cover fractions, most of the diversity indices, texture metrics, and vegetation height predictors, all spectral bands and topographic indices, one vegetation index, and one climate predictor. The number of selected predictors and their composition varied from 2 to 34 for the different responses (Figure S1, Table 2). The RFE conducted using data from the whole study area retained between 3 and 23 predictors (Table 2). For the individual study sites, the number of chosen predictors varied between 2 and 34.
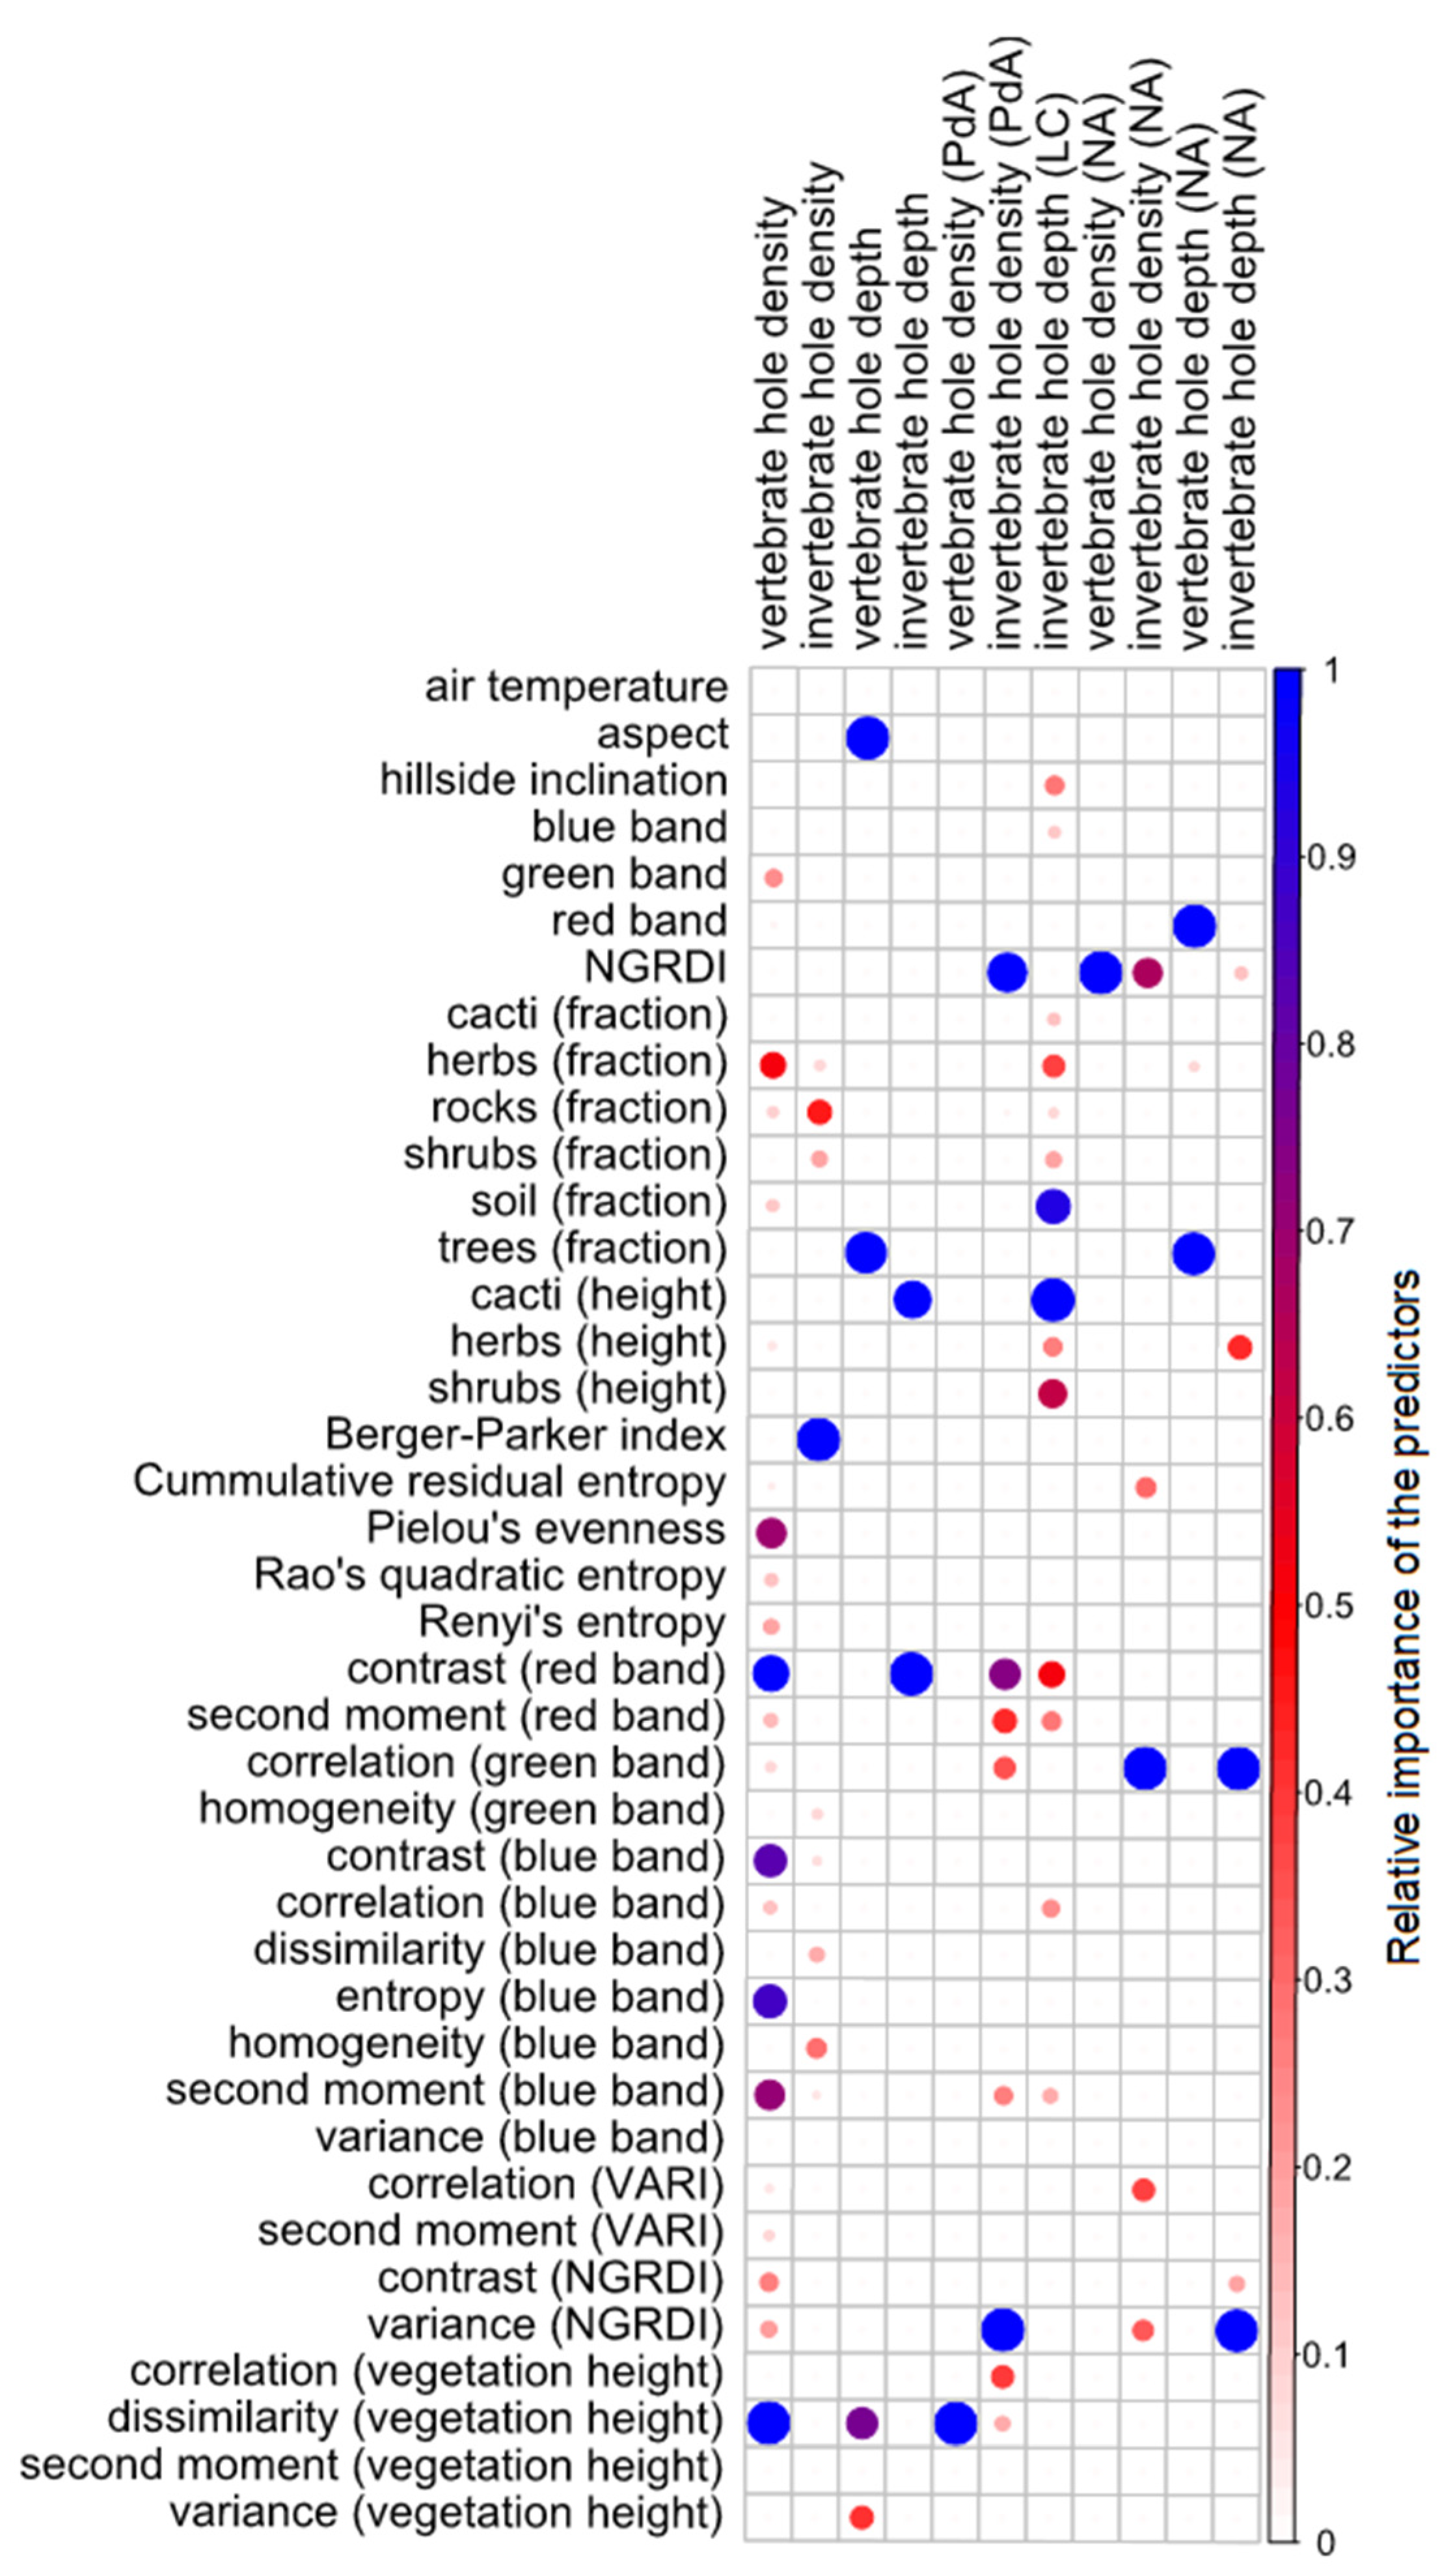
For the vertebrate hole density, the most important predictors were the texture metric dissimilarity calculated from the vegetation height; the texture metrics-based contrast, variance, and second moment calculated from the blue or red band; and several land-cover fractions and diversity indices (Figure 4). For the invertebrate hole density, the Berger–Parker diversity index was the most important, followed by the land-cover fractions rocks, soil, and shrubs (Figure 4). In terms of vertebrate hole depth, the aspect and tree fraction, and the variance and dissimilarity calculated from the vegetation height were important (Figure 4). For the invertebrate hole depth, the contrast texture metrics calculated from the red band and cacti height were the most important (Figure 4).
For the individual study sites, the selected predictors varied. In PdA, the texture metrics calculated from the vegetation height and the NGRDI were the most important for the vertebrate and invertebrate hole density. In LC, for the vertebrate hole depth, the soil and tree fraction and inclination were the most important. In NA, the correlation texture metric calculated from the green band was the most important for the invertebrate hole density and depth.

3.3. Prediction

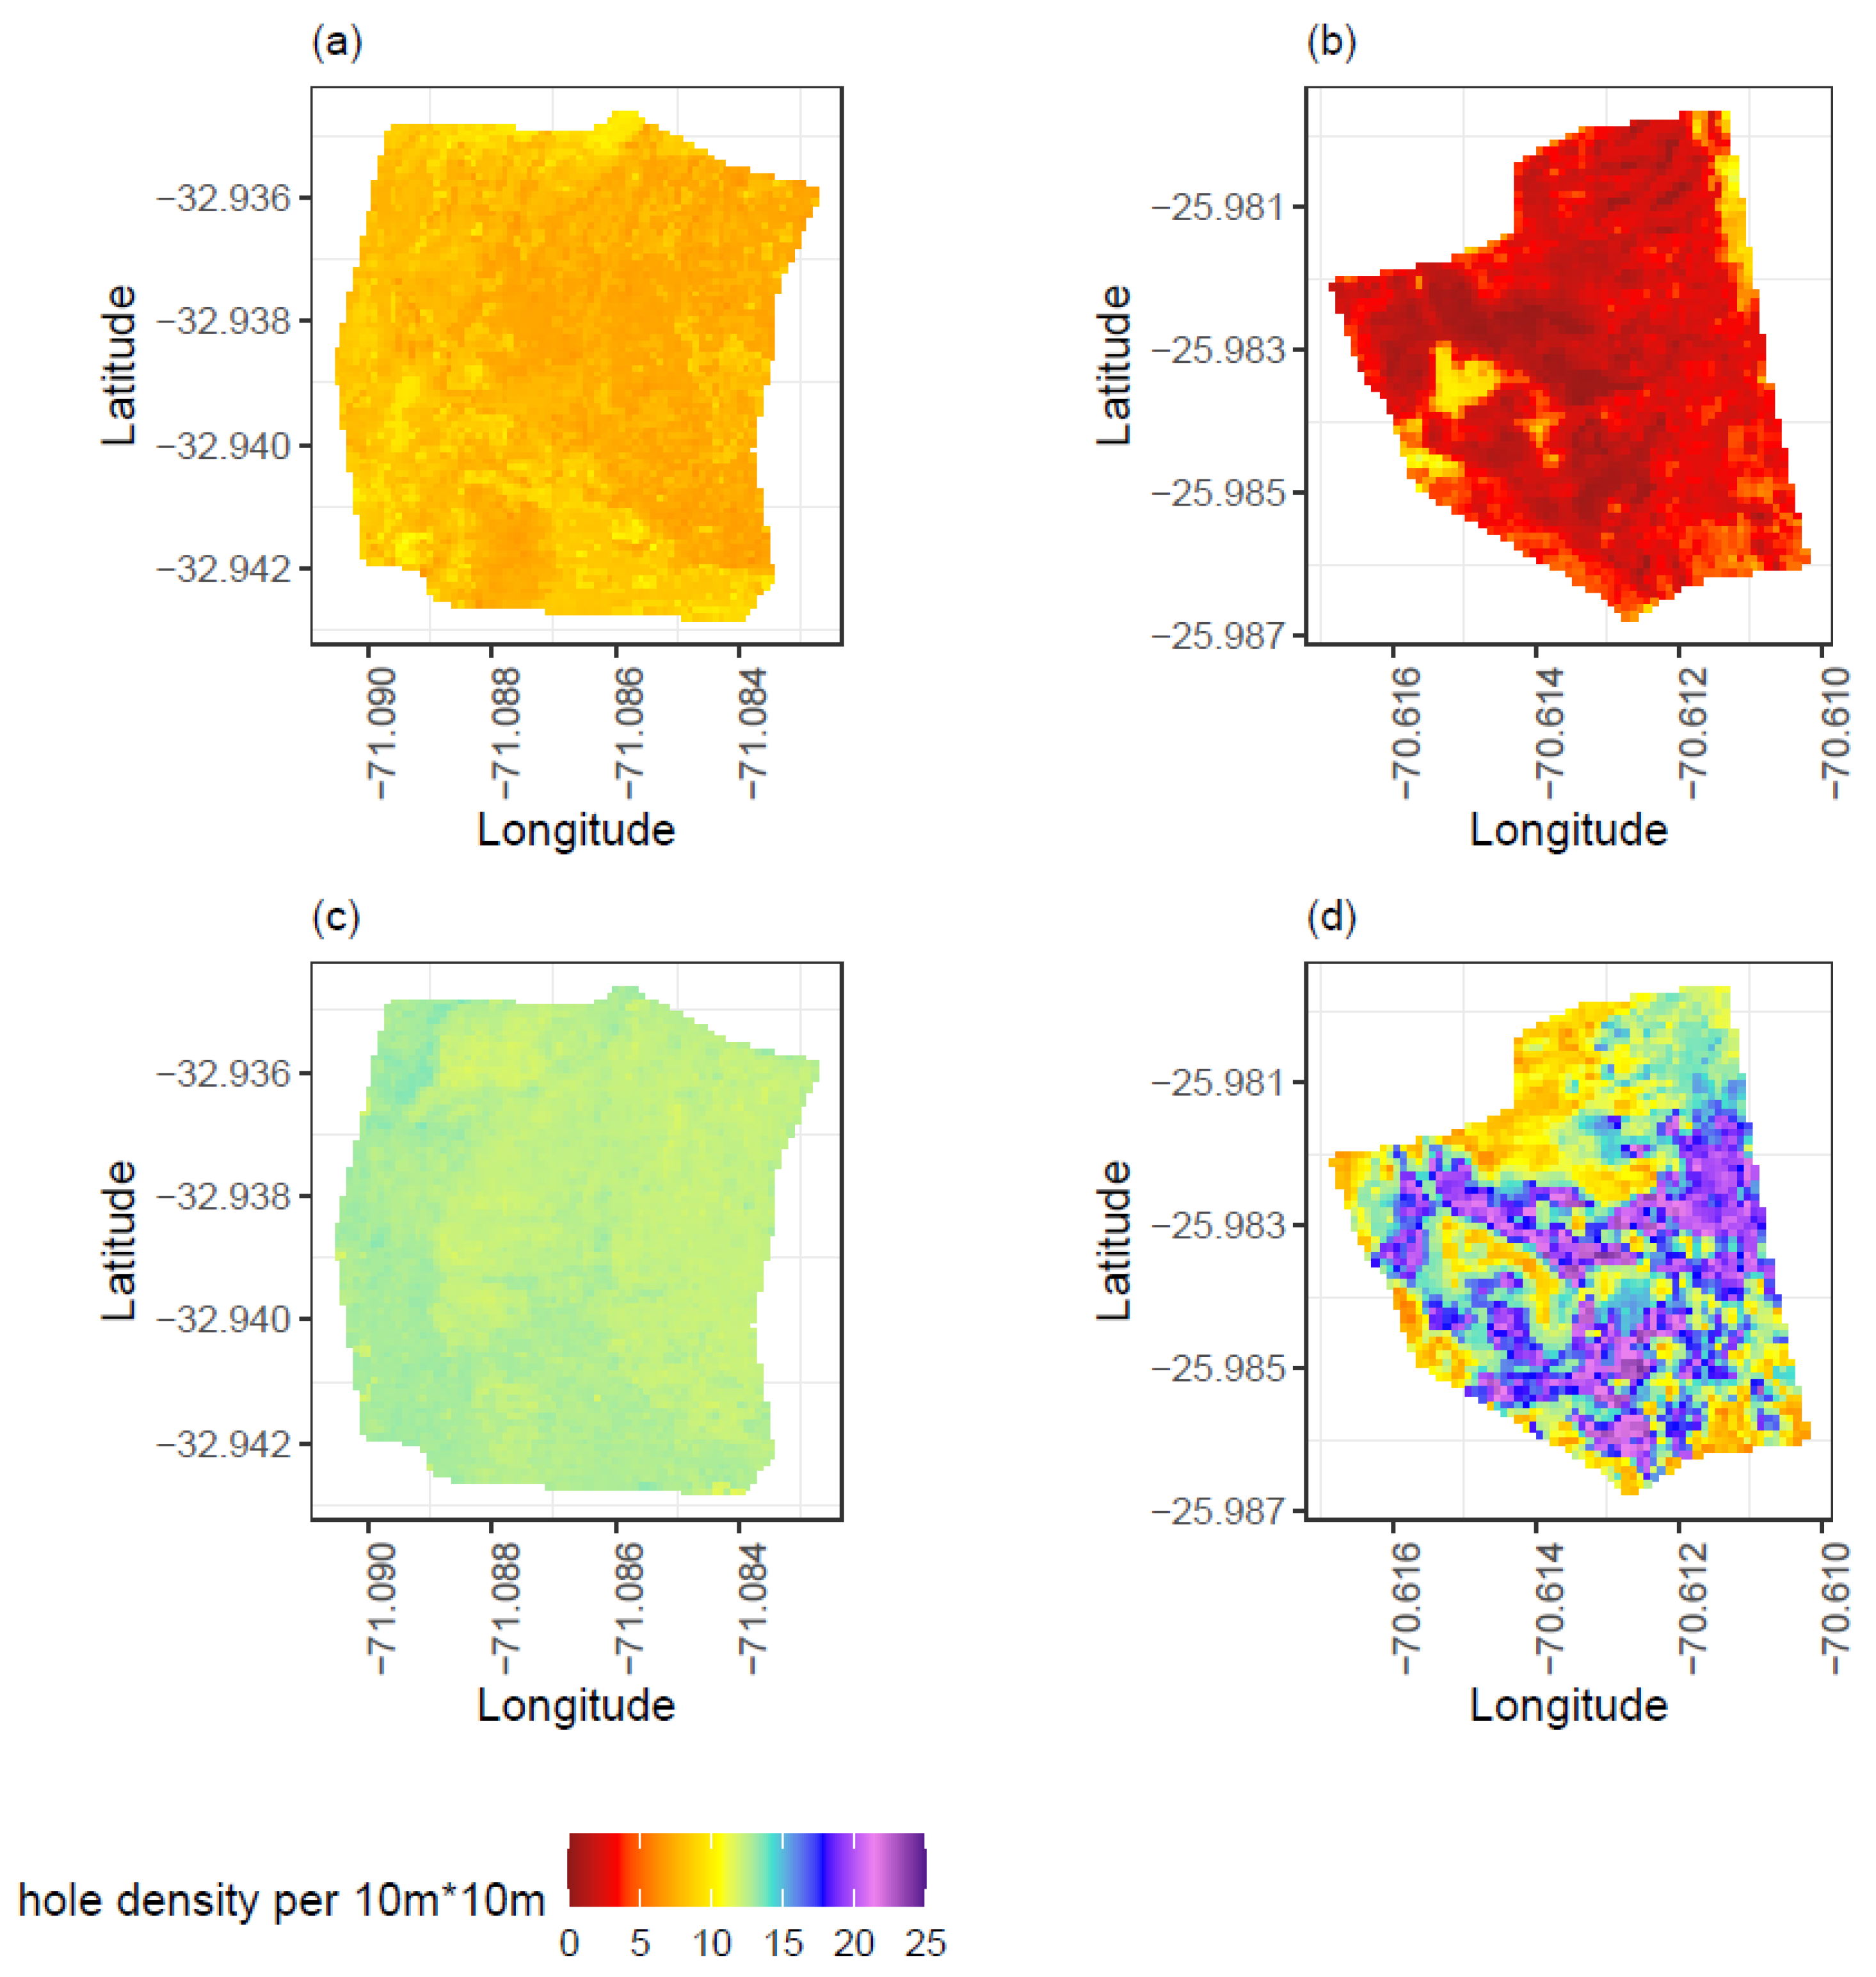
We used the models trained for the whole study area for the prediction. The predicted hole density and depth varied across sites and hillsides (Figure 5, Figures S2–S6). The highest vertebrate hole density was predicted in SG, with an average of 6.1 holes per 10 m × 10 m, followed by LC with 5.3 holes per 10 m × 10 m. The average vertebrate hole density was 3 holes per 10 m × 10 m in PdA and 4.1 holes per 10 m × 10 m in NA. In SG, on average, 1.5 more holes per 10 m × 10 m were predicted on south-facing than north-facing hillsides. In LC, five more holes, on average, were predicted on the north-facing than south-facing hillsides. There was no difference between the hillsides in PdA and NA. The highest invertebrate hole density was predicted in PdA (13 holes per 10 m × 10 m), followed by SG and LC (ca. 10 holes per 10 m × 10 m), and the lowest density was predicted in NA (4.1 holes per 10 m × 10 m). A higher density was predicted on north-facing than south-facing hillsides in PdA and LC (up to five more holes per 10 m × 10 m), while a lower hole density was predicted on north-facing than south-facing hillsides in SG (up to three fewer holes per 10 m × 10 m).
The distribution of holes and their depth was not uniform along the hillsides and depended on vegetation patterns and inclination of the hillside (Figures S3–S6). The dependencies varied between the sites. In general, higher density of vertebrate holes was predicted in areas with lower density of invertebrate holes. The density and depth of the holes increased with decreasing hillside inclination and slope.
More vertebrate holes were predicted within the hillside rills. The vertebrate hole density was rather positively associated with the shrub, herb and cacti cover in all climate zones and negatively with the tree cover in the humid-temperate climate zone. It was positively associated with vegetation height in all climate zones except for the humid-temperate zone. The density of invertebrate holes was higher in areas with less vegetation cover and more skeleton within all sites. It was also negatively associated with vegetation height in all climate zones.
The depth of the holes was positively associated with vegetation cover and vegetation height in the arid and semi-arid zone and negatively in the Mediterranean-type and humid-temperate zone. The depth of all holes in arid and semi-arid climate zone was higher in areas with a higher density of vertebrate holes. Deeper holes were predicted near shrubs and herbs. In the Mediterranean-type and humid-temperate climate zone, the depth of vertebrate holes is higher in areas with higher density of vertebrate holes and vice versa. Deeper vertebrate holes were here predicted near herbs, deeper invertebrate holes near skeleton.

4. Discussion

We analyzed the potential use of UAV data for the area-wide prediction of the density and depth of holes created by vertebrates and invertebrates in several climate zones. The results demonstrated the importance of including texture metrics, land-cover fractions, land-cover diversity indices, and vegetation height in models. Most of our models achieved a good to moderate performance.

4.1. Model Performance

In comparison to models not predicting the density of burrows but only the presence or absence of burrows and mounds [29], the occurrence of burrowing animals [85], or their species richness [86], our models performed lower. This might be due to the burrowing patterns being dependent on the behavior of individual animals. Animal behavior cannot be predicted by strict physical processes, and is not necessarily the same under similar habitat conditions. On the contrary, it depends on a large variety of factors, such as small-scale soil and vegetation conditions, [87], intra-species competition, or even the well-being of every individual [88].
The models trained using plots from all 4 sites (Figure 3) underestimate higher hole density and deeper hole depth. These errors more likely occurred due to response data variability and possible range of predictor values describing environmental parameters. The predictor values described the vegetation patterns per 10 m. This might lead to a lower accuracy especially in the semi-arid and Mediterranean-type climate with homogenous vegetation patterns within the site. The models could not distinguish small-scale changes and aptitudes in hole density and depth in dependence on these parameters and thus the model predicts very similar values for these sites. Another reason might be the data variability. Due to random resampling of the data during the training, the models might capture the changing hole density and depth tendencies between the sites but not the magnitudes within the sites. This explanation is supported by the higher accuracy of models trained separately for the arid and humid-temperate sites, in comparison to models trained for the whole study area and for the semi-arid and Mediterranean-type climate zone (Table 2).
The lower model accuracy can furthermore be caused by error propagation, as the models trained using same predictors estimated in situ achieved higher accuracy. The uncertainties accumulated during the calculation of predictors vegetation cover and vegetation height might cause lower model accuracy. However, the models trained separately for the arid zone PdA, in which the UAVs captured the ground vegetation in comparison to Mediterranean-type and humid-temperate areas where the ground vegetation is covered by tree canopy, did still achieve the highest accuracy.
The models trained for invertebrates outperformed those trained for vertebrates. The reason for this may be due to the differences in habitat preferences between vertebrates and invertebrates. In the case of vertebrates, limitations of remote sensing-based predictors have been attributed to the unpredictability of vertebrate behavior and the number of suitable, yet unoccupied areas [89]. Furthermore, the applicability of remote sensing predictors depends on the vertebrate trophic level, as the distribution of herbivore species is more likely to correlate with various vegetation characteristics, while predator and generalist habitat characteristics are not associated with variables directly measurable by remote sensing [89,90]. In contrast, the distribution of all soil-living invertebrates has been shown to be highly associated with vegetation diversity and soil properties, which directly affect vegetation distribution [18].
The models for predicting hole density outperformed those for hole depth. The worst result was obtained when predicting vertebrate hole depth. For invertebrates, the measured hole depth presumably determines the maximum depth that they have reached, whereas vertebrate burrows are more complex [91]. As we measured only the depth of the hole leading to the burrow, and not the complexity of the underground burrow, this may explain the poorer model performance.
Among the models trained for each of the study sites, the models for the arid PdA and humid-temperate NA performed better than those for LC and SG. In the arid climate zone, a strong link between burrowing and vegetation distribution can be expected, as the habitat choice has been shown to be associated with water and nutrient supply, due to limited resources [47]. No such clear relationship can be applied to semi-arid and Mediterranean-type climate zones, where the distribution of burrowing animals has been found to be both positively [19] and negatively [20,92] associated with vegetation distribution. Thus, it is not surprising that the models for study sites performed better where a clear positive relationship between vegetation distribution and burrowing animals can be expected.

4.2. Predictor Importance

The predictor importance varied between the models. The texture metrics were more important in the models for the whole study area, while land-cover fractions were more important in the models trained for individual sites. Our results indicate that the level of spatial heterogeneity determines the difference in burrowing patterns between sites. At the same time, small-scale differences within sites were dependent on specific vegetation distribution and vegetation types. Previous studies have shown a strong link between biodiversity and spectral heterogeneity [93,94,95,96]. Although we did not predict the biodiversity of burrowing animals, the burrowing patterns were shown to be species-dependent [6].
Predictors selected for the hole density were mostly the texture metrics calculated from the NGRDI and VARI. These indices have been shown to correlate with plant biomass and the vegetation fraction, and were able to detect small-scale patterns of biomass variability [57,59]. Burrowing animals have an impact on the vegetation coverage [97,98,99,100]; however, the specific impacts seem to vary between species, with some species mainly being affecting the distribution of cacti [19], thorn shrubs [16], or herbs [101]. Therefore, it is no surprise that the indices describing variation in vegetation biomass [57,59], and not simple land-cover fractions, were identified as the most important predictors. Our results are furthermore in line with studies using satellite images which have identified indices related to vegetation density as being significant for the prediction of animal abundance [102,103].
The diversity indices and texture metrics calculated from the vegetation height and vegetation indices were especially important predictors for vertebrate hole density and depth. The texture metrics entropy and dissimilarity and the diversity indices Shannon’s and Rao’s quadratic entropy were selected, which are all associated with a heterogeneous landscape [66,69]. Previous studies using heterogeneity and texture metrics in their models have identified them as significant for the prediction of the habitats of burrowing vertebrates [85]. An association between landscape heterogeneity and the distribution of animals has been shown in a number of ecological studies considering the long-term impacts of burrowing animals [76,77]. Burrowing vertebrates, in particular, have been found to create dense vegetation patches due to the concentration of resources near burrows [18,24,25].
For invertebrates, the texture metrics homogeneity and correlation were identified as the most important predictors. In comparison to our results, a previous study [38] found the diversity of invertebrate species to be associated with the texture entropy calculated from the NDVI and ARI. The habitat complexity has also been shown to be positively associated with invertebrate diversity and abundance [104], possibly as the distribution of roots and stems creates suitable microhabitats [105]. Thus, the findings of previous studies support our results.

5. Conclusions

In this study, we demonstrated the potential of using UAV data to predict the density and depth of holes created by burrowing animals. Our models achieved moderate performance. Models trained for the study area outperformed models trained separately for the single study sites, except for the arid climate zone. Models for the invertebrates outperformed models for the vertebrates and models for the hole density outperformed models for the hole depth. The results furthermore show the importance of inclusion of vertical and horizontal landscape structures into the models, as the models mostly relied on the diversity indices, vegetation height and texture metrics calculated from the vegetation height.
The results furthermore showed the dependence of burrowing intensity on vegetation patterns. Vertebrate hole density and depth was rather positively associated with vegetation cover and height (especially of shrubs and herbs) in all except in the humid-temperate climate zone. Invertebrate hole density was negatively associated with the vegetation cover in all climate zones and with vegetation height in the Mediterranean-type climate zone.

Supplementary Materials

The following are available online at https://www.mdpi.com/article/10.3390/drones5030086/s1, Table S1: Mean density and depth of vertebrate and invertebrate holes per site, Table S2: Summary of the collected UAV data sets, Table S3: Hierarchy of classes for the land-cover classification, Table S4: Sensitivity of individual land-cover classes of the land-cover classification models trained for each site separately, Table S5: Performance of models trained with each predictor set separately, Table S6: Significant variables selected by the linear mixed model for the vertebrate hole density, Table S7: Significant variables selected by the linear mixed model for the invertebrate hole density, Table S8: Significant variables selected by the linear mixed model for the vertebrate hole depth, Table S9: Significant variables selected by the linear mixed model for the invertebrate hole depth, Figure S1: Predictor selection by means of recursive feature, Figure S2: Predicted hole density and depth across hillsides, Figure S3: Predicted hole density and depth in PdA, figure S4: Predicted hole density and depth in SG, Figure S5: Predicted hole density and depth in LC, Figure S6: Predicted hole density and depth in NA, Figure S7: Examples of measured holes.

Author Contributions

P.G. conducted the field research and UAV flights, processed and evaluated the data, and wrote the manuscript. S.A., R.F. and A.K. conducted field research and UAV flights. D.K. provided hole density field data. S.A. provided technical support. L.P., P.P. and K.Ü. supported the field research. J.B., A.L., N.F. and R.B. designed and supervised the project and supported the field research. All authors discussed the results and contributed to the final manuscript. All authors have read and agreed to the published version of the manuscript.

Funding

This study was funded by the German Research Foundation, DFG [grant numbers BE1780/52-1, LA3521/1-1, FA 925/12-1, BR 1293-18-1], and is part of the DFG Priority Programme SPP 1803: EarthShape: Earth Surface Shaping by Biota, sub-project “Effects of bioturbation on rates of vertical and horizontal sediment and nutrient fluxes”.

Institutional Review Board Statement

Not applicable.

Informed Consent Statement

Not applicable.

Data Availability Statement

The respective results can be accessed in Grigusova, P. (2021). Predicted density and depth of holes created by burrowing animals across 8 hillsides along Chilean climate gradient [Data set]. Laboratory for Climatology and Remote Sensing (LCRS), University of Marburg. DOI: 10.5678/lcrs/dat.433.

Acknowledgments

We further thank CONAF for the kind support provided during our field campaign.

Conflicts of Interest

There is no conflict of interest.

References

  1. Shipitalo, M.; Le Bayon, R.-C. Quantifying the Effects of Earthworms on Soil Aggregation and Porosity. In Earthworm Ecology; Edwards, C., Ed.; CRC Press: Boca Raton, FL, USA, 2004; pp. 183–200. ISBN 978-0-8493-1819-1. [Google Scholar]
  2. Bowker, M.A.; Eldridge, D.J.; Val, J.; Soliveres, S. Hydrology in a patterned landscape is co-engineered by soil-disturbing animals and biological crusts. Soil Biol. Biochem. 2013, 61, 14–22. [Google Scholar] [CrossRef]
  3. Wilkinson, M.T.; Richards, P.J.; Humphreys, G.S. Breaking ground: Pedological, geological, and ecological implications of soil bioturbation. Earth-Sci. Rev. 2009, 97, 257–272. [Google Scholar] [CrossRef]
  4. Gabet, E.J.; Reichman, O.J.; Seabloom, E.W. The Effects of Bioturbation on Soil Processes and Sediment Transport. Annu. Rev. Earth Planet. Sci. 2003, 31, 249–273. [Google Scholar] [CrossRef]
  5. Nkem, J.N.; Lobry de Bruyn, L.A.; Grant, C.D.; Hulugalle, N.R. The impact of ant bioturbation and foraging activities on surrounding soil properties. Pedobiologia 2000, 44, 609–621. [Google Scholar] [CrossRef]
  6. Platt, B.F.; Kolb, D.J.; Kunhardt, C.G.; Milo, S.P.; New, L.G. Burrowing Through the Literature. Soil Sci. 2016, 181, 175–191. [Google Scholar] [CrossRef]
  7. Zhang, S.; Fang, X.; Zhang, J.; Yin, F.; Zhang, H.; Wu, L.; Kitazawa, D. The Effect of Bioturbation Activity of the Ark Clam Scapharca subcrenata on the Fluxes of Nutrient Exchange at the Sediment-Water Interface. J. Ocean Univ. China 2020, 19, 232–240. [Google Scholar] [CrossRef]
  8. Yu, C.; Zhang, J.; Pang, X.P.; Wang, Q.; Zhou, Y.P.; Guo, Z.G. Soil disturbance and disturbance intensity: Response of soil nutrient concentrations of alpine meadow to plateau pika bioturbation in the Qinghai-Tibetan Plateau, China. Geoderma 2017, 307, 98–106. [Google Scholar] [CrossRef]
  9. Frouz, J.; Pižl, V.; Cienciala, E.; Kalčík, J. Carbon storage in post-mining forest soil, the role of tree biomass and soil bioturbation. Biogeochemistry 2009, 94, 111–121. [Google Scholar] [CrossRef]
  10. Qin, Y.; Yi, S.; Ding, Y.; Qin, Y.; Zhang, W.; Sun, Y.; Hou, X.; Yu, H.; Meng, B.; Zhang, H.; et al. Effects of plateau pikas’ foraging and burrowing activities on vegetation biomass and soil organic carbon of alpine grasslands. Plant Soil 2021, 458, 201–216. [Google Scholar] [CrossRef]
  11. Don, A.; Hagen, C.; Grüneberg, E.; Vos, C. Simulated wild boar bioturbation increases the stability of forest soil carbon. Biogeosciences 2019, 16, 4145–4155. [Google Scholar] [CrossRef] [Green Version]
  12. Wilkinson, M.T.; Humphreys, G.S. Exploring pedogenesis via nuclide-based soil production rates and OSL-based bioturbation rates. Soil Res. 2005, 43, 767. [Google Scholar] [CrossRef]
  13. Cunha, L.; Brown, G.G.; Stanton, D.W.G.; Da Silva, E.; Hansel, F.A.; Jorge, G.; McKey, D.; Vidal-Torrado, P.; Macedo, R.S.; Velasquez, E.; et al. Soil Animals and Pedogenesis. Soil Sci. 2016, 181, 110–125. [Google Scholar] [CrossRef]
  14. Joeckel, R.M.; Tucker, S.T. Exceptionally well preserved latest Miocene (Hemphillian) rodent burrows from Eastern Great Plains, United States, and a review of the burrows of North American rodents. Palaios 2013, 28, 793–824. [Google Scholar] [CrossRef]
  15. Jacob, J. Response of small rodents to manipulations of vegetation height in agro-ecosystems. Integr. Zool. 2008, 3, 3–10. [Google Scholar] [CrossRef]
  16. Turnock, B.Y.; Litt, A.R.; Vore, J.M.; Hammond, C.A.M. Habitat characteristics of the hoary marmot: Assessing distribution limitations in Montana. Ecosphere 2017, 8, e01977. [Google Scholar] [CrossRef]
  17. Tang, Z.; Zhang, Y.; Cong, N.; Wimberly, M.; Wang, L.; Huang, K.; Li, J.; Zu, J.; Zhu, Y.; Chen, N. Spatial pattern of pika holes and their effects on vegetation coverage on the Tibetan Plateau: An analysis using unmanned aerial vehicle imagery. Ecol. Indic. 2019, 107, 105551. [Google Scholar] [CrossRef]
  18. Tajik, S.; Ayoubi, S.; Lorenz, N. Soil microbial communities affected by vegetation, topography and soil properties in a forest ecosystem. Appl. Soil Ecol. 2020, 149, 103514. [Google Scholar] [CrossRef]
  19. Milstead, W.B.; Meserve, P.L.; Campanella, A.; Previtali, M.A.; Kelt, D.A.; Gutiérrez, J.R. Spatial Ecology of Small Mammals in North-central Chile: Role of Precipitation and Refuges. J. Mammal. 2007, 88, 1532–1538. [Google Scholar] [CrossRef]
  20. Meserve, P.L. Trophic Relationships among Small Mammals in a Chilean Semiarid Thorn Scrub Community. J. Mammal. 1981, 62, 304–314. [Google Scholar] [CrossRef]
  21. Tews, J.; Brose, U.; Grimm, V.; Tielbörger, K.; Wichmann, M.C.; Schwager, M.; Jeltsch, F. Animal species diversity driven by habitat heterogeneity/diversity: The importance of keystone structures. J. Biogeogr. 2004, 31, 79–92. [Google Scholar] [CrossRef] [Green Version]
  22. Ferro, L.I.; Barquez, R.M. Species Richness of Nonvolant Small Mammals Along Elevational Gradients in Northwestern Argentina. Biotropica 2009, 41, 759–767. [Google Scholar] [CrossRef]
  23. Simonetti, J.A. Microhabitat Use by Small Mammals in Central Chile. Oikos 1989, 56, 309. [Google Scholar] [CrossRef]
  24. Louw, M.A.; Haussmann, N.S.; Le Roux, P.C. Testing for consistency in the impacts of a burrowing ecosystem engineer on soil and vegetation characteristics across biomes. Sci. Rep. 2019, 9, 19355. [Google Scholar] [CrossRef] [Green Version]
  25. Sandino, J.; Wooler, A.; Gonzalez, F. Towards the Automatic Detection of Pre-Existing Termite Mounds through UAS and Hyperspectral Imagery. Sensors 2017, 17, 2196. [Google Scholar] [CrossRef] [PubMed] [Green Version]
  26. Bycroft, R.; Leon, J.X.; Schoeman, D. Comparing random forests and convoluted neural networks for mapping ghost crab burrows using imagery from an unmanned aerial vehicle. Estuar. Coast. Shelf Sci. 2019, 224, 84–93. [Google Scholar] [CrossRef]
  27. Old, J.M.; Lin, S.H.; Franklin, M.J.M. Mapping out bare-nosed wombat (Vombatus ursinus) burrows with the use of a drone. BMC Ecol. 2019, 19, 39. [Google Scholar] [CrossRef] [Green Version]
  28. Albores-Barajas, Y.V.; Soldatini, C.; Ramos-Rodríguez, A.; Alcala-Santoyo, J.E.; Carmona, R.; Dell’Omo, G. A new use of technology to solve an old problem: Estimating the population size of a burrow nesting seabird. PLoS ONE 2018, 13, e0202094. [Google Scholar] [CrossRef] [Green Version]
  29. Koshkina, A.; Grigoryeva, I.; Tokarsky, V.; Urazaliyev, R.; Kuemmerle, T.; Hölzel, N.; Kamp, J. Marmots from space: Assessing population size and habitat use of a burrowing mammal using publicly available satellite images. Remote Sens. Ecol. Conserv. 2020, 6, 153–167. [Google Scholar] [CrossRef]
  30. Young, M.H.; Andrews, J.H.; Caldwell, T.G.; Saylam, K. Airborne LiDAR and Aerial Imagery to Assess Potential Burrow Locations for the Desert Tortoise (Gopherus agassizii). Remote Sens. 2017, 9, 458. [Google Scholar] [CrossRef] [Green Version]
  31. Borgatti, L.; Forte, E.; Mocnik, A.; Zambrini, R.; Cervi, F.; Martinucci, D.; Pellegrini, F.; Pillon, S.; Prizzon, A.; Zamariolo, A. Detection and characterization of animal burrows within river embankments by means of coupled remote sensing and geophysical techniques: Lessons from River Panaro (northern Italy). Eng. Geol. 2017, 226, 277–289. [Google Scholar] [CrossRef]
  32. Olsoy, P.J.; Shipley, L.A.; Rachlow, J.L.; Forbey, J.S.; Glenn, N.F.; Burgess, M.A.; Thornton, D.H. Unmanned aerial systems measure structural habitat features for wildlife across multiple scales. Methods Ecol. Evol. 2018, 9, 594–604. [Google Scholar] [CrossRef]
  33. Fritz, A.; Li, L.; Storch, I.; Koch, B. UAV-derived habitat predictors contribute strongly to understanding avian species-habitat relationships on the Eastern Qinghai-Tibetan Plateau. Remote Sens. Ecol. Conserv. 2018, 4, 53–65. [Google Scholar] [CrossRef] [Green Version]
  34. Szantoi, Z.; Smith, S.E.; Strona, G.; Koh, L.P.; Wich, S.A. Mapping orangutan habitat and agricultural areas using Landsat OLI imagery augmented with unmanned aircraft system aerial photography. Int. J. Remote Sens. 2017, 38, 2231–2245. [Google Scholar] [CrossRef] [Green Version]
  35. Guo, Z.G.; Zhou, X.R.; Hou, Y. Effect of available burrow densities of plateau pika (Ochotona curzoniae) on soil physicochemical property of the bare land and vegetation land in the Qinghai-Tibetan Plateau. Acta Ecol. Sin. 2012, 32, 104–110. [Google Scholar] [CrossRef]
  36. St-Louis, V.; Pidgeon, A.M.; Radeloff, V.C.; Hawbaker, T.J.; Clayton, M.K. High-resolution image texture as a predictor of bird species richness. Remote Sens. Environ. 2006, 105, 299–312. [Google Scholar] [CrossRef]
  37. Culbert, P.D.; Radeloff, V.C.; St-Louis, V.; Flather, C.H.; Rittenhouse, C.D.; Albright, T.P.; Pidgeon, A.M. Modeling broad-scale patterns of avian species richness across the Midwestern United States with measures of satellite image texture. Remote Sens. Environ. 2012, 118, 140–150. [Google Scholar] [CrossRef] [Green Version]
  38. Wallis, C.I.B.; Brehm, G.; Donoso, D.A.; Fiedler, K.; Homeier, J.; Paulsch, D.; Süßenbach, D.; Tiede, Y.; Brandl, R.; Farwig, N.; et al. Remote sensing improves prediction of tropical montane species diversity but performance differs among taxa. Ecol. Indic. 2017, 83, 538–549. [Google Scholar] [CrossRef]
  39. Gholizadeh, A.; Žižala, D.; Saberioon, M.; Borůvka, L. Soil organic carbon and texture retrieving and mapping using proximal, airborne and Sentinel-2 spectral imaging. Remote Sens. Environ. 2018, 218, 89–103. [Google Scholar] [CrossRef]
  40. Bourgoin, C.; Betbeder, J.; Couteron, P.; Blanc, L.; Dessard, H.; Oszwald, J.; Le Roux, R.; Cornu, G.; Reymondin, L.; Mazzei, L.; et al. UAV-based canopy textures assess changes in forest structure from long-term degradation. Ecol. Indic. 2020, 115, 106386. [Google Scholar] [CrossRef] [Green Version]
  41. Fu, Y.; Yang, G.; Song, X.; Li, Z.; Xu, X.; Feng, H.; Zhao, C. Improved Estimation of Winter Wheat Aboveground Biomass Using Multiscale Textures Extracted from UAV-Based Digital Images and Hyperspectral Feature Analysis. Remote Sens. 2021, 13, 581. [Google Scholar] [CrossRef]
  42. Lehnert, L.W.; Thies, B.; Trachte, K.; Achilles, S.; Osses, P.; Baumann, K.; Bendix, J.; Schmidt, J.; Samolov, E.; Jung, P.; et al. A Case Study on Fog/Low Stratus Occurrence at Las Lomitas, Atacama Desert (Chile) as a Water Source for Biological Soil Crusts. Aerosol Air Qual. Res. 2018, 18, 254–269. [Google Scholar] [CrossRef]
  43. Bernhard, N.; Moskwa, L.-M.; Schmidt, K.; Oeser, R.A.; Aburto, F.; Bader, M.Y.; Baumann, K.; von Blanckenburg, F.; Boy, J.; van den Brink, L.; et al. Pedogenic and microbial interrelations to regional climate and local topography: New insights from a climate gradient (arid to humid) along the Coastal Cordillera of Chile. Catena 2018, 170, 335–355. [Google Scholar] [CrossRef]
  44. Oeser, R.A.; Stroncik, N.; Moskwa, L.-M.; Bernhard, N.; Schaller, M.; Canessa, R.; van den Brink, L.; Köster, M.; Brucker, E.; Stock, S.; et al. Chemistry and microbiology of the Critical Zone along a steep climate and vegetation gradient in the Chilean Coastal Cordillera. Catena 2018, 170, 183–203. [Google Scholar] [CrossRef] [Green Version]
  45. Übernickel, K.; Pizarro-Araya, J.; Bhagavathula, S.; Paulino, L.; Ehlers, T.A. Reviews and Syntheses: Composition and Characteristics of Burrowing Animals along a Climate and Ecological Gradient, Chile. Preprints 2021. [Google Scholar] [CrossRef]
  46. Jimenez, J.E.; Feinsinger, P.; Jaksi, F.M. Spatiotemporal Patterns of an Irruption and Decline of Small Mammals in Northcentral Chile. J. Mammal. 1992, 73, 356–364. [Google Scholar] [CrossRef] [Green Version]
  47. Cerqueira, R. The Distribution of Didelphis in South America (Polyprotodontia, Didelphidae). J. Biogeogr. 1985, 12, 135. [Google Scholar] [CrossRef]
  48. Muñoz-Pedreros, A.; Yáñez, J.; Norambuena, H.V.; Zúñiga, A. Diet, dietary selectivity and density of South American grey fox, Lycalopex griseus, in Central Chile. Integr. Zool. 2018, 13, 46–57. [Google Scholar] [CrossRef]
  49. Pizarro-Araya, J.; Jerez, V. Distribución geográfica del género Gyriosomus Guérin-Méneville, 1834 (Coleoptera: Tenebrionidae): Una aproximación biogeográfica. Rev. Chil. Hist. Nat. 2004, 77, 491–500. [Google Scholar] [CrossRef]
  50. Medel, R.G.; Vásquez, R.A. Comparative analysis of harvester ant assemblages of Argentinian and Chilean arid zones. J. Arid Environ. 1994, 26, 363–371. [Google Scholar] [CrossRef]
  51. Vergara, O.E.; Jerez, V.; Parra, L.E. Diversidad y patrones de distribución de coleópteros en la Región del Biobío, Chile: Una aproximación preliminar para la conservación de la diversidad. Rev. Chil. Hist. Nat. 2006, 79, 369–388. [Google Scholar] [CrossRef]
  52. Übernickel, K.; Ehlers, T.A.; Ershadi, M.R.; Paulino, L.; Fuentes Espoz, J.-P.; Maldonado, A.; Oses-Pedraza, R.; von Blanckenburg, F. Time Series of Meteorological Station Data in the EarthShape Study Areas of in the Coastal Cordillera, Chile; GFZ: Postdam, Germany, 2020. [Google Scholar]
  53. Bates, D.; Mächler, M.; Bolker, B.; Walker, S. Fitting Linear Mixed-Effects Models Using lme4. J. Stat. Soft. 2015, 67. [Google Scholar] [CrossRef]
  54. Sammut, C.; Webb, G.I. (Eds.) Encyclopedia of Machine Learning; Springer: Boston, MA, USA, 2010; ISBN 978-0-387-30768-8. [Google Scholar]
  55. Gandor, F.; Rehak, M.; Skaloud, J. Photogrammetric mission planner for rpas. Int. Arch. Photogramm. Remote Sens. Spat. Inf. Sci. 2015, XL-1/W4, 61–65. [Google Scholar] [CrossRef] [Green Version]
  56. Horn, B.K.P. Hill shading and the reflectance map. Proc. IEEE 1981, 69, 14–47. [Google Scholar] [CrossRef] [Green Version]
  57. Bendig, J.; Yu, K.; Aasen, H.; Bolten, A.; Bennertz, S.; Broscheit, J.; Gnyp, M.L.; Bareth, G. Combining UAV-based plant height from crop surface models, visible, and near infrared vegetation indices for biomass monitoring in barley. Int. J. Appl. Earth Obs. Geoinf. 2015, 39, 79–87. [Google Scholar] [CrossRef]
  58. Canham, C.D. An Index for Understory Light Levels in and Around Canopy Gaps. Ecology 1988, 69, 1634–1638. [Google Scholar] [CrossRef]
  59. Gitelson, A.A.; Kaufman, Y.J.; Stark, R.; Rundquist, D. Novel algorithms for remote estimation of vegetation fraction. Remote Sens. Environ. 2002, 80, 76–87. [Google Scholar] [CrossRef] [Green Version]
  60. Tucker, C.J. Red and photographic infrared linear combinations for monitoring vegetation. Remote Sens. Environ. 1979, 8, 127–150. [Google Scholar] [CrossRef] [Green Version]
  61. Rahimzadeh-Bajgiran, P.; Omasa, K.; Shimizu, Y. Comparative evaluation of the Vegetation Dryness Index (VDI), the Temperature Vegetation Dryness Index (TVDI) and the improved TVDI (iTVDI) for water stress detection in semi-arid regions of Iran. ISPRS J. Photogramm. Remote Sens. 2012, 68, 1–12. [Google Scholar] [CrossRef]
  62. Woebbecke, D.M.; Meyer, G.E.; Bargen, K.V.; Mortensen, D.A. Color Indices for Weed Identification under Various Soil, Residue, and Lighting Conditions. Trans. ASAE 1995, 38, 259–269. [Google Scholar] [CrossRef]
  63. Gillespie, A.R.; Kahle, A.B.; Walker, R.E. Color enhancement of highly correlated images. II. Channel ratio and “chromaticity” transformation techniques. Remote Sens. Environ. 1987, 22, 343–365. [Google Scholar] [CrossRef]
  64. Haralick, R.M.; Shanmugam, K.; Dinstein, I.H. Textural Features for Image Classification. IEEE Trans. Syst. Man Cybern. 1973, SMC-3, 610–621. [Google Scholar] [CrossRef] [Green Version]
  65. Rocchini, D.; Thouverai, E.; Marcantonio, M.; Iannacito, M.; Da Re, D.; Torresani, M.; Bacaro, G.; Bazzichetto, M.; Bernardi, A.; Foody, G.M.; et al. Rasterdiv—An Information Theory tailored R package for measuring ecosystem heterogeneity from space: To the origin and back. Methods Ecol. Evol. 2021, 12, 1093–1102. [Google Scholar] [CrossRef]
  66. Shannon, C.E. A Mathematical Theory of Communication. Bell Syst. Tech. J. 1948, 27, 379–423. [Google Scholar] [CrossRef] [Green Version]
  67. Pielou, E.C. The measurement of diversity in different types of biological collections. J. Theor. Biol. 1966, 13, 131–144. [Google Scholar] [CrossRef]
  68. Berger, W.H.; Parker, F.L. Diversity of planktonic foraminifera in deep-sea sediments. Science 1970, 168, 1345–1347. [Google Scholar] [CrossRef] [PubMed]
  69. Rao, C.R. Diversity and dissimilarity coefficients: A unified approach. Theor. Popul. Biol. 1982, 21, 24–43. [Google Scholar] [CrossRef]
  70. Rao, M.; Chen, Y.; Vemuri, B.C.; Wang, F. Cumulative Residual Entropy: A New Measure of Information. IEEE Trans. Inform. Theory 2004, 50, 1220–1228. [Google Scholar] [CrossRef]
  71. Hill, M.O. Diversity and Evenness: A Unifying Notation and Its Consequences. Ecology 1973, 54, 427–432. [Google Scholar] [CrossRef] [Green Version]
  72. Kuhn, M. Building Predictive Models in R Using the caret Package. J. Stat. Soft. 2008, 28, 1–26. [Google Scholar] [CrossRef] [Green Version]
  73. Breiman, L. Random Forests. Mach. Learn. 2001, 45, 5–32. [Google Scholar] [CrossRef] [Green Version]
  74. Nychka, D. Fields: Tools for Spatial Data; UCAR/NCAR—Computational and Information Systems Laboratory (CISL): Boulder, CO, USA, 2016. [Google Scholar]
  75. Hijmans, R.J.; van Etten, J.; Sumner, M.; Cheng, J.; Baston, D.; Bevan, A.; Bivand, R.; Busetto, L.; Canty, M.; Fasoli, B.; et al. Raster: Geographic Data Analysis and Modeling. Available online: https://rspatial.org/raster (accessed on 19 August 2021).
  76. Ballová, Z.; Pekárik, L.; Píš, V.; Šibík, J. How much do ecosystem engineers contribute to landscape evolution? A case study on Tatra marmots. Catena 2019, 182, 104121. [Google Scholar] [CrossRef]
  77. Valkó, O.; Tölgyesi, C.; Kelemen, A.; Bátori, Z.; Gallé, R.; Rádai, Z.; Bragina, T.M.; Bragin, Y.A.; Deák, B. Steppe Marmot (Marmota bobak) as ecosystem engineer in arid steppes. J. Arid Environ. 2021, 184, 104244. [Google Scholar] [CrossRef]
  78. Zvoleff, A. Package ‘glcm’. Calculate Textures from Grey-Level Co-Occurence Matrices (GLCMs). Available online: https://CRAN.R-project.org/package=glcm (accessed on 19 August 2021).
  79. Tuanmu, M.-N.; Jetz, W. A global, remote sensing-based characterization of terrestrial habitat heterogeneity for biodiversity and ecosystem modelling. Glob. Ecol. Biogeogr. 2015, 24, 1329–1339. [Google Scholar] [CrossRef]
  80. Regolin, A.L.; Ribeiro, M.C.; Martello, F.; Melo, G.L.; Sponchiado, J.; Campanha, L.F.d.C.; Sugai, L.S.M.; Silva, T.S.F.; Cáceres, N.C. Spatial heterogeneity and habitat configuration overcome habitat composition influences on alpha and beta mammal diversity. Biotropica 2020, 52, 969–980. [Google Scholar] [CrossRef]
  81. Wood, E.M.; Pidgeon, A.M.; Radeloff, V.C.; Keuler, N.S. Image texture as a remotely sensed measure of vegetation structure. Remote Sens. Environ. 2012, 121, 516–526. [Google Scholar] [CrossRef]
  82. Hall-Beyer, M. Practical guidelines for choosing GLCM textures to use in landscape classification tasks over a range of moderate spatial scales. Int. J. Remote Sens. 2017, 38, 1312–1338. [Google Scholar] [CrossRef]
  83. Rényi, A. On Measures of Entropy and Information. Berkeley Symp. Math. Stat. Probab. 1961, 1, 547–561. [Google Scholar]
  84. Parsons, M.A.; Barkley, T.C.; Rachlow, J.L.; Johnson-Maynard, J.L.; Johnson, T.R.; Milling, C.R.; Hammel, J.E.; Leslie, I. Cumulative effects of an herbivorous ecosystem engineer in a heterogeneous landscape. Ecosphere 2016, 7, 388. [Google Scholar] [CrossRef] [Green Version]
  85. Valerio, F.; Ferreira, E.; Godinho, S.; Pita, R.; Mira, A.; Fernandes, N.; Santos, S.M. Predicting Microhabitat Suitability for an Endangered Small Mammal Using Sentinel-2 Data. Remote Sens. 2020, 12, 562. [Google Scholar] [CrossRef] [Green Version]
  86. Wallis, C.I.B.; Paulsch, D.; Zeilinger, J.; Silva, B.; Curatola Fernández, G.F.; Brandl, R.; Farwig, N.; Bendix, J. Contrasting performance of Lidar and optical texture models in predicting avian diversity in a tropical mountain forest. Remote Sens. Environ. 2016, 174, 223–232. [Google Scholar] [CrossRef]
  87. Deacon, R.M.J. Assessing nest building in mice. Nat. Protoc. 2006, 1, 1117–1119. [Google Scholar] [CrossRef] [PubMed]
  88. Jirkof, P. Burrowing and nest building behavior as indicators of well-being in mice. J. Neurosci. Methods 2014, 234, 139–146. [Google Scholar] [CrossRef] [Green Version]
  89. Leyequien, E.; Verrelst, J.; Slot, M.; Schaepman-Strub, G.; Heitkönig, I.M.A.; Skidmore, A. Capturing the fugitive: Applying remote sensing to terrestrial animal distribution and diversity. Int. J. Appl. Earth Obs. Geoinf. 2007, 9, 1–20. [Google Scholar] [CrossRef]
  90. Cowley, M.J.R.; Wilson, R.J.; Leon-Cortes, J.L.; Gutierrez, D.; Bulman, C.R.; Thomas, C.D. Habitat-based statistical models for predicting the spatial distribution of butterflies and day-flying moths in a fragmented landscape. J. Appl. Ecol. 2000, 37, 60–72. [Google Scholar] [CrossRef]
  91. Mukherjee, A.; Pilakandy, R.; Kumara, H.N.; Manchi, S.S.; Bhupathy, S. Burrow characteristics and its importance in occupancy of burrow dwelling vertebrates in Semiarid area of Keoladeo National Park, Rajasthan, India. J. Arid Environ. 2017, 141, 7–15. [Google Scholar] [CrossRef]
  92. Cramer, M.J.; Willig, M.R. Habitat heterogeneity, species diversity and null models. Oikos 2005, 108, 209–218. [Google Scholar] [CrossRef]
  93. Rocchini, D.; Chiarucci, A.; Loiselle, S.A. Testing the spectral variation hypothesis by using satellite multispectral images. Acta Oecologica 2004, 26, 117–120. [Google Scholar] [CrossRef]
  94. Rocchini, D.; Balkenhol, N.; Carter, G.A.; Foody, G.M.; Gillespie, T.W.; He, K.S.; Kark, S.; Levin, N.; Lucas, K.; Luoto, M.; et al. Remotely sensed spectral heterogeneity as a proxy of species diversity: Recent advances and open challenges. Ecol. Inform. 2010, 5, 318–329. [Google Scholar] [CrossRef]
  95. Rocchini, D.; Bacaro, G.; Chirici, G.; Da Re, D.; Feilhauer, H.; Foody, G.M.; Galluzzi, M.; Garzon-Lopez, C.X.; Gillespie, T.W.; He, K.S.; et al. Remotely sensed spatial heterogeneity as an exploratory tool for taxonomic and functional diversity study. Ecol. Indic. 2018, 85, 983–990. [Google Scholar] [CrossRef] [Green Version]
  96. Oldeland, J.; Wesuls, D.; Rocchini, D.; Schmidt, M.; Jürgens, N. Does using species abundance data improve estimates of species diversity from remotely sensed spectral heterogeneity? Ecol. Indic. 2010, 10, 390–396. [Google Scholar] [CrossRef]
  97. Davidson, A.D.; Lightfoot, D.C. Interactive effects of keystone rodents on the structure of desert grassland arthropod communities. Ecography 2007, 30, 515–525. [Google Scholar] [CrossRef]
  98. Pang, X.P.; Yang, H.; Wei, X.X.; Guo, Z.G. Effect of plateau pika (Ochotona curzoniae) bioturbation on soil C-N-P stoichiometry in alpine meadows. Geoderma 2021, 397, 115098. [Google Scholar] [CrossRef]
  99. Zhang, L.-J.; Qi, Y.-A.; Buatois, L.A.; Mángano, M.G.; Meng, Y.; Li, D. The impact of deep-tier burrow systems in sediment mixing and ecosystem engineering in early Cambrian carbonate settings. Sci. Rep. 2017, 7, 45773. [Google Scholar] [CrossRef] [PubMed]
  100. Zhao, J.; Tian, L.; Wei, H.; Zhang, T.; Bai, Y.; Li, R.; Tang, Y. Impact of plateau pika (Ochotona curzoniae) burrowing-induced microtopography on ecosystem respiration of the alpine meadow and steppe on the Tibetan plateau. Plant Soil 2021, 458, 217–230. [Google Scholar] [CrossRef]
  101. Contreras, L.C.; Gutiérrez, J.R. Effects of the subterranean herbivorous rodent Spalacopus cyanus on herbaceous vegetation in arid coastal Chile. Oecologia 1991, 87, 106–109. [Google Scholar] [CrossRef] [PubMed]
  102. Chidodo, D.J.; Kimaro, D.N.; Hieronimo, P.; Makundi, R.H.; Isabirye, M.; Leirs, H.; Massawe, A.W.; Mdangi, M.E.; Kifumba, D.; Mulungu, L.S. Application of normalized difference vegetation index (NDVI) to forecast rodent population abundance in smallholder agro-ecosystems in semi-arid areas in Tanzania. Mammalia 2020, 84, 136–143. [Google Scholar] [CrossRef]
  103. Andreo, V.; Belgiu, M.; Hoyos, D.B.; Osei, F.; Provensal, C.; Stein, A. Rodents and satellites: Predicting mice abundance and distribution with Sentinel-2 data. Ecol. Inform. 2019, 51, 157–167. [Google Scholar] [CrossRef]
  104. Mormul, R.P.; Thomaz, S.M.; Takeda, A.M.; Behrend, R.D. Structural Complexity and Distance from Source Habitat Determine Invertebrate Abundance and Diversity. Biotropica 2011, 43, 738–745. [Google Scholar] [CrossRef]
  105. Thomaz, S.M.; Dibble, E.D.; Evangelista, L.R.; Higuti, J.; Bini, L.M. Influence of aquatic macrophyte habitat complexity on invertebrate abundance and richness in tropical lagoons. Freshw. Biol. 2007, 53, 358–367. [Google Scholar] [CrossRef]
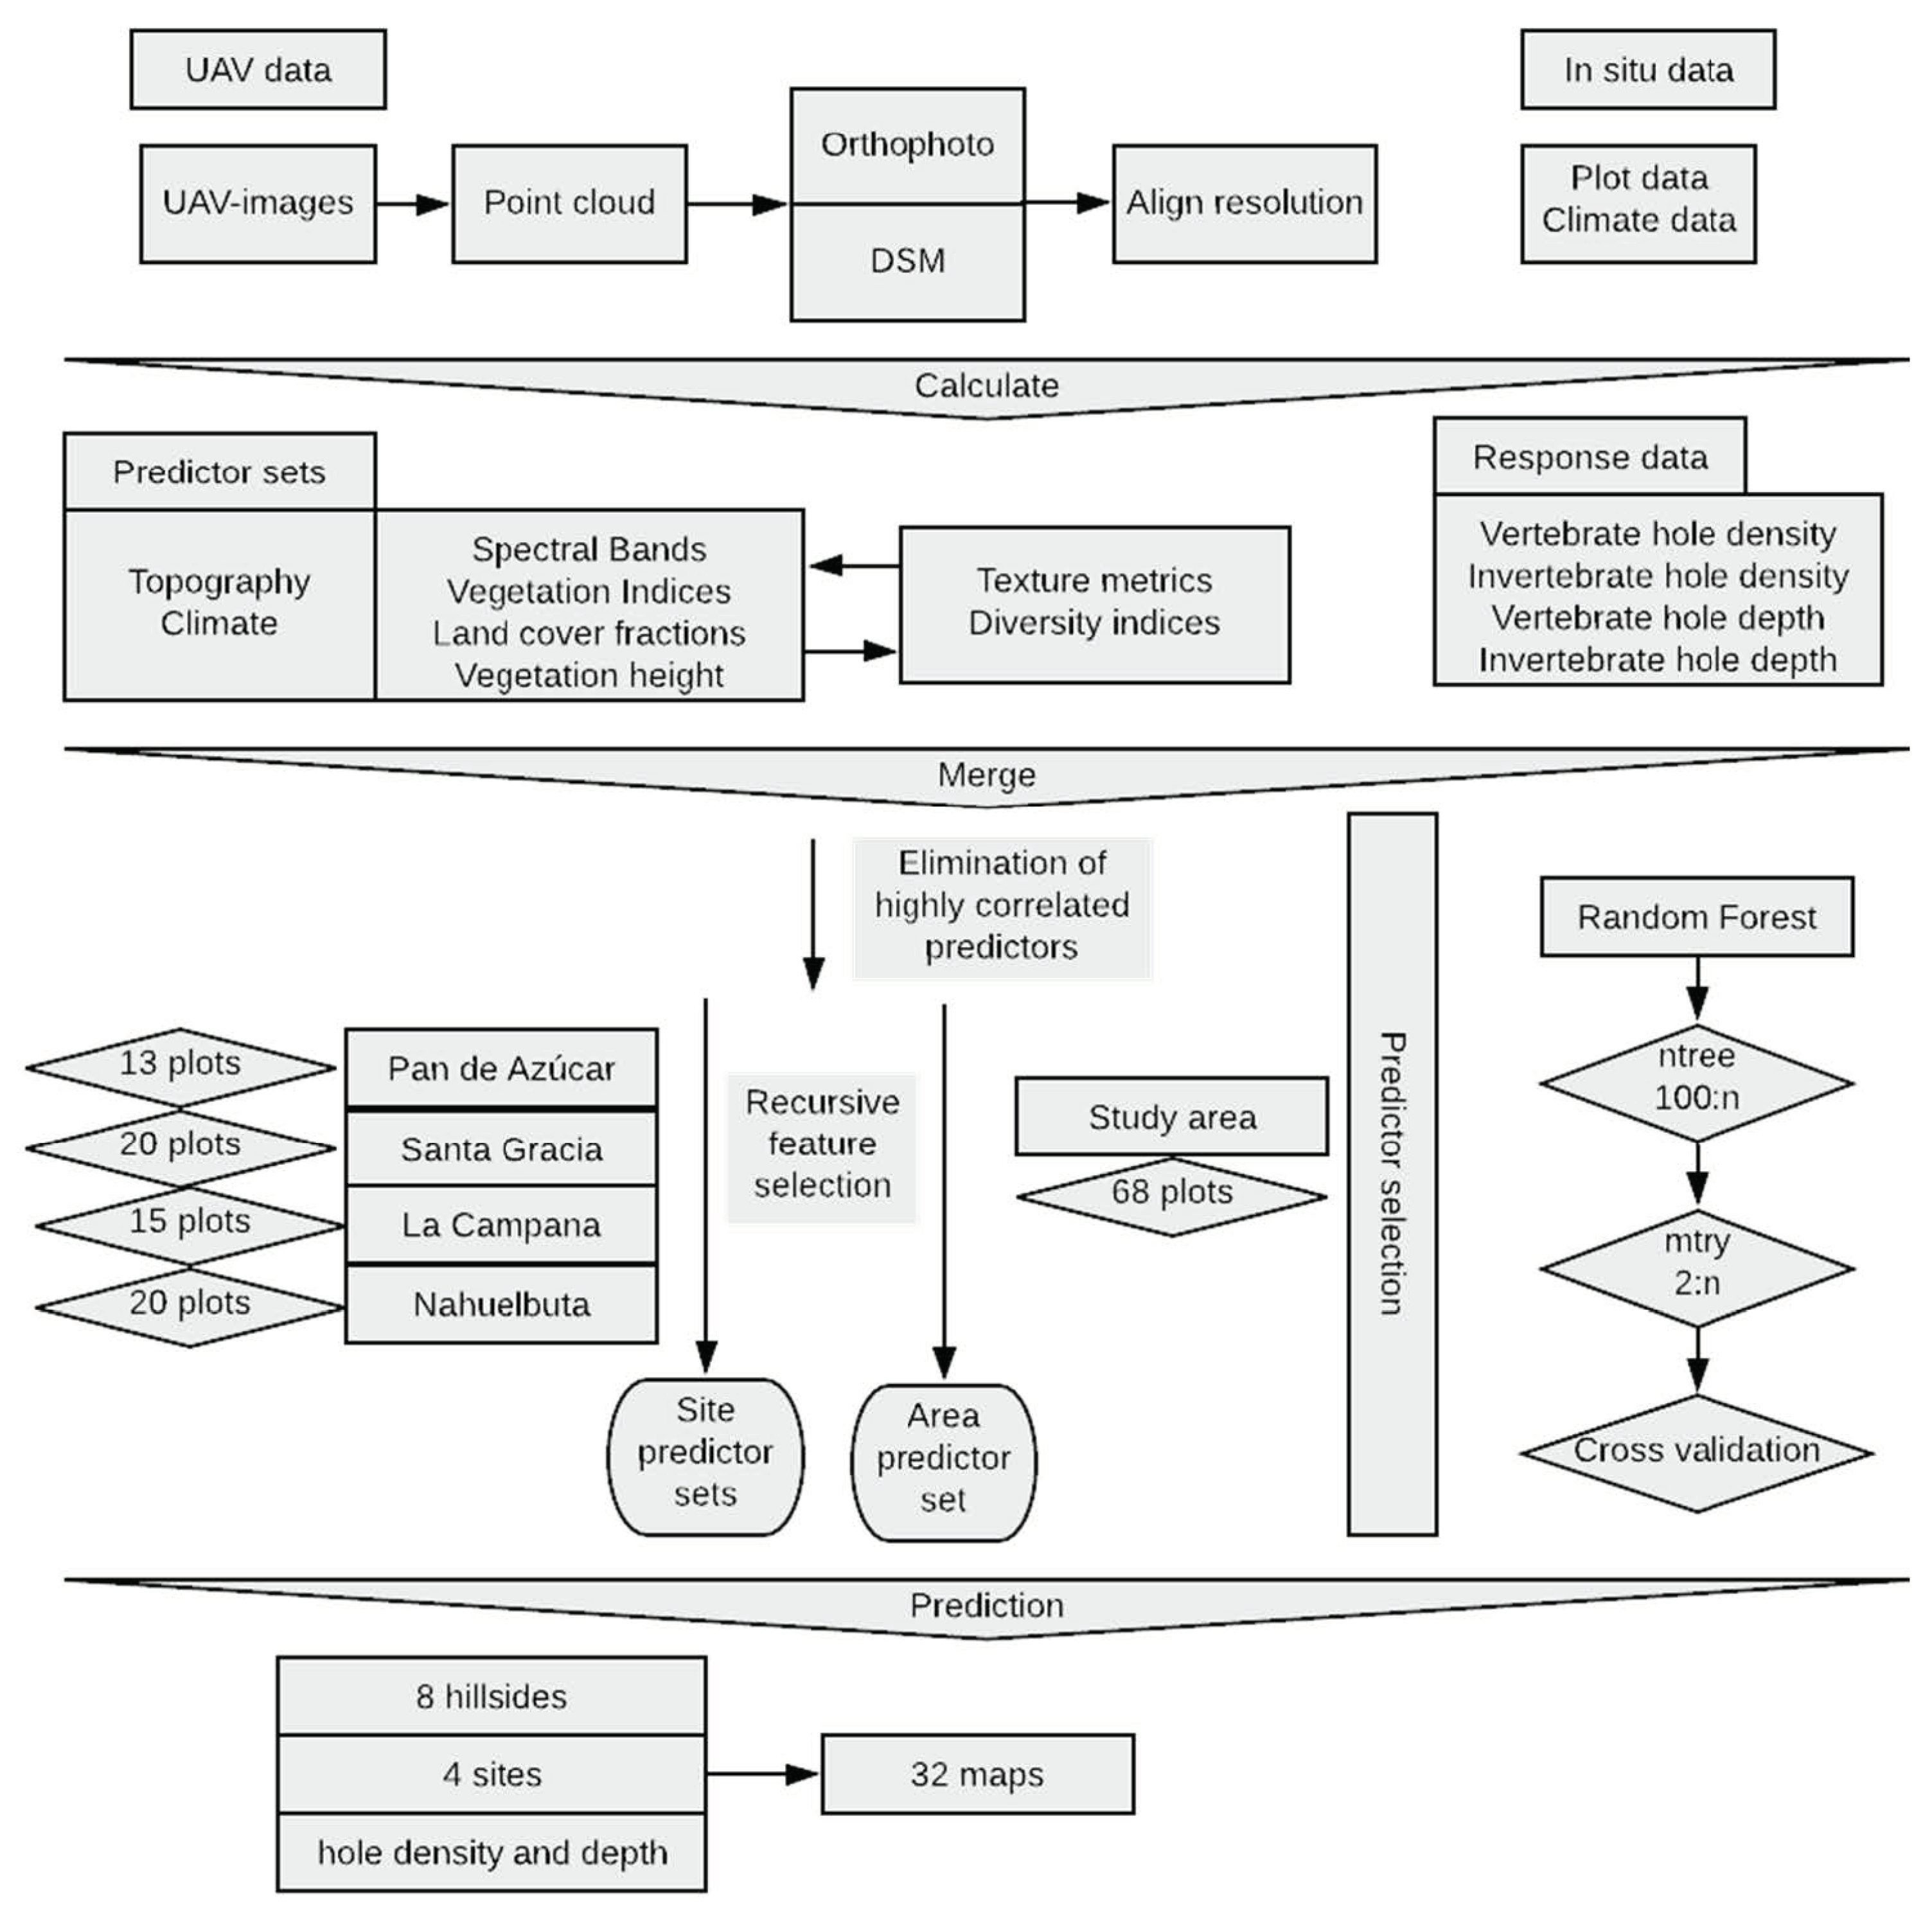
Figure 1. Workflow. Pre-processing comprises the acquisition and preparation of in situ and remote sensing data. Model input describes the calculated predictors and response data. Predictor selection describes the estimation of the predictors used in the final models. Hyperparameter tuning describes the tuned parameters and validation techniques. DSM = digital surface model; ntree = optimal number of trees after each split; mtry = optimal number of predictors randomly selected at each split.
Drones 05 00086 g001
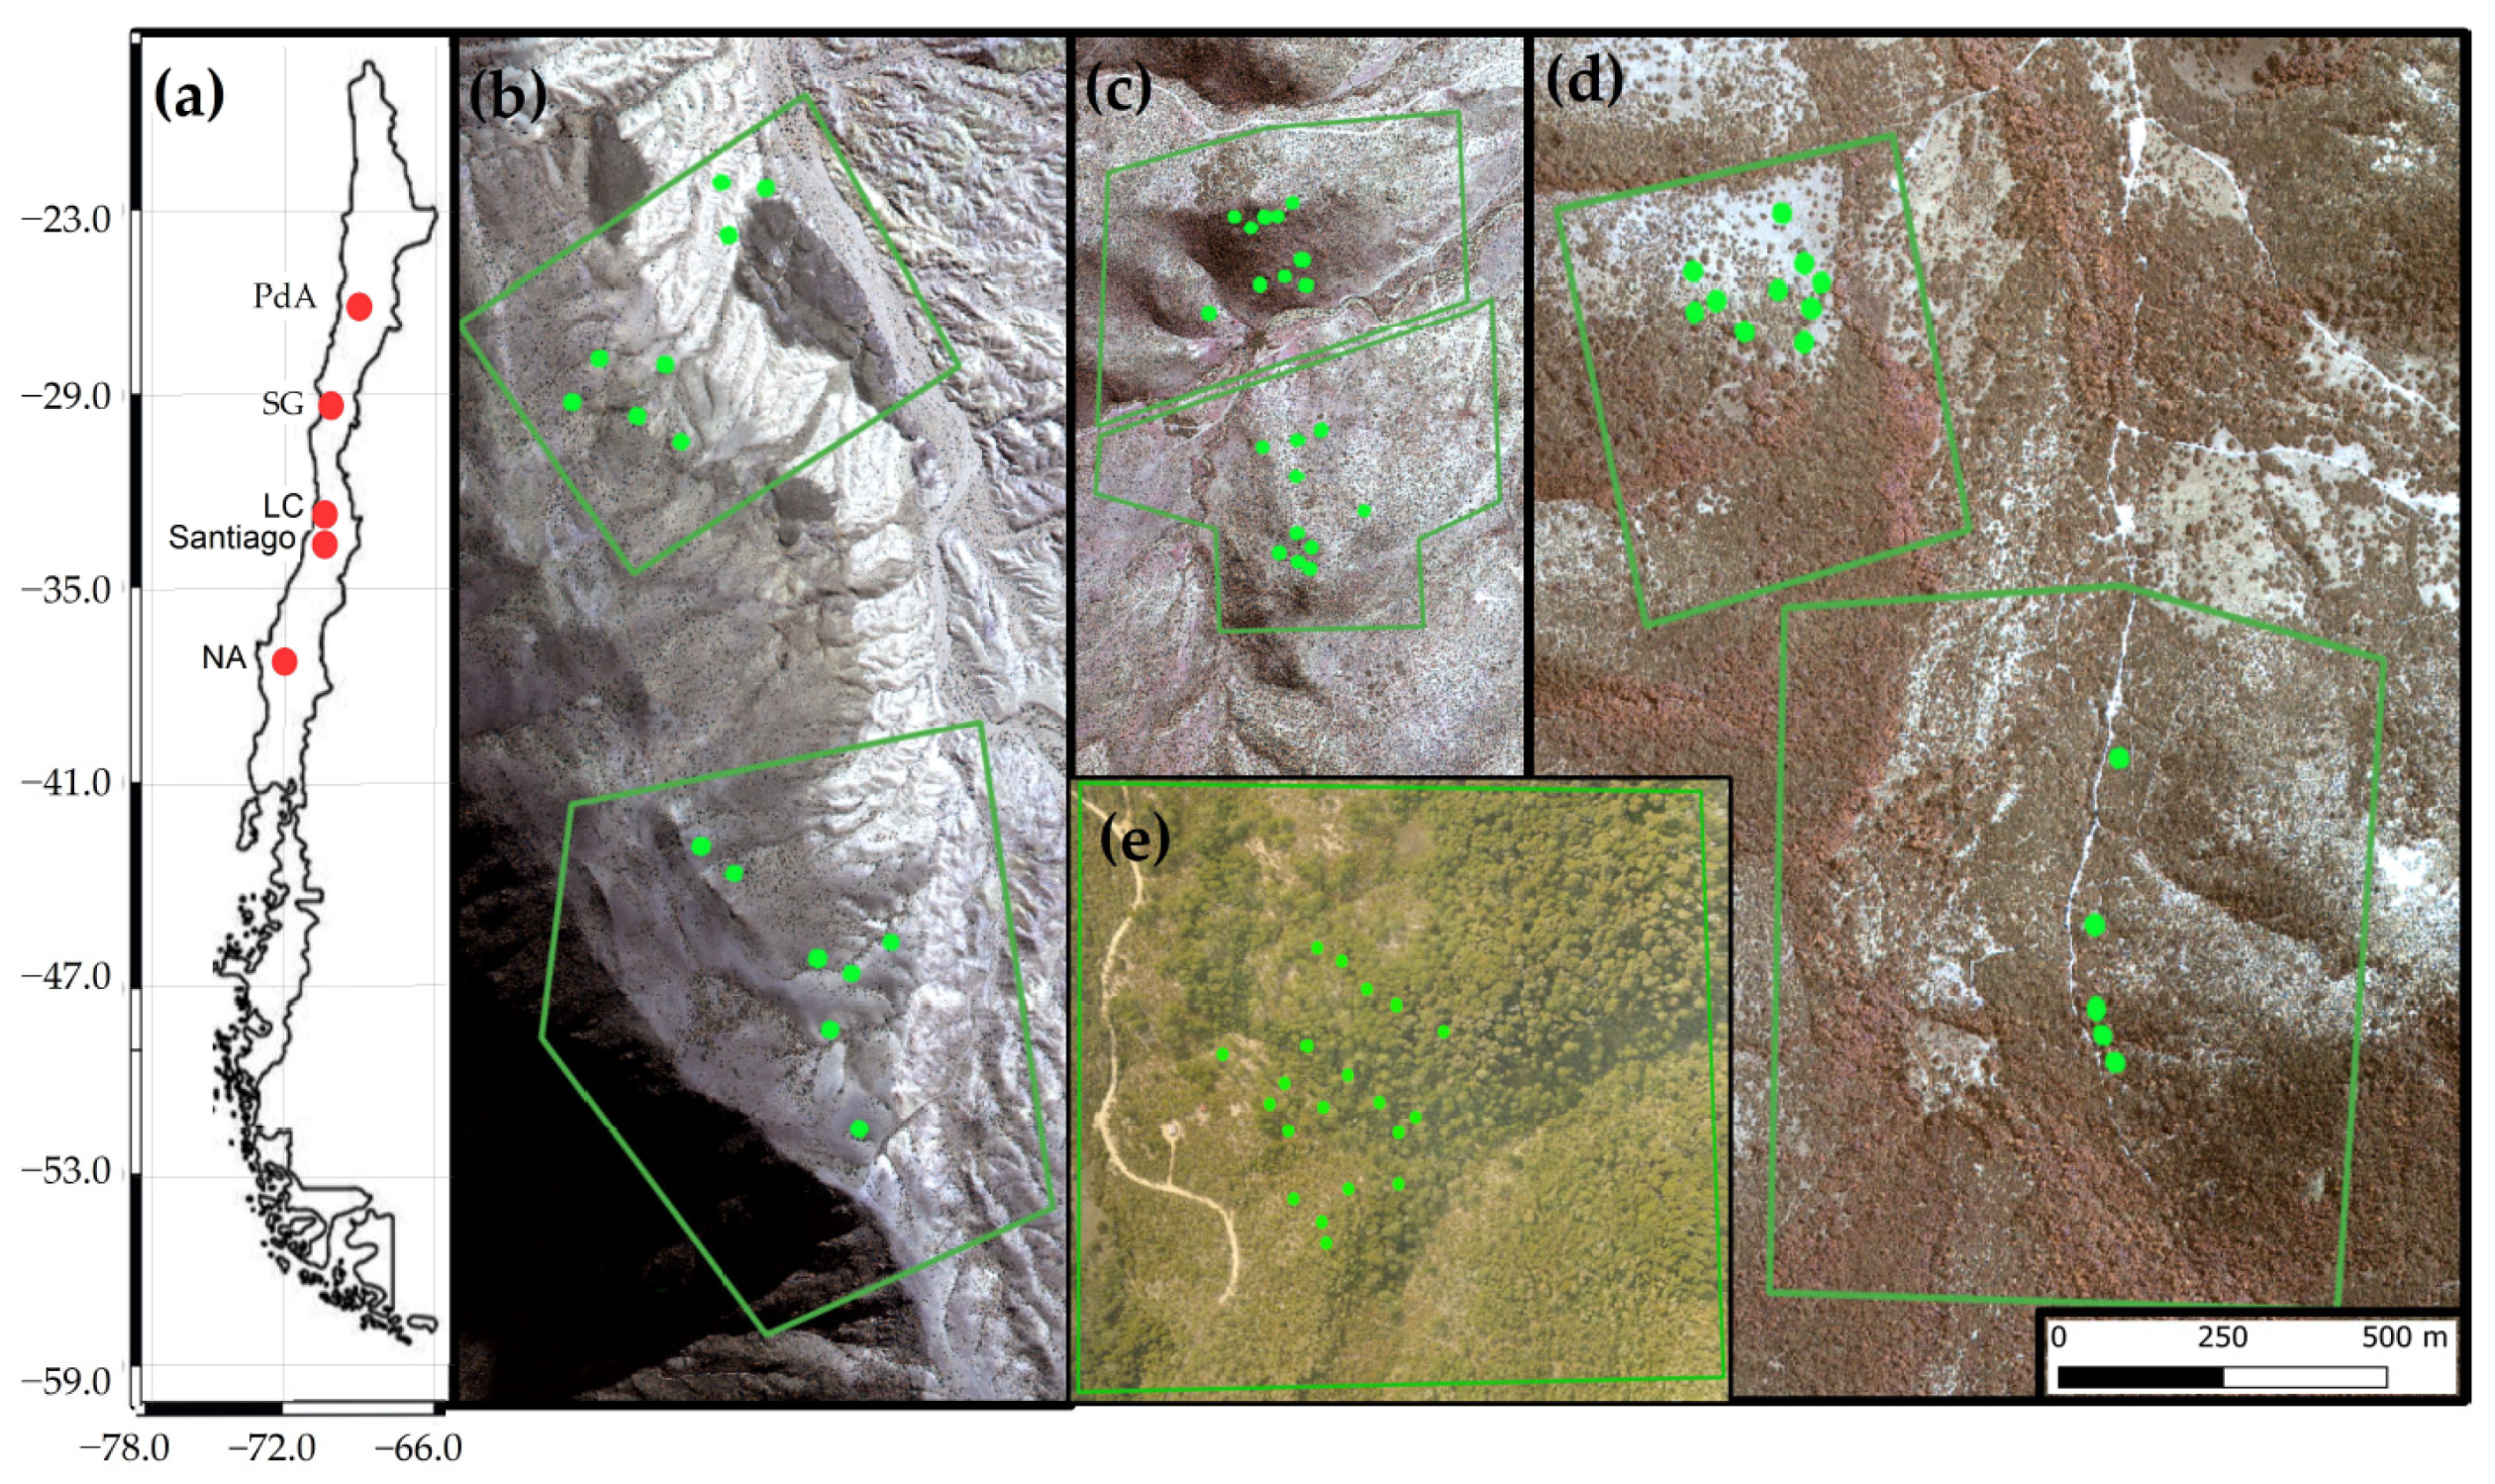
Figure 2. Study area and study sites. Green dots indicate the positions of plots. The green lines outline the UAV orthophotos: (a) Position of the study sites along the climate gradient. PdA = Pan de Azúcar, SG = Santa Gracia, LC = La Campana, NA = Nahuelbuta; Positions of plots in (b) PdA; (c) SG; (d) LC; and (e) NA. The background image is an RGB-composite calculated from WorldView-2 satellite imagery with applied hillshade.
Drones 05 00086 g002
Figure 3. Performance of the models trained for the whole study area. The red line is the linear regression line. The green shadow is the confidence interval. MAE = mean absolute error: (a) Vertebrate hole density/10 m × 10 m; (b) invertebrate hole density/10 m × 10 m; (c) vertebrate hole depth [cm]/10 m × 10 m; and (d) invertebrate hole depth [cm]/10 m × 10 m. Significance level: p *** ≤ 0.001; p ** ≤ 0.01; p * ≤ 0.05.
Drones 05 00086 g003
Figure 4. Predictor importance in the models fitted for the whole study area and the individual study sites. Only statistically significant models are shown. The importance of all predictors estimated by RFE was normalized from 0 to 1 separately for each model. The predictors not selected by the RFE were assigned a value of 0. PdA = Pan de Azúcar, SG = Santa Gracia, LC = La Campana, NA = Nahuelbuta, VARI = visible atmospherically resistant index [59], NGRDI = normalized green–red difference index [60].
Drones 05 00086 g004
Figure 5. Predicted hole density per 10 m × 10 m across north-facing hillsides using models trained for the whole study area: (a) Vertebrate hole density in LC; (b) vertebrate hole density in PdA; (c) invertebrate hole density in LC; and (d) invertebrate hole density in PdA.
Drones 05 00086 g005
Table 1. List of the calculated predictors.
Predictor SetNumber of PredictorsDescription
Climate3Mean annual air temperature [°C]
Mean annual soil temperature [°C]
Mean annual precipitation [mm]
Topography3Elevation [m.a.s.l]
Inclination [°] [56]
Aspect [°] [56]
Spectral bands3Red band
Green band
Blue band
Vegetation indices7Red–green–blue vegetation index (RGBVI) [57], green-leaf-index (GLI) [58], visible atmospherically resistant index (VARI) [59], normalized green–red difference index (NGRDI) [60], vegetation dryness index (VDI) [61], excess green vegetation index (EXG) [62], and green chromatic coordinate (GCC) [63]
Land-cover fractions
per 10 m × 10 m
7Soil, skeleton, herbs, shrubs, cacti, trees,
all vegetation
Average vegetation height
per 10 m × 10 m
5Herbs, shrubs, cacti, trees, all vegetation
Texture metrics calculated from the spectral bands + vegetation indices + vegetation height with a surrounding of 10 m × 10 m or 108 × 108 pixels [64]21 + 14 + 7Variance, entropy, homogeneity, second moment, correlation, dissimilarity, contrast
Diversity indices (calculated from land-cover classification using a moving window of 108 × 108 pixels) [65]7Shannon’s Diversity [66], Pielou’s Evenness [67], the Berger–Parker Index [68], Rao’s quadratic
entropy [69], Cumulative Residual Entropy [70], Hill’s numbers [71], Rényi’s Index
Table 2. Performance of models trained for individual study sites and for the whole study area (all study sites). ‘mtry’ is the optimal number of predictors randomly selected at each split. PdA = Pan de Azúcar, SG = Santa Gracia, LC = La Campana, NA = Nahuelbuta.; p *** ≤ 0.001; p ** ≤ 0.01; p * ≤ 0.05.
UnitAnimalsStudy SiteNumber of Selected
Predictors
MtryR2
Hole densityVertebratesAll2350.43 **
PdA210.75 ***
SG510.04
LC210.11
NA210.46 ***
InvertebratesAll1330.62 ***
PdA1030.68 ***
SG2060.15
LC2680.10
NA620.29 *
Hole depthVertebratesAll520.22 *
PdA720.01
SG33110.01
LC820.66 ***
NA410.36 **
InvertebratesAll310.44 ***
PdA34110.07
SG1550.19
LC30100.01
NA620.31 *
Publisher’s Note: MDPI stays neutral with regard to jurisdictional claims in published maps and institutional affiliations.