Cattle Detection Using Oblique UAV Images


1
Embrapa Informatica Agropecuaria, Campinas 13083-886, Brazil
2
Embrapa Pecuaria Sudeste, Sao Carlos 13560-970, Brazil
*
Author to whom correspondence should be addressed.
Drones 2020, 4(4), 75; https://doi.org/10.3390/drones4040075
Submission received: 10 November 2020
/
Revised: 2 December 2020
/
Accepted: 3 December 2020
/
Published: 8 December 2020
Abstract
:The evolution in imaging technologies and artificial intelligence algorithms, coupled with improvements in UAV technology, has enabled the use of unmanned aircraft in a wide range of applications. The feasibility of this kind of approach for cattle monitoring has been demonstrated by several studies, but practical use is still challenging due to the particular characteristics of this application, such as the need to track mobile targets and the extensive areas that need to be covered in most cases. The objective of this study was to investigate the feasibility of using a tilted angle to increase the area covered by each image. Deep Convolutional Neural Networks (Xception architecture) were used to generate the models for animal detection. Three experiments were carried out: (1) five different sizes for the input images were tested to determine which yields the highest accuracies; (2) detection accuracies were calculated for different distances between animals and sensor, in order to determine how distance influences detectability; and (3) animals that were completely missed by the detection process were individually identified and the cause for those errors were determined, revealing some potential topics for further research. Experimental results indicate that oblique images can be successfully used under certain conditions, but some practical limitations need to be addressed in order to make this approach appealing.
1. Introduction
The management of beef cattle farms operating under an extensive production system is challenging, especially considering that many of those farms have large areas with deficient communications infrastructure and ground access. Under those conditions, thorough visual inspection of the herd often requires manned flight, which is expensive and has some risks associated [1]. Because of this, horseback ground monitoring is still very common, making it very difficult to cover the entire farm in a timely manner.
Unmanned aerial vehicles (UAV) are being explored as a time- and cost-effective alternative to the approaches mentioned above. The idea is to use UAVs to capture a large number of images from a certain area, and then use algorithms to extract the information of interest. In the case of cattle monitoring, applications that have been investigated include animal detection and counting [1,2,3,4,5], specimen recognition [6], measurement of the distance between cow and calf [7], and determination of feeding behavior [8]. With very few exceptions [9], the information contained in the images is extracted by means of deep learning models, using one of four main approaches [1]: semantic segmentation, which associates each pixel in the image to a class; instance segmentation, which detects and delineates each distinct object of interest [4,5]; object detection, which delineates a box bounding the objects of interest [10,11]; and heat mapping (probability distributions) using Convolutional Neural Networks (CNNs), which reveals the position of the animals in the image [12,13,14]. Different degrees of success have been achieved, a fact that is more related to the specific experimental setup and to the characteristics of the datasets used in the study than to the algorithms themselves [1]. While significant progress has been achieved, this kind of technology still cannot reach its full potential due to a number of technical and practical limitations.
One major practical limitation is that most UAVs do not have enough autonomy to cover entire farms in a single flight [15]. This is a problem because, in the time interval between flights, animals may move, weather conditions may vary, and the angle of light incidence will change. All those factors have the potential to increase error rates. There have been some attempts to monitor herds by carrying out flights at certain time intervals, thus generating enough data for tracking the animals [16]. Although the results using this type of approach are promising, with images captured at the nadir position (perpendicularly to the ground), the area covered in a single mission tends to be limited. If the herd is spread over a large area, which is the case on many Brazilian cattle farms, timely monitoring of the entire population will most likely be unfeasible unless multiple UAVs are used. One possible way to mitigate this problem would be to capture the images at an angle, but studies employing UAVs for cattle monitoring almost always use images captured at the nadir position. The only exception found in the researched literature is the studies by Xu et al. [4,5], but images were captured at low altitudes and only animals close to the sensor were considered. The main reason for choosing vertical angles is that this guarantees that all points in an image have approximately the same Ground Sample Distance (GSD), making it easier to detect the objects of interest.
Indeed, the use of images captured at an angle (oblique images) brings many challenges: the GSD varies considerably throughout the image, occlusions become more severe, the difficulty of detecting and measuring objects increases the farther they are from the camera, and geometric and color distortions become more prominent in distant objects, among others. On the other hand, the area covered in a single image can be much larger, having the potential to greatly reduce the number of flights/UAVs needed for proper coverage. The objective of this study was to investigate the difficulties and advantages associated to oblique images, as well as to determine under which conditions this type of image is advantageous in comparison with those captured orthogonally. All experiments were carried out in the context of animal detection, which is an intermediate step toward animal counting. To the best of the authors’ knowledge, this is the first study exploring the viability of using oblique images for cattle monitoring. Experiments were carried out using the Xception CNN architecture, which has yielded very accurate results in previous studies [1,3].
2. Material and Methods
2.1. Dataset
Images were captured at an altitude of 30 m with respect to the take-off position, using a DJI Mavic 2 Pro equipped with a 20-MPixel camera. Camera settings were all kept on automatic, except exposition, which used the presets “sunny” and “overcast” depending on weather conditions. Angles between sensor view and the orthogonal axis varied between 10° and 75°. Distances between animals and sensor varied from 30 m to more than 500 m. All images were captured between 10 a.m. and 3 p.m. Animals from both Canchim and Nelore breeds were present during flights. The color of the animals in the images ranged from white to light beige, with some darker coating occurring in some animals.
The imaged areas are located at Canchim farm, S ao Carlos, Brazil (21°58′28″ S, 47°50′59″ W). Several different experiments involving livestock are carried out at this farm, making it possible to build a dataset representing many of the situations found in practice, ranging from unimpeded line of sights to busy environments with varying degrees of occlusion (Figure 1). Flight missions and the coordinates of each image capture were planned to cover areas with different characteristics. Because images were captured in different directions, many of the nearly 300 images captured did not contain animals and were discarded. The remaining sixty images were divided into image blocks using regular grids ranging from 14- to 224-pixel spacing, both horizontally and vertically. As a result, five datasets were generated (Table 1) and used to determined the ideal degree of granularity for animal detection in oblique images.
2.2. Experimental Setup
Blocks from the divided images were visually classified as “cattle” and “non-cattle” by an expert. A image block was classified as cattle if at least part of an animal could be unequivocally identified by the human expert. The process is thus inherently subjective, but more objective approaches were too time consuming for practical adoption. It is worth noting that blocks containing only a small portion of an animal have little impact on the detection process (even if misidentified), which limits potential problems caused by inconsistencies associated to the visual selection process.
As expected, the number of “non-cattle” samples was much larger than the number of “cattle” samples. To avoid severely imbalanced classes, which can cause biased results [17], “non-cattle” samples were randomly selected from the complete set to match the number of cattle samples (Table 1).
Model training was carried out using 80% of the samples, with the remaining 20% of the samples being used in the tests; validation was not adopted because the parameters used in the training were determined in previous studies [1,3]. The deep Convolutional Neural Network (CNN) used in this study was the Xception [18]. The following training parameters were used: fixed learning rate of 0.0001, 10 epochs, mini-batch size of 128 and sigmoid activation function. The model used was pretrained on the Imagenet dataset [19], and all layers were frozen with the exception of the five last ones. Training was performed in a workstation equipped with two RTX-2080 Ti GPUs. This architecture was chosen because it yielded high accuracies with a relatively small number of parameters in previous studies [3]. Three different experiments were devised to investigate various aspects of the problem:
The first experiment aimed at determining the ideal dimensions of the images to be used as inputs. Five different dimensions were tested: 224 × 224, 112 × 112, 56 × 56, 28 × 28, and 14 × 14 pixels. By default, the minimum image size accepted as input by the Xception model is 71 × 71 pixels, thus in the latter three cases the image blocks were upsampled to these dimensions. This does not alter the amount of information contained in the images, which are simply reassembled to match the input requirements. The metrics used for the assessment of detection quality were the following:
where TP, TN, FP, and FN are the number of true positives, true negatives, false positives, and false negatives, respectively. Confusion matrices were also adopted to help visualize the results.
The second experiment aimed at determining how the distance between animals and sensor affected the detection. The distance between animals and sensor was estimated by firstly determining the length of a typical animal (in pixels) located directly below the UAV (30 m), and then using a direct proportion to derive the distance of farther animals. This is obviously a rough estimate, given that the sizes and positions of the animals vary, but it is accurate enough for the specific purposes of this study. Geometrical calculations were not adopted because of a small number of instances in which the distance estimates were very poor. Samples were initially divided into four groups (Table 2), namely 30–50, 50–100, 100–250, and more than 250 m, and detection accuracies were computed in each case. The latter group was later dropped because, at distances greater than 250 m, animal detection is unreliable even visually. Thus, the experiments carried out in this study only considered animals closer than 250 m from the sensor. All five image block dimensions were considered in this experiment. Only the “recall” metric was used here, because it is unfeasible to estimate distances for all “non-cattle” image blocks without a proper reference, so “precision” cannot be calculated.
The third experiment aimed at determining the proportion of animals that are completely missed by the detection process. Animals close to the sensor usually appear in multiple image blocks (especially when block dimensions are small), while at greater distances a single image block can contain multiple animals. This implies that close animals can be successfully detected even if some misclassifications occur, while animals located farther from the sensor may be completely missed by just a single misclassification. The number of animals completely missed was determined for each block-dimension/animal-distance combination.
All experiments were carried out using a 10-fold cross-validation, with training and test sets being randomly generated in each repetition.
3. Results
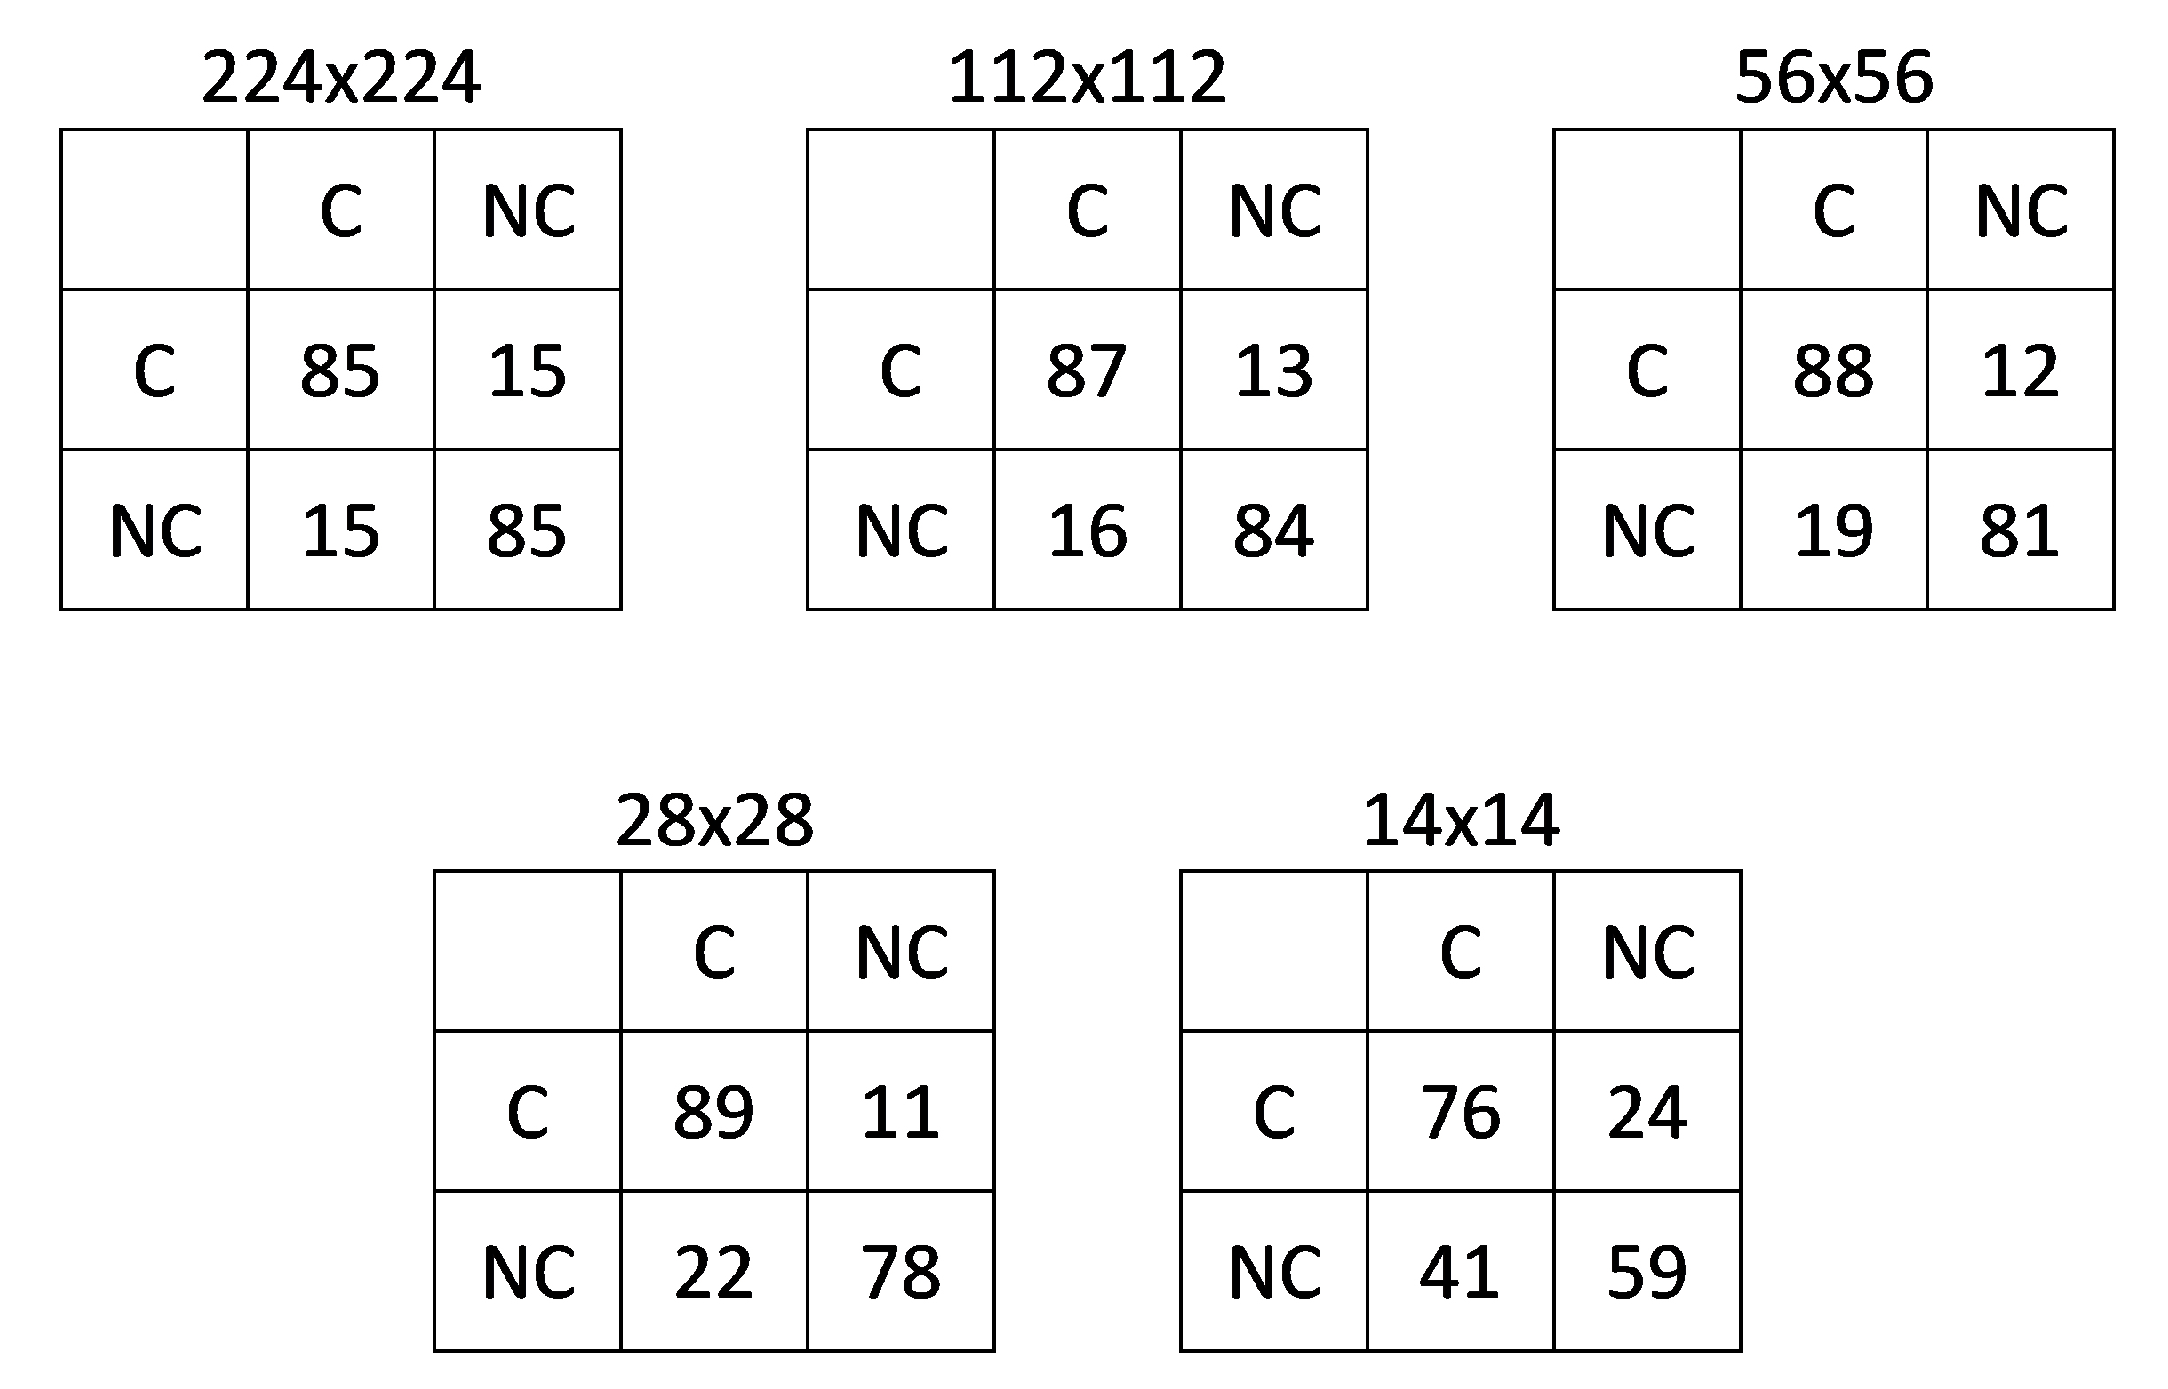
Table 3 shows the results obtained using different image block sizes. Only minor differences were observed between the three largest block sizes, with a significant drop in accuracy when smaller blocks were considered. Table 4 presents the accuracies obtained when the three distance classes were considered, showing that detection tends to become less effective as animals are farther away from the sensor. Figure 2 shows the confusion matrices calculated for each of the five block sizes, confirming that error rates were higher for the two smallest block sizes.
Table 5 shows the proportion of animals completely missed by the detection process for each block-dimension/animal-distance pair.
4. Discussion
Global metrics such as accuracy and F1 score were somewhat similar for all image block sizes considered, with the exception of 14 × 14 pixels. It was observed that the latter carried too little information and was too sensitive to small spurious elements to provide reliable estimates. Thus, unless otherwise stated, all remarks made in this section ignore the 14 × 14 case.
While global metrics were relatively homogeneous, “precision” and “recall” showed some clear patterns. As more focused (smaller) image blocks are used, distant animals tend to become more prominent in each sample, making the detection more likely (recall increases). On the other hand, small spurious elements also become more prominent, increasing the likelihood of misdetections (precision drops). That is exactly what was observed. This tradeoff between precision and recall explains why global metrics remained approximately the same across all block sizes.
It is also interesting to notice that recall values varied only slightly in the case of close animals, as these are prominent even when larger image blocks are considered. For distant animals, however, recall was considerably larger when smaller image blocks were adopted. Although there were no similar experiments regarding precision values, given the almost linear tradeoff between these and recall values, it is safe to assume that precision values are directly proportional to the image block size and inversely proportional to the distance considered.
While accuracies and F1 scores were similar for all block sizes (except 14 × 14), the severity of the errors were not. In the case of small block sizes, false negatives (“cattle” blocks classified as “non-cattle”) are not as damaging because there is a higher probability that each animal is represented by multiple blocks. This is particularly true in the case of distant animals—there was an instance in which a single missed 224 × 224 block contained seven animals. If the objective is to estimate the number of animals, such a misclassification would be very impactful. Indeed, the experiments indicated that the number of missed animals was considerably lower for small image blocks.
The conclusions drawn from the experimental results seem to indicate that smaller image blocks are advantageous for detecting animals located far from the sensor, as long as they carry enough information to train the model. It is important to notice, however, that architectures other than that used in the experiments (Xception) can have a lower or higher sensitivity to the numerous factors that affect the results (contrast between animals and background, angle of incident light, etc.). Thus, additional experiments are recommended if a different model is to be employed. It is also worth pointing out that all animals in the images had light colors ranging from white to pale yellow or gray. Again, if other breeds are to be considered, new experiments need to be carried out.
Experimental results show that it is feasible to employ oblique images for detection of animals located up to 250 m from the sensor. However, there are a few practical issues that need to be taken into consideration.
Although occlusions are a problem in orthogonal images, in the case of oblique images obstacles such as trees, tall grass and sheds can obstruct a considerably larger portion of the field of view. The actual percentage of the area that can be properly scanned can vary considerably depending on the type of vegetation and where potential obstacles are located with respect to the camera. The configuration of the vegetation canopies also plays a major role, as in some cases it is better to keep major obstacles close to the camera, so the area occluded is roughly the same as the area of the canopy itself, while in other cases a better field of view can be obtained if those obstacles are farther from the camera (e.g., if branches and leaves are high above ground). In the case of this study, most of the obstacles were trees typical from the Cerrado region, which tend to have low leaf density, although there were also a few trees with dense canopies (Figure 1). Because obstacle characteristics can vary wildly from site to site, in most cases, the ideal positioning for the sensor will be specific to each area. This problem is much less prominent in farms without large obstructed areas, making it easier to explore the benefits of oblique images. Occlusions caused by the animals themselves were also observed in a few instances, especially at farther distances. This can also be a major source of misestimates in large groups of animals.
With mobile targets, the objects of interest may not be at the same positions when new images are captured. This is true independently of the type of image used, but in the case of oblique images there is the additional challenge of trying to determine the borders of the region covered in a given image in order to avoid overlap when a new image is considered. In areas with high cattle population density, it may be nearly impossible to determine which animals have already been counted, especially if those are concentrated near the 250 m limit of detection.
Separating clustered animals is arguably the most challenging task when counting animals using orthogonal images [1,3]. With oblique images, the problem becomes even more difficult. With tilted angles, clustering tends to intensify and the degree of overlap between animals tends to grow sharply. The problem becomes even more difficult considering that distant animals are depicted by fewer pixels, causing animal shapes to become less discernible. As a result, cluster separation may quickly become unfeasible, even visually. It is worth pointing out that the potential impact of clustered animals on the accuracy of a counting estimate was not investigated in this study, but it was thoroughly investigated by Barbedo et al. [1]. Many of the conclusions of that study hold here, but since the separation of animals far from the sensor probably pose a significantly more difficult challenge, this is an issue that should be investigated in depth in the near future.
Many of the most recent research on cattle detection and counting adopt object detection models such as Mask R-CNN [4,5], YOLO [11], and DisCount Net [13], rather than using classification models such as the one adopted in this study. Object detection models were not employed in this study for three reasons: (1) data annotation is challenging, especially when animals are far away and grouped; (2) this type of approach is sensitive to animal pose, which means that a large dataset containing a wide variety of poses is needed to properly capture practical variability; and (3) they usually have difficulties detecting objects that appear small in the images, which is the case for distant animals. Nevertheless, this is an approach worth investigating in the future, as it can provide more useful data toward a counting estimate.
Discriminating between livestock species has been explored in some studies [5], but since most farms in Brazil are dedicated exclusively to cattle, this issue was not investigated.
The practical difficulties mentioned above can severely limit the appeal of using images captured at a tilted angles for cattle monitoring. It is worth pointing out, however, that the applicability of this approach can be greatly improved by simple measures such as including some markers that can be easily identified in the images, helping to delimit the region considered in each image. With this, it may become possible to devise strategies to minimize other problems, such as decreasing the distance at which successive images are captured and selecting positions that minimize the impact of obstacles. Another action that can improve the results obtained by this kind of approach is to explore the prior knowledge about topography and obstacles to determine the best spots for capturing the images. These are issues worth exploring in future studies, together with an investigation to determine if the potential benefits brought by oblique images are enough to justify the additional effort needed to enable their use.
5. Conclusions
This article explores the possibility of using tilted angles to increase the area covered by a single image captured using UAVs. Experimental results indicate that this approach can be advantageous if challenges related to view obstructions and the determination of the exact borders of the region considered in the image can be properly addressed. Future investigations should include a cost–benefit analysis to estimate the potential benefits of oblique images against the measures needed to minimize practical hurdles.
This study dealt only with the problem of animal detection, which is only the first step of more complex tasks, such as animal counting and detection of anomalies. These have several technical challenges (separation of clustered animals, animal tracking, etc. [1,3]) which are exacerbated when dealing with oblique images. Future research should also tackle these challenges in order to enable technologies capable of providing the answers needed by decision makers.
Author Contributions
Conceptualization, J.G.A.B. and L.V.K.; methodology, J.G.A.B., L.V.K. and P.M.S.; software, J.G.A.B. and L.V.K.; validation, J.G.A.B., L.V.K. and P.M.S.; formal analysis, J.G.A.B.; investigation, J.G.A.B. and L.V.K.; resources, J.G.A.B., L.V.K. and P.M.S.; data curation, J.G.A.B. and L.V.K.; writing—original draft preparation, J.G.A.B.; writing—review and editing, J.G.A.B., L.V.K. and P.M.S.; visualization, J.G.A.B. and L.V.K.; supervision, J.G.A.B.; project administration, J.G.A.B.; funding acquisition, J.G.A.B. All authors have read and agreed to the published version of the manuscript.
Funding
This research was funded by Fapesp under grant number 2018/12845-9, and Embrapa under grant number 22.16.05.021.00.00.
Acknowledgments
The authors would also like to thank Nvidia for donating the GPU used in the experiments.
Conflicts of Interest
The authors declare no conflict of interest.
References
- Barbedo, J.G.A.; Koenigkan, L.V.; Santos, P.M.; Ribeiro, A.R.B. Counting Cattle in UAV Images—Dealing with Clustered Animals and Animal/Background Contrast Changes. Sensors 2020, 20, 2126. [Google Scholar] [CrossRef] [PubMed] [Green Version]
- Goolsby, J.A.; Jung, J.; Landivar, J.; McCutcheon, W.; Lacewell, R.; Duhaime, R.; Baca, D.; Puhger, R.; Hasel, H.; Varner, K.; et al. Evaluation of Unmanned Aerial Vehicles (UAVs) for detection of cattle in the Cattle Fever Tick Permanent Quarantine Zone. Subtrop. Agric. Environ. 2016, 67, 24–27. [Google Scholar]
- Barbedo, J.G.A.; Koenigkan, L.V.; Santos, T.T.; Santos, P.M. A Study on the Detection of Cattle in UAV Images Using Deep Learning. Sensors 2019, 19, 5436. [Google Scholar] [CrossRef] [PubMed] [Green Version]
- Xu, B.; Wang, W.; Falzon, G.; Kwan, P.; Guo, L.; Chen, G.; Tait, A.; Schneider, D. Automated cattle counting using Mask R-CNN in quadcopter vision system. Comput. Electron. Agric. 2020, 171, 105300. [Google Scholar] [CrossRef]
- Xu, B.; Wang, W.; Falzon, G.; Kwan, P.; Guo, L.; Sun, Z.; Li, C. Livestock classification and counting in quadcopter aerial images using Mask R-CNN. Int. J. Remote Sens. 2020, 41, 1–22. [Google Scholar] [CrossRef] [Green Version]
- Andrew, W.; Gao, J.; Mullan, S.; Campbell, N.; Dowsey, A.W.; Burghardt, T. Visual Identification of Individual Holstein-Friesian Cattle via Deep Metric Learning. arXiv 2020, arXiv:2006.09205. [Google Scholar]
- Mufford, J.T.; Hill, D.J.; Flood, N.J.; Church, J.S. Use of unmanned aerial vehicles (UAVs) and photogrammetric image analysis to quantify spatial proximity in beef cattle. J. Unmanned Veh. Syst. 2019, 7, 194–206. [Google Scholar] [CrossRef]
- Nyamuryekung’e, S.; Cibils, A.; Estell, R.; Gonzalez, A. Use of an Unmanned Aerial Vehicle—Mounted Video Camera to Assess Feeding Behavior of Raramuri Criollo Cows. Rangel. Ecol. Manag. 2016, 69, 386–389. [Google Scholar] [CrossRef]
- Longmore, S.; Collins, R.; Pfeifer, S.; Fox, S.; Mulero-Pázmány, M.; Bezombes, F.; Goodwin, A.; Juan Ovelar, M.; Knapen, J.; Wich, S. Adapting astronomical source detection software to help detect animals in thermal images obtained by unmanned aerial systems. Int. J. Remote Sens. 2017, 38, 2623–2638. [Google Scholar] [CrossRef]
- Andrew, W.; Greatwood, C.; Burghardt, T. Aerial Animal Biometrics: Individual Friesian Cattle Recovery and Visual Identification via an Autonomous UAV with Onboard Deep Inference. arXiv 2019, arXiv:1907.05310v1. [Google Scholar]
- Shao, W.; Kawakami, R.; Yoshihashi, R.; You, S.; Kawase, H.; Naemura, T. Cattle detection and counting in UAV images based on convolutional neural networks. Int. J. Remote Sens. 2020, 41, 31–52. [Google Scholar] [CrossRef] [Green Version]
- Chamoso, P.; Raveane, W.; Parra, V.; González, A. UAVs Applied to the Counting and Monitoring of Animals. Advances in Intelligent Systems and Computing. Adv. Intell. Syst. Comput. 2014, 291, 71–80. [Google Scholar]
- Rahnemoonfar, M.; Dobbs, D.; Yari, M.; Starek, M. DisCountNet: Discriminating and Counting Network for Real-Time Counting and Localization of Sparse Objects in High-Resolution UAV Imagery. Remote Sens. 2019, 11, 1128. [Google Scholar] [CrossRef] [Green Version]
- Rivas, A.; Chamoso, P.; González-Briones, A.; Corchado, J. Detection of Cattle Using Drones and Convolutional Neural Networks. Sensors 2018, 18, 2048. [Google Scholar] [CrossRef] [PubMed] [Green Version]
- Barbedo, J.G.A.; Koenigkan, L.V. Perspectives on the use of unmanned aerial systems to monitor cattle. Outlook Agric. 2018, 47, 214–222. [Google Scholar] [CrossRef] [Green Version]
- Sun, Y.; Yi, S.; Hou, F.; Luo, D.; Hu, J.; Zhou, Z. Quantifying the Dynamics of Livestock Distribution by Unmanned Aerial Vehicles (UAVs): A Case Study of Yak Grazing at the Household Scale. Rangel. Ecol. Manag. 2020, 73, 642–648. [Google Scholar] [CrossRef]
- Buda, M.; Maki, A.; Mazurowski, M.A. A systematic study of the class imbalance problem in convolutional neural networks. Neural Netw. 2018, 106, 249–259. [Google Scholar] [CrossRef] [Green Version]
- Chollet, F. Xception: Deep Learning with Depthwise Separable Convolutions. arXiv 2017, arXiv:1610.02357v3. [Google Scholar]
- Deng, J.; Dong, W.; Socher, R.; Li, L.-J.; Li, K.; Fei-Fei, L. ImageNet: A Large-Scale Hierarchical Image Database. In Proceedings of the 2009 IEEE Conference on Computer Vision and Pattern Recognition, Miami, FL, USA, 20–25 June 2009; IEEE: Miami, FL, USA, 2009. [Google Scholar]
Figure 1.
Examples of image blocks (224 × 224 pixels) extracted from the original images captured in the field.
Figure 1.
Examples of image blocks (224 × 224 pixels) extracted from the original images captured in the field.
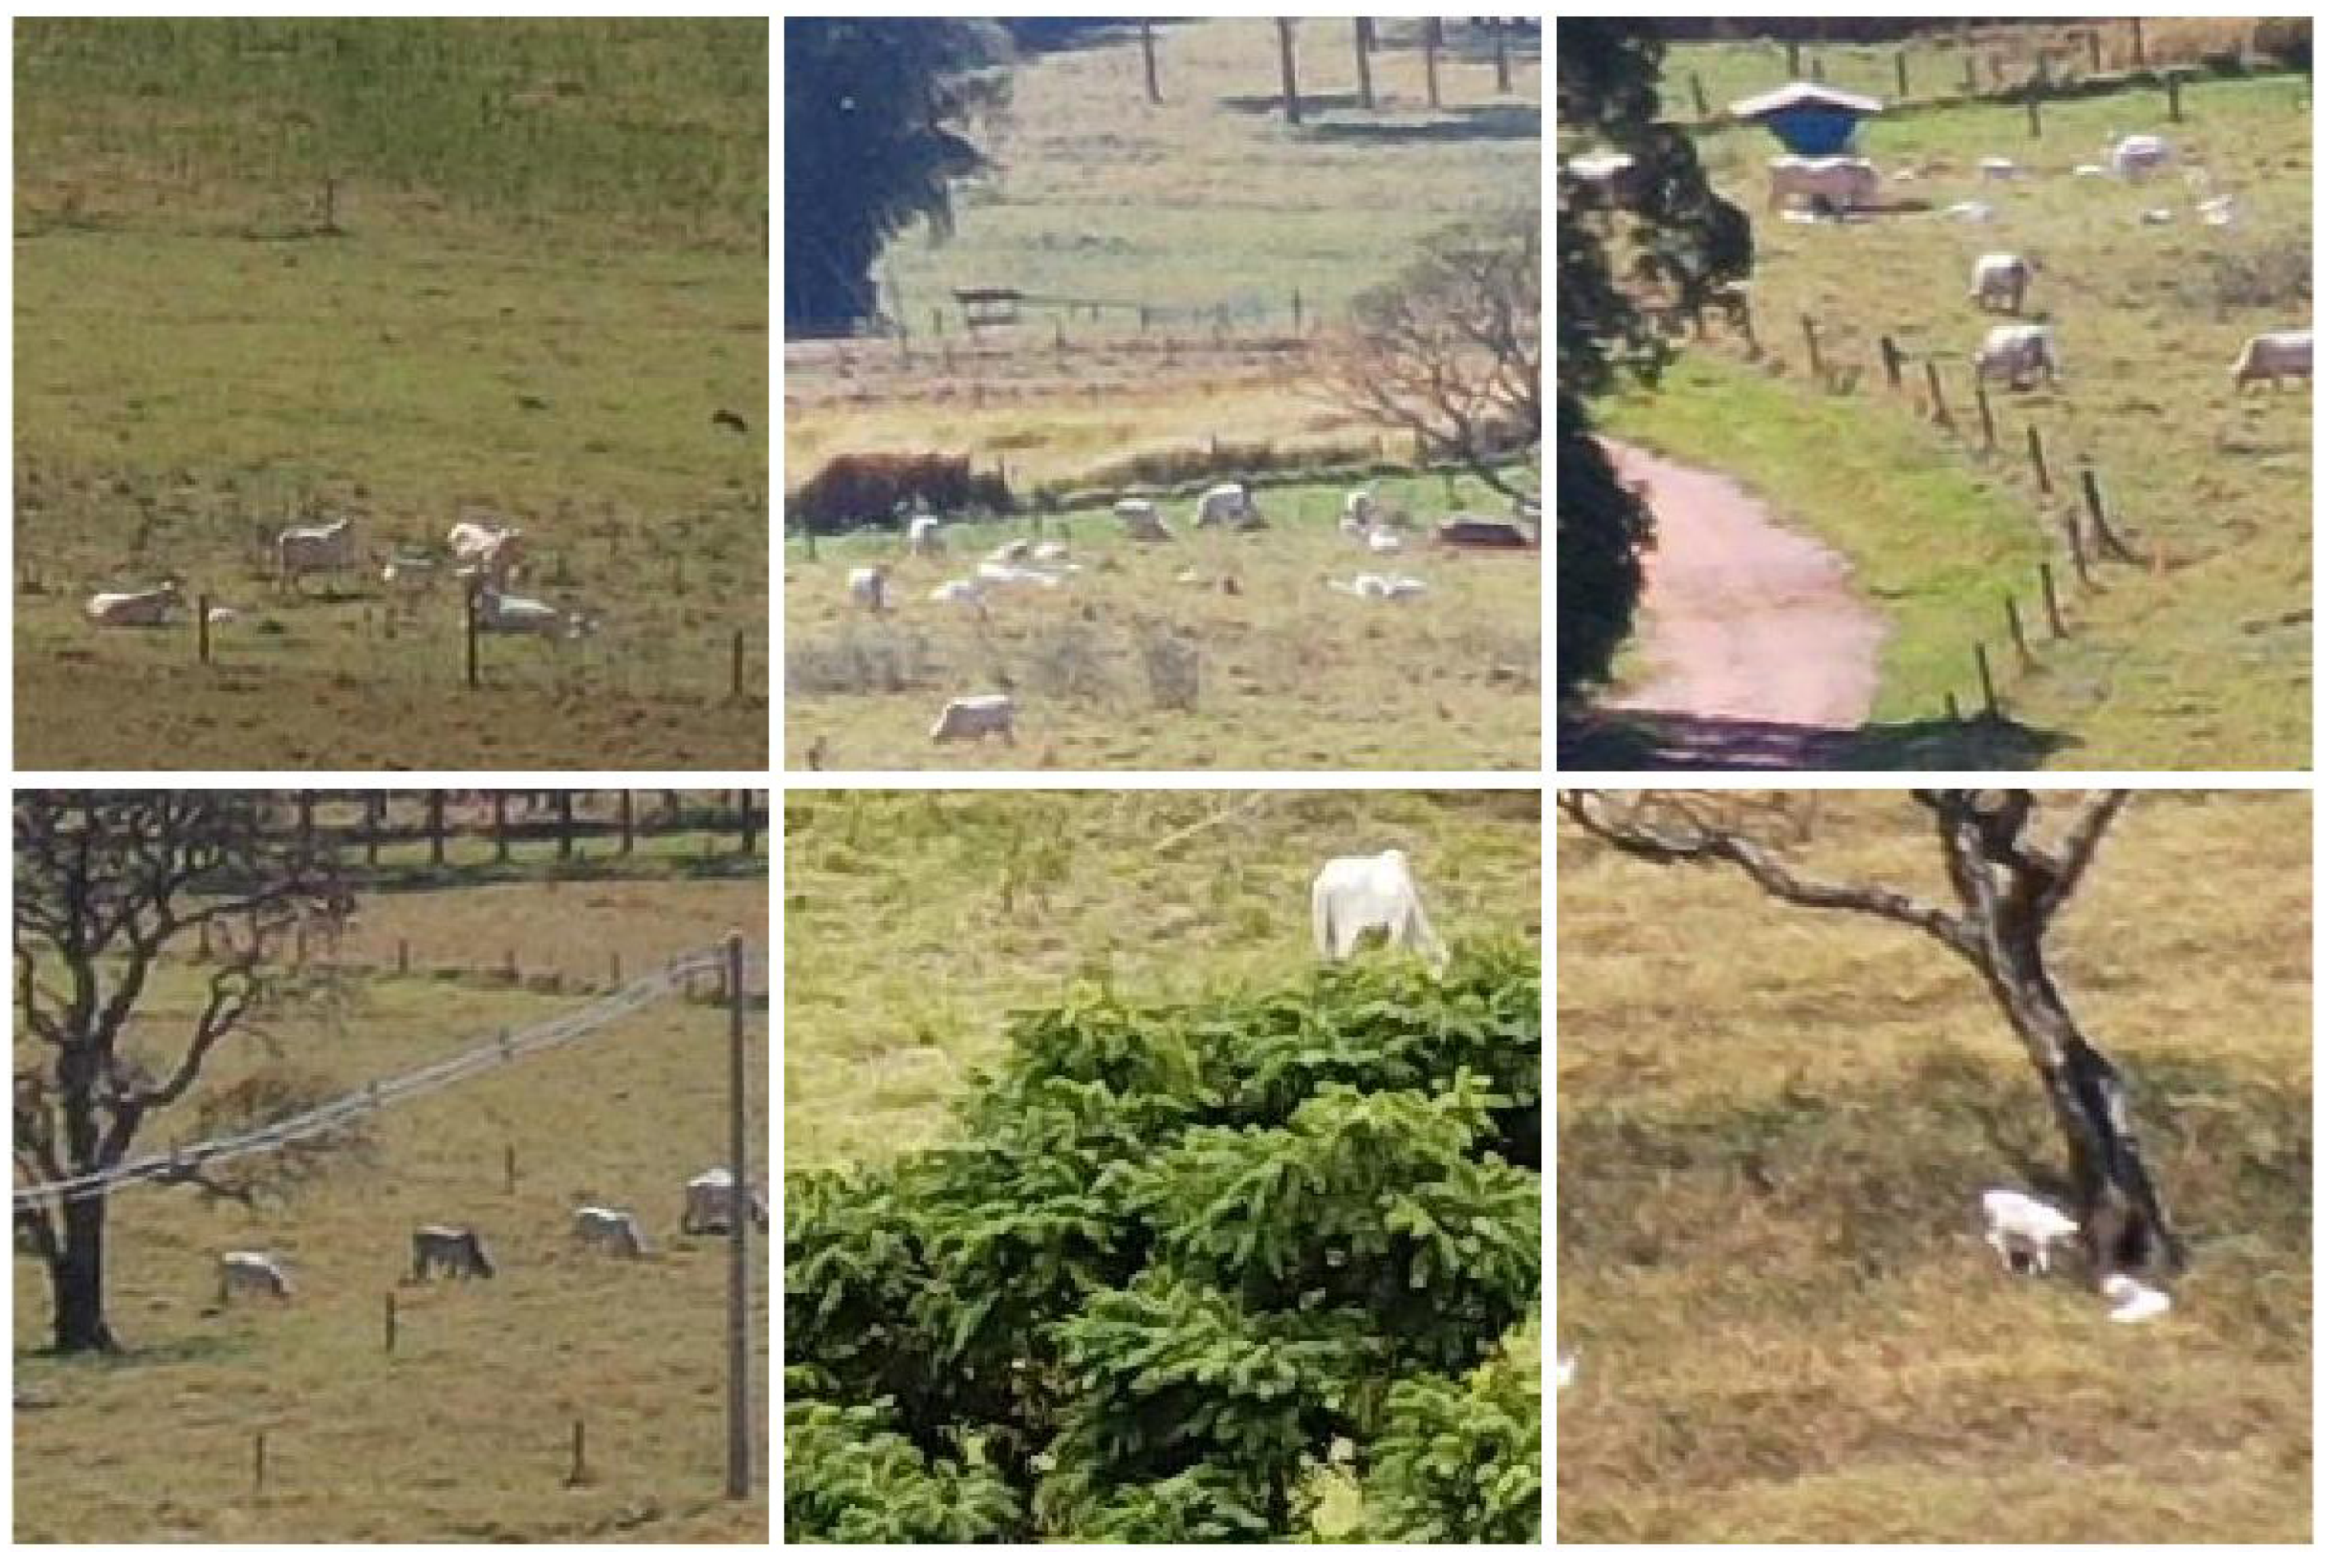
Figure 2.
Average confusion matrices crossing actual (rows) and estimated (columns) counts, given in percentages: cell (1,1) corresponds to the rate of true positives, cell (1,2) is the rate of false negatives, cell (2,1) is the rate of false positives, and cell (2,2) is the rate of true negatives. C and NC refer to the Cattle and Non-Cattle classes, respectively.


Table 1.
Datasets used in the experiments. The criteria used to select the samples in the “cattle” and “non-cattle” sets are described in the Experimental Setup Section.
Table 1.
Datasets used in the experiments. The criteria used to select the samples in the “cattle” and “non-cattle” sets are described in the Experimental Setup Section.
| Size | # Images in Each Cattle and Non-Cattle Classes |
|---|---|
| 224 × 224 | 276 |
| 112 × 112 | 856 |
| 56 × 56 | 1754 |
| 28 × 28 | 3530 |
| 14 × 14 | 8984 |
Table 2.
Distribution of animals and image blocks containing animals in each distance class. Although the number of animals is fairly evenly distributed among classes, the number of image blocks containing animals is much larger at closer distances. Animals located more than 250 m from the sensor could not be reliably detected and were not considered.
| Distance | % Total Number of Animals | % Total Number of Blocks with Animals |
|---|---|---|
| 30–50 m | 37 | 65 |
| 50–100 m | 20 | 18 |
| 100–250 m | 43 | 17 |
| over 250 m | - | - |
Table 3.
Results obtained for each image block size. Each cell shows the maximum (top, in red), average (middle, in black) and minimum (bottom, in blue) values through the ten repetitions (10-fold cross-validation).
Table 3.
Results obtained for each image block size. Each cell shows the maximum (top, in red), average (middle, in black) and minimum (bottom, in blue) values through the ten repetitions (10-fold cross-validation).
| Block Size | Accuracy | Precision | Recall | F1 Score |
|---|---|---|---|---|
| 224 × 224 | 0.87 | 0.92 | 0.87 | 0.87 |
| 0.85 | 0.85 | 0.85 | 0.85 | |
| 0.81 | 0.79 | 0.81 | 0.82 | |
| 112 × 112 | 0.87 | 0.87 | 0.95 | 0.87 |
| 0.85 | 0.84 | 0.87 | 0.85 | |
| 0.83 | 0.80 | 0.82 | 0.83 | |
| 56 × 56 | 0.85 | 0.84 | 0.90 | 0.86 |
| 0.84 | 0.82 | 0.88 | 0.85 | |
| 0.84 | 0.81 | 0.87 | 0.84 | |
| 28 × 28 | 0.85 | 0.82 | 0.91 | 0.85 |
| 0.83 | 0.80 | 0.89 | 0.84 | |
| 0.81 | 0.77 | 0.88 | 0.83 | |
| 14 × 14 | 0.71 | 0.70 | 0.78 | 0.71 |
| 0.67 | 0.65 | 0.76 | 0.70 | |
| 0.65 | 0.63 | 0.73 | 0.69 |
Table 4.
Recall values for each image block and distance class.
| Distance (m) | 224 × 224 | 112 × 112 | 56 × 56 | 28 × 28 | 14 × 14 |
|---|---|---|---|---|---|
| 30–50 | 0.88 | 0.89 | 0.9 | 0.89 | 0.72 |
| 50–100 | 0.82 | 0.86 | 0.86 | 0.89 | 0.72 |
| 100–250 | 0.76 | 0.8 | 0.84 | 0.87 | 0.75 |
Table 5.
Proportion (%) of animals completely missed for each image block and distance class.
| Distance (m) | 224 × 224 | 112 × 112 | 56 × 56 | 28 ×28 | 14 × 14 |
|---|---|---|---|---|---|
| 30–50 | 0 | 0 | 0 | 0 | 0 |
| 50–100 | 6 | 2 | 0 | 0 | 11 |
| 100–250 | 25 | 18 | 11 | 5 | 17 |
Publisher’s Note: MDPI stays neutral with regard to jurisdictional claims in published maps and institutional affiliations. |
© 2020 by the authors. Licensee MDPI, Basel, Switzerland. This article is an open access article distributed under the terms and conditions of the Creative Commons Attribution (CC BY) license (http://creativecommons.org/licenses/by/4.0/).
Share and Cite
MDPI and ACS Style
Barbedo, J.G.A.; Koenigkan, L.V.; Santos, P.M. Cattle Detection Using Oblique UAV Images. Drones 2020, 4, 75. https://doi.org/10.3390/drones4040075
AMA Style
Barbedo JGA, Koenigkan LV, Santos PM. Cattle Detection Using Oblique UAV Images. Drones. 2020; 4(4):75. https://doi.org/10.3390/drones4040075
Chicago/Turabian StyleBarbedo, Jayme Garcia Arnal, Luciano Vieira Koenigkan, and Patrícia Menezes Santos. 2020. "Cattle Detection Using Oblique UAV Images" Drones 4, no. 4: 75. https://doi.org/10.3390/drones4040075