Abstract
This article proposes a method of measuring wind speed using the data logged by the autopilot of a quadrotor drone. Theoretical equations from works on quadrotor control are utilized and supplemented to form the theoretical framework. Static thrust tests provide the necessary parameters for calculating wind estimates. Flight tests were conducted at a test site with laminar wind conditions with the quadrotor hovering next to a static 2D ultrasonic anemometer with wind speeds between 0–5 m/s. Horizontal wind estimates achieve exceptionally good results with root mean square error (RMSE) values between 0.26–0.29 m/s for wind speed, as well as between 4.1–4.9 for wind direction. The flexibility of this new method simplifies the process, decreases the cost, and adds new application areas for wind measurements.
1. Introduction
There are many options for measuring local wind velocity and turbulence, but most are either immovable, cumbersome, or expensive. In search of a more affordable and flexible option, several works have turned their attention to unmanned aerial vehicles (UAVs), since an airborne wind-measuring system can provide the desired flexibility which makes it ideal for certain applications. The proposed method could be useful in complex terrain where accessibility with a traditional anemometer is challenging, as well as in situations where affordability is an issue. For example, wind conditions could be locally mapped in detail for design purposes of buildings, bridges, or other infrastructures, or to model and predict the accumulation of snow in cities. While many researchers use fixed wing UAVs (, Reference [1,2,3]), others explore the possibilities of mounting an anemometer onto a multirotor drone (e.g., Reference [4,5]). Some, however, try to use the quadrotor itself as the measurement unit. Neumann and Bartholmai [6] were pioneers in estimating wind velocity using a quadrotor’s internal stabilization unit. By relating thrust, drag, and gravitational forces and conducting wind tunnel tests, they could estimate horizontal wind speeds. Palomaki et al. [5] applied the same idea but without using wind tunnels. Wolf et al. [4] also tried to correlate roll and pitch angles to wind speed and direction. Mazzatenta et al. [7] attempted to improve the accuracy of velocity estimates from a quadrotor’s inertial measurement unit (IMU) data by comparing measurements to those using Particle Image Velocimetry. Marino et al. [8] evaluated the possibility of using a measure of differential thrust for wind estimation, while Wang et al. [9] achieved wind estimates by considering wind as an acceleration disturbance of the rotorcraft. Gonzalez-Rocha et al. [10,11,12] based their wind-velocity estimation on aircraft motion models, and similar methods were applied by Müller et al. [13], Sikkel et al. [14], and Schiano et al. [15]. A recent study by Perozzi et al. [16] proposed a wind estimate using time-varying parameter estimation algorithms, together with a quadrotor’s IMU data.
Within the field of quadrotor control, the vehicle’s position or velocity is often estimated in order to improve the control algorithms. Allibert et al. [17] proposed a method of estimating the air velocity of a quadrotor in the body-fixed reference frame by designing an observer based on both aerodynamic theory and accelerometer data.
This paper, which is based on the author’s master thesis [18], utilizes those equations developed by Reference [17] and sets them in another context. By using the proposed equations together with measurements from sensors aboard the quadrotor, the quadrotor’s air velocity can be found and then transformed to the inertial reference frame. By then applying the wind triangle, an estimate of three-dimensional wind velocity can be found using only measurements of the quadrotor’s built-in sensors. This makes it an elegant and effective method for analyzing local wind conditions which can be used for assessing for example the wind energy potential. The largest benefit of the proposed method is that it makes it much easier to scan the wind conditions for a larger area, i.e., to find high laminar flow and avoid turbulence. The quadrotor can easily measure spatially distributed wind speed, which would be much harder to achieve with fixed masts and traditional anemometers. Furthermore, installing a mast or anemometer comes with much higher costs than using an off-the-shelf quadrotor.
The remainder of the paper is organized as follows: In Section 2, Method, the IRIS+ quadrotor is presented; aerodynamic equations, as well as the parameters and variables needed to solve them, are discussed; the experimental setup for a static thrust test and flight tests are explained; and the means of data processing are presented. Section 3 presents the results from the static thrust test, which provides some necessary parameters. The determination of the drag coefficient is explained, and the wind measurements and estimates from the flight tests are presented. In Section 4, the results from the flight tests are discussed and presented in comparison to values from the literature. Section 5 provides the conclusion and the Appendix A contains the nomenclature.
2. Method
2.1. The IRIS+ Quadrotor
The drone used for this article is the IRIS+ quadrotor from 3D Robotics (3DR) shown in Figure 1. The four brushless motors are equipped with propellers with a size and pitch of 9.5 inch and 4.5 inch respectively. The flight controller used in the IRIS+ is a 3DR Pixhawk Autopilot, which contains an assortment of sensors given in Table 1. In Loiter mode, the quadrotor holds its position based on Global Positioning System (GPS) and barometric altitude measurements. The data collected by the on-board sensors is stored in a log-file by the Pixhawk, which is accessed and analyzed post flight.
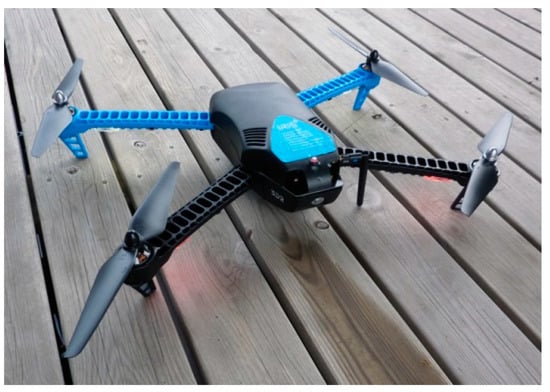
Figure 1.
3D Robotics (3DR) IRIS+ quadrotor. Photo: Simma.

Table 1.
List of sensors integrated in the Pixhawk [19].
2.2. Aerodynamic Equations
Equations (1)–(10), which derive from momentum theory, are based on the work of Allibert et al. [17]. This set of equations provides a method for calculating the quadrotor’s air velocity in the body-fixed reference frame as it is typically defined in aviation. By then transforming the air velocity to the inertial reference frame and further applying the wind triangle , an estimate for wind velocity can be achieved. The vehicle’s velocity relative to the ground is hereby found from GPS flight data. In order to solve the set of equations, a number of parameters and variables as listed in Table 2 and Table 3 need to be known or measured first. The variables listed as unknown are the ones the set of equations can be solved for.
Table 2.
Parameters needed to solve the set of equations.
Table 3.
Variables needed to solve the set of equations and unknown variables that the equations can be solved for.
The mass and total rotor disk area are easily found. The air density used is the value for atmospheric pressure and a temperature of 5° C [20], which is a reasonable assumption for Tromsø, Norway, during the test flight period. For the moment of inertia of the propeller , the simplifying assumption of a rod rotating around its centre is made. The lumped linear drag coefficient is found empirically from flight tests, which will be described in Section 3.2. The Figure of Merit (FoM) is an efficiency factor relating the mechanical power provided to the motor to the aerodynamic power created by the rotation of the propeller (Equation (8)). The FoM can be determined from a static thrust test, where both and are measured. The slope of a linear fit to the data then gives the Figure of Merit.
The accelerometer data is the only one of the needed variables which is directly measured by the quadrotor’s sensors. To find the propellers’ rotational velocity, its acceleration and the motor torque, a relation to other directly measured variables is established from a static thrust test.
2.3. Static Thrust Test
For the static thrust test, the RCbenchmark series 1580 thrust stand and dynamometer was used, which can measure thrust, motor torque, motor rotational velocity, battery voltage, current drawn from the battery, and pulse width modulated remote control inputs (RCOU values) simultaneously. The experimental setup is depicted in Figure 2.
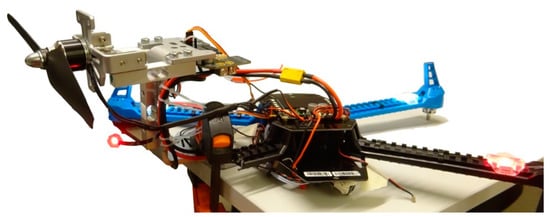
Figure 2.
Static thrust test setup with the RCbenchmark dynamometer. Photo: Simma.
2.4. Flight Tests
In order to find the lumped linear drag coefficient, and to test the method, flight tests were conducted with the quadrotor hovering close to a static anemometer providing reference measurements.
A two-dimensional WindSonic anemometer option 1 [21] from Gill Instruments measuring at 4 Hz was used. The resolution of the anemometer is given to be 0.01 m/s for wind speed and for wind direction, while the accuracy is given by for wind speed and for wind direction at a wind speed of 12 m/s.
Flight tests were conducted in Ramfjordmoen, a larger valley not far from Tromsø, Norway, on 27 April 2018. During each flight, the quadrotor was holding its position in Loiter mode until the battery’s charge was depleted (for about 8 minutes) at a horizontal distance of about 2 m from the anemometer and an altitude of about 3 m above ground. Care was taken to ensure that the quadrotor was not positioned in front of the anemometer, as seen by the wind, which was coming from a north-eastern direction. The used anemometer is intended to measure two horizontal components of wind velocity. Therefore, the validity of the wind estimates could only be verified in the horizontal and direction, even though the proposed method gives a three-dimensional wind estimate.
2.5. Data Processing
The in-flight measurements stem from different sensors, which log their data at different rates and at different points in time onto the autopilot’s logfile. Therefore, all data was separated into 0.5 s time bins over which the data was averaged to ensure uniform time vectors. No further filters were applied for calculating the wind estimate.
3. Results
3.1. Static Thrust Test
Figure 3 and Figure 4 show the findings of the static thrust test. The Figure of Merit is found from the linear fit in Figure 3 to be 0.6072, while the rotational velocity and motor torque are related to the electrical power via Equations (11) and (12) respectively based on the fits in Figure 4. The rotational acceleration is then found by taking a time derivative of the rotational velocity.
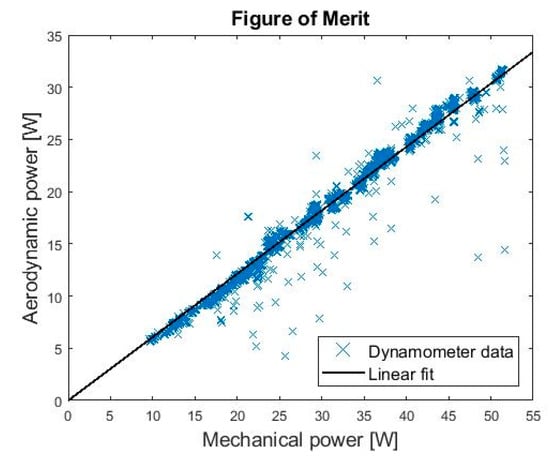
Figure 3.
Plot of aerodynamic power over mechanical power. The slope of the linear fit is the Figure of Merit (FoM).
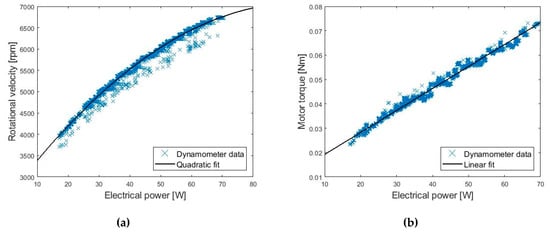
Figure 4.
(a) Rotational velocity over electrical power with a quadratic fit laid to the measurements. (b) Torque over electrical power a linear fit laid to the measurements.
Furthermore, the current drawn by the one motor in the static thrust test is not the same as the current measured in flight, where four motors are active. Therefore, a mathematical model is created from the static thrust measurements relating the current drawn by one motor to the battery voltage V and the RCOU value, both of which are measurable variables in flight. Thus, via Equations (13)–(15) the current drawn by one motor can be determined from flight measurements, providing a measure of electrical power needed for the relations (11) and (12).
3.2. Drag Coefficient
In order to determine the last parameter, the drag coefficient, the results of seven test flights were considered. For those flights, very similar wind conditions at the site of the anemometer and the quadrotor were to be expected, making the estimates and measurements comparable. The quadrotor wind estimate, based on the theoretical equations and the parameters and variables found in the static thrust test and measured in flight, was compared to the anemometer measurements. The drag coefficient was then modified to find the best agreement between the estimate and measurements. A coefficient of
was determined.
3.3. Flight Tests
Figure 5 shows the quadrotor wind estimates compared to the anemometer measurements for two test flights which were conducted in the Ramfjordmoen valley in Norway, where the wind conditions are laminar. For both flights, a very good correlation between the estimates and measurements is seen.
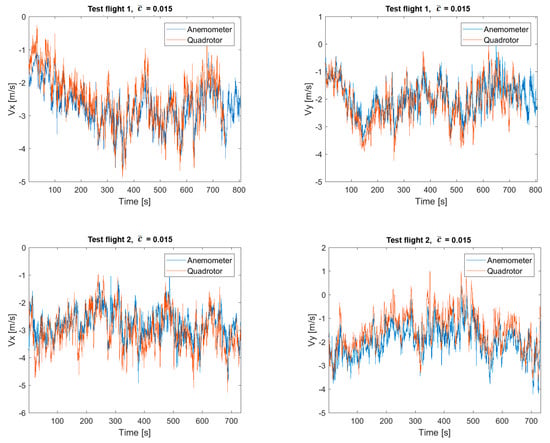
Figure 5.
Wind measurements done in Ramfjordmoen. The quadrotor estimate is shown in red, the anemometer measurements in blue. indicates the wind velocity in the north-south direction, while denotes the east-west direction.
4. Discussion
To quantify the results, they were transformed to polar coordinates and root mean square errors (RMSEs) were calculated for wind speed and wind direction, which are listed in Table 4. This was done both for the results binned in 0.5 s intervals, as well as after the application of a 10 s moving average filter (MAF). Figure 6 shows the results of one of the flights transformed to polar coordinates with and without the application of the 10 s MAF.
Table 4.
Root mean square error (RMSE) values of the wind estimates expressed for wind speed and wind direction.
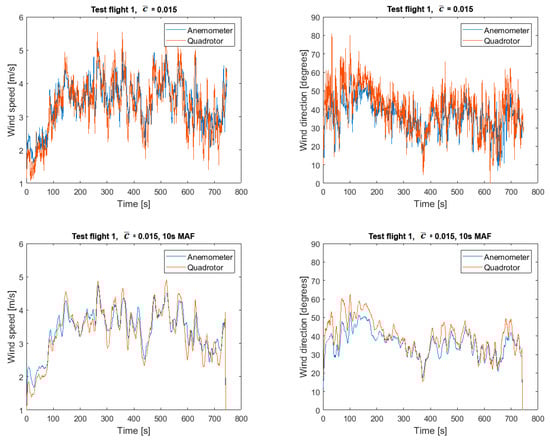
Figure 6.
Results from test flight 1 conducted in Ramfjordmoen transformed to polar form. Top: Data binned in 0.5 s intervals. Bottom: Data treated with a 10 s moving average filter (MAF).
As is to be expected, the RMSE values for the data averaged in 0.5 s bins are larger than the values calculated after the application of the 10 s MAF as a result of noise and slight time deviations between the quadrotor estimate and the anemometer measurements. The RMSE value for wind speed lies between 0.49–0.56 m/s for the binned data and between 0.26–0.29 m/s for the 10 s average. The values for wind direction lie between 8.9–10.6 for the binned data and between 4.1–4.9 for the 10 s average.
Table 5 compares these results to the values found by Neumann and Bartholmai [6] and Palomaki et al. [5]. Both works experienced comparable wind speeds between 0–5 m/s during their test flights. The estimates found in this paper from the flights in Ramfjordmoen achieve the best RMSE values for both wind speed and direction compared to the two other works. This shows the applicability of this method for horizontal wind velocities.
Table 5.
RMSE values of the wind estimates expressed for wind speed and wind direction compared to results from the literature [5,6].
It should be noted that the presented two test flights are included in a set of seven test flights used to determine the drag coefficient, which might result in a certain bias. Further testing with independent flights would be desirable to further prove the method.
Additionally, Equations (1)–(10) are based on assumptions which are valid for slowly moving quadrotors (< 10 m/s). This means that the proposed method is limited to low wind speeds, less than 10 m/s. Further experiments should be conducted to determine the upper limit of wind speed for which the method provides accurate estimates.
5. Conclusions
A method for measuring wind velocity with a quadrotor based on aerodynamic equations and in-flight measurements was proposed. Parameters for the used quadrotor and viable relations between variables were found via a static thrust test. The practicability of the method was tested by conducting several test flights with an anemometer mounted close by.
The horizontal wind estimates were very promising with RMSE values of the 10 s moving average filtered data of between 0.26–0.29 m/s for wind speed and between 4.1–4.9° for wind direction. These values are much better compared to what was found in the literature.
To conclude, although further work needs to be put into additional test flights and upgrading some of the equipment, this article shows the potential of the proposed measuring method to give very good wind estimates. Easy assessments of the wind potential is crucial for the development of wind energy. The wind estimates can also be post processed into turbulence estimates which further extends the application areas of the method.
Author Contributions
Conceptualization, M.S. and T.B.; Data curation, M.S.; Formal analysis, M.S.; Funding acquisition, T.B.; Investigation, M.S. and H.M.; Methodology, M.S.; Project administration, M.S. and T.B.; Resources, M.S., H.M. and T.B.; Software, M.S.; Supervision, H.M. and T.B.; Validation, M.S., H.M. and T.B.; Visualization, M.S.; Writing—original draft, M.S.; Writing—review & editing, H.M. and T.B.. All authors have read and agreed to the published version of the manuscript.
Funding
This research received no external funding
Conflicts of Interest
The authors declare no conflict of interest.
Appendix A: Nomenclature
Vectors are denoted with overhead arrows, while scalars are simple italic letters. An overhead dot symbolizes a time derivative. The subscripts x, y, and z denote vector components in the body fixed reference frame.
| Air density | [kg/m3] | |
| Motor torque | [Nm] | |
| Rotational velocity of rotor | [rad/s] | |
| Rotor acceleration | [rad/s2] | |
| Total rotor disk area of 4 propellers | [m2] | |
| Specific acceleration | [m/s2] | |
| Lumped linear drag coefficient | ||
| Intercept of linear fit | [A] | |
| Unit vector in z-direction in BFF | ||
| Figure of merit | ||
| Horizontal force induced by rotors | [N] | |
| Moment of inertia of rotor blade | [kg m2] | |
| Motor current drawn by one motor | [A] | |
| Inclination of linear fit | [A/V] | |
| Mass of the drone | [kg] | |
| Aerodynamic power | [W] | |
| Electrical power | [W] | |
| Power in horizontal force | [W] | |
| Mechanical power applied to rotor | [W] | |
| Power needed to rotate propeller | [W] | |
| Power in thrust | [W] | |
| Thrust force | [N] | |
| Absolute value of induced velocity minus air velocity | [m/s] | |
| Battery voltage | [V] | |
| Air velocity | [m/s] | |
| Induced velocity | [m/s] | |
| Ground velocity | [m/s] | |
| Wind velocity | [m/s] |
References
- Pachter, M.; Ceccarelli, N.; Chandler, P. Estimating MAV’s Heading and the Wind Speed and Direction Using GPS, Inertial, and Air Speed Measurements. In Proceedings of the AIAA Guidance, Navigation and Control Conference and Exhibit, Honolulu, HI, USA, 18–21 August 2008; American Institute of Aeronautics and Astronautics: Honolulu, HI, USA, 2008. [Google Scholar]
- Chan, W.L.; Lee, C.S.; Hsiao, F.B. Real-time approaches to the estimation of local wind velocity for a fixed-wing unmanned air vehicle. Meas. Sci. Technol. 2011, 22, 105203. [Google Scholar] [CrossRef]
- Palanthandalam-Madapusi, H.J.; Girard, A.; Bernstein, D.S. Wind-field reconstruction using flight data. In Proceedings of the 2008 American Control Conference, Seattle, WA, USA, 11–13 June 2008; pp. 1863–1868. [Google Scholar]
- Wolf, C.A.; Hardis, R.P.; Woodrum, S.D.; Galan, R.S.; Wichelt, H.S.; Metzger, M.C.; Bezzo, N.; Lewin, G.C.; de Wekker, S.F.J. Wind data collection techniques on a multi-rotor platform. In Proceedings of the 2017 Systems and Information Engineering Design Symposium (SIEDS), Charlottesville, VA, USA, 28 April 2017; pp. 32–37. [Google Scholar]
- Palomaki, R.T.; Rose, N.T.; van den Bossche, M.; Sherman, T.J.; De Wekker, S.F.J. Wind Estimation in the Lower Atmosphere Using Multirotor Aircraft. J. Atmos. Ocean. Technol. 2017, 34, 1183–1191. [Google Scholar] [CrossRef]
- Neumann, P.P.; Bartholmai, M. Real-time wind estimation on a micro unmanned aerial vehicle using its inertial measurement unit. Sens. Actuators Phys. 2015, 235, 300–310. [Google Scholar] [CrossRef]
- Mazzatenta, M.; Carter, D.; Daniel, Q. APS -72nd Annual Meeting of the APS Division of Fluid Dynamics—Event—Using quadrotor IMU data to estimate wind velocity. In Proceedings of the Bulletin of the American Physical Society; American Physical Society, Seatlle, WA, USA, 25 November 2019; Volume 64. Number 13. [Google Scholar]
- Marino, M.; Fisher, A.; Clothier, R.; Watkins, S.; Prudden, S.; Leung, C.S. An Evaluation of Multi-Rotor Unmanned Aircraft as Flying Wind Sensors. Int. J. Micro Air Veh. 2015, 7, 285–299. [Google Scholar] [CrossRef]
- Wang, J.-Y.; Luo, B.; Zeng, M.; Meng, Q.-H. A Wind Estimation Method with an Unmanned Rotorcraft for Environmental Monitoring Tasks. Sensors 2018, 18, 4504. [Google Scholar] [CrossRef] [PubMed]
- Gonzalez-Rocha, J.; Woolsey, C.A.; Sultan, C.; de Wekker, S.; Rose, N. Measuring Atmospheric Winds from Quadrotor Motion. In Proceedings of the AIAA Atmospheric Flight Mechanics Conference, Grapevine, TX, USA, 9–13 January 2017. [Google Scholar]
- Gonzalez-Rocha, J.; Woolsey, C.A.; Sultan, C.; De Wekker, S.F. Model-based Wind profiling in the Lower Atmosphere with Multirotor UAS. In Proceedings of the AIAA Scitech 2019 Forum, San Diego, CA, USA, 7–11 January 2019. [Google Scholar]
- González-Rocha, J.; De Wekker, S.F.J.; Ross, S.D.; Woolsey, C.A. Wind profiling in the lower atmosphere from wind-induced perturbations to multirotor UAS. Sensors 2020, 20, 1341. [Google Scholar] [CrossRef] [PubMed]
- Müller, K.; Crocoll, P.; Trommer, G.F. Wind estimation for a quadrotor helicopter in a model-aided navigation system. In Proceedings of the 22nd Saint Petersburg International Conference on Integrated Navigation Systems, Saint Petersburg, Russia, 25–27 May 2015; pp. 45–48. [Google Scholar]
- Sikkel, L.N.C.; de Croon, G.C.H.E.; De Wagter, C.; Chu, Q.P. A novel online model-based wind estimation approach for quadrotor micro air vehicles using low cost MEMS IMUs. In Proceedings of the 2016 IEEE/RSJ International Conference on Intelligent Robots and Systems (IROS), Daejeon, South Korea, 9–14 October 2016; pp. 2141–2146. [Google Scholar]
- Schiano, F.; Alonso-Mora, J.; Rudin, K.; Beardsley, P.; Siegwart, R.; Sicilianok, B. Towards estimation and correction of wind effects on a quadrotor UAV. In Proceedings of the IMAV 2014: International Micro Air Vehicle Conference and Competition 2014, Delft, The Netherlands, 12–15 August 2014; pp. 134–141. [Google Scholar]
- Perozzi, G.; Efimov, D.; Biannic, J.-M.; Planckaert, L. Using a Quadrotor as Wind Sensor: Time-Varying Parameter Estimation Algorithms. Int. J. Control. 2020, 1–20. [Google Scholar] [CrossRef]
- Allibert, G.; Abeywardena, D.; Bangura, M.; Mahony, R. Estimating body-fixed frame velocity and attitude from inertial measurements for a quadrotor vehicle. In Proceedings of the 2014 IEEE Conference on Control Applications (CCA), Juan Les Antibes, France, 8–10 October 2014; pp. 978–983. [Google Scholar]
- Simma, M. Measuring Wind Using the Internal Stabilisation System of a Quadrotor Drone. Master’s Thesis, UiT The Arctic University of Norway, Tromsø, Norway, 2018. [Google Scholar]
- 3DR Pixhawk 1·PX4 v1.9.0 User Guide. Available online: https://docs.px4.io/v1.9.0/en/flight_controller/pixhawk.html (accessed on 8 June 2020).
- Air—Density, Specific Weight and Thermal Expansion Coefficient at Varying Temperature and Constant Pressures. Available online: https://www.engineeringtoolbox.com/air-density-specific-weight-d_600.html (accessed on 8 June 2020).
- Gill Instruments Limited. WindSonic User Manual—Ultrasonic Anemometer; Gill Instruments Limited: Lymington, Hampshire, UK, 2015. [Google Scholar]
© 2020 by the authors. Licensee MDPI, Basel, Switzerland. This article is an open access article distributed under the terms and conditions of the Creative Commons Attribution (CC BY) license (http://creativecommons.org/licenses/by/4.0/).