Article

Evaluating the Efficacy and Optimal Deployment of Thermal Infrared and True-Colour Imaging When Using Drones for Monitoring Kangaroos

by
Elizabeth A. Brunton
1,*,
Javier X. Leon
1,2 and
Scott E. Burnett
1,2
1
School of Science and Engineering, University of the Sunshine Coast, Sippy Downs, QLD 4556, Australia
2
Global-Change Ecology Research Group, School of Science and Engineering, University of the Sunshine Coast, Sippy Downs, QLD 4556, Australia
*
Author to whom correspondence should be addressed.
Drones 2020, 4(2), 20; https://doi.org/10.3390/drones4020020
Submission received: 29 April 2020 / Revised: 22 May 2020 / Accepted: 25 May 2020 / Published: 27 May 2020
(This article belongs to the Special Issue She Maps)

Abstract

:
Advances in drone technology have given rise to much interest in the use of drone-mounted thermal imagery in wildlife monitoring. This research tested the feasibility of monitoring large mammals in an urban environment and investigated the influence of drone flight parameters and environmental conditions on their successful detection using thermal infrared (TIR) and true-colour (RGB) imagery. We conducted 18 drone flights at different altitudes on the Sunshine Coast, Queensland, Australia. Eastern grey kangaroos (Macropus giganteus) were detected from TIR (n=39) and RGB orthomosaics (n=33) using manual image interpretation. Factors that predicted the detection of kangaroos from drone images were identified using unbiased recursive partitioning. Drone-mounted imagery achieved an overall 73.2% detection success rate using TIR imagery and 67.2% using RGB imagery when compared to on-ground counts of kangaroos. We showed that the successful detection of kangaroos using TIR images was influenced by vegetation type, whereas detection using RGB images was influenced by vegetation type, time of day that the drone was deployed, and weather conditions. Kangaroo detection was highest in grasslands, and kangaroos were not successfully detected in shrublands. Drone-mounted TIR and RGB imagery are effective at detecting large mammals in urban and peri-urban environments.

Graphical Abstract

1. Introduction

Improvements in sensor technology and an increase in the availability of unmanned aircraft systems (drones), have led to widespread interest in their potential use in monitoring wildlife, in both terrestrial and marine ecosystems. Drones provide the potential for significant advances in wildlife monitoring at high spatial (sub-meter) and temporal (hours-days) resolutions when compared to ground surveys [1]. Additionally, drones offer a more cost-efficient alternative to surveys using manned aircraft over moderate spatial extents (~200 Ha), improved safety for personnel, and increased repeatability and permanence of data [1,2,3]. Despite the potential benefits, some challenges for effective wildlife surveys using drones remain. These include: legislation, effects on animals, automated detection, particularly when dealing with cryptic or highly mobile species, and optimal mission planning [4,5,6,7,8,9].
The use of thermal (TIR) imagery in wildlife management is not a new idea. Yet, recent advances in image analysis, and reductions in the price and accessibility of thermal cameras, have led to a renewed interest in drone-based TIR imaging in wildlife surveys [10,11,12,13]. Successful TIR imaging of wildlife is dependent on a detectable difference in temperature between the study animal and the ground surface. Therefore, there are many important considerations including: properties of selected sensor and lens, atmospheric conditions, distance between sensor and animal, the time of surveys (which affect sun angle and air and land surface temperatures), vegetation structure, land surface emissivity/reflectivity, and insulating properties of target animals [13,14,15].
The potential of wildlife aerial surveys using TIR imagery has been evidenced by many studies. For example, a study using drone-based true-colour (RGB) imagery and TIR imagery to detect white-tailed deer (Odocoileus virginianus) [16] assessed the effect of image classification on successful detection and reported an average detection rate of 0.5 using an object-based image analysis by using a combination of visible and thermal imagery. Seymour et al. [17] estimated seal counts using TIR imagery, with automated counts of 95%–98% of human estimates. Their classification approach used the temperature, size, and shape of thermal signatures to effectively recognize seals in aggregations. However, there is no consensus view on whether TIR imagery allows for better detection than RGB imagery. For example, Gillette et al. [10] compared aerial infrared and ground-based counts of prairie grouse (Tympanucus spp.), finding no significant difference in average counts between methods; the authors recommended the potential of using thermal imagery for aerial surveys in areas not accessible by foot. More recently, Lethbridge et al. [18] compared population estimates of kangaroos using manned aircraft aerial surveys with TIR, RGB video, and human observers. They found a difference in population estimates between the survey methods, primarily determined by vegetation type and time of day.
Optimal mission planning, including choice of drone/sensor deployment parameters, is vital for efficient and accurate animal detection, and to assess availability bias in different habitats and under different environmental conditions [11,19]. Recently, Schroeder et al. [3] evaluated the influence of drone flight pattern, height, and speed on the behaviour and counts of guanacos (Lama guanicoe) and found that drone height and speed altered the behaviour, and the size of the guanaco (i.e., adult or juvenile) influenced count success using RGB imagery. Burke et al. [13] proposed several steps to plan optimal missions using TIR imagery based on landscape thermal contrast. These include prior calculations to take into account target species body size, predicted weather conditions, camera angle, and drone flight height. There is a need for an improved understanding of which factors most influence the successful detection of wildlife, and that must be considered when planning drone deployments for research or natural resource management purposes.
The Eastern grey kangaroo (Macropus giganteus), a large macropodid endemic to Australia, has a biological range which encompasses much of the eastern part of Australia. Aerial surveys of kangaroos are carried out using manned aircraft to inform the commercial harvesting of macropods. However, these surveys are mostly limited to rural areas. We tested the feasibility of monitoring eastern grey kangaroos in urban and peri-urban environments using drone-based TIR and RGB distortion-free imagery, hereafter referred to as orthomosaics. The aims of the study were to determine: i) optimal drone flight height regarding accurate detection of kangaroos, ii) what environmental conditions result in the greatest accuracy in drone-based detection, and iii) if optimal flight parameters were different for TIR and RGB orthomosaics.

2. Materials and Methods

2.1. Study Area

Flights were conducted over three study sites on the sub-tropical Sunshine Coast, Queensland, Australia. The primary study site was located on the campus of the University of the Sunshine Coast (USC) in Sippy Downs (26°43′01″ S, 153°03′56″ E). The 100-hectare campus is an urban environment and consists of a matrix of buildings, paved areas, maintained gardens, lawns, sports fields, open eucalypt regrowth, rank grassland and heathlands (Figure 2a). Two additional study sites were located in Weyba Downs. Weyba 1 is located in the Lake Weyba Bushland reserve (26°27′28″ S, 153°03′50″ E) and the vegetation on site is dominated by coastal heath with patches of open eucalypt forest. Weyba 2 is a peri-urban private property (26°26′16″ S, 153°03′44″ E) with vegetation on site dominated by coastal heath, open eucalypt forest, and small areas of mowed grass lawns (Figure 2b). All sites were at a height between 10 and 15 m above sea level. Kangaroo populations in and around the study areas have declined in recent years [20] and kangaroo mob sizes at all three sites were low (1–17) during the study period, with an average group size of four.

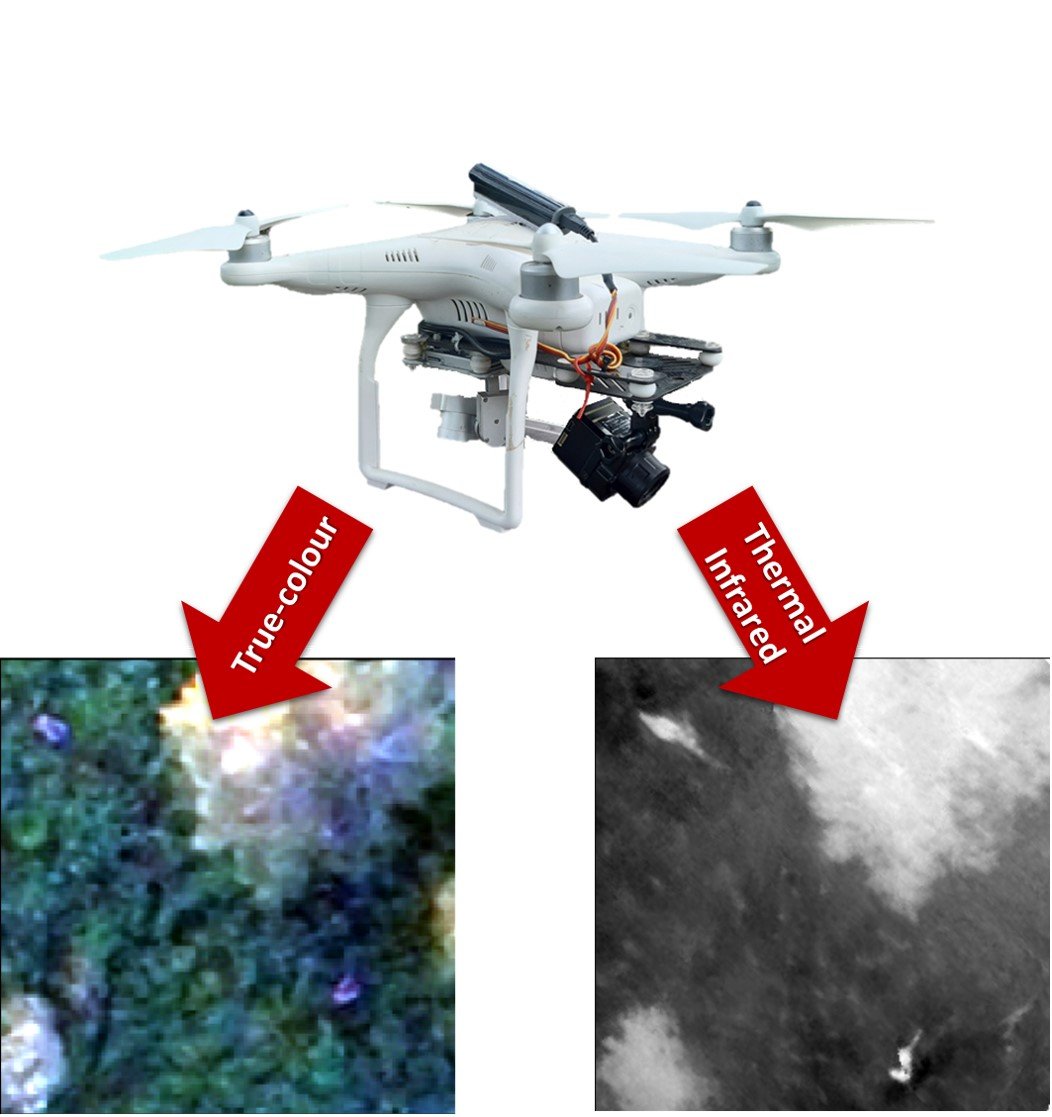
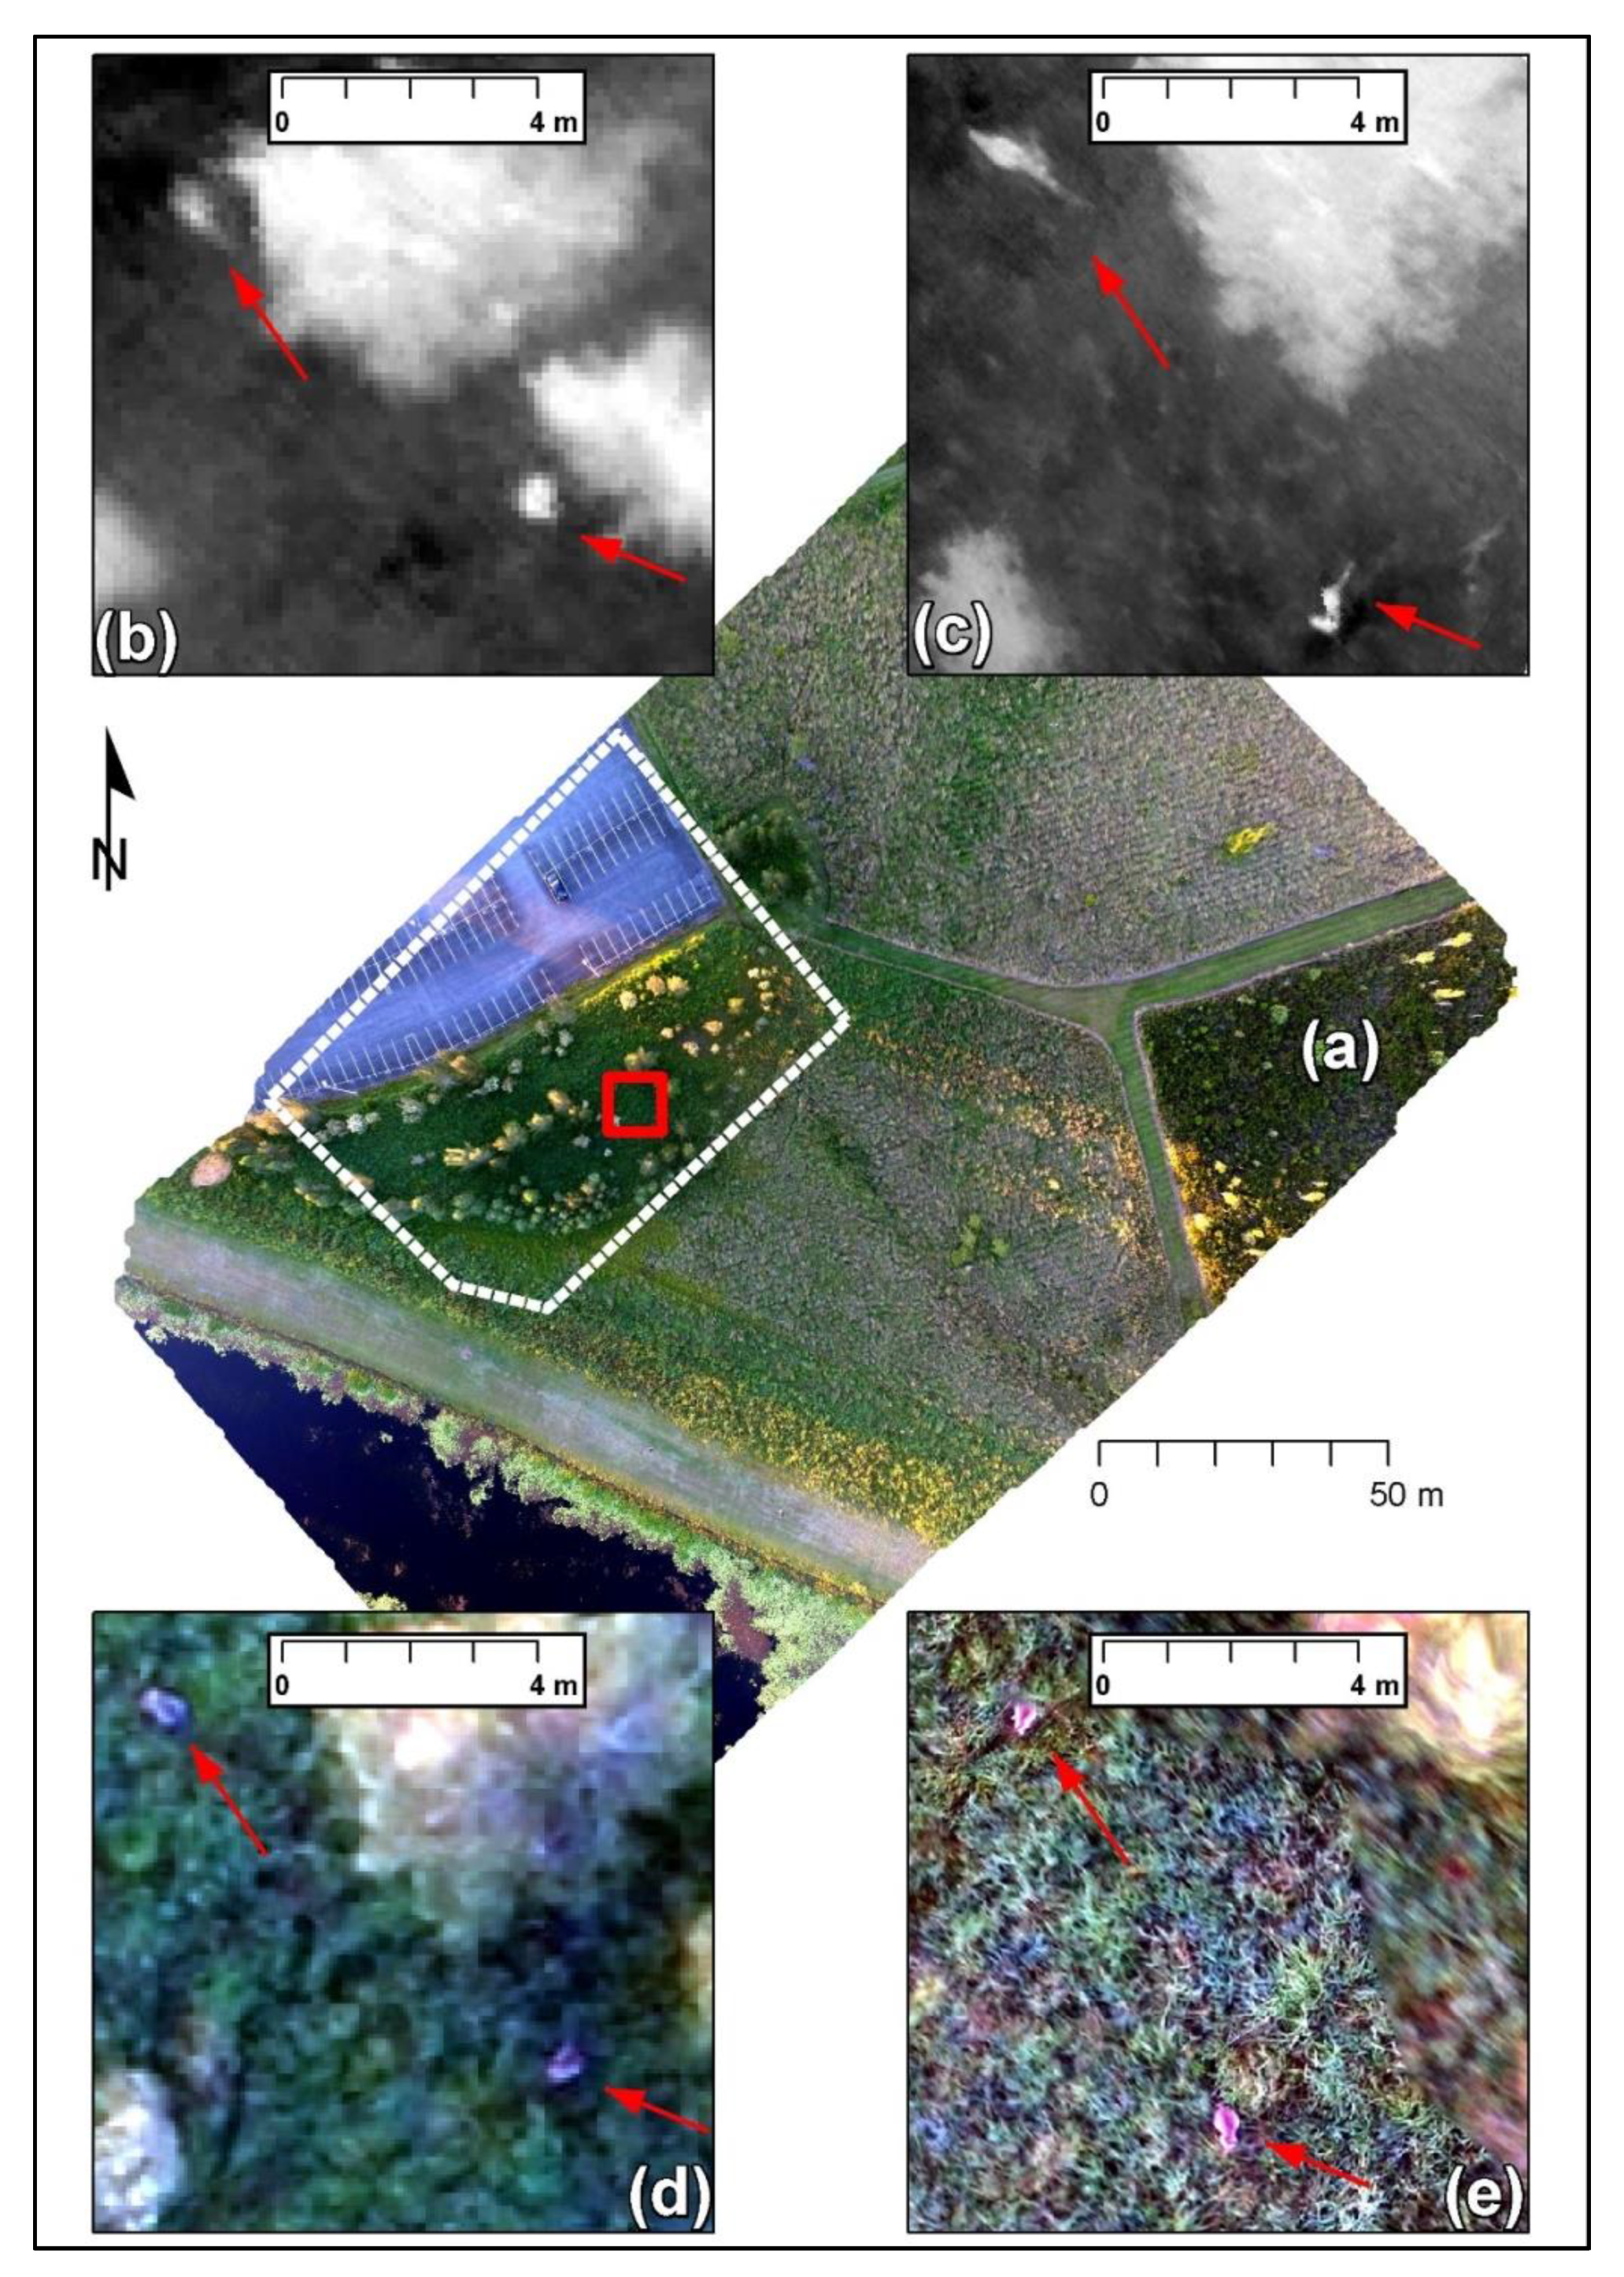
2.2. Field Data Collection

Imagery was collected simultaneously using a DJI Phantom 3 Advanced drone’s true-colour (RGB) camera and a Flir Vue Pro R (FVP) thermal infrared sensor fitted on a custom carbon fibre cradle with two pairs of rubber shock absorbers to reduce vibrations (Figure 1). The total weight of the drone and payload was below 2 kg. The RGB camera has a 1/2.3” Complementary metal–oxide–semiconductor (CMOS) sensor with 12.4 MP resolution and 20 mm (35 mm lens equivalent) focal length with 81° × 66° field of view. The FVP radiometric sensor captures the spectral band ranging of 7.5–13.5 µm at 640 × 512 pixel resolution and has a 19 mm (35 mm lens equivalent) focal length with 32° x 26° field of view. Nadir RGB images were taken every 2 seconds and near-nadir (5° tilt) radiometric TIR images were taken every second. Emissivity (typical value of 0.98), sky conditions (cloudy, partial cloud or clear), air temperature, humidity (low—30%, medium—50%, or high—60%) and target range were specified every TIR imagery collection but no further calibration was undertaken to obtain absolute temperatures. However, advanced geostatistical techniques can be used to estimate environmental variables at unknown locations based on sparsely available data [21,22]. The extra payload resulted in a reduction of flight time per battery from ~20 minutes to ~12 minutes.
We conducted 18 drone flights between May 2017 and January 2018 at various times of day during daylight hours, and in various habitats, in order to assess the factors that may influence successful detection. Surveyed areas were relatively small (< 2 Ha), and number of kangaroos low (< 20). All flights were classified as standard operation conditions as per the Civil Aviation Safety Authority (CASA). Immediately prior to each drone deployment, sites were searched on foot with the aid of binoculars to locate kangaroos. The numbers recorded were considered accurate as kangaroos were habituated to human presence on all sites and did not flee on approach. Therefore, a thorough search on foot of the sites was possible. Once kangaroos were located and stationary and observers were in place, the drone was launched 50–100 m away from the target kangaroos. The same observers monitored the movement of kangaroos throughout drone deployment, and noted if and when kangaroos moved or left the search area.
The following flying protocol was used: The drone ascended to 120m and was flown manually in a “lawn-mower” pattern over the target kangaroos. The live feed of the RGB camera was used to ensure that target kangaroos also remained within the FVP sensor’s field of view. The drone then descended to 100, 60, and 30 m heights repeating the same pattern at each level. On three occasions, the drone was flown at 50 and 70 m instead of 30 and 60 m due to complex terrain. The minimum height of 30 m over kangaroos was chosen to minimise disturbance [5]. Speed was kept to a maximum of 10 m/s at 120 m and 3 m/s at 30 m to warrant at least 80% forward and 60% side overlap between images from both sensors. Total average flying time was 8 minutes.
For each deployment, we recorded ambient temperature (°C) and weather conditions (fine, part cloud, full cloud). We categorised the time of day as Early AM (05:01–08:00), Late AM (08:01–11:00), Midday (11:01–14:00), and PM (14:01–17:30). We also recorded the vegetation type and classified it into four broad categories: short grass; long grass; shrub (< 2m); and forest (> 2m). The short grass habitat included mowed lawn areas and sporting fields, while long grass was mostly grassland dominated by Setaria sp. at heights of between 1 and 1.5 m. Shrub habitat consisted of coastal heath vegetation while the forest habitat was predominantly open eucalypt forest (Figure 2).

2.3. Image Processing

TIR images acquired with the FVP sensor were geotagged using ExifTool software (https://sourceforge.net/projects/exiftool/), based on synchronised RGB image’s timestamps and associated coordinates. Coordinates were measured using the drone internal GPS with an approximately horizontal precision of 5 m. Height was based on the drone’s internal barometer with an approximately vertical precision of 1 m (subject to environmental conditions). Both the TIR and RGB images from 18 flights at different heights were automatically stitched together using Structure-from-Motion algorithms within Photoscan v1.3 software (www.Agisoft.com). Agisoft Photoscan uses a feature matching detection algorithm and bundle adjustment algorithms to automatically orient overlapping images (based on geotags) and reconstruct dense 3D coloured point clouds from the imagery. Point clouds were meshed and digital terrain models and orthomosaics were derived at varying spatial resolutions according to height and respective ground sampling distances (Table 1). Finally, all orthomosaics were exported as GeoTIF files for manual analysis.
Image analysis of each TIR and RGB orthomosaic (Figure 3) involved a researcher experienced in aerial image interpretation counting the number of kangaroos visible by eye for all orthomosaics. Counts were undertaken once per orthomosaic on a screen at fixed scales of 1:50, 1:100, 1:150, and 1:200 for the 30, 60, 100, and 120 m heights, respectively. For each drone deployment, we compared the number of kangaroos identified during the manual image analysis, with those counted by the same on-foot observers (i.e., minimum number known to be present).

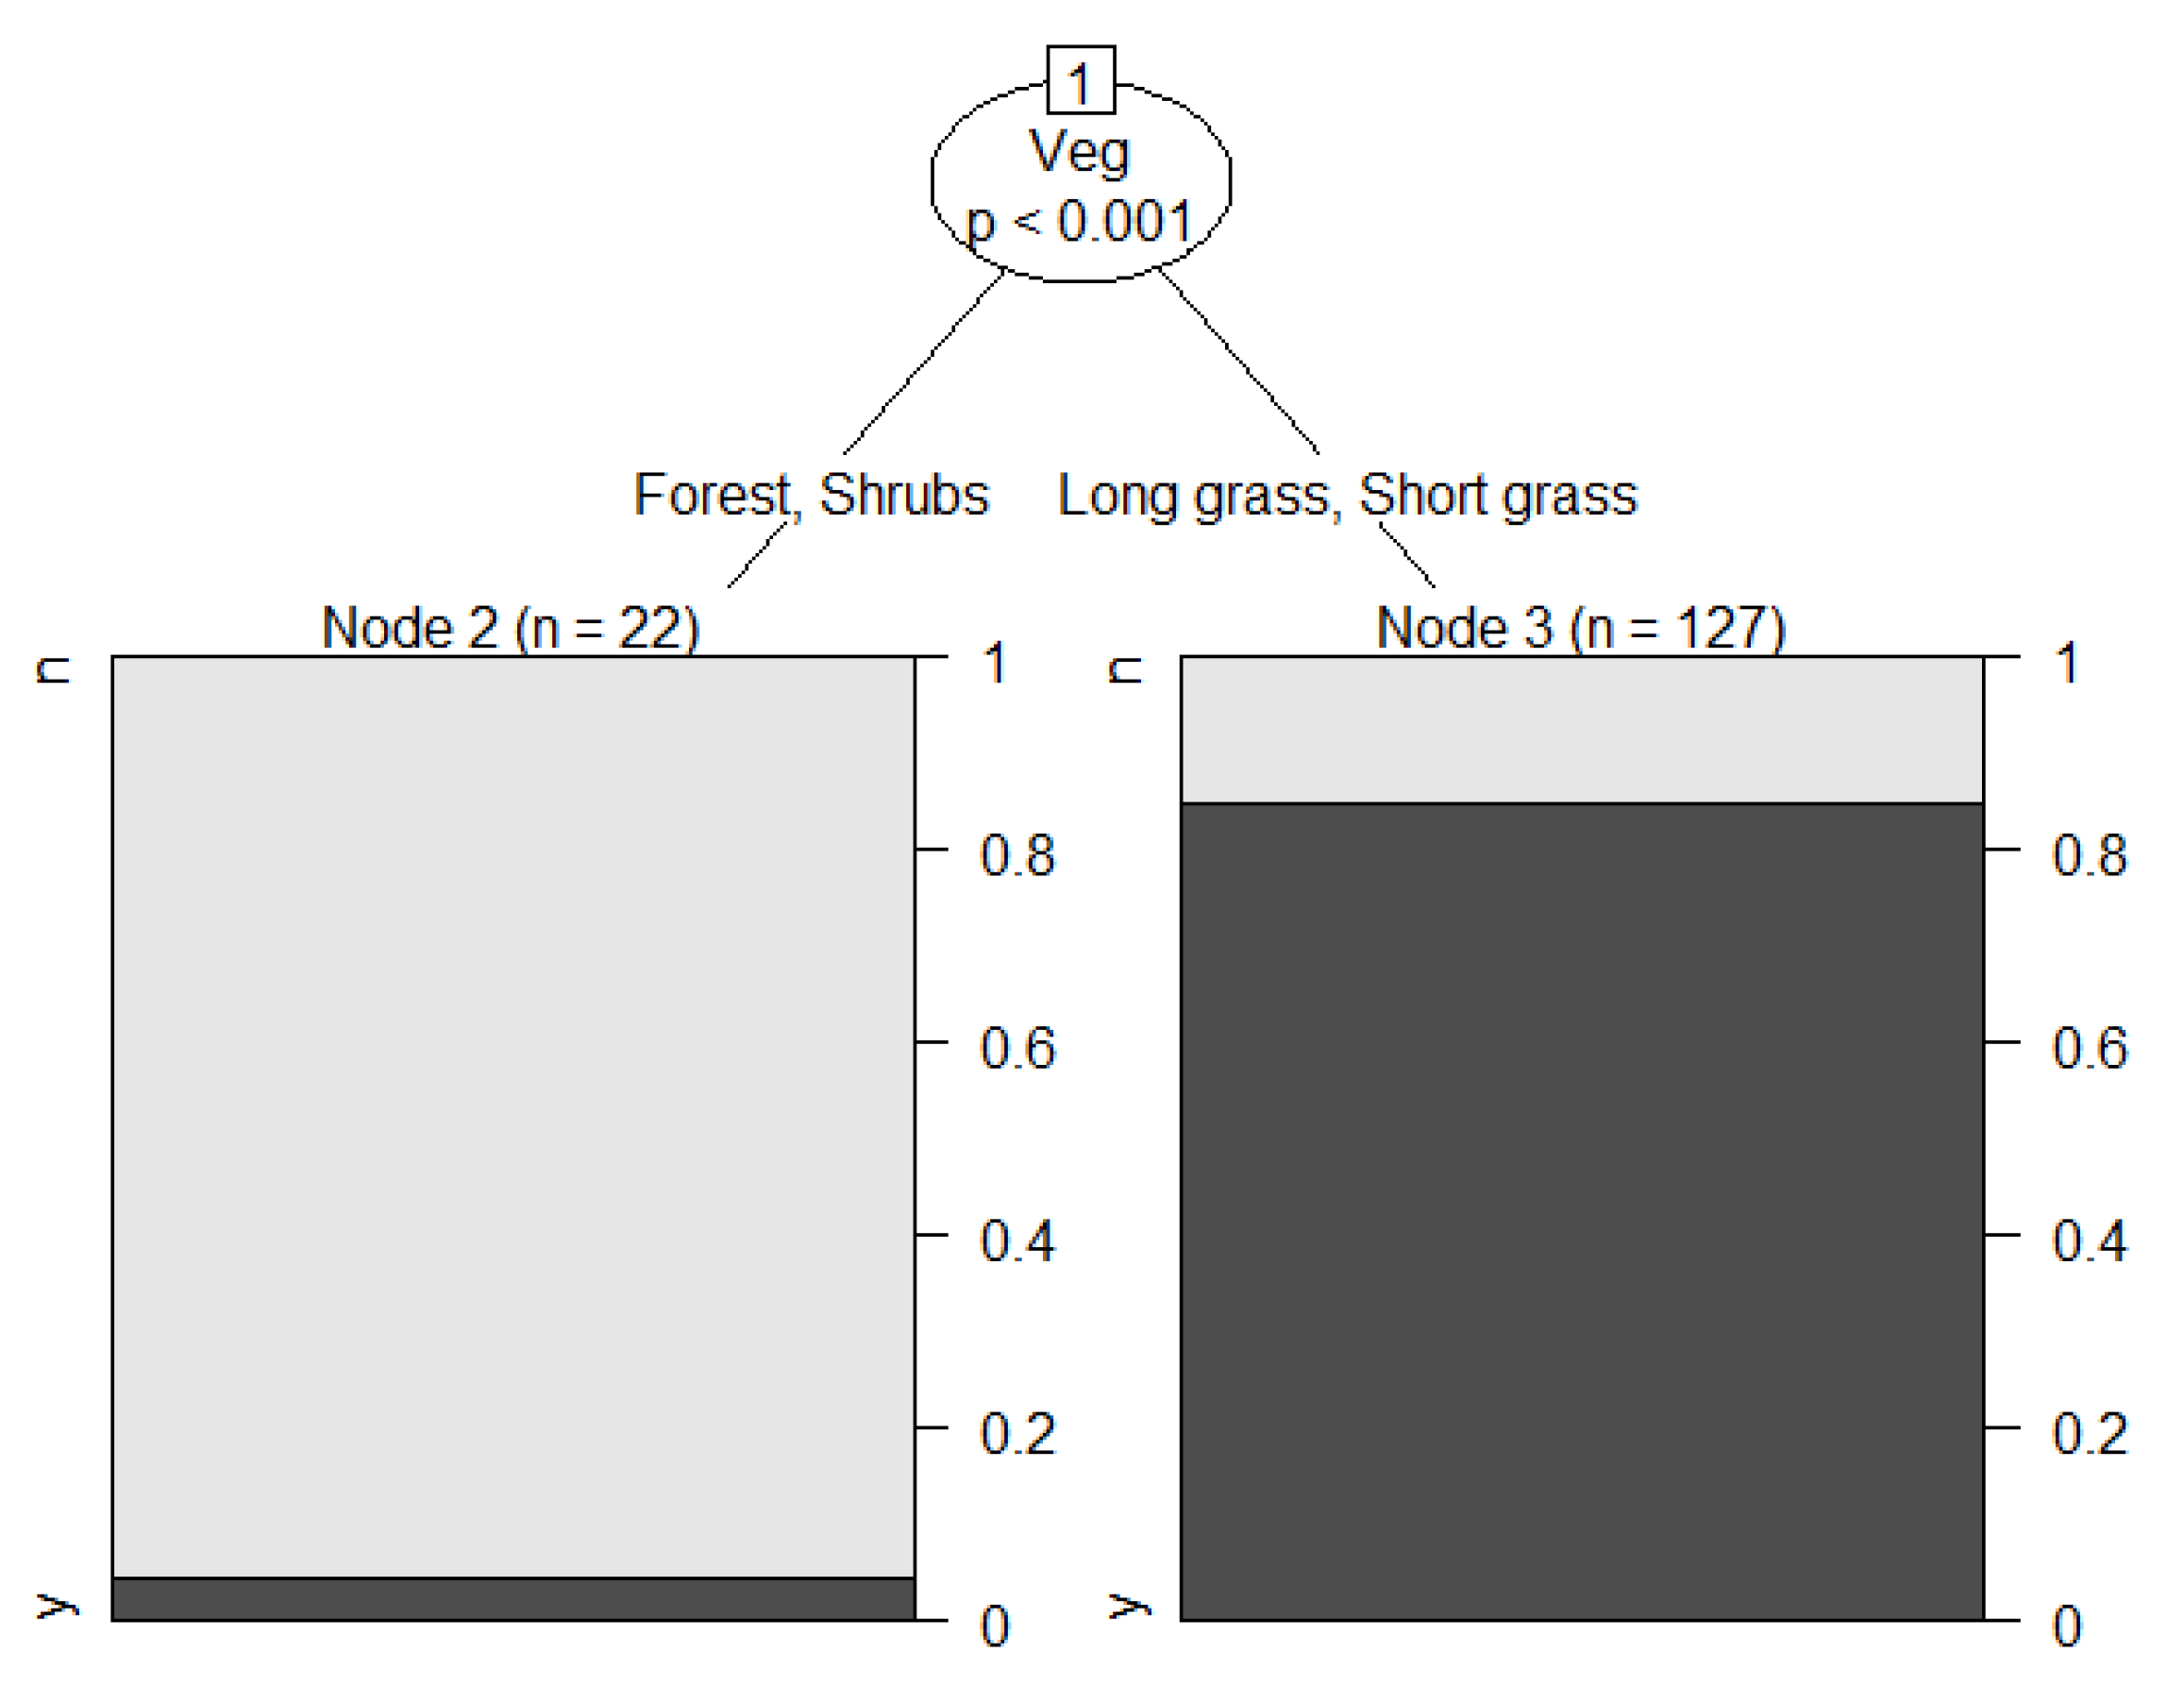
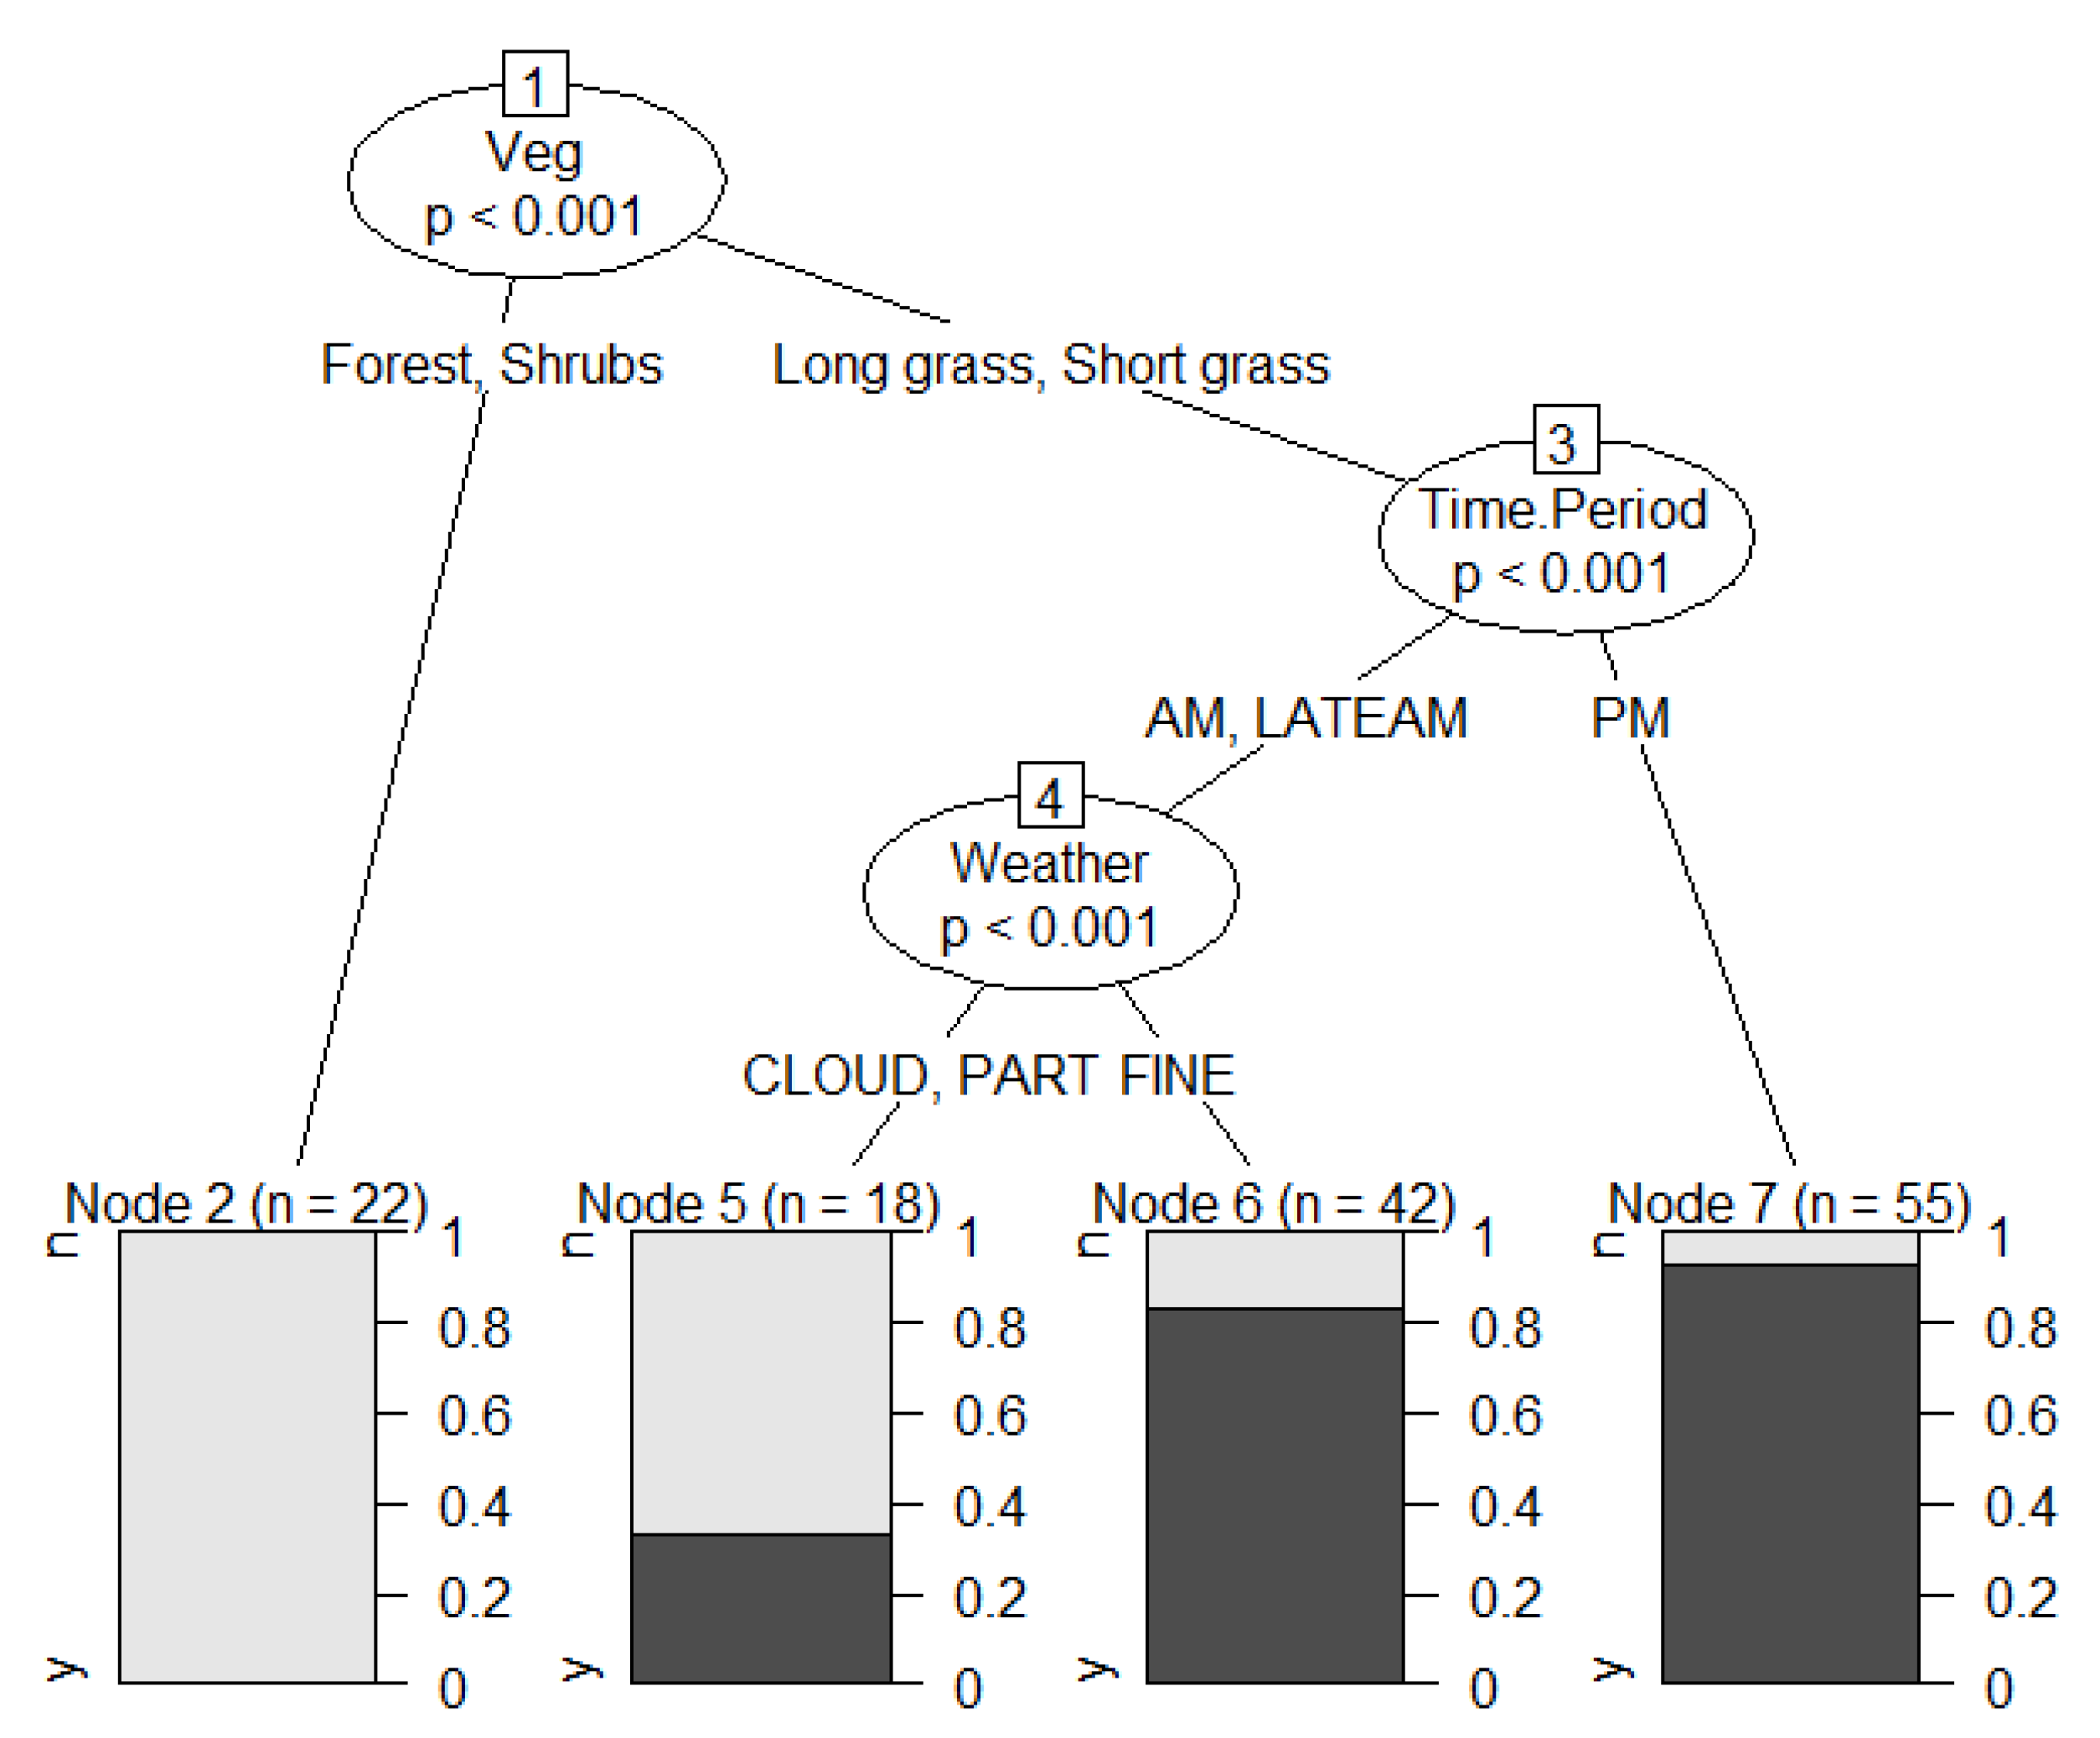
2.4. Statistical Analyses
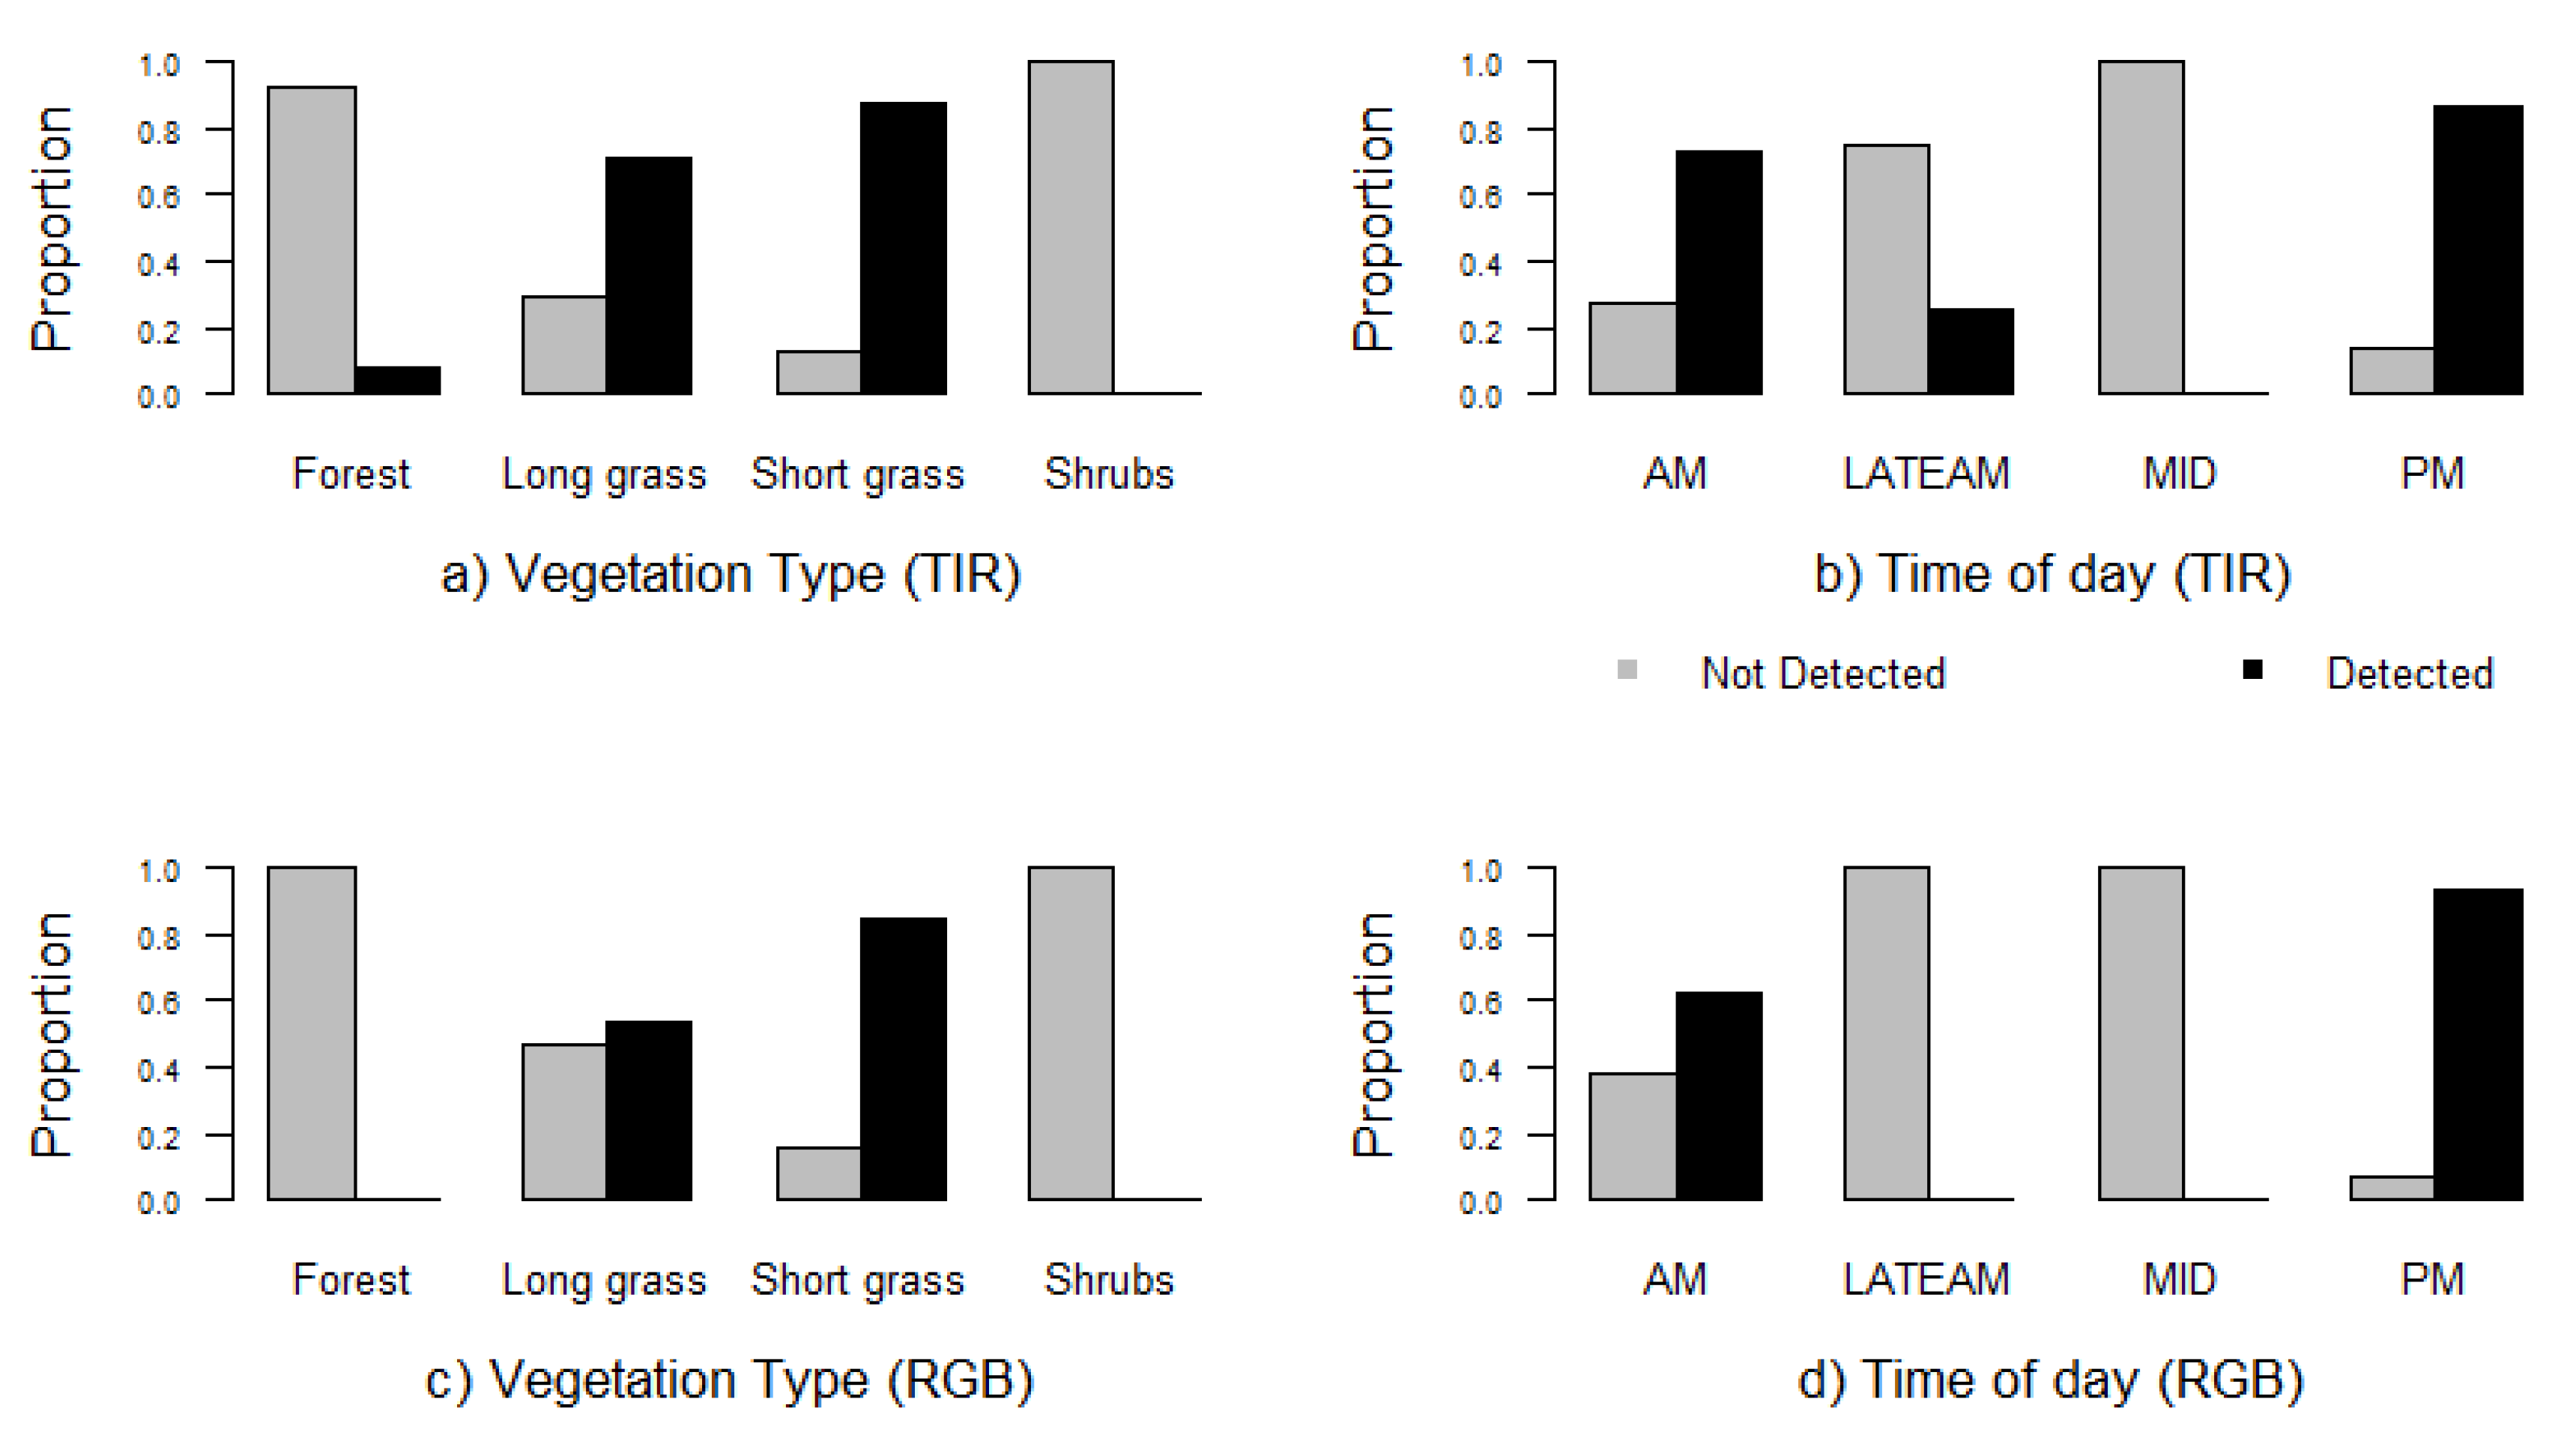
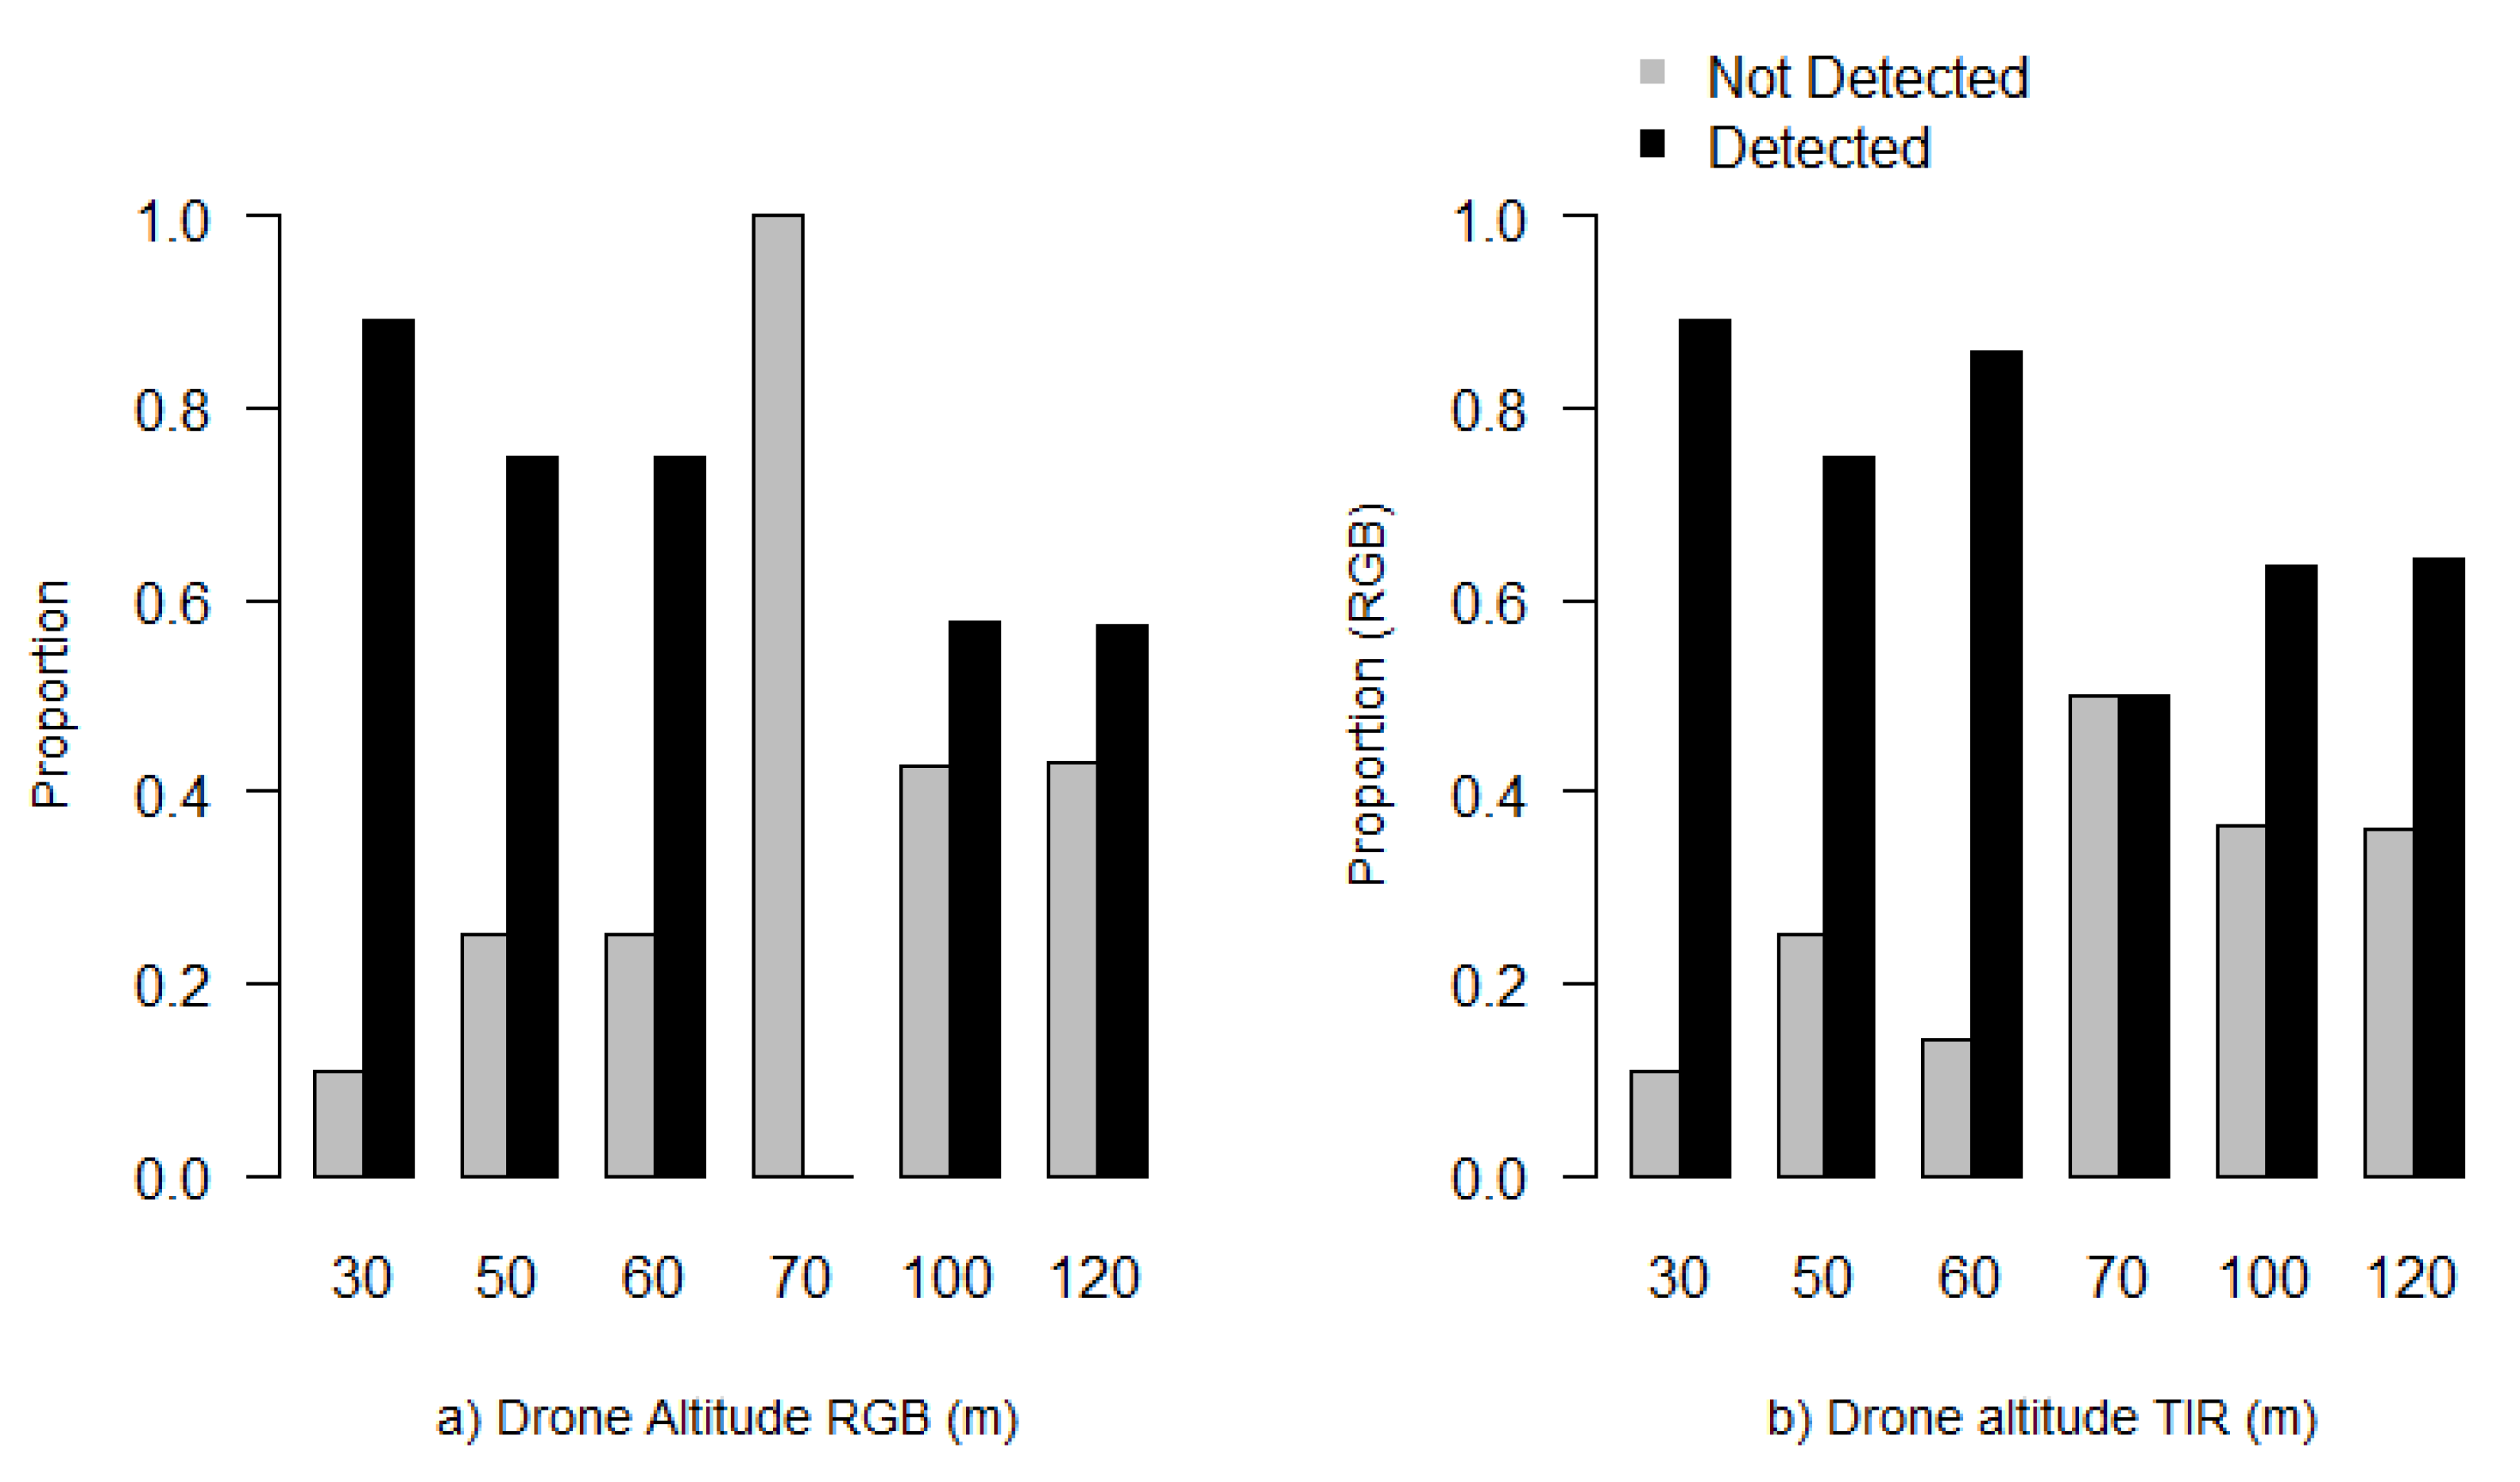
All statistical analyses were performed in the R environment (Version 3.61) [23]. We conducted unbiased recursive partitioning using the ctree function in the R package partykit [24,25] in order to identify which factors most strongly predicted successful collection of images for manual detection of kangaroos. Initially, we included camera type as an explanatory variable in a single inference tree but this was not a good discriminator, and we found no significant effect of camera type on detection success. Therefore, we analysed the data from TIR and RGB orthomoasaics separately, specifically to avoid pseudo-replication. We included the following predictors in each conditional inference tree: drone height, vegetation type, ambient temperature, time of day, and weather.

3. Results

We successfully used orthomosaics derived from drone-based TIR and RGB orthomosaics to detect kangaroos across a variety of flight heights and environmental conditions. After image processing, 39 TIR and 33 RGB orthomosaics, of locations where we knew kangaroos to be present (from 18 drone deployments at different height levels), were available for interpretation. The quality of the remaining orthomosaics was not optimal due mainly to image quality and misalignment issues. Using TIR orthomosaics, 73.2% of kangaroos observed in ground counts were detected (n = 149 kangaroos), and 67.2 % of kangaroos (n= 137 kangaroos) were detected from RGB orthomosaics.
The number of kangaroos counted from TIR orthomosaics was underestimated in 52% of flights (n = 39), while counts from RGB orthomosaics were underestimated in 72.2 % (n =33) of flights. The number of kangaroos counted from TIR orthomosaics was equal to the number known to be present for 61.1% (n = 39 flights) and 43.8% (n = 33 flights) from RGB orthomosaics. Vegetation type, time of day of deployment, and weather were all found to influence kangaroo detection using RGB orthomosaics (Figure 4), but only vegetation type influenced counts from TIR orthomosaics (Figure 5).
Kangaroo detection from TIR orthomosaics was highest in short grass (87.3%, n = 110 kangaroos) and long grass habitats (70.6%, n = 17 kangaroos) compared to 8.3% in forest (n = 12 kangaroos). No kangaroos were detected in shrub lands (n = 10 kangaroos) (Figure 6a). While the percentage of positive detections was consistently high, there was an overall decrease in detections with increasing drone height: 30 m (89.3%, n = 28 kangaroos), 50 m (75%, n = 8 kangaroos), 60 m (85.7%, n = 28 kangaroos), 70 m (50%, n = 2 kangaroos), 100 m (63.6%, n = 44 kangaroos), and 120 m (64.1%, n = 39 kangaroos) (Figure 7). While time of day was not a significant factor identified in the correlation tree, for TIR orthomosaics, there was a higher proportion of successful detections in the early AM (72.7%, n = 66 kangaroos) and PM (86.6%, n = 67 kangaroos) time periods compared to late AM (25%, n= 12 kangaroos), while none were detected at midday (0%, n = 4 kangaroos) (Figure 6b).
Kangaroo detection from RGB orthomosaics was lower overall but camera type was not a significant predictor in the recursive partitioning conducted. Once again, the highest percentage of detections was in the short grass (84.7 %, n = 98 kangaroos) followed by long grass (52.9 %, n = 17 kangaroos), with no successful detections in forest (n = 12 kangaroos) and shrub (n = 10 kangaroos) habitats (Figure 6c). The same general trend of decreasing detection with increasing height was also observed in counts from RGB orthomosaics: 30 m (89.3%, n = 28 kangaroos), 50 m (75%, n = 8 kangaroos), 60 m (75%, n = 24 kangaroos), 70 m (0%, n = 2 kangaroos), 100 m (57.5%, n = 40 kangaroos), and 120 m (57.1%, n = 35 kangaroos) (Figure 7).

4. Discussion

This research has demonstrated that manual interpretation of orthomosaics derived from both drone-derived TIR and RGB imagery is an effective means of detecting kangaroos in urban and peri-urban environments during daylight hours. Importantly, we identified environmental and drone flight parameters which influence the success and accuracy of this approach. The use of orthomosaics, particularly the ones from faster/higher flights, might reduce the potential double-counting of animals by having a higher chance of animals remaining static, filtering out moving objects (“ghosting” filtering), and helping the operator identify the same individuals [19]. However, the quality of some orthomosaics was not optimal due to the misalignment of low-quality images arising from manual flying. Further, orthomosaics, in combination with digital terrain models, provide 2D and 3D spatial and contextual information, including geometry, that could be used to improve semi-automated classifications [1,26].
The most important determinant in the successful detection of kangaroos was vegetation type and this was consistent for both TIR and RGB orthomosaics. A dense shrub layer and forest canopy hampered the detection rates for kangaroos compared to the other habitats observed in the current study. Dense vegetation can occlude the thermal signature of the target animals irrespective of the time of day that surveys are undertaken or drone height. This parallels observations in other systems [17] where canopy cover in coniferous forests was considered to have blocked the thermal signal emitted from deer, leading to much lower detection rates than in non-forest environments. Given that that the success of detection varies with vegetation type, habitat type should be a primary consideration in the planning and implementation of drone-based surveys. However, this discrepancy in detection rates between habitat types is also present in more traditional on-ground [27] and aerial survey methods [28]. Statistical approaches that take into account both the limitations and advantages of drone-based monitoring are needed to address differences in detection error when wildlife are surveyed in heterogeneous landscapes using drone technology [16,19].
It is noteworthy that, when using RGB orthomosaics, the time of drone deployment and weather conditions were also significant predictors of successful kangaroo detection. We found that kangaroos were more detectable from RGB orthomosaics when the sun was lower on the horizon and cloud cover was minimal. This may be because the quality of the RGB images was affected by glare and/or reflection when the sun was higher, similar to those taken when studying marine environments [14,29]. Wind velocity could also influence detection, particularly in denser vegetation types, however this was not assessed in this study and requires further investigation.
There was no significant effect of ambient temperature (as high as 31 °C on occasions) on the detection of kangaroos for either type of imagery. We were able to successfully detect exposed kangaroos at high ambient temperatures using TIR imagery, despite the common assumption that TIR imagery is only useful at lower ambient temperatures when the contrast between the environment (ambient and ground temperature) and target animal is greatest. In a study on wild South African rhinoceros [30], detection in the afternoon/evening was found to be poor compared to other times of day (NB time of sunrise was similar to that in our study location). However, in our study, 86% of kangaroos known to be present were successfully detected in the late afternoon using TIR imagery and, when using RGB imagery, this time period resulted in the highest proportion of successful detections. It should be noted that we did not assess the efficacy of night surveys in this study but the use of TIR cameras at night to detect nocturnal species shows promise. In many countries, including Australia, pilot certification is required for flying outside of daylight hours. While certification is usually a straightforward process, it may not be achievable for researchers and practitioners with limited financial resources.
We propose that within the range of temperatures sampled here (11–31 °C) the influence of time of day on successful detection may be partially attributed to the thermoregulatory behaviour of kangaroos. This is because during the hotter parts of the day, kangaroos are likely to seek shade [31], often under or in dense vegetation which obscure their thermal signature. In a study on red deer (Cervus elaphus) in Poland, the timing of drone deployments was also found to have a significant impact on the quality of TIR images [32]. Lethbridge et al. [18] observed denser vegetation to have an impact on detectability, yet the effect was more pronounced with RGB imagery. Therefore, timing of drone deployment for conducting population counts must take into account temporal variation in activity patterns and if possible, be conducted when animals are likely to be in open environments.
Our research suggests that drone flight parameters influenced the reliability of wildlife detection, due to larger ground sampling distances with higher heights. When using TIR imagery, flight heights greater than 100 m above ground level successfully detected kangaroos, but reduced the ability to identify kangaroos, particularly when aggregated. This was due to spot-size effect (coarse resultant pixel sizes of over 0.1 m). While drone flight height parameters may be dictated by the size and bio-physical characteristics of the intended survey area, as well as TIR camera type, we suggest a minimum of 10–20 pixels resolving the target diameter. Given the sensor used in this study and the average kangaroo footprint, drone heights in excess of 100 m will reduce detection accuracy. These results reflect those of Mulero-Pázmány et al. [30] who recommended flight heights of 100 m or less for the best detection of rhinoceros in South Africa. Ultimately, consideration should always be given to the size of the target animal when deciding flight altitudes.
It is evident that the extent of surveys is also an important consideration and, adapting traditional aerial survey techniques (e.g., straight transects) to current drone technology is problematic, due to shorter flight times and lower flight altitudes. In a recent study comparing kangaroo survey transects flown by a helicopter versus a long-range drone, Gentle et al. [33] found that, at heights of 300 m, the detection rates of the long-range drone were much lower than those of the helicopter. When using TIR cameras, the flight altitude needs to be low enough to detect thermal signatures clearly, and this will limit the amount of area that is able to be covered. In the case of surveys covering large spatial extents, there will be trade-offs between cost, agility and loss of resolution when flying at greater heights. Therefore, the choice of camera type, survey design, and drone flight parameters should all be made with the target species and habitat type in mind.
Based on our results, we conclude that the successful detection of kangaroos in a similar environment using both TIR and RGB imagery occurs in grass habitats and that drones should be deployed at heights of between 60 and 100 m. Drone deployments lower than 60 m reduce the field of view and may disturb kangaroos, making reliable counts more difficult [5]. Drone deployments at 30 m may be possible for some target species where disturbance is not an issue. However, more research is needed with regard to the behavioural and physiological impacts of wildlife species to drone monitoring [34]. When using RGB imagery, deploying the drone in the late afternoon and/or in fine (no cloud) weather will increase the likelihood of successful and accurate detection. Adopting these flight parameters increased the chances of manually detecting kangaroos using drone-mounted imagery and maximised the field of view during a flown transect, thereby reducing flight time and/or the number of passes required to survey an area. The above drone height interval would allow a drone to cover an area of approximately 7 ha per ten minutes of flight.
It is also important to note that this study was not designed to assess levels of false detection, but rather to assess parameters affecting positive detection. However, the issue of false detection is still an important consideration when designing aerial surveys. It is possible that applying the methodology presented here could result in a higher number of kangaroos then actual on the ground because of false detection. However, due to the manual interpretation of high-quality orthomosaics at altitudes where kangaroos shapes could be clearly identified, this is less likely to be an issue than if automated image recognition was used [19,35,36,37].

5. Conclusions

As the potential application for, and interest in monitoring wildlife using drones increases, it is essential that due consideration is given to optimal drone flight parameters and survey design [19]. Our project has provided information regarding the benefits of drone-mounted TIR and RGB imaging for detecting wildlife in urban and peri-urban landscapes. Vegetation type was the predominant factor influencing kangaroo detection. Both TIR and RGB cameras are useful for drone-based surveys of kangaroos. However, detection using RGB cameras is more likely to be influenced by time of day and weather. We recommend flying at heights of between 60 and 100 m in the late afternoon or early morning for the best results for detecting kangaroos in similar environments. Flight parameters and other considerations outlined here also provide insights to assist further investigations in surveying animal species in other land use types, and to improve the application and cost of the method. For example, the application of artificial intelligence algorithms to count wildlife would significantly reduce image processing time [2]. The use of machine learning, specifically deep convolution neural networks, is very promising, even for small populations [4,35]. Finally, comparative studies over multiple sites, landscape types, and species to test drone-specific survey methods in comparison to traditional survey approaches would also provide further insights into the value of drone-based wildlife monitoring.

Author Contributions

Conceptualization, E.A.B., J.X.L., and S.E.B.; Methodology, E.A.B. and J.X.L; Validation, E.A.B. and J.X.L.; Formal Analysis, E.A.B. and J.X.L.; Investigation, E.A.B. and J.X.L.; Resources, J.X.L. and E.A.B.; Data Curation, E.A.B. and J.X.L.; Writing—Original Draft Preparation, E.A.B.; Writing—Review & Editing, E.A.B., J.X.L., and S.E.B.; Visualization, J.X.L.; Project Administration, E.A.B.; Funding Acquisition, E.A.B., J.X.L., and S.E.B. All authors have read and agreed to the published version of the manuscript.

Funding

This research was funded by Sunshine Coast Council, USC SCC Collaborative grant #2016-03.

Acknowledgments

The authors would like to acknowledge J. Bolin, K. Leon, F. Brunton and other volunteers for assistance with field work. P Nagle, and J. Nolen from Sunshine Coast Council and A. Brake assisted with access to field sites. We thank D. Schoeman for statistical advice, L. Koh, R Burns and anonymous reviewers for assistance with improving the manuscript. This research was conducted under University of the Sunshine Coast Animal Ethics permit ANA/1489.

Conflicts of Interest

The authors declare no conflict of interest.

References

  1. Christie, K.S.; Gilbert, S.L.; Brown, C.L.; Hatfield, M.; Hanson, L. Unmanned aircraft systems in wildlife research: Current and future applications of a transformative technology. Front. Ecol. Environ. 2016, 14, 241–251. [Google Scholar] [CrossRef]
  2. Hodgson, J.C.; Mott, R.; Baylis, S.M.; Pham, T.T.; Wotherspoon, S.; Kilpatrick, A.D.; Raja, S.R.; Reid, I.; Terauds, A.; Koh, L.P. Drones count wildlife more accurately and precisely than humans. Methods Ecol. Evol. 2018, 9, 1160–1167. [Google Scholar] [CrossRef] [Green Version]
  3. Schroeder, N.M.; Panebianco, A.; Musso, R.G.; Carmanchahi, P. An experimental approach to evaluate the potential of drones in terrestrial mammal research: A gregarious ungulate as a study model. R. Soc. Open Sci. 2020, 7, 191482. [Google Scholar] [CrossRef] [PubMed] [Green Version]
  4. Kellenberger, B.; Marcos, D.; Tuia, D. Detecting mammals in UAV images: Best practices to address a substantially imbalanced dataset with deep learning. Remote Sens. Environ. 2018, 216, 139–153. [Google Scholar] [CrossRef] [Green Version]
  5. Brunton, E.; Bolin, J.; Leon, J.; Burnett, S. Fright or Flight? Behavioural Responses of Kangaroos to Drone-Based Monitoring. Drones 2019, 3, 41. [Google Scholar] [CrossRef] [Green Version]
  6. Corcoran, E.; Denman, S.; Hanger, J.; Wilson, B.; Hamilton, G. Automated detection of koalas using low-level aerial surveillance and machine learning. Sci. Rep. 2019, 9, 3208. [Google Scholar] [CrossRef] [Green Version]
  7. Gray, P.C.; Fleishman, A.B.; Klein, D.J.; McKown, M.W.; Bézy, V.S.; Lohmann, K.J.; Johnston, D.W. A convolutional neural network for detecting sea turtles in drone imagery. Methods Ecol. Evol. 2019, 10, 345–355. [Google Scholar] [CrossRef]
  8. Spaan, D.; Burke, C.; McAree, O.; Aureli, F.; Rangel-Rivera, C.E.; Hutschenreiter, A.; Longmore, S.N.; McWhirter, P.R.; Wich, S.A. Thermal Infrared Imaging from Drones Offers a Major Advance for Spider Monkey Surveys. Drones 2019, 3, 34. [Google Scholar] [CrossRef] [Green Version]
  9. Barnas, A.; Chabot, D.; Hodgson, A.; Johnston, D.W.; Bird, D.M.; Ellis-Felege, S.N. A standardized protocol for reporting methods when using drones for wildlife research. J. Unmanned Vehicle Syst. 2020. [Google Scholar] [CrossRef] [Green Version]
  10. McCafferty, D.J. The value of infrared thermography for research on mammals: Previous applications and future directions. Mammal Rev. 2007, 37, 207–223. [Google Scholar] [CrossRef]
  11. Gillette, G.L.; Reese, K.P.; Connelly, J.W.; Colt, C.J.; Knetter, J.M. Evaluating the potential of aerial infrared as a lek count method for prairie grouse. J. Fish Wildl. Manag. 2015, 6, 486–497. [Google Scholar] [CrossRef]
  12. Linchant, J.; Lisein, J.; Semeki, J.; Lejeune, P.; Vermeulen, C. Are unmanned aircraft systems (UASs) the future of wildlife monitoring? A review of accomplishments and challenges. Mammal Rev. 2015, 45, 239–252. [Google Scholar] [CrossRef]
  13. Burke, C.; Rashman, M.; Wich, S.; Symons, A.; Theron, C.; Longmore, S. Optimizing observing strategies for monitoring animals using drone-mounted thermal infrared cameras. Int. J. Remote Sens. 2019, 40, 439–467. [Google Scholar] [CrossRef] [Green Version]
  14. Joyce, K.E.; Duce, S.; Leahy, S.M.; Leon, J.X.; Maier, S.W. Principles and practice of acquiring drone-based image data in marine environments. Mar. Freshw. Res. 2018, 70, 952–963. [Google Scholar] [CrossRef]
  15. Watson, G.S.; Gregory, E.A.; Johnstone, C.; Berlino, M.; Green, D.W.; Peterson, N.R.; Schoeman, D.S.; Watson, J.A. Like night and day: Reversals of thermal gradients across ghost crab burrows and their implications for thermal ecology. Estuar. Coast. Shelf Sci. 2018, 203, 127–136. [Google Scholar] [CrossRef]
  16. Chrétien, L.P.; Théau, J.; Ménard, P. Visible and thermal infrared remote sensing for the detection of white-tailed deer using an unmanned aerial system. Wildl. Soc. Bulletin. 2016, 40, 181–191. [Google Scholar] [CrossRef]
  17. Seymour, A.C.; Dale, J.; Hammill, M.; Halpin, P.N.; Johnston, D.W. Automated detection and enumeration of marine wildlife using unmanned aircraft systems (UAS) and thermal imagery. Sci. Rep. 2017, 7, 45127. [Google Scholar] [CrossRef] [Green Version]
  18. Lethbridge, M.; Stead, M.; Wells, C. Estimating kangaroo density by aerial survey: A comparison of thermal cameras with human observers. Wildlife Res. 2019, 46, 639–648. [Google Scholar] [CrossRef]
  19. Brack, I.V.; Kindel, A.; Oliveira, L.F.B. Detection errors in wildlife abundance estimates from Unmanned Aerial Systems (UAS) surveys: Synthesis, solutions, and challenges. Methods Ecol. Evol. 2018, 9, 1864–1873. [Google Scholar] [CrossRef]
  20. Brunton, E.A.; Srivastava, S.K.; Burnett, S. Spatial ecology of an urban eastern grey kangaroo (Macropus giganteus) population: Local decline driven by kangaroo–vehicle collisions. Wildl. Res. 2018, 45, 685–695. [Google Scholar] [CrossRef]
  21. Jat, P.; Serre, M.L. Bayesian Maximum Entropy space/time estimation of surface water chloride in Maryland using river distances. Environ. Pollut. 2016, 219, 1148–1155. [Google Scholar] [CrossRef] [PubMed] [Green Version]
  22. Jat, P.; Serre, M.L. A novel geostatistical approach combining Euclidean and gradual-flow covariance models to estimate fecal coliform along the Haw and Deep rivers in North Carolina. Stoch. Environ. Res. Risk Assess 2019, 32, 2537–2549. [Google Scholar] [CrossRef]
  23. R Core Team. R: A Language and Environment for Statistical Computing; R foundation for Statistical Computing: Vienna, Austria, 2017. [Google Scholar]
  24. Hothorn, T.; Hornik, K.; Zeileis, A. Unbiased Recursive Partitioning: A Conditional Inference Framework. J. Comput. Graph. Stat. 2006, 15, 651–674. [Google Scholar] [CrossRef] [Green Version]
  25. Hothorn, T.; Zeileis, A. Partykit: A Modular Toolkit for Recursive Partytioning in R. J. Mach. Learn. Res. 2015, 16, 3905–3909. Available online: http://jmlr.org/papers/v16/hothorn15a.html (accessed on 1 March 2018).
  26. Chen, G.; Weng, Q.; Hay, G.J.; He, Y. Geographic object-based image analysis (GEOBIA): Emerging trends and future opportunities. GIScience Remote Sens. 2018, 55, 159–182. [Google Scholar] [CrossRef]
  27. Woolnough, A. Comparison of two techniques to survey macropod abundance in an ecologically sensitive habitat. Aust. Mammal. 2005, 27, 69–72. [Google Scholar] [CrossRef]
  28. Pople, A.R. Repeatability of aerial surveys. Aust. Zool. 1999, 31, 280–286. [Google Scholar] [CrossRef] [Green Version]
  29. Johnston, D.W. Unoccupied Aircraft Systems in Marine Science and Conservation. Ann. Rev. Mar. Sci. 2019, 11, 439–463. [Google Scholar] [CrossRef] [Green Version]
  30. Mulero-Pázmány, M.; Stolper, R.; van Essen, L.D.; Negro, J.J.; Sassen, T. Remotely Piloted Aircraft Systems as a Rhinoceros Anti-Poaching Tool in Africa. PLoS ONE 2014, 9, e83873. [Google Scholar] [CrossRef] [Green Version]
  31. Dawson, T.J.; McTavish, K.J.; Munn, A.J.; Holloway, J. Water use and the thermoregulatory behaviour of kangaroos in arid regions: Insights into the colonisation of arid rangelands in Australia by the Eastern Grey Kangaroo (Macropus giganteus). J. Comp. Physiol. B 2006, 176, 45–53. [Google Scholar] [CrossRef]
  32. Witczuk, J.; Pagacz, S.; Zmarz, A.; Cypel, M. Exploring the feasibility of unmanned aerial vehicles and thermal imaging for ungulate surveys in forests—Preliminary results. Int. J. Remote Sens. 2018, 39, 5504–5521. [Google Scholar] [CrossRef]
  33. Gentle, M.; Finch, N.; Speed, J.; Pople, A. A comparison of unmanned aerial vehicles (drones) and manned helicopters for monitoring macropod populations. Wildl. Res. 2018, 45, 586–594. [Google Scholar] [CrossRef]
  34. Mulero-Pázmány, M.; Jenni-Eiermann, S.; Strebel, N.; Sattler, T.; Negro, J.J.; Tablado, Z. Unmanned aircraft systems as a new source of disturbance for wildlife: A systematic review. PLoS ONE 2017, 12, e0178448. [Google Scholar] [CrossRef] [PubMed] [Green Version]
  35. Gray, P.C.; Bierlich, K.C.; Mantell, S.A.; Friedlaender, A.S.; Goldbogen, J.A.; Johnston, D.W. Drones and convolutional neural networks facilitate automated and accurate cetacean species identification and photogrammetry. Methods Ecol. Evol. 2019, 10, 1490–1500. [Google Scholar] [CrossRef]
  36. Mohan, M.; Silva, C.A.; Klauberg, C.; Jat, P.; Catts, G.; Cardil, A.; Hudak, A.T.; Dia, M. Individual Tree Detection from Unmanned Aerial Vehicle (UAV) Derived Canopy Height Model in an Open Canopy Mixed Conifer Forest. Forests 2017, 8, 340. [Google Scholar] [CrossRef] [Green Version]
  37. Eikelboom, J.A.; Wind, J.; van de Ven, E.; Kenana, L.M.; Schroder, B.; de Knegt, H.J.; van Langevelde, F.; Prins, H.H.T. Improving the precision and accuracy of animal population estimates with aerial image object detection. Methods Ecol. Evol. 2019, 10, 1875–1887. [Google Scholar] [CrossRef] [Green Version]
Figure 1. DJI Phantom 3 Advanced drone carrying a true-colour (RGB) camera and a Flir Vue Pro R (FVP) thermal infrared sensor fitted on custom cradle.
Drones 04 00020 g001
Figure 2. Images of study sites (RGB) taken from drone at (a) Sippy Downs showing examples of short grass, long grass and shrub habitat types and (b) Weyba Downs showing short grass and forest areas.
Drones 04 00020 g002
Figure 3. (a) RGB orthomosaic derived from drone imagery taken on 16 May 2017 with TIR orthomosaic extent (dotted outline). Insets (red square) are examples of two kangaroos (red arrows) as shown in the TIR orthomosaic at 120m (b) and 30m (c) and from the RGB orthomosaic at 120m (d) and 30m (e).
Drones 04 00020 g003
Figure 4. Conditional inference tree showing influence of vegetation types on successful kangaroo detection based on TIR orthomosaics. The dark shading represents the proportion of successful kangaroo detections at the terminal nodes.
Drones 04 00020 g004
Figure 5. Conditional inference tree of environmental factors that influenced successful kangaroo detection based on RGB orthomosaics. The dark shading represents the proportion of successful kangaroo detections at the terminal nodes.
Drones 04 00020 g005
Figure 6. The proportion of kangaroo detections varied across time of day and vegetation type for TIR (a,b) and RGB (c,d) imagery.
Drones 04 00020 g006
Figure 7. The proportion of kangaroo detections decreased as drone altitude increased using both RGB (a) and TIR (b) imagery.
Drones 04 00020 g007
Table 1. Image ground sampling distance and orthomosaic spatial resolution for TIR and RGB sensors at different flight levels.
Height Above Ground (m)Ground Sampling Distance (cm)/Orthomosaic Resolution (cm)
RGBTIR
1205.3/610.7/12
1004.4/58.9/10
703.1/46.3/7
602.6/35.4/6
502.2/34.5/5
301.3/22.7/3

