Article

Thermal-Drones as a Safe and Reliable Method for Detecting Subterranean Peat Fires

1
Astrophysics Research Institute, Liverpool John Moores University, Brownlow Hill, Liverpool L3 5RF, UK
2
School of Natural Sciences and Psychology, Liverpool John Moores University, Byrom Street, Liverpool L3 3AF, UK
3
UPT CIMTROP, University of Palangka Raya, Jl. Yos Sudarso, Palangka Raya 73111, Central Kalimantan, Indonesia
4
Faculty of Science, Liverpool John Moores University, Byrom Street, Liverpool L3 3AF, UK
5
Borneo Nature Foundation, Jl. Bukit Raya No. 82, Palangka Raya 73112, Central Kalimantan, Indonesia
6
School of Geography, Geology and the Environment, University of Leicester, University Road, Leicester LE1 7RH, UK
*
Author to whom correspondence should be addressed.
Drones 2019, 3(1), 23; https://doi.org/10.3390/drones3010023
Submission received: 22 December 2018 / Revised: 20 February 2019 / Accepted: 21 February 2019 / Published: 27 February 2019

Abstract

:
Underground peat fires are a major hazard to health and livelihoods in Indonesia, and are a major contributor to carbon emissions globally. Being subterranean, these fires can be difficult to detect and track, especially during periods of thick haze and in areas with limited accessibility. Thermal infrared detectors mounted on drones present a potential solution to detecting and managing underground fires, as they allow large areas to be surveyed quickly from above and can detect the heat transferred to the surface above a fire. We present a pilot study in which we show that underground peat fires can indeed be detected in this way. We also show that a simple temperature thresholding algorithm can be used to automatically detect them. We investigate how different thermal cameras and drone flying strategies may be used to reliably detect underground fires and survey fire-prone areas. We conclude that thermal equipped drones are potentially a very powerful tool for surveying for fires and firefighting. However, more investigation is still needed into their use in real-life fire detection and firefighting scenarios.

1. Introduction

Peat is partially decomposed vegetation which has been accumulated over many thousands of years in a water saturated and oxygen starved environment [1,2]. It naturally has a very high water content leading to marshy lands (bog). Peat lands cover 3% the Earth’s terrestrial surface. These ecosystems contain one-third of the soil carbon and one-tenth of global freshwater reserves [3]. The total amount of carbon in peat exceeds the amount of carbon in the world’s forests [4].
In its natural form peat has a very high moisture content, usually several times the weight of the organic content, and thus is generally fire resistant. Dry peat, however, is very flammable and often used as fuel in non-tropical regions. If a thin layer of dry peat on top of the bog is ignited it will burn quickly, but the high moisture content of natural peat inhibits deeper burning. In order for peat lands themselves to be flammable they must first be artificially drained, exceptionally dry seasons or drought alone are not usually sufficient for peatland burning below the surface.
Dry peat, even when underground, allows more efficient air flow through than moist peat [5,6,7,8]. If a buried layer of dry peat is ignited it can smoulder slowly underground for long periods of time (from days to years) [8,9,10,11]. Smouldering is a relatively low temperature (500–700 C compared to 1500–1800 C for flaming combustion), flameless form of combustion which requires less heat for ignition, less oxygen for sustained burning (10% oxygen concentration for smouldering vs. 16% for flaming), and significantly more water to extinguish (>50% more water per mass of fuel compared to flaming) [8,12]. Dry peat, with is highly porous nature, when in warm or tropical regions, can easily smoulder underground for long periods of time. With long burn times and relatively slow speeds (about 1 cm per hour [8,10,13]), subterranean smouldering fires can travel large distances underground before resurfacing elsewhere, potentially leading to large surface fires and damaging tree roots. Exceptional or repeated peat fires can leave an area unable to support vegetation for decades, even reducing the land back to the underlying substrate [8,11,14], assuming the fire doesn’t reach the water level first. Indeed, these fires are often only fully extinguished by a rise in the ground water level following heavy rain, and will re-emerge if not fully extinguished.
Annual large scale wildfires in tropical developing nations such as Indonesia are associated with subterranean peat smouldering. These fires are a huge re-occurring problem for development in the region, and have exhibited an escalating trend in severity, frequency and fire extent in the past few decades [15]. They have both immediate and long term impacts for local society, environment and climate globally. In dry years, in particular those associated with El Niño-driven droughts, the annual fires in Indonesia can account for a large fraction of global greenhouse gas emission. For example in 2015, during a strong El Niño event, they accounted for around 15–20% of annual total emissions (which is more than the global transport sector [16]). However, even short periods of drought in non-El Niño years can lead to extreme burning events in SE Asia, and have been observed to occur after a short dry period in an otherwise wetter-than-average year [17]. This level of emission has the potential for powerful climate feedbacks, with increasing carbon dioxide concentrations leading to higher global temperatures, which in turn cause more severe drought in the region, leading to more severe fires and more release of carbon dioxide [16]. Detection and extinction of these underground fires is of vital importance in the prevention of wild fire and maintaining the sequestered carbon in the ground [18].
Whilst only a handful of people are killed directly by fire during the Indonesian fire season, tens of millions of people suffer respiratory and cardiovascular conditions and related health problems as a result [16,19]. The incomplete combustion that occurs during smouldering peat fires means that many toxic particulates are released into the atmosphere leading to much more severe air quality impacts than vegetation fires on other soil types [10]. The poor air quality resulting from the extreme fires of 1997 and 2015 led to as many as 48,000 and 100,000 excess deaths respectively in Malaysia, Indonesia, and Singapore [16,20,21]. During 2015, 69 million people in Equatorial Asia were persistently exposed to unhealthy air quality conditions [20]. In 1997 an estimated 20 million people in Indonesia suffered from respiratory problems following the fires [16]. The economic loss as a result of the forest fires in 2015 was estimated by the World Bank at USD 16.1 billion [19]—26 thousand square kilometers of land was burned [22]. There is a clear need to prevent large scale fire, and detecting and extinguishing underground fires at an early stage before they become too difficult to control, and being able to safely monitor fire spread, are an important part of this.
Since subterranean peat fires can smoulder more than a meter below the surface, leaving unburned material above [8], they can be difficult to detect. This is exacerbated during peak fire periods when thick haze limits visibility, and in areas with limited accessibility. However, underground fires can propagate heat to the surface without igniting it (see [23] for a full review). In the Kalimantan region of Indonesia, the peat fires themselves can burn at temperatures up to 500 C, but typically peak somewhat lower around 275 C [10,13]. The surface temperature above the fires is between 50 and 400 C. Such a hot spot on the ground might not be obvious to the naked eye, but this temperature range would show as a very obvious heat source with a thermal infrared detector. Indeed it has been shown that underground peat fires can be detected with a thermal infrared (TIR) camera even when they can’t be detected by eye [24]. Additionally, since thermal infrared wavelengths are longer than optical wavelengths (thermal infrared wavelengths 8–14 μ m, compared to optical (visible) wavelengths 0.6–0.9 μ m), thermal infrared light can pass through some types of suspended particulate matter, such as smoke or fog, unhindered whereas optical light is scattered. This allows fires to be located through a thick screen of smoke. Since hotter objects emit TIR radiation more strongly they appear as very bright sources in TIR data. This makes automated detection of fires a very promising opportunity.
It is ideal to avoid in-situ fire detection by humans on the ground for safety reasons, so remote sensing methods are desirable in detecting fires. Remote sensing of surface fires is regularly performed, mainly from satellites and occasionally from manned aircraft (e.g., [25]). Visible wavelength sensors on satellites have sufficient resolution to resolve individual fires, a typical fire front being 1–5 m in width [13]. However, they cannot penetrate smoke or detect fire concealed beneath the ground. Thermal infrared sensors on satellites can be used to detect and quantify fires, e.g., MODIS, VIIRS [26,27,28]. However, they lack the necessary spatial resolution to detect the hotspots associated with underground fires (typical resolution 375 m–1 km from satellite, 50 m from aircraft). Using thermal infrared sensors on aircraft has been shown to be more effective for detecting large-scale underground peat fires than satellite data [25]. However, aircraft are prohibitively expensive for regular surveying of large areas, and flying manned aircraft over fire zones can be dangerous.
Drones (a.k.a. unmanned areal vehicles, UAVs, unmanned aircraft systems, remotely piloted aircraft) can be used to survey large areas quickly and efficiently from the air, whilst allowing the pilot to remain a safe distance from hazardous areas. Drones provide a versatile platform for remote sensing [29], and the addition of TIR cameras has potential for detecting fires which are not visible to the eye or with conventional RGB cameras. As far as the authors are aware this type of survey has not been attempted for subterranean fires previously. In this paper we present the results of a pilot study to investigate whether subterranean peat fires can be detected with a drone equipped with a thermal infrared camera, and the potential advantages and limitations of this technology. We first investigate experimentally how well open and subterranean fires can be observed and detected with a drone-mounted TIR sensor, both by eye and using a rudimentary automated detection algorithm. We then construct some synthetic (model) observations to investigate the limits of detectability (automated and by-eye) and discuss possible sources of false positive and false negative detections. Finally, we discuss the steps which would be required to fully automate a large-area, effective and reliable subterranean fire detection system.

2. Method

2.1. Site and Observing Conditions

To reliably detect underground peat fires from a drone, their typical characteristics in the TIR data should first be understood. This is also vital for constructing and understanding the reliability of an automated detection system. To gain this understanding we constructed carefully controlled underground peat fires in degraded peatland near Palangkaraya in Central Kalimantan, Indonesia (near 2.297 S, 114.032 E). The location of the experiments is similar in ground and vegetation composition to the locations where real underground fires are typically found. We gathered TIR data above the fires using a drone and ran a prototype automated detection algorithm to quantify how reliably the fires could be detected this way.
The experiments were performed between 12–15th July 2018. Weather conditions were 27–33 C, 60–75% humidity, light winds of 1–5 km/h, pressure 1007–1009 hPa, see 
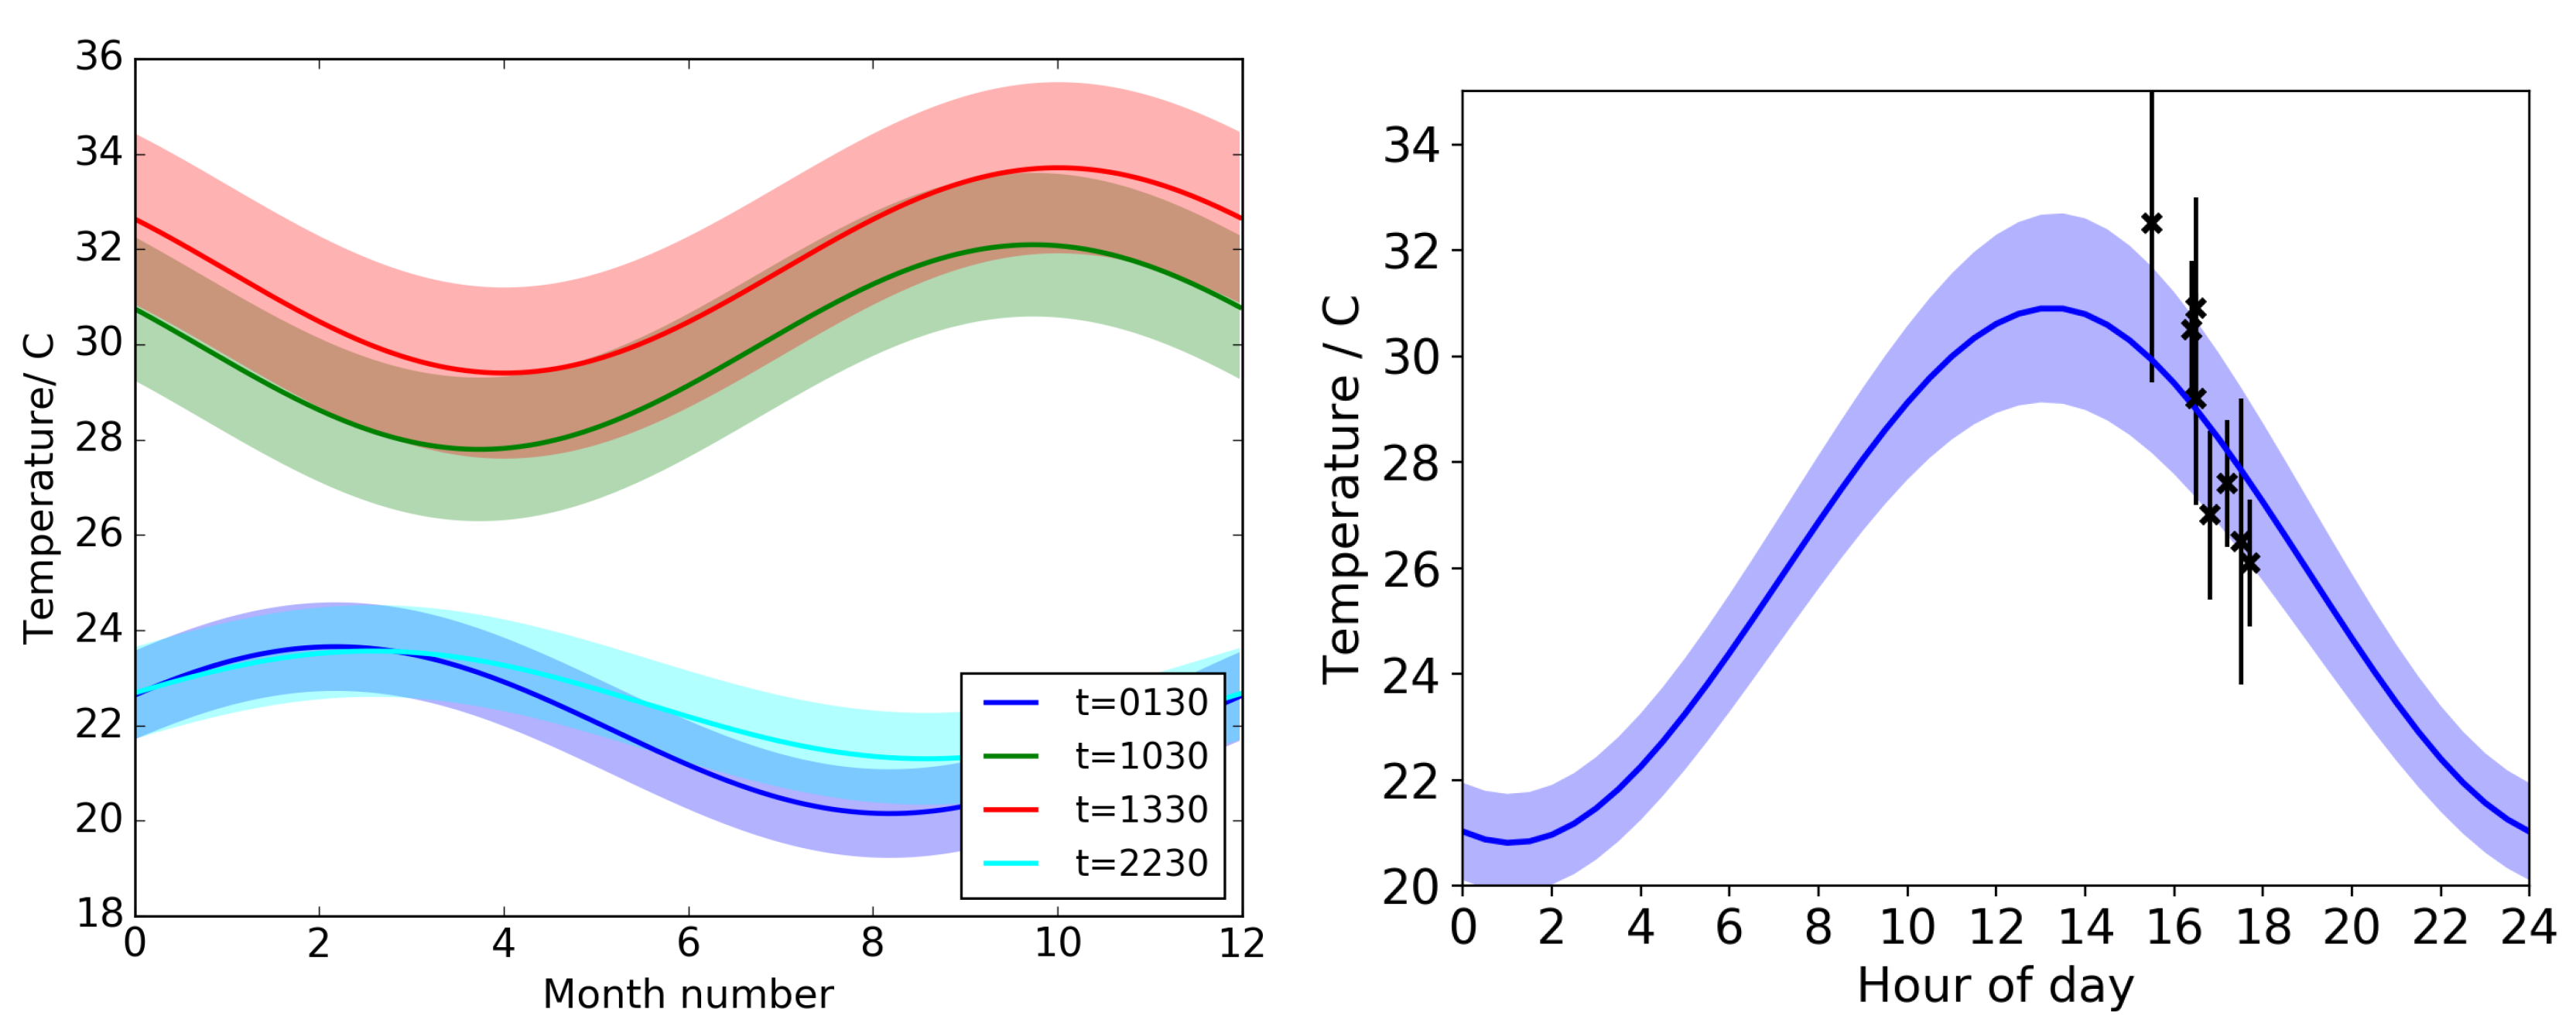
Table 1. The climatological normal ground temperature for this time of year in the region where the test was performed was calculated following [30] to be in the range 26–33 C, as is shown in Figure A1. The weather during the observations was clear, meaning the ground received solar heating during the daytime. Whilst the increase in temperature as a result of sunshine is included in the LST forecast, if the temperature of the ground is close to that of the fire then it will be difficult to distinguish the fire from the surroundings. Since the surface temperature above underground fires are reported to be >50 C in the literature [10,13], we expected the fires to be clearly visible in the TIR data at any time of day. We discuss the significance of this difference in temperature, and the consequent detection likelihood in Section 4.

2.2. Equipment

We used a custom hexacopter drone, which was developed based on a Tarot 680 airframe, using a Pixhawk 2.1 flight controller. The drone was equipped with a custom designed two-axis brushless gimbal mechanism to provide a stabilisation in both roll and pitch and independent control of the camera pitch angle. The camera was interfaced to the flight controller to enable remote triggering and record geotagging (GPS) information. Live video was transmitted via a 5.8 GHz analogue video transmitter and receiver system. We used a FLIR Duo Pro R camera system, containing a Tau2 TIR detector ( 640 × 512 pixels, 30 Hz) with 13 mm lens ( 45 × 37 field of view, FOV), and a 4K RGB camera (4000 × 3000 pixels, 56 × 45 FOV) affixed side-by-side. All flights were performed with nadir pointed cameras (looking straight down).
An important consideration when planning remote observations is the maximum distance between the detector and object of interest at which the object can be resolved. In this case the flying height of the drone must be balanced with the resolution of the camera. Generally drones are not flown above 150 m above ground level (AGL) for safety and visibility reasons (upper limits on flying height depend on region where flights are being performed—the example of 150 m is consistent with EU law). With the camera pointed to the nadir, at this height the TIR camera we have used will have an individual pixel size of 18.5 cm projected on the ground. Provided the fires we constructed are at least 18.5 × 18.5 cm then they will be resolved by the detector at 150 m AGL. As the height of the drone decreases from this maximum, the camera will be able to resolve smaller objects.
The radiometric accuracy of the TIR sensor used in ±5 C (or ±5% depending which is bigger), the camera is radiometrically calibrated by the manufacturer. The precision (sensitivity) of the TIR sensor used is 0.05 C, so small pixel-to-pixel changes can be easily identified However, absolute temperature measurements come with relatively large uncertainties. Our aim is to detect fires as a consequence of changes in temperature from the surrounding ground. As such the uncertainty in absolute temperature measurement is not a concern for this study.

2.3. Experimental Setup

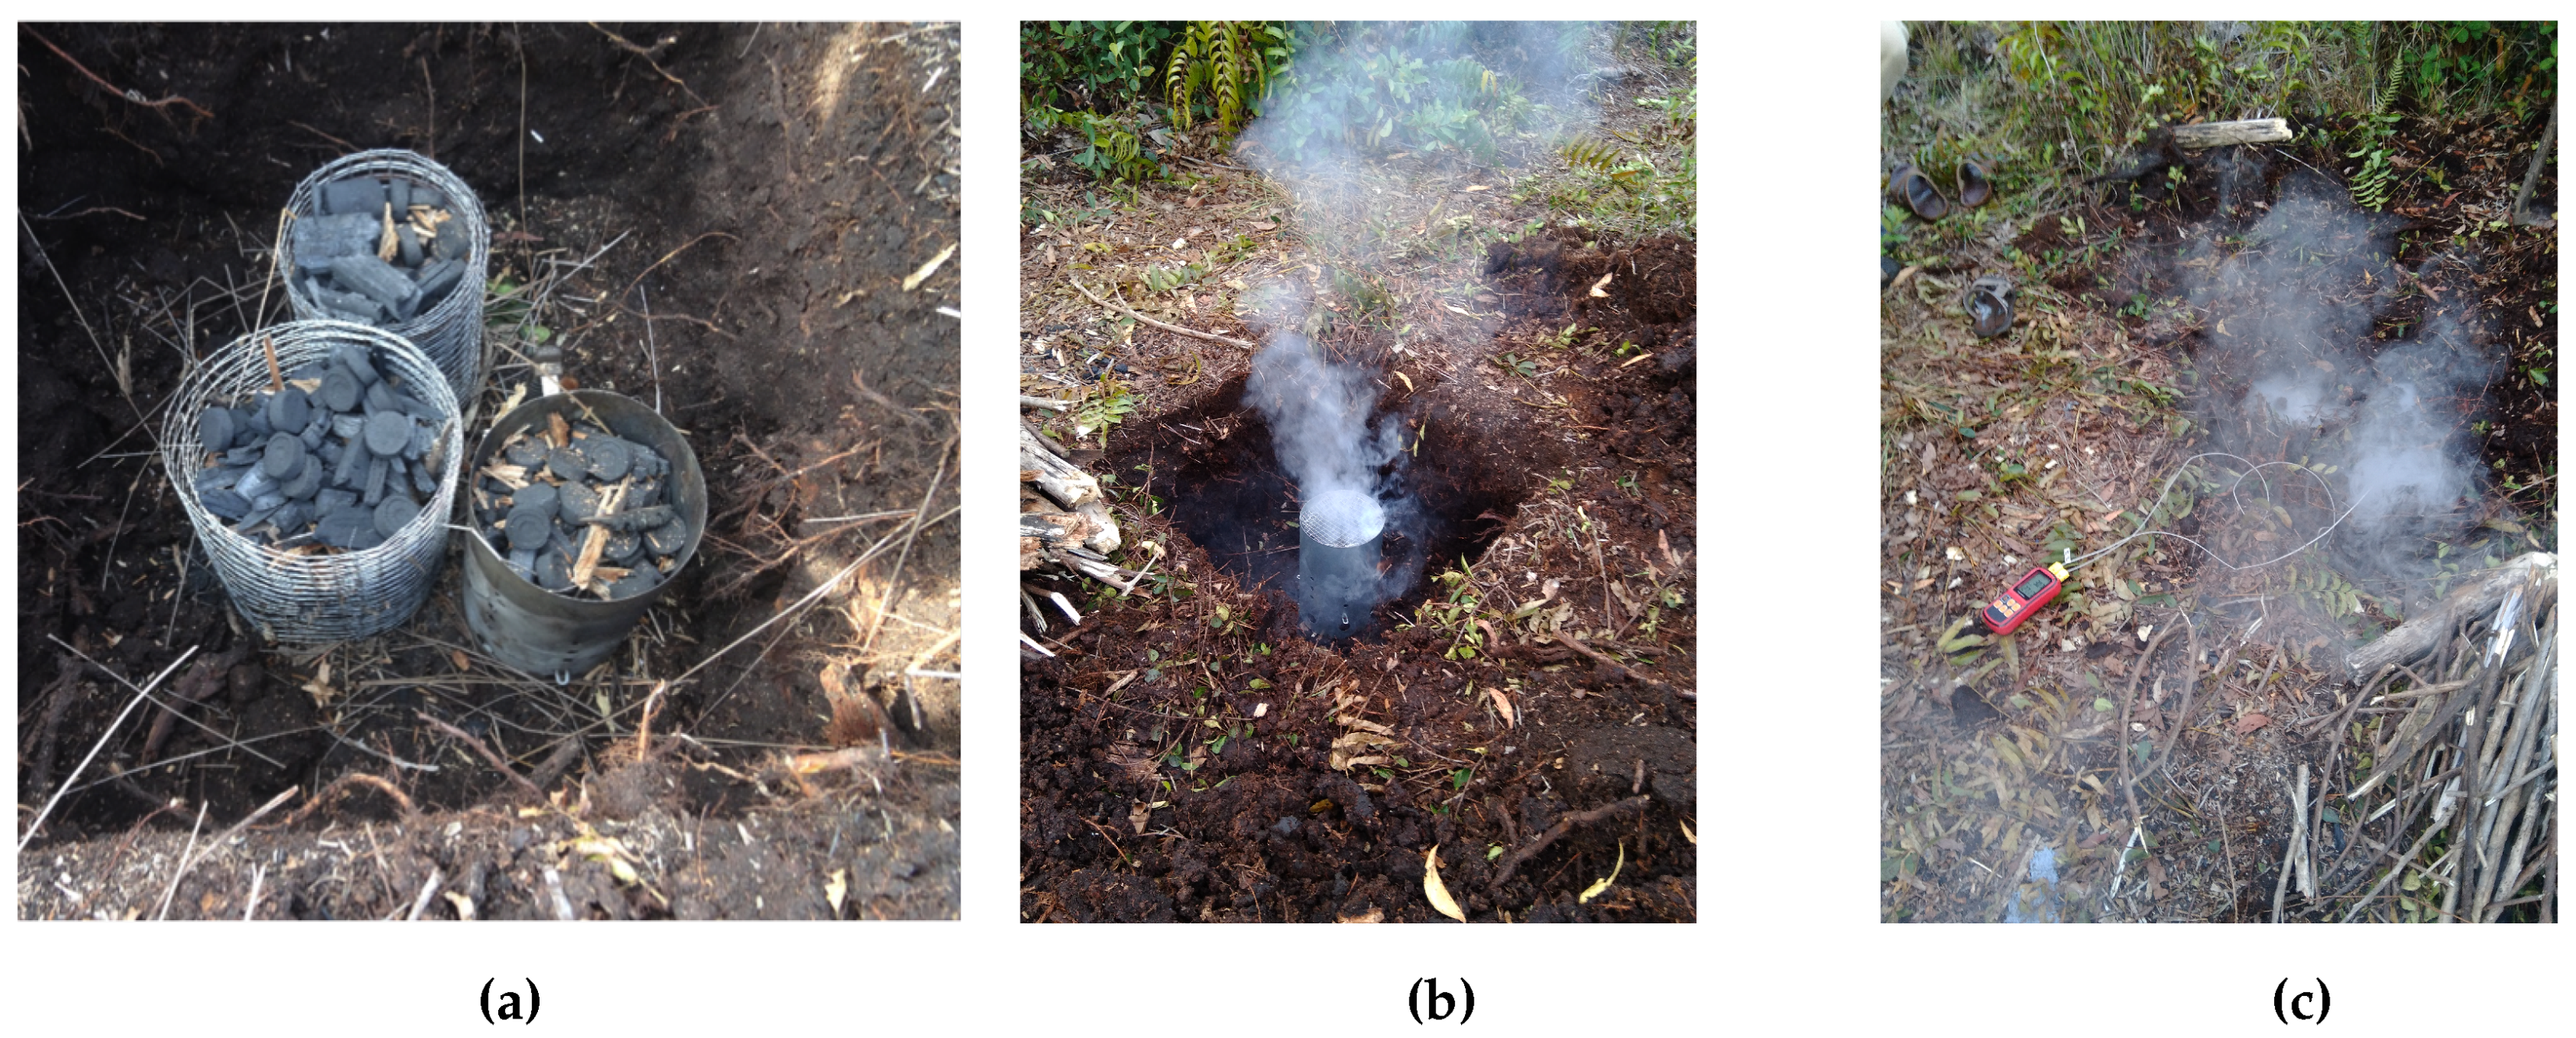
To ensure that hot sources detected are indeed subterranean peat fires, and to understand how the fires appear under different conditions (depth of fire, size of fire, smokiness of fire or surrounding region, etc.), we performed a series of experiments. We dug a series of pits, lit fires in them and then buried the fires underneath peat and vegetation. Since the pits and soil used to bury the fires were in the typical landscape for natural peat fires, these experiments form a reasonable approximation to a real-life scenario, albeit at a much smaller scale. Appropriate safety precautions were taken at each stage to ensure that the fire remained under control, that it did not lead to any unintentional subterranean fires of the kind we would like to prevent, and that it was safely extinguished after the data were taken.
The fires were contained within an aluminium cylinder 30 cm long × 19 cm diameter, filled with charcoal briquettes (approx 2.8 kg capacity). A flaming fire that was not well established in its fuel (burning above the surface only) would go out once buried, and in this experiment our aim is to detect fires that are smouldering, not flaming. As such, after igniting our fuel we waited until the fire was smouldering rather than flaming. The fire was then buried and covered over with the peat-soil which was dug out to make the pit, Figure 1. More or fewer aluminium cylinders were used to vary the size of the fires for different experiments (additional cylinders were constructed from chicken wire).
The temperature of the fire itself and the surface temperature above the fire once it was buried were also measured using a Kamtop digital thermometer with K-type thermocouples (accuracy ±0.6 C). One thermocouple probe was placed as close to the centre of the fire as possible, and another on top of the closed pit. The temperatures recorded for the fire itself were in the range 110–260 C, consistent with the temperatures reported for real-life peat fires [13,23,31].
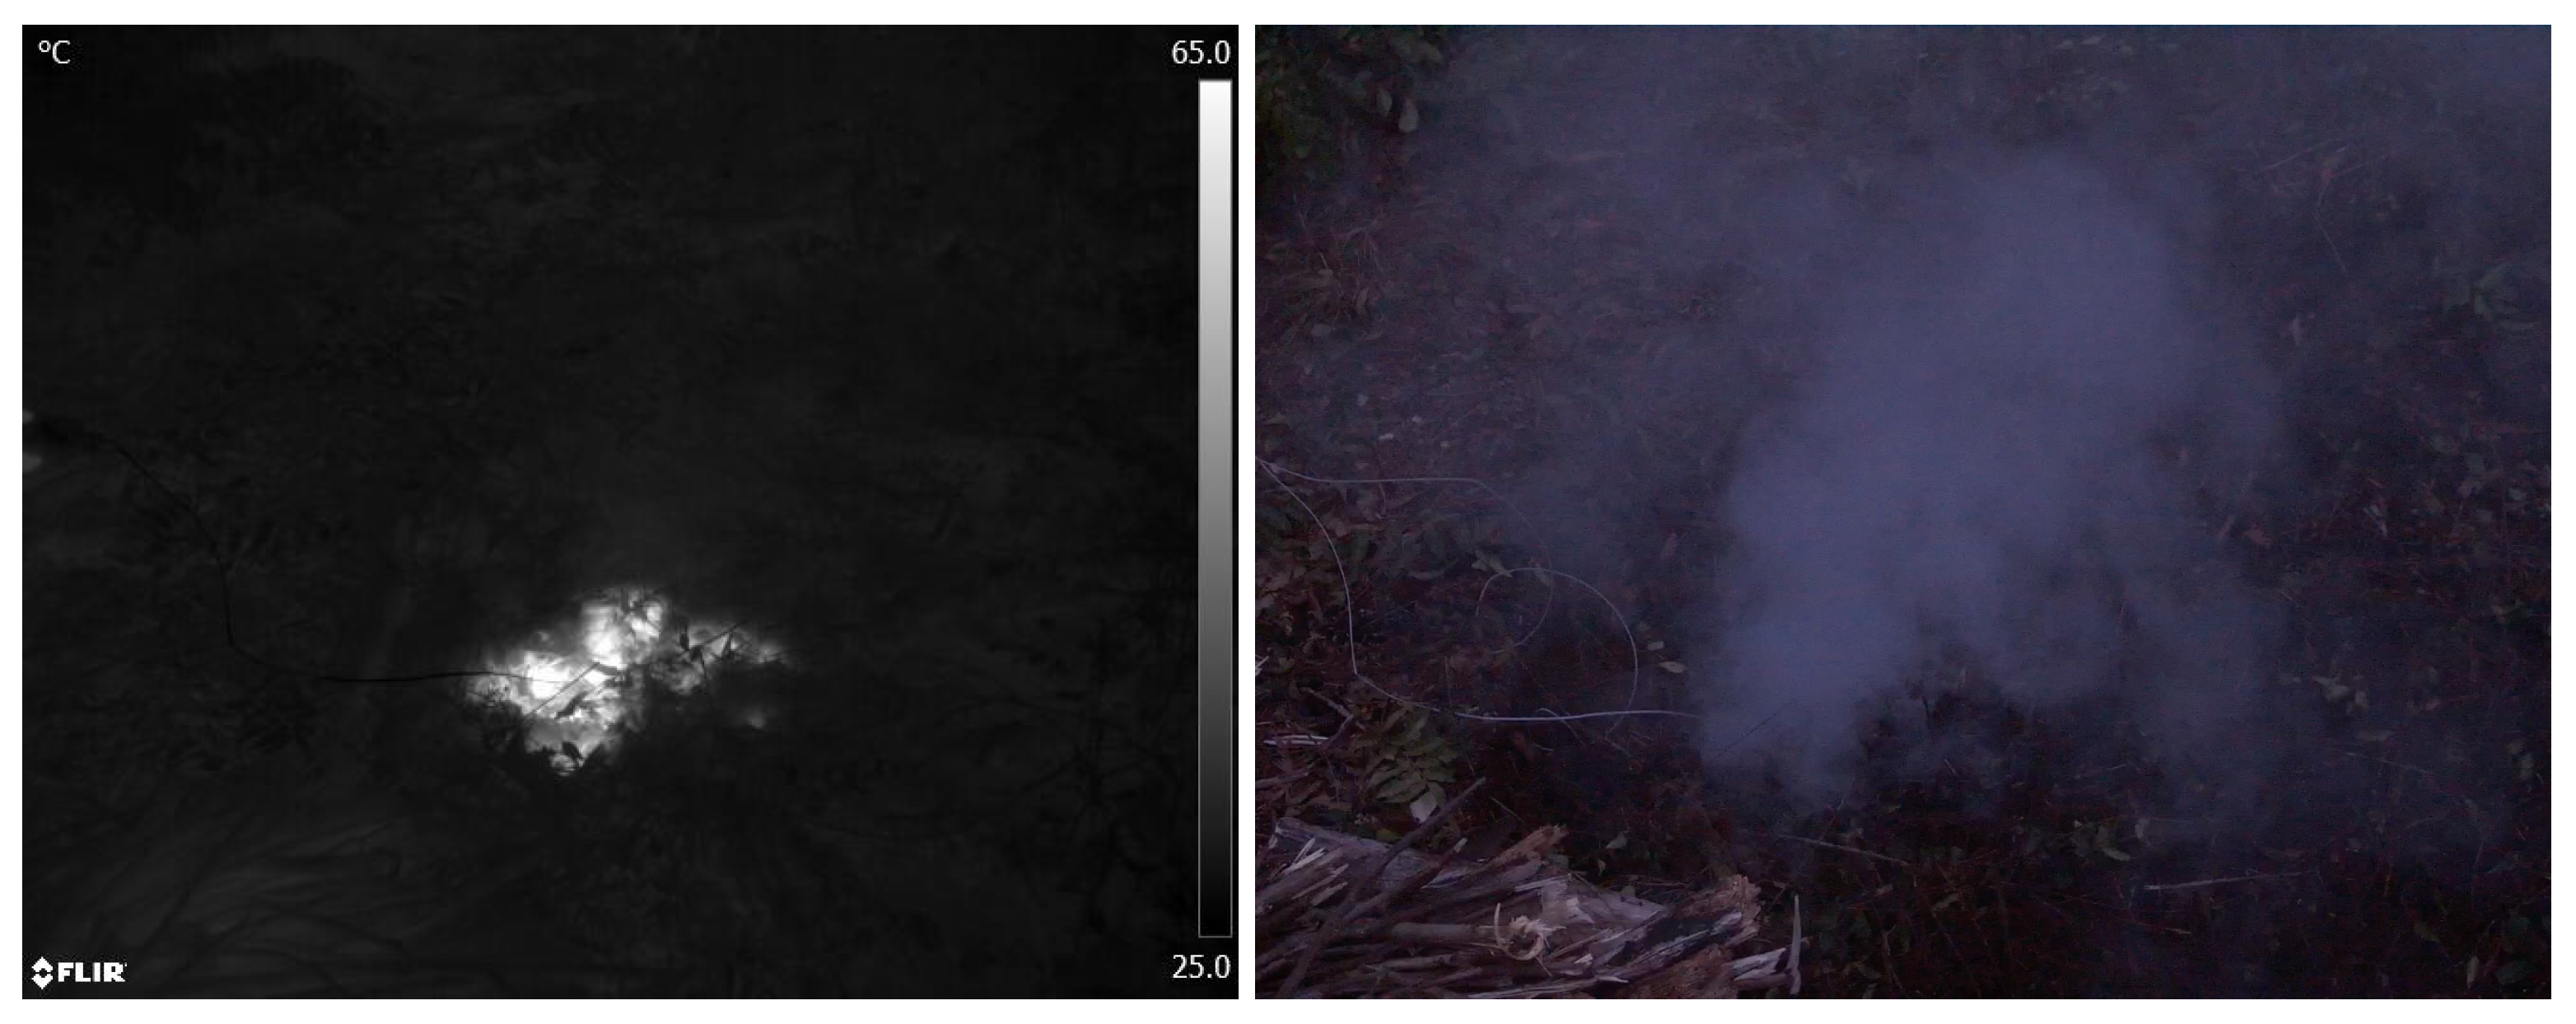
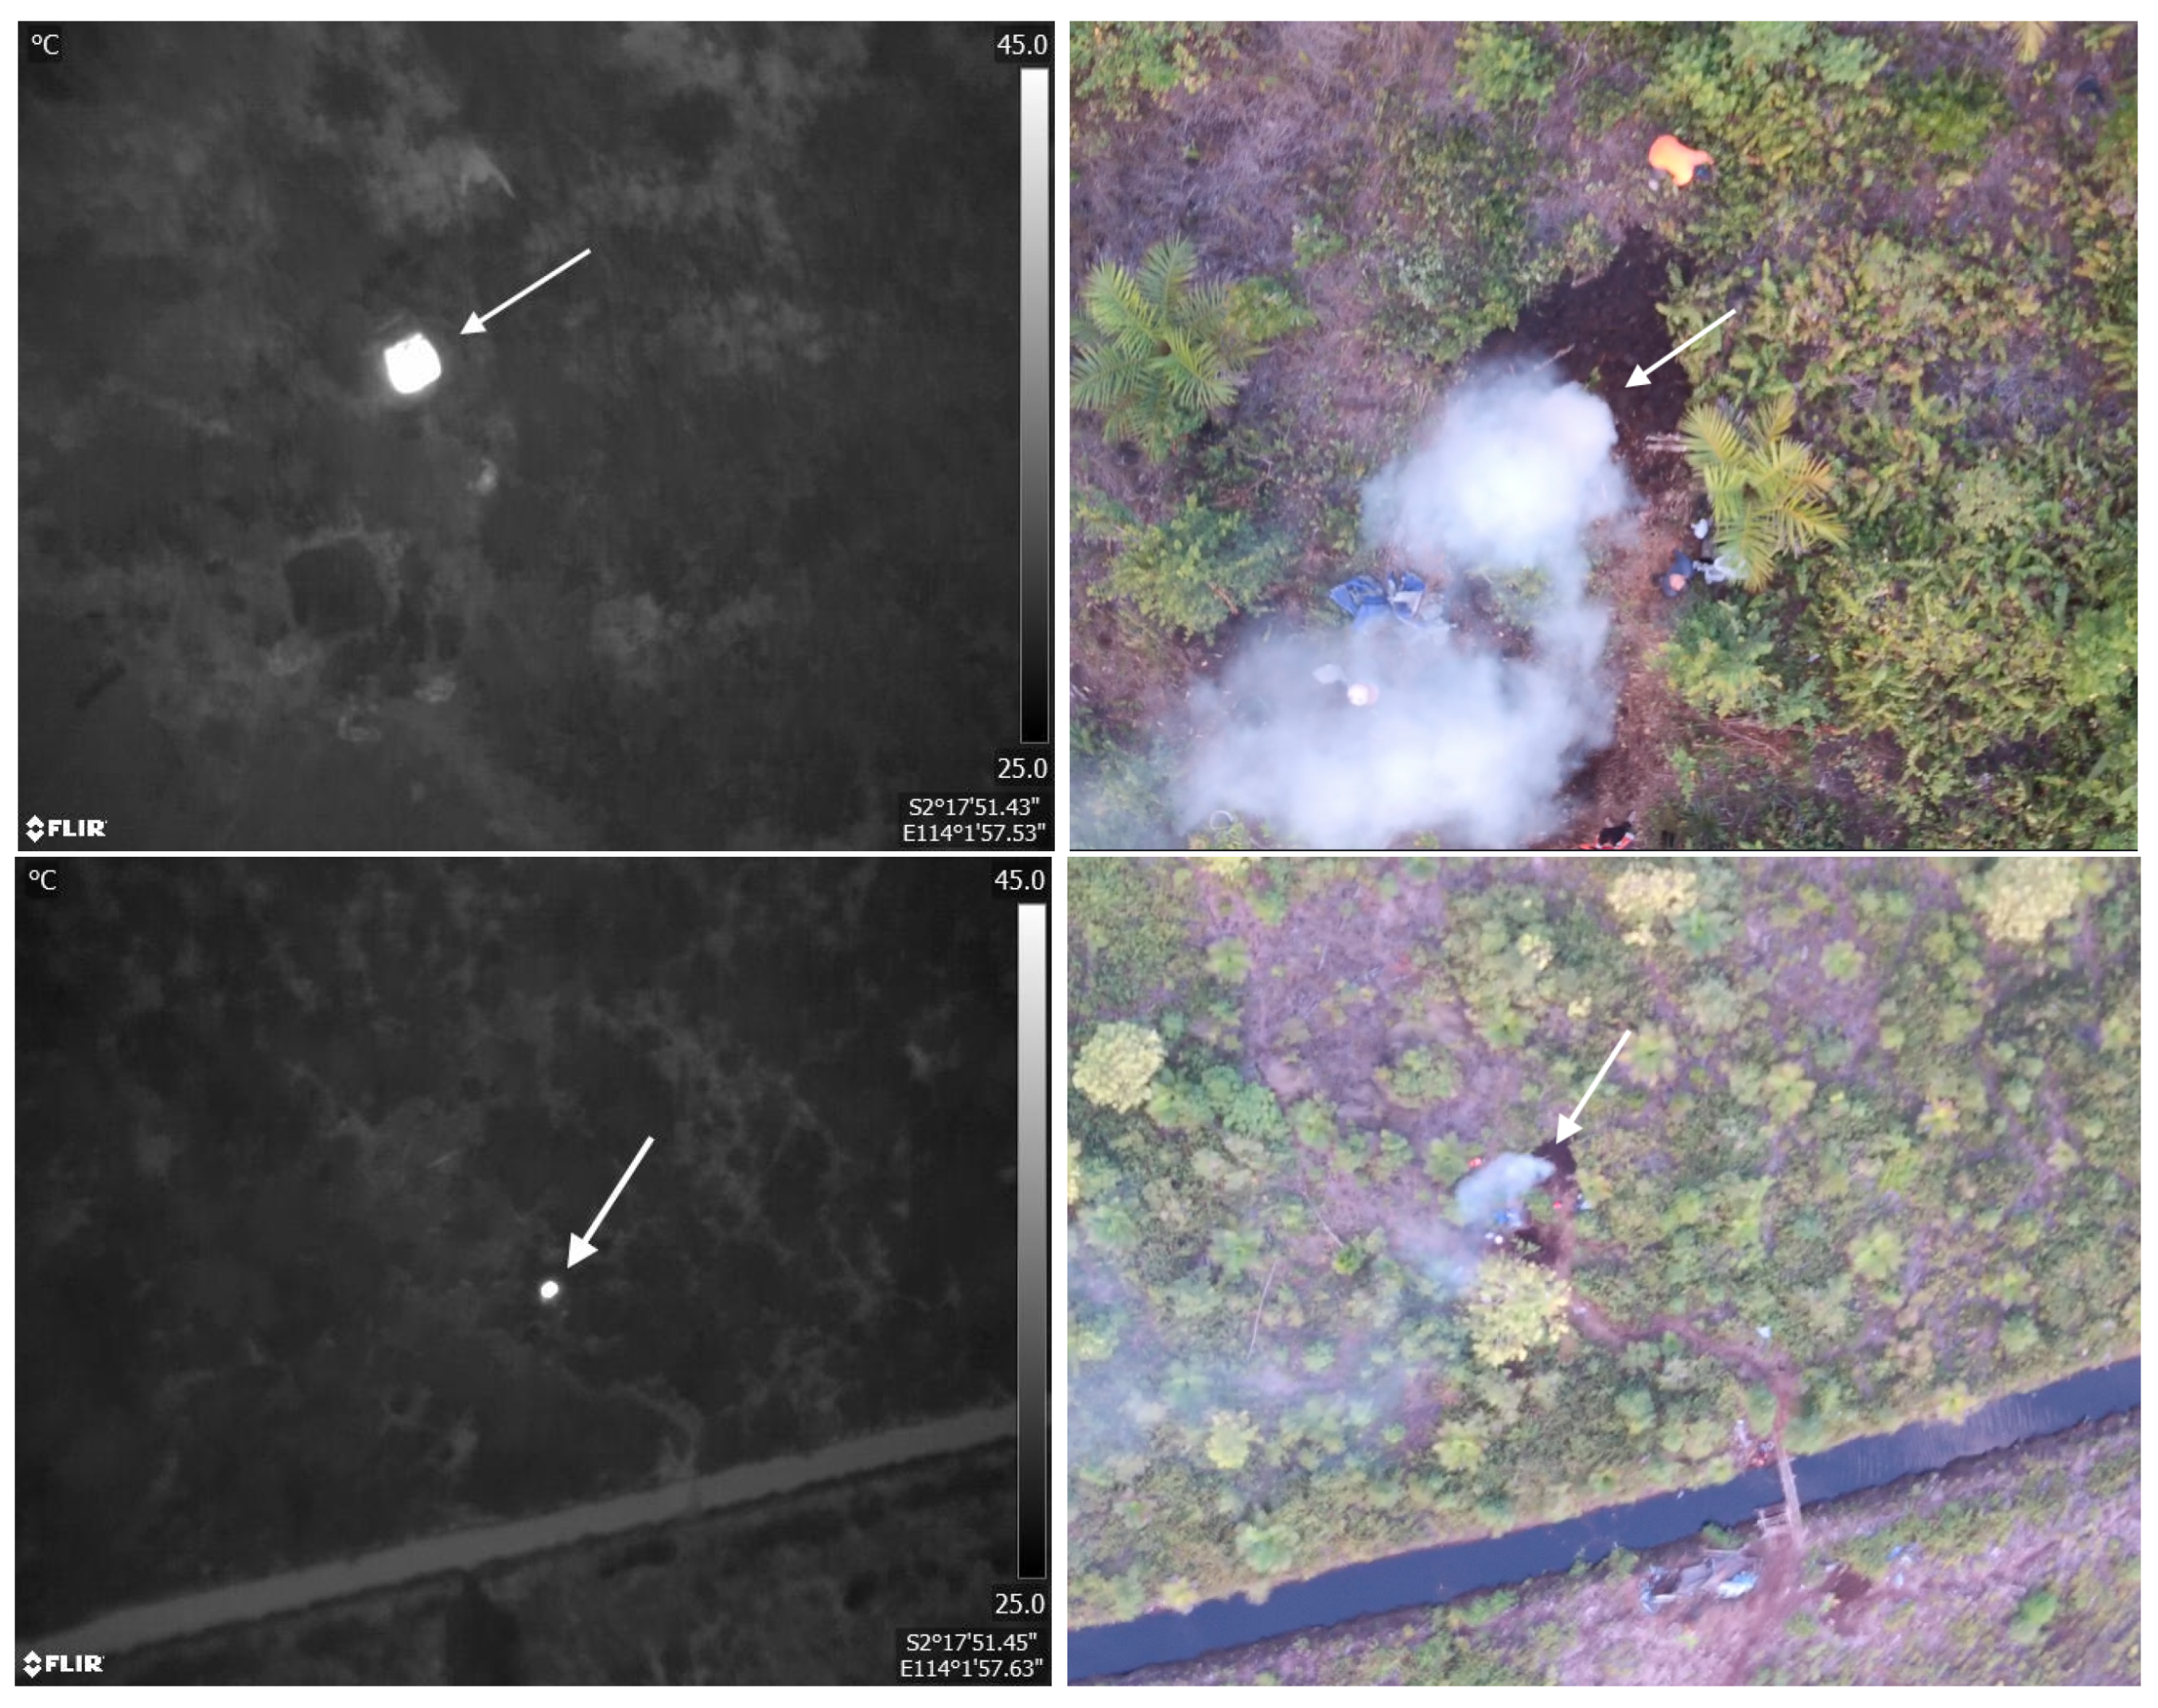
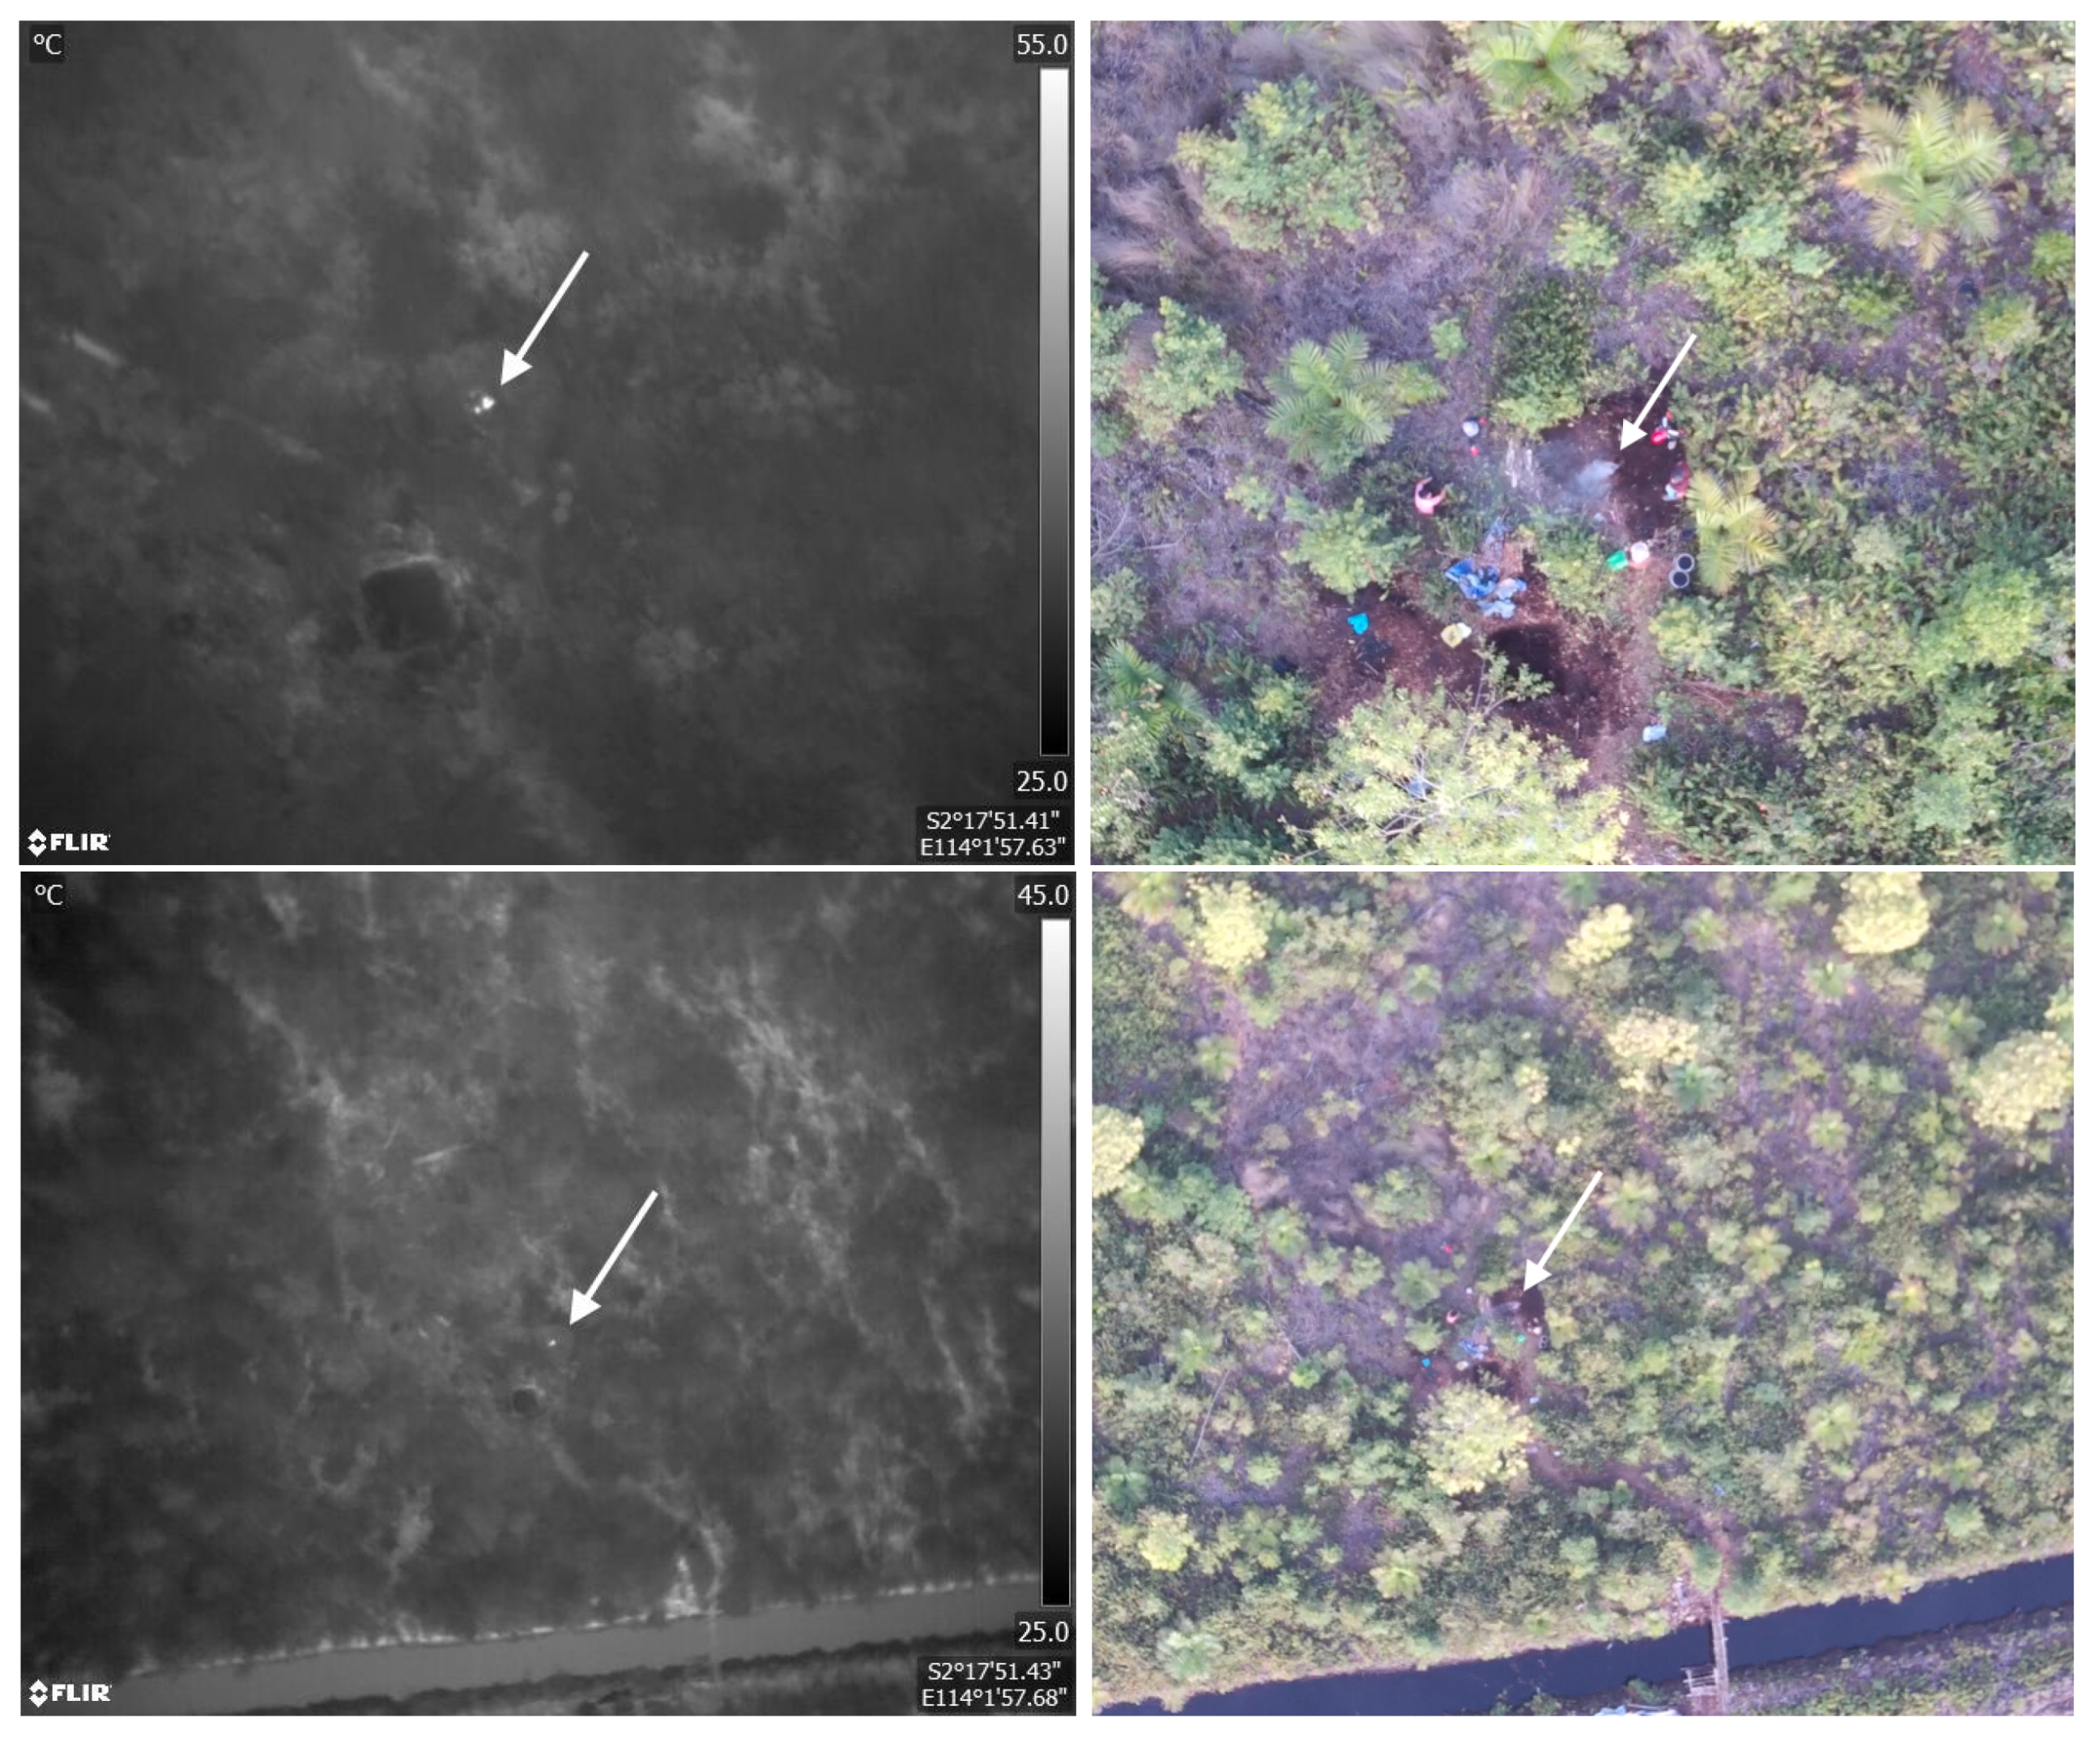
We performed five observations of fires. In experiments 1 and 2 we gathered data of open fires, to demonstrate that the fire can indeed be detected through smoke and that the drone will function safely in these conditions. In experiment 3 we gathered data of a buried fire from the ground in order to have a point of reference of how the fire appears compared to data taken from the drone. In experiments 4 and 5 we flew the drone with TIR camera mounted to test the detectability of different sized fires from the drone.

2.4. Data Collection

The TIR-equipped drone data were gathered after fires were buried and the heat given a minimum of 30 min to reach the surface. The drone with TIR camera was flown over the fire at 20–100 m AGL. The drone was hovered in place above the fire at 20 m AGL and then the height gradually increased. The details of each experiment performed are summarized in Table 2.

2.5. Automated Detection

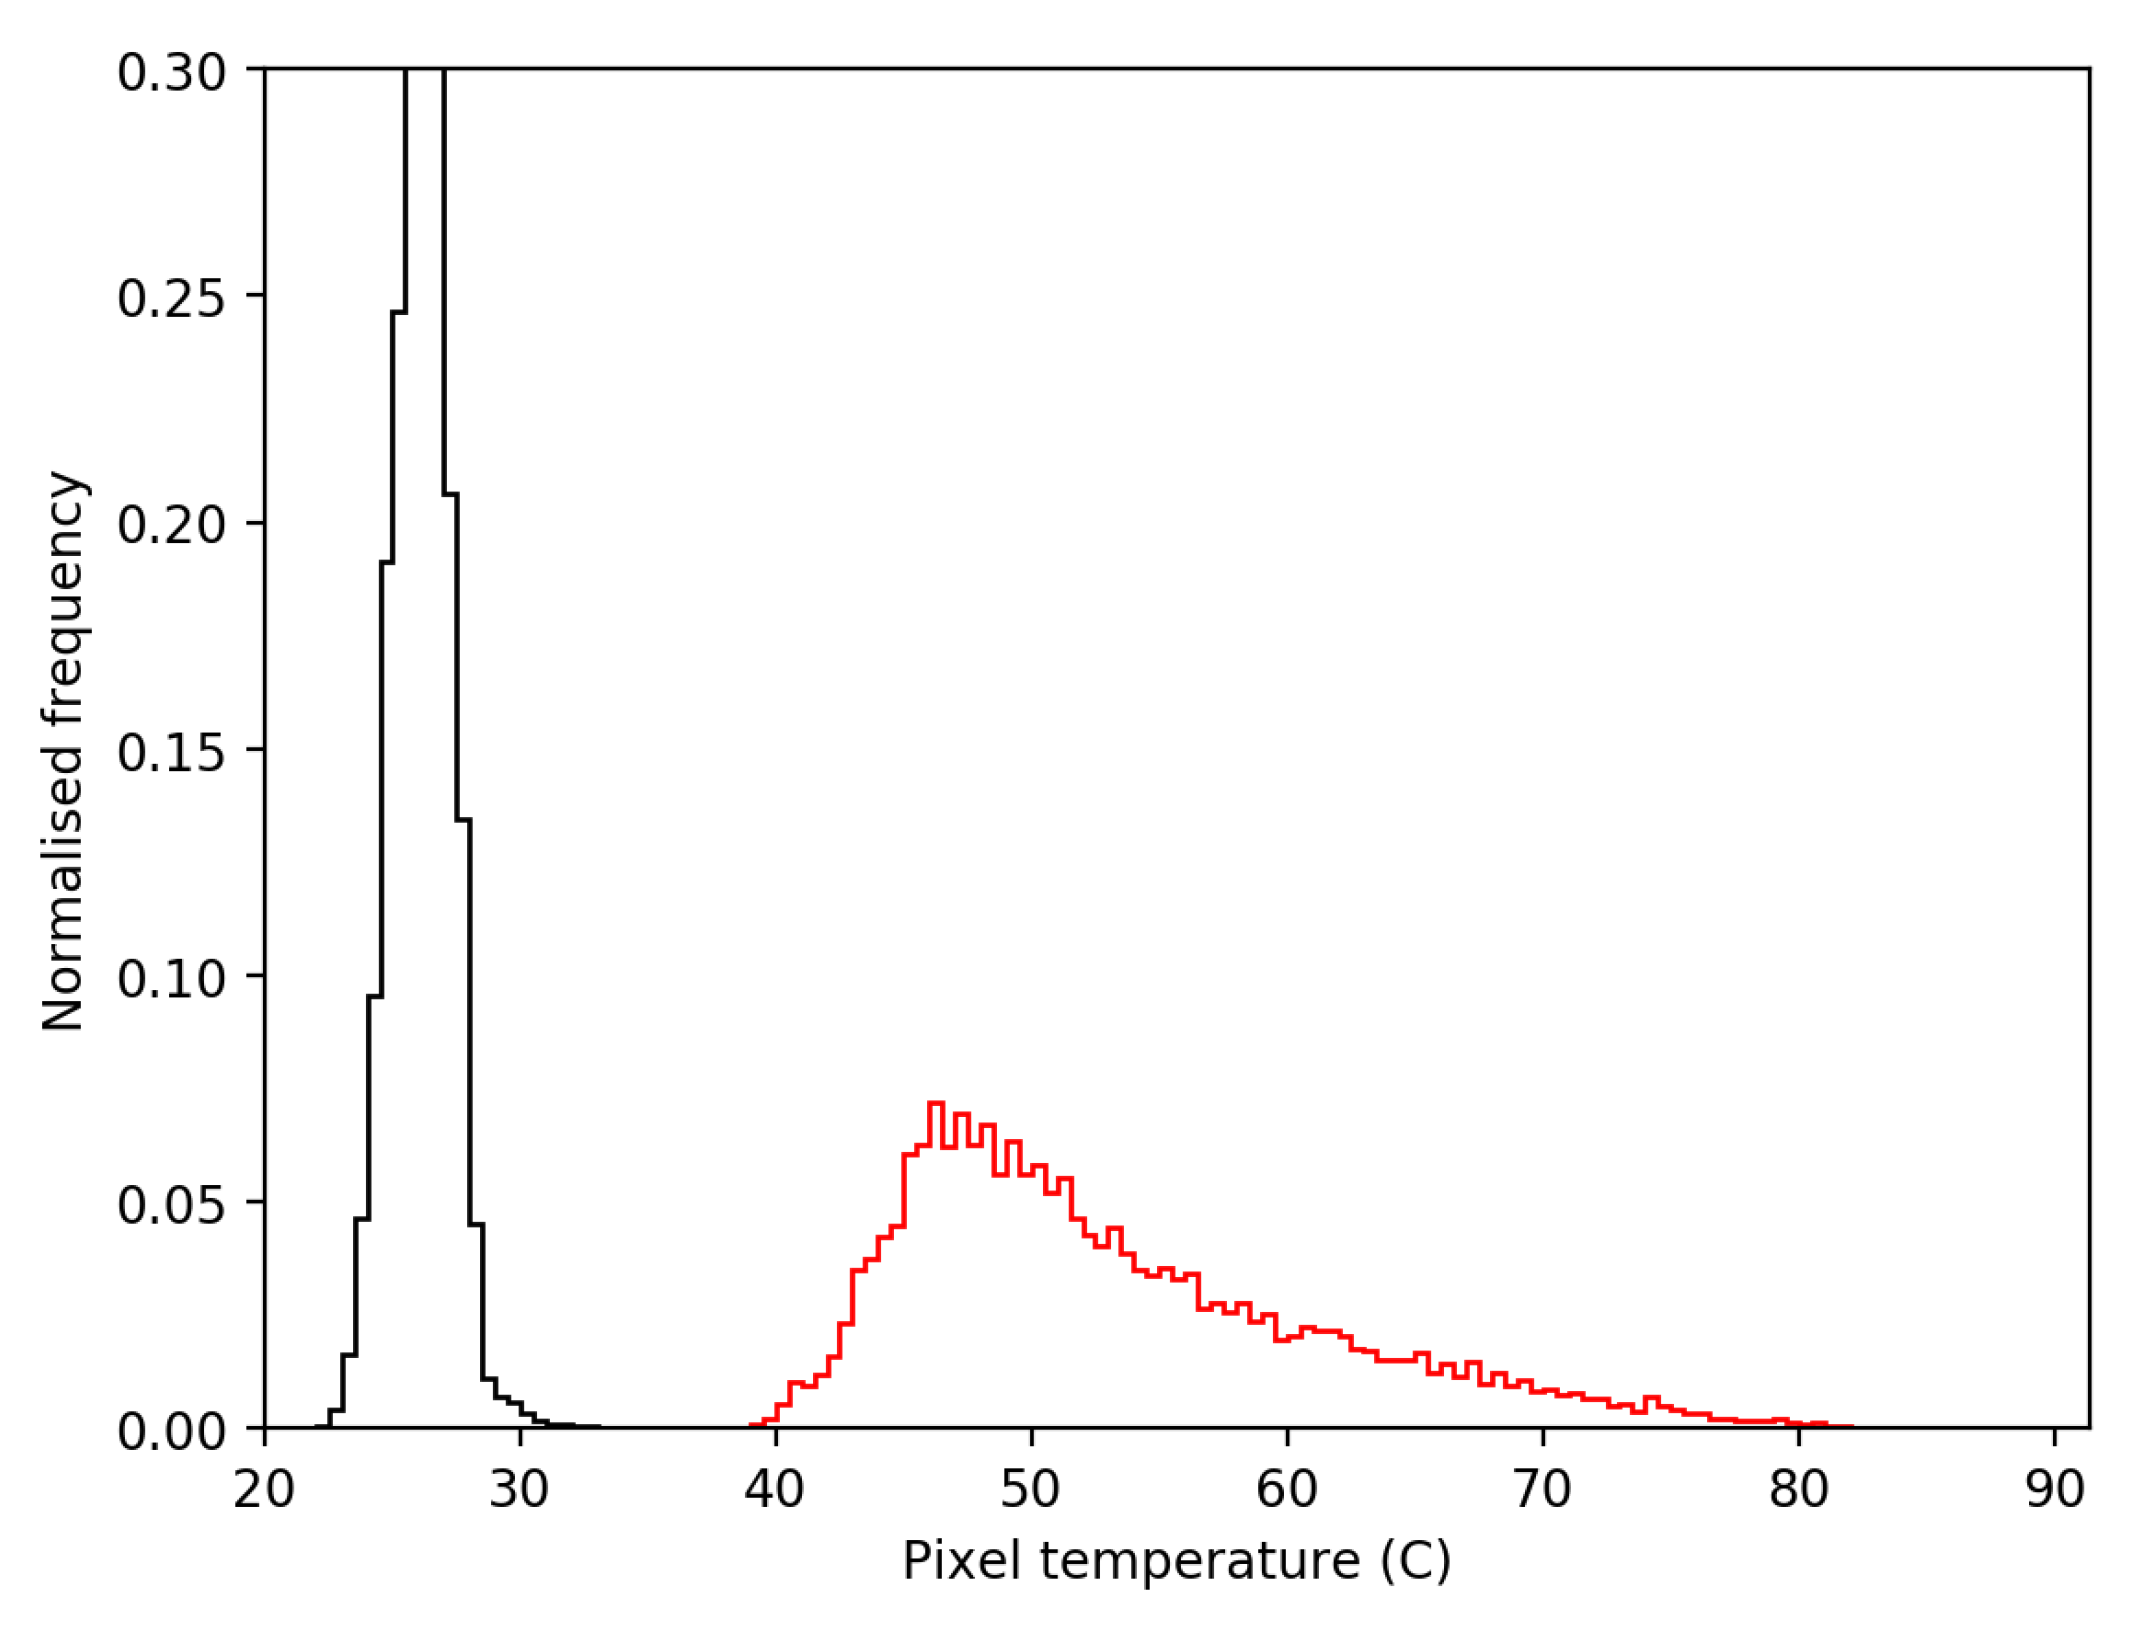
The fires were automatically detected using a simple temperature and size thresholding algorithm (coded in Python by C.B.). The algorithm reads in a frame from the TIR data obtained from the drone and searches for objects matching specific size and temperature parameters. The parameters which can be adjusted are minimum temperature and minimum number of pixels spatially adjacent to each other above the minimum temperature. The detection threshold for these experiments was set at the 99th percentile of temperatures recorded for each flight (i.e., the 1% of hottest pixels, discussed further in Section 4.2) and number of pixels corresponding to a projected size of 10 cm on the ground for each drone height. The positions of objects which fulfil the detection criteria are indicated with an arrow in an output image of the frame. We ran the algorithm over all TIR data taken after the drone had taken off and reached a height of 20 m AGL. The algorithm was run for every flight and for each height AGL of the drone within individual flights.

3. Results

Upon closing the fire pit, the internal fire temperature recorded by the thermocouple was between 110 C and 260 C. The surface temperature above the fire was around 35 C upon closing and increased steadily to ∼70 C over a period of an hour. This is in line with expected theoretical and experimental values from the literature for heat transfer through peat [9,13,31]. Given that the ambient ground temperature is expected to be 26–33 , the increase in surface temperature above an underground fire makes it easy to distinguish from the surrounding ground (see Figure 2). We compare the forecast and observed LST in Figure A1 and Table 1.
During experiment 2 where we made a very smokey open peat fire, the fire was clearly visible through the smoke with the thermal camera. This experiment served to show that the drone can be flown safely and that the drone and camera are still fully operational above a smoky fire (which will be the standard case when searching for wild underground fires), Figure 3.
In experiments 3, 4 and 5 all fires were clearly visible in the TIR data taken from both the drone and ground level, Figure 2 and Figure 4. The automated detection algorithm correctly detected the fire 100% of the time. No false positives were identified by either the algorithm or by eye. These results show that it is possible to detect an underground fire from a drone-mounted TIR camera between 20–100 m AGL.

4. Combining Experimental Results and Physical Understanding to Finding Real Fires

To understand the broader applicability of these methods for detecting fires of different sizes and different surface temperatures, and to examine sources of false positives and false negatives, we combine observational and modelled data.

4.1. Detection Reliability and Sources of False Negatives

At certain heights or for smaller fires, the projected size of a pixel on the ground will be larger than the size of a fire, for example, at a height of 150 m, with the camera used in this study each individual pixel will cover a projected area of 19 cm × 19 cm on the ground. Within an individual pixel the radiation from any object which is smaller than 19 cm will be blended with that emitted from any other object which is also within the footprint of that pixel on the ground. The temperature, T o b s , which is recorded by the thermal detector will be given by,
T o b s = T A A A + T B A B ( + T C A C ) A t o t a l
where T A and T B ( T C , ) are the temperatures of each source with areas A A , A B ( A C , ) within the pixel and A t o t a l is the total area covered by the pixel, all temperatures in Kelvin (the ‘spot size effect’, see [30] for a full discussion).
The surface above underground fires is significantly hotter than the typical ground temperature, often on the order 10 s of C warmer. This means that even when the thermal emission is blended with that of their surroundings they can still be distinguished in the data. For example, if an area of ground with temperature 30 C, contains an object with temperature 35 C and that object fills three quarters of a pixel in a camera mounted on a drone hovering above, then the temperature that the object will appear to be is 33.8 C (Equation (1)). Given a typical pixel to pixel variation in ground temperatures of a few degrees, this temperature difference may be difficult to discern. However, if the object is an underground fire showing a surface temperature of 70 C which fills three quarters of a pixel, then the temperature recorded will be 60 C. This will still appear clearly to the eye as a hot thermal source, and is well outside of what would be expected for natural variations in ground temperature. In reality ground and fire temperatures will vary from the estimates used here, however, even if the pixels containing fires are closer in temperature to the surrounding ground, they will still show up as the hottest pixels. When using automated detection software, even if one does not know the ground and fire temperature, setting a detection threshold for the hottest few percent of pixels is still a reasonable approach to detecting fires.
We constructed model thermal infrared data of fires based on this calculation. We modelled fires similar in size to the experimental setup, 0.5 × 0.5 m, and fire fronts 1 m and 5 m wide. For each fire size we modelled fires with surface temperatures of 40, 50, 60 and 70 C. We used a ground temperature of 30 C, with added gaussian noise with standard deviation of 2 C to represent variations in the ambient ground temperature (similar to that observed and reported in Table 1). The model output shows how each fire would appear in thermal infrared data as would be observed from a drone at 50, 100 and 150 m AGL. We also modelled the appearance of fires for the camera setup used in the experiment above (FLIR Tau 640 × 512 pixels, FOV 45 × 37 ) and a lower resolution thermal camera (FLIR Lepton) with 180 × 120 pixels and 52 × 34 FOV. The results of the models are shown in Figure 5. As is clear in this figure, even when the pixel scale is larger than 0.5 m per pixel (Figure 5f), a fire of 0.5 × 0.5 m can still be distinguished by eye. This means it may be possible to use of lower resolution (and hence cheaper) thermal camera systems than would normally be used for detecting e.g., animals of a similar size.
It is possible to fly drones at heights ALG which are greater than 150 m. We use the model fires to examine the upper limits on drone flying heights at which fires would be undetectable. As discussed, even if a fire is smaller than 1 pixel in the TIR camera, it can still be detected as a result of its temperature difference compared to the surrounding ground. In Figure 6 we show the temperature which would be observed with increasing height AGL for the 0.5 × 0.5 m fire with surface temperature 40 C (the smallest and coolest model fire presented here) and ground with temperature 30 ± 2 C. After the initial plateau, where the projected size of the fire is greater than 1 pixel, as height increases the fraction of an individual pixel taken up by this fire decreases, and the measured temperature tends towards the background temperature following Equation (1). In Figure 6, the point at which the line for observed temperature crosses into the blue shading is the height at which the fire becomes indistinguishable from the ground. For the Lepton camera this height is 462 m, and for the Tau this height is 1981 m. The projected pixel size at this height is 2.5 × 2.5 m for both cameras-the fire fills 1/25th of a pixel.
The Tau TIR camera used in the experiments described above has a pixel-to-pixel sensitivity of 0.05 C. Assuming the ground temperature variability of ± 2 C, any temperature change greater than 0.05 C outside of the range of background variability will be detectable by a simple temperature threshold algorithm like the one used here. However, small changes in temperature may not be so obvious to inspection by eye. For example, the smallest and coolest fires shown in Figure 5e,f, whilst sitting outside of the range of background temperature variability are difficult to see by eye. If one were to search for small real-life fires by using a drone flying higher than 100 m, it may be necessary to use a detection algorithm as small changes in temperature may be difficult to reliably see by eye.
Since the analysis in this section is based on model fires, the results are idealised and in reality other factors will affect detectability of fires. At heights above 1000 m AGL the effect of atmospheric absorption will become significant and will change how sources on the ground appear in the data (see [30] for details on affect of atmospheric absorption). In reality the variation of ground temperature will not be as smooth as that used in these models. Naturally occurring features such as vegetation, changes in soil type or changes in terrain type will lead to ‘lumpier’ data and may act as sources of confusion. The examination of these is beyond the scope of this paper, and will require further observational information to quantify meaningfully.
This model analysis indicates that false negatives may occur when the surface temperature of the fire is below 40 C, the fire size is small or the drone is high (≳400 m AGL). These are marginal cases according to the literature, in which fires are typically found in fronts 1–5 m wide (e.g., [13]). Not having statistics on small fires it is hard to say how many exist in reality, and hence how many one would likely miss with a thermal equipped drone. However, we can be confident that it is possible to detect all subterranean fires which are hotter than 40 C on the surface and are 1 m wide or larger from at drone at heights up to 400 m AGL, even when using a lower resolution camera than the one used in this experiment (Figure 5 and Figure 6).

4.2. False Positives

Figure 7 shows histograms of temperatures of all pixels recorded in the field of view containing the underground fire for different heights in experiment 4 described above. The pixels containing the fire are consistently much warmer than everything else in the scene. For this figure the mean temperature of the fire is 22.5 standard deviations (22.5 σ ) from the mean ground temperature (mean ground temperature = 26.1 C, σ = 1.2 C) assuming that the ground temperature follows a normal distribution. For experiment 5 the mean LST is 30.9 C with σ = 2.1 C, and the mean temperature of fire pixels is 41.2 C. In this experiment the temperature of the fire is 4.9 σ from the mean ground temperature. In a statistical sense, the odds of finding a false positive source at 4.9 σ assuming similar distribution of temperatures is 0.0001%. Even for the more conservative difference between average ground temperatures and the temperature of the fires, finding a false positive detection in environmental conditions like those in these experiments is very unlikely. One potential source of false positives are man-made objects which absorb solar radiation and become hot, such as metal roofs or similar, or car engines which can reach ∼100 C internally after running for some time. These should be straightforward to identify by visual inspection of the data.
For the small fires used in this experiment (area < 0.5 m × 0.5 m), the spot size effect (discussed above) causes the fire to appear cooler in the 100 m AGL image. However, the measured temperature is still high enough above the ambient ground temperature for a clear, statically robust detection.

5. Discussion

We have shown that underground peat fires can be imaged with thermal infrared cameras mounted on a drone from a range of heights, and appear very clearly in the data collected. We have used a simple temperature thresholding algorithm to detect the fires automatically.
To get a better understanding of the factors affecting detectability we generated model thermal camera drone data to approximate how fires will appear in different conditions. The major advantage to the detection, automated or otherwise, of underground fires is that the surface directly above them is significantly hotter than the ambient temperature of the ground [10,13]. Normally flying heights are limited by camera resolution and the spot size effect-the blending of heat produced by different sources in individual thermal detector pixels making it impossible to distinguish an object from its surroundings [30]. In the case of fires they are so much warmer than other objects around them that their heat ’overwhelms’ that of other sources, and they can still be seen as bright sources even when they couldn’t be individually resolved (i.e., when they would be impossible to see due to their small apparent size). This allows for lower resolution and potentially cheaper detecting equipment to be used, whilst still allowing reliable detections in most cases. Since there are few naturally occurring objects which have temperature as hot as fires, even when only imaging the heat propagated from underground, false positive sources will be few and far between, if at all.
It is expected that real-life subterranean peat fires will produce surface hotspots similar to those we found here [10,13,23,24]—both those in our experiments and model data. However, in both our experiment and model set ups we have used idealised conditions. In reality differences in vegetation cover, soil (peat) type, soil moisture, and variations in ground temperature may present additional difficulties in detecting fires [16]. Alternatively, if a thermal drone is used to survey an area which is prone to fires, or an area which has recently had a surface fire, the ground composition may be different and the ambient ground temperature itself may be warmer. This will present challenges in detecting live fires which we have been unable to explore here.

Survey Speed and Area Covered

Limitations on flying time (battery life) and hence area that can be covered are a regular issue when using drones. To be useful for finding fires a drone system needs to be able to cover a sufficient area fast enough for effective fire control. We examine two off the shelf thermal cameras and calculate flying speeds necessary for obtaining data in which fires could be reliably detected. Since we have determined that the surface above underground fires is likely to be much hotter than the surrounding ground and hence fairly straightforward to detect, we calculate the survey speed based on the widest field of view possible, with the drone at 150 m AGL. This allows us to calculate maximum areas covered, and as such these calculations represent an upper limit on survey size possible.
Using a relatively low resolution FLIR Lepton 180 × 120 pixel camera with 52 × 34 degree fov, at flying height of 150 m AGL the field of view will be 146 m wide. With a low frame rate of 7 fps, and needing a fire of 1 m 2 in size to appear in at least 10 frames for reliable detection, the maximum speed of drone flight would be 64.2 m/s, meaning that the area covered would be 33.82 km 2 /h. However, for a typical 3 m wingspan fixed-wing drone, typical maximum speed is likely to be in the range 30 m/s for off-the-shelf systems [32] to 50 m/s for bespoke systems (O.M. private communication), meaning covering an area of 15.77–26.28 km 2 /h.
Using the camera from this experiment (Tau2 640 × 512, 45 × 37 degree fov) for the same 1 m 2 object being viewed from 150 m AGL, the field of view on the ground would be 121.2 m wide. Assuming a frame rate 7 fps and a required sampling of ten frames on the object, the maximum speed of the drone would be 60.2 m/s and the theoretical area covered would be 26.27 km 2 /h (13.06–21.82 km 2 /h at speed 30–50 m/s). It is clear that the area possible to cover is more limited by drone speed capability than camera frame rate. As such in this case using a lower resolution (and hence cheaper) camera will yield an equal area coverage, and as discussed above, will have a similar detection reliability. The use of a higher frame rate camera (the camera used in our experiments has 30 fps) would allow fires to be detected in more frames, giving an increased confidence in detecting fires. This may be especially useful when fires are partially obscured by vegetation, as more frames per meter surveyed on the ground gives more opportunity for the heat from the fires to be detected through gaps in canopy coverage (for example).
As shown in the model fire calculation above, it is possible to detect fires from larger height AGL. For a flight at 400 m AGL, at drone speed 30 m/s, the fov of a Tau2 would be 323 m and the area possible to survey is 34.91 km 2 /h. For the Lepton the fov is 390 m and the area possible to survey is 42 km 2 /h.
Given that these calculations use the upper limit of drone speed, the areas covered here represent the ‘best case’ upper limit on coverage that it is possible to achieve for this height AGL. This calculation does not account for the time it would take to turn around at the end of transects and assumes no overlap in areas covered. As such, in reality the area possible to cover with a drone in a single flight will be smaller.
Drone battery life is a persistent limitation for using drones to cover large geographical areas. Multi-rotor style drones, such as the one used in our experimental observations, typically have flight times between 10–20 min as a result. This is less of an issue for fixed-wing style drones which are capable of flying for up to an hour. As such we envisage a fixed-wing platform as being more suitable for surveying for fires, and our area survey calculations above assume the use of a fixed-wing drone.
The calculation above shows that the area it is possible to survey with both high and low resolution cameras is large enough to be useful. However, this area was calculated using upper limits on drone height and speed. In reality the reliability of detecting fires may be affected by the issues mentioned above, and as such it may be necessary to fly slower or lower for reliable detection. More investigation and observation would be needed into the conditions under which real fires occur to get a better understanding of these limitations. Realistically, it may not be feasible to regularly patrol large areas of land with a drone. Drones may be used to fight fire in combination with other currently used technologies. For example, large fires may be detected via satellite or through public reports. Once a fire has been detected in this way, the drone is then flown over in advance of any ground teams to confirm fire presence and map it out. This information can then be used to aid in fire teams planning their attack strategy. During a prolonged fire-fighting process (it can take many days to tackle large fires), the drone then continues to fly over at intervals to monitor fire spread, identify advancing and retreating fronts, re-emerging hotspots, fully extinguished hotspots, etc. This information will facilitate on-the-ground fire-fighters to better and more safely tackle the blaze.
In this and other use scenarios, for optimal deployment of thermal drones as an effective means of detecting underground fires, a fully automated and user friendly system will need to be developed. To be able to cover large areas quickly and systematically this is likely to require the ability to fly beyond the line of sight of the drone operator. A fully autonomous system will also need to be robust to regularly flying in potentially hazardous, hot and smokey environments.

6. Conclusions

In this pilot study we have shown that subterranean peat fires can be detected using a drone equipped with a thermal infrared camera. Detection was demonstrated to be possible for open and covered fires, both by eye and using a rudimentary automated detection algorithm.
By constructing synthetic observations we were able determine the limits of detectability of underground fires. As a result of the temperature difference between the surface above a fire and the surroundings generally, we found that detections from a drone should be reliable even using non-top-of-the-range cameras, and when flying at heights up to 250 m AGL (and in excess of this in the case of higher-spec cameras). Given the temperatures of the fires the statistical likelihood of false positive detections is negligibly small.
We have shown that drones have the potential to cover large areas in a single flight, and that these areas are sufficient to be useful for surveying for fires. As such this technology represents a very promising and potentially affordable solution towards the massive challenge of controlling large scale forest fires in developing nations. Further investigation under conditions of real-life fires will be needed to fully understand how best to deploy a thermal drone system. For example, if it should be the lead method in fire detection and fire fighting, or if it would be better suited to supporting and supplementing current efforts. A logical next step would be to survey an area prone to subterranean fires during the fire season, and to develop robust and user friendly systems that are practical for use by non-experts in the field.

Author Contributions

Conceptualization, S.W., K.K., M.E.H., B.R. and Y.E.; Formal analysis, C.B.; Funding acquisition, C.B., S.W., M.M.-P. and S.L.; Methodology, C.B., S.W., M.E.H., B.R. and Y.E.; Software, O.M.; Writing—original draft, C.B.; Writing—review & editing, S.W., M.M.-P. and S.L.

Funding

This work was supported by LJMU’s GCRF small grant scheme which is part of UK’s Official Development Assistance (ODA) commitment administered by Research England. Borneo Nature Foundation has received funding for its drone work from Orangutan Appeal UK and The Orangutan Project.

Acknowledgments

We thank Markurius Sera and Eko Yudhi Aditya for drone piloting; and Fiteria Darma, Daniel Refly Katoppo and Koesmyadi for assistance in the field; and Ici P. Kulu for support. We thank the University of Palangka Raya for support and facilitating the discussion workshop that followed this trial.Permission to conduct this pilot study was provided by the Centre for the International Cooperation in Sustainable Management of Tropical Peatlands (UPT CIMTROP) at the University of Palangka Raya, with all test flights conducted in their research area. This work was made possible thanks to the input from Maisie Rashman, Paul Fergus, Carl Chalmers at the grant writing and experiment design stages.

Conflicts of Interest

The authors declare no conflict of interest.

Appendix A. Typical Land Surface Temperature in Region of Study

Figure A1. Land surface temperature climatology (derived from MODIS data between 2003-2014) for Kalimantan where this study was performed. Left: annual climatology. Right: Mid-July climatology, black crosses show the mean observed LST recorded from the TIR detector on flights performed, error bars indicate the standard deviation of observed LST. Both figures generated following [30].
Drones 03 00023 g0a1

References

  1. Moore, P.D. The ecology of peat-forming processes: A review. Int. J. Coal Geol. 1989, 12, 89–103. [Google Scholar] [CrossRef]
  2. Wosten, J.; Clymans, E.; Page, S.; Rieley, J.; Limin, S. Peat-water interrelationships in a tropical peatland ecosystem in Southeast Asia. Catena 2008, 73. [Google Scholar] [CrossRef]
  3. Charman, D. Peatlands and Environmental Change; John Wiley & Sons: Chichester, UK, 2002. [Google Scholar]
  4. Ruesch, A.; Gibbs, H. New IPCC Tier-1 Global Biomass Carbon Map for the Year 2000; Carbon Dioxide Information Analysis Center, Oak Ridge National Laboratory: Oak Ridge, TN, USA, 2008. Available online: http://cdiac.ess-dive.lbl.gov (accessed on 22 December 2018).
  5. Grishin, A.M.; Yakimov, A.S. Mathematical simulation of the process of peat ignition. J. Eng. Phys. Thermophys. 2008, 81, 204–212. [Google Scholar] [CrossRef]
  6. Grishin, A.M.; Golovanov, A.N.; Sukov, Y.V.; Preis, Y.I. Experimental study of peat ignition and combustion. J. Eng. Phys. Thermophys. 2006, 79, 563–568. [Google Scholar] [CrossRef]
  7. Grishin, A.M.; Yakimov, A.S. Mathematical modeling of the initiation and spread of peat fires. J. Eng. Phys. Thermophys. 2011, 84, 1047–1057. [Google Scholar] [CrossRef]
  8. Rein, G. Smouldering Fires and Natural Fuels. In Fire Phenomena and the Earth System; Belcher, C.M., Ed.; John Wiley & Sons: Oxford, UK, 2013. [Google Scholar] [CrossRef]
  9. Grishin, A.M.; Golovanov, A.N.; Sukov, Y.V. Experimental determination of thermophysical, thermokinetic, and filtration characteristics of peat. J. Eng. Phys. Thermophys. 2006, 79, 557–562. [Google Scholar] [CrossRef]
  10. Rein, G.; Cleaver, N.; Ashton, C.; Pironi, P.; Torero, J. The severity of smouldering peat fires and damage to the forest soil. Catena 2008. [Google Scholar] [CrossRef]
  11. Huang, X.; Rein, G. Computational study of critical moisture and depth of burn in peat fires. Int. J. Wildland Fire 2015. [Google Scholar] [CrossRef]
  12. Hadden, R.; Rein, G. Burning and Suppression of Smouldering Coal Fires. In Coal and Peat Fires: A Global Perspective; Elsevier Geoscience: Amsterdam, The Netherlands, 2011; Chapter 18. [Google Scholar]
  13. Usup, A.; Hashimoto, Y.; Takahashi, H.; Hayasaka, H. Combustion and thermal characteristics of peat fire in tropical peatland in Central Kalimantan, Indonesia. Tropics 2004, 14, 1–19. [Google Scholar] [CrossRef] [Green Version]
  14. Weather and Fire in Peat Soils—A Fact Sheet; Met Office: Exeter, UK, 2003.
  15. Page, S.E.; Hooijer, A. In the line of fire: The peatlands of Southeast Asia. Philos. Trans. R. Soc. B 2017, 371. [Google Scholar] [CrossRef] [PubMed]
  16. Harrison, M.E.; Page, S.E.; Limin, S.H. The global impact of Indonesian forest fires. Biologist 2009, 56, 156–163. [Google Scholar]
  17. Gaveau, D.; Salim, M.; Hergoualc’h, K.; Locatelli, B.; Sloan, S.; Wooster, M.; Marlier, M.; Molidena, E.; Yaen, H.; DeFries, R.; et al. Major atmospheric emissions from peat fires in Southeast Asia during non-drought years: Evidence from the 2013 Sumatran fires. Sci. Rep. 2014, 4, 6112. [Google Scholar] [CrossRef] [PubMed]
  18. Republic of Indonesia: Kementerian Koordinator Bidang Perekonomian, Kementerian Perencanaan Pembangunan Nasional. Grand Design Pencegahan Kebakaran Hutan, Kebun Dan Lahan 2017–2019; Badan Perencanaan Pembangunan Nasional (BAPPENAS): Jakarta, Indonesia, 2017.
  19. Carmenta, R.; Zabala, A.; Phelps, J. Indonesian Peatland Fires. Perceptions of Solutions; Center for International Forestry Research: Bogor, Indonesia, 2015. [Google Scholar]
  20. Crippa, P.; Castruccio, S.; Archer-Nicholls, S.; Lebron, G.B.; Kuwata, M.; Thota, A.; Sumin, S.; Butt, E.; Wiedinmyer, C.; Spracklen, D.V. Population exposure to hazardous air quality due to the 2015 fires in Equatorial Asia. Sci. Rep. 2016. [Google Scholar] [CrossRef] [PubMed]
  21. Koplitz, S.N.; Mickley, L.J.; Marlier, M.E.; Buonocore, J.J.; Kim, P.S.; Liu, T.; Sulprizio, M.P.; DeFries, R.S.; Jacob, D.J.; Schwartz, J.; et al. Public health impacts of the severe haze in Equatorial Asia in September-October 2015: Demonstration of a new framework for informing fire management strategies to reduce downwind smoke exposure. Environ. Res. Lett. 2016. [Google Scholar] [CrossRef]
  22. Lohberger, S.; Stangel, M.; Atwood, E.C.; Siegert, F. Spatial evaluation of Indonesia’s 2015 fire affected area and estimated carbon emissions using Sentinel-1. Glob. Chang. Biol. 2018. [Google Scholar] [CrossRef] [PubMed]
  23. Grishin, A.M.; Yakimov, A.S.; Rein, G.; Simeoni, A. On physical and mathematical modeling of the initiation and propagation of peat fires. J. Eng. Phys. Thermophys. 2009, 82, 1235–1243. [Google Scholar] [CrossRef]
  24. Yulianti, N. Detection of Surface Peat Fires (Smoldering) using Infra Red (IR) Images. In Proceedings of the 1st International Conference, Geoscience for Energy, Mineral Resources, and Environment Applied 2014, Bandung, Indonesia, 28 October 2014. [Google Scholar]
  25. Gumbricht, T.; McCarthy, T.; McCarthy, J.; Roy, D.; Frost, P.; Wessels, K. Remote sensing to detect sub-surface peat fires and peat fire scars in the Okavango Deita, Botswana. S. Afr. J. Sci. 2002, 98, 351–358. [Google Scholar]
  26. Schroeder, W.; Oliva, P.; Giglio, L.; Csiszar, I.A. The New VIIRS 375m active fire detection data product: Algorithm description and initial assessment. Remote Sens. Environ. 2014. [Google Scholar] [CrossRef]
  27. Wooster, M.; Zhukov, B.; Oertel, D. Fire radiative energy for quantitative study of biomass burning: Derivation from the BIRD experimental satellite and comparison to MODIS fire products. Remote Sens. Environ. 2003. [Google Scholar] [CrossRef]
  28. Li, F.; Zhang, X.; Kondragunta, S.; Csiszar, I. Comparison of Fire Radiative Power Estimates From VIIRS and MODIS Observations. J. Geophys. Res. Atmos. 2018. [Google Scholar] [CrossRef]
  29. Colomina, I.; Molina, P. Unmanned Aerial systems for Photogrammetry and Remote Sensing: A Review. ISPRS J. Photogramm. Remote Sens. 2014, 92, 79–97. [Google Scholar] [CrossRef]
  30. Burke, C.; Rashman, M.; Wich, S.; Symons, A.; Theron, C.; Longmore, S. Optimising observing strategies for monitoring animals using drone-mounted thermal infrared cameras. Int. J. Remote Sens. 2018. [Google Scholar] [CrossRef]
  31. Grishin, A.; Yakimov, A. Mathematical modelling of thermophysical processes at peat firing and smoldering. Thermophys. Aeromech. 2010, 17, 137–153. [Google Scholar] [CrossRef]
  32. UAV Factory USA. Penguin BE Electric Platform—Datasheet v1.1; UAV Factory USA, LLC 50: Irvington, NY, USA, 2018. [Google Scholar]
Figure 1. (a) Experimental setup with three cylinders and charcoal unlit. (b) 1 cylinder with coals lit. Pit measured 70 cm × 70 cm and 80 cm deep for all experiments. Cylinders were placed in the centre of the pit and lit and allowed to burn until no longer flaming and only smouldering. Once coals were smouldering the fire was buried (c) with thermocouples inserted.
Drones 03 00023 g001
Figure 2. Experiment 3. Thermal (left) and RGB (right) image of buried fire after the hole had been closed for 1 h. Internal temperature was 250 C, surface temperature was 77 C. Ambient ground temperature in the area was 25–30 C. Scale bar on the thermal image indicates temperature in C.
Drones 03 00023 g002
Figure 3. Experiment 2. Left: Examples of thermal data where open fire is visible through smoke—scale bar indicates temperature in C. Right: RGB images of same scene. Top: drone height 20 m AGL. Bottom: drone height 80 m AGL. The location of the fire as identified by the automated detection algorithm is indicated with an arrow.
Drones 03 00023 g003
Figure 4. Experiment 5. Left: Examples of thermal data where buried fire is visible through the ground—scale bar indicates temperature in C. Right: RGB images of same scene. Top: drone height 20 m AGL. Bottom: drone height 100 m AGL. The location of the fire as identified by the automated detection algorithm is indicated with an arrow.
Drones 03 00023 g004
Figure 5. Synthetic observations of model fires viewed from different heights with 2 different drone mounted thermal cameras (a–f). For each panel, top row: fire size 0.5 × 0.5 m. Middle row: fire front 1 m wide, arbitrary length. Bottom row: fire front 5 m wide, arbitrary length. Left to right-fire surface temperatures of 40, 50, 60, 70 C. (a,c,e) for a Tau 640 × 512 pixel camera with 45 × 32 degree fov (13 mm lens) as used in the experiments here. (b,d,f) for a Lepton 180 × 120 pixel camera with 52 × 34 degree fov. (a,b) drone height 50 m AGL, (c,d) drone height 100 m AGL, (e,f) drone height 150 m AGL. Scale bar indicates temperature for all panels in C.
Drones 03 00023 g005
Figure 6. Maximum drone height AGL at which a 0.5 × 0.5 m fire becomes indistinguishable from the ground. For a fire with surface temperature 40 C and ground with temperature 30 ± 2 C. Black line shows measured temperature from the Lepton-like sensor, red line shows measure temperature from the Tau-like sensor (both as described above). Blue line and shading indicates ground temperature and variation as used in Figure 5.
Drones 03 00023 g006
Figure 7. Histogram of pixel temperatures for all frames containing the fire in experiment 4, across all drone heights AGL. Black histogram shows the LST (ground temperature), red histogram shows the temperature of pixels containing the fire. The mean LST is 26.1 C with standard deviation σ = 1.2 C. The mean temperature of fire pixels is 53.2 C. Since the means are separated by 22.6 standard deviations, the likelihood of false positive detection is negligible.
Drones 03 00023 g007
Table 1. The weather recorded at the experiment site during observations and land surface temperature (LST) forecast from Figure A1 and observed on the day.
Experiment NumberObs TimeAir Temp ( C)Humidity (%)Pressure (hPa)Wind (km/h)LST ( C) Forecast/ObservedGeneral Weather and Conditions
115:3230.4601008.16.129.9 ± 1.8/32.5 ± 3.0Clear sky, no cloud
2a17:1029.7741009.24.328.4 ± 3.1/27.6 ± 1.2Clear sky, no cloud
2b17:2528.4821009.53.127.9 ± 3.6/26.5 ± 2.7
316:2632.2601008.31.629.0 ± 2.6/29.2 ± 2.0Clear sky, no cloud
4a16:5231.9711007.63.028.4 ± 3.1/27.0 ± 1.6Clear sky, no cloud
4b17:4727.6761008.22.727.9 ± 3.6/26.1 ± 1.2
5a16:2332.2581007.22.829.0 ± 2.6/30.5 ± 1.3Thin cloud layer,
5b16:3633.0611007.43.429.0 ± 2.6/30.9 ± 2.1but bright at site
Table 2. Details of experiments performed. All fire pits were 70 × 70 cm width × length.
Experiment NumberDrone Height (m)Depth to Top & Experimental Setup Fire (cm)
1Hand held, ∼1.6 high0Above ground vegetation fire
215–10030–80Open wood and peat fire
15–10030–80in 80 cm deep pit
3Tripod, 1.6 height,201 cylinder
1.9 from fire
420–80201 cylinder
20–80201 cylinder
520–100303 cylinders
20–100303 cylinders

