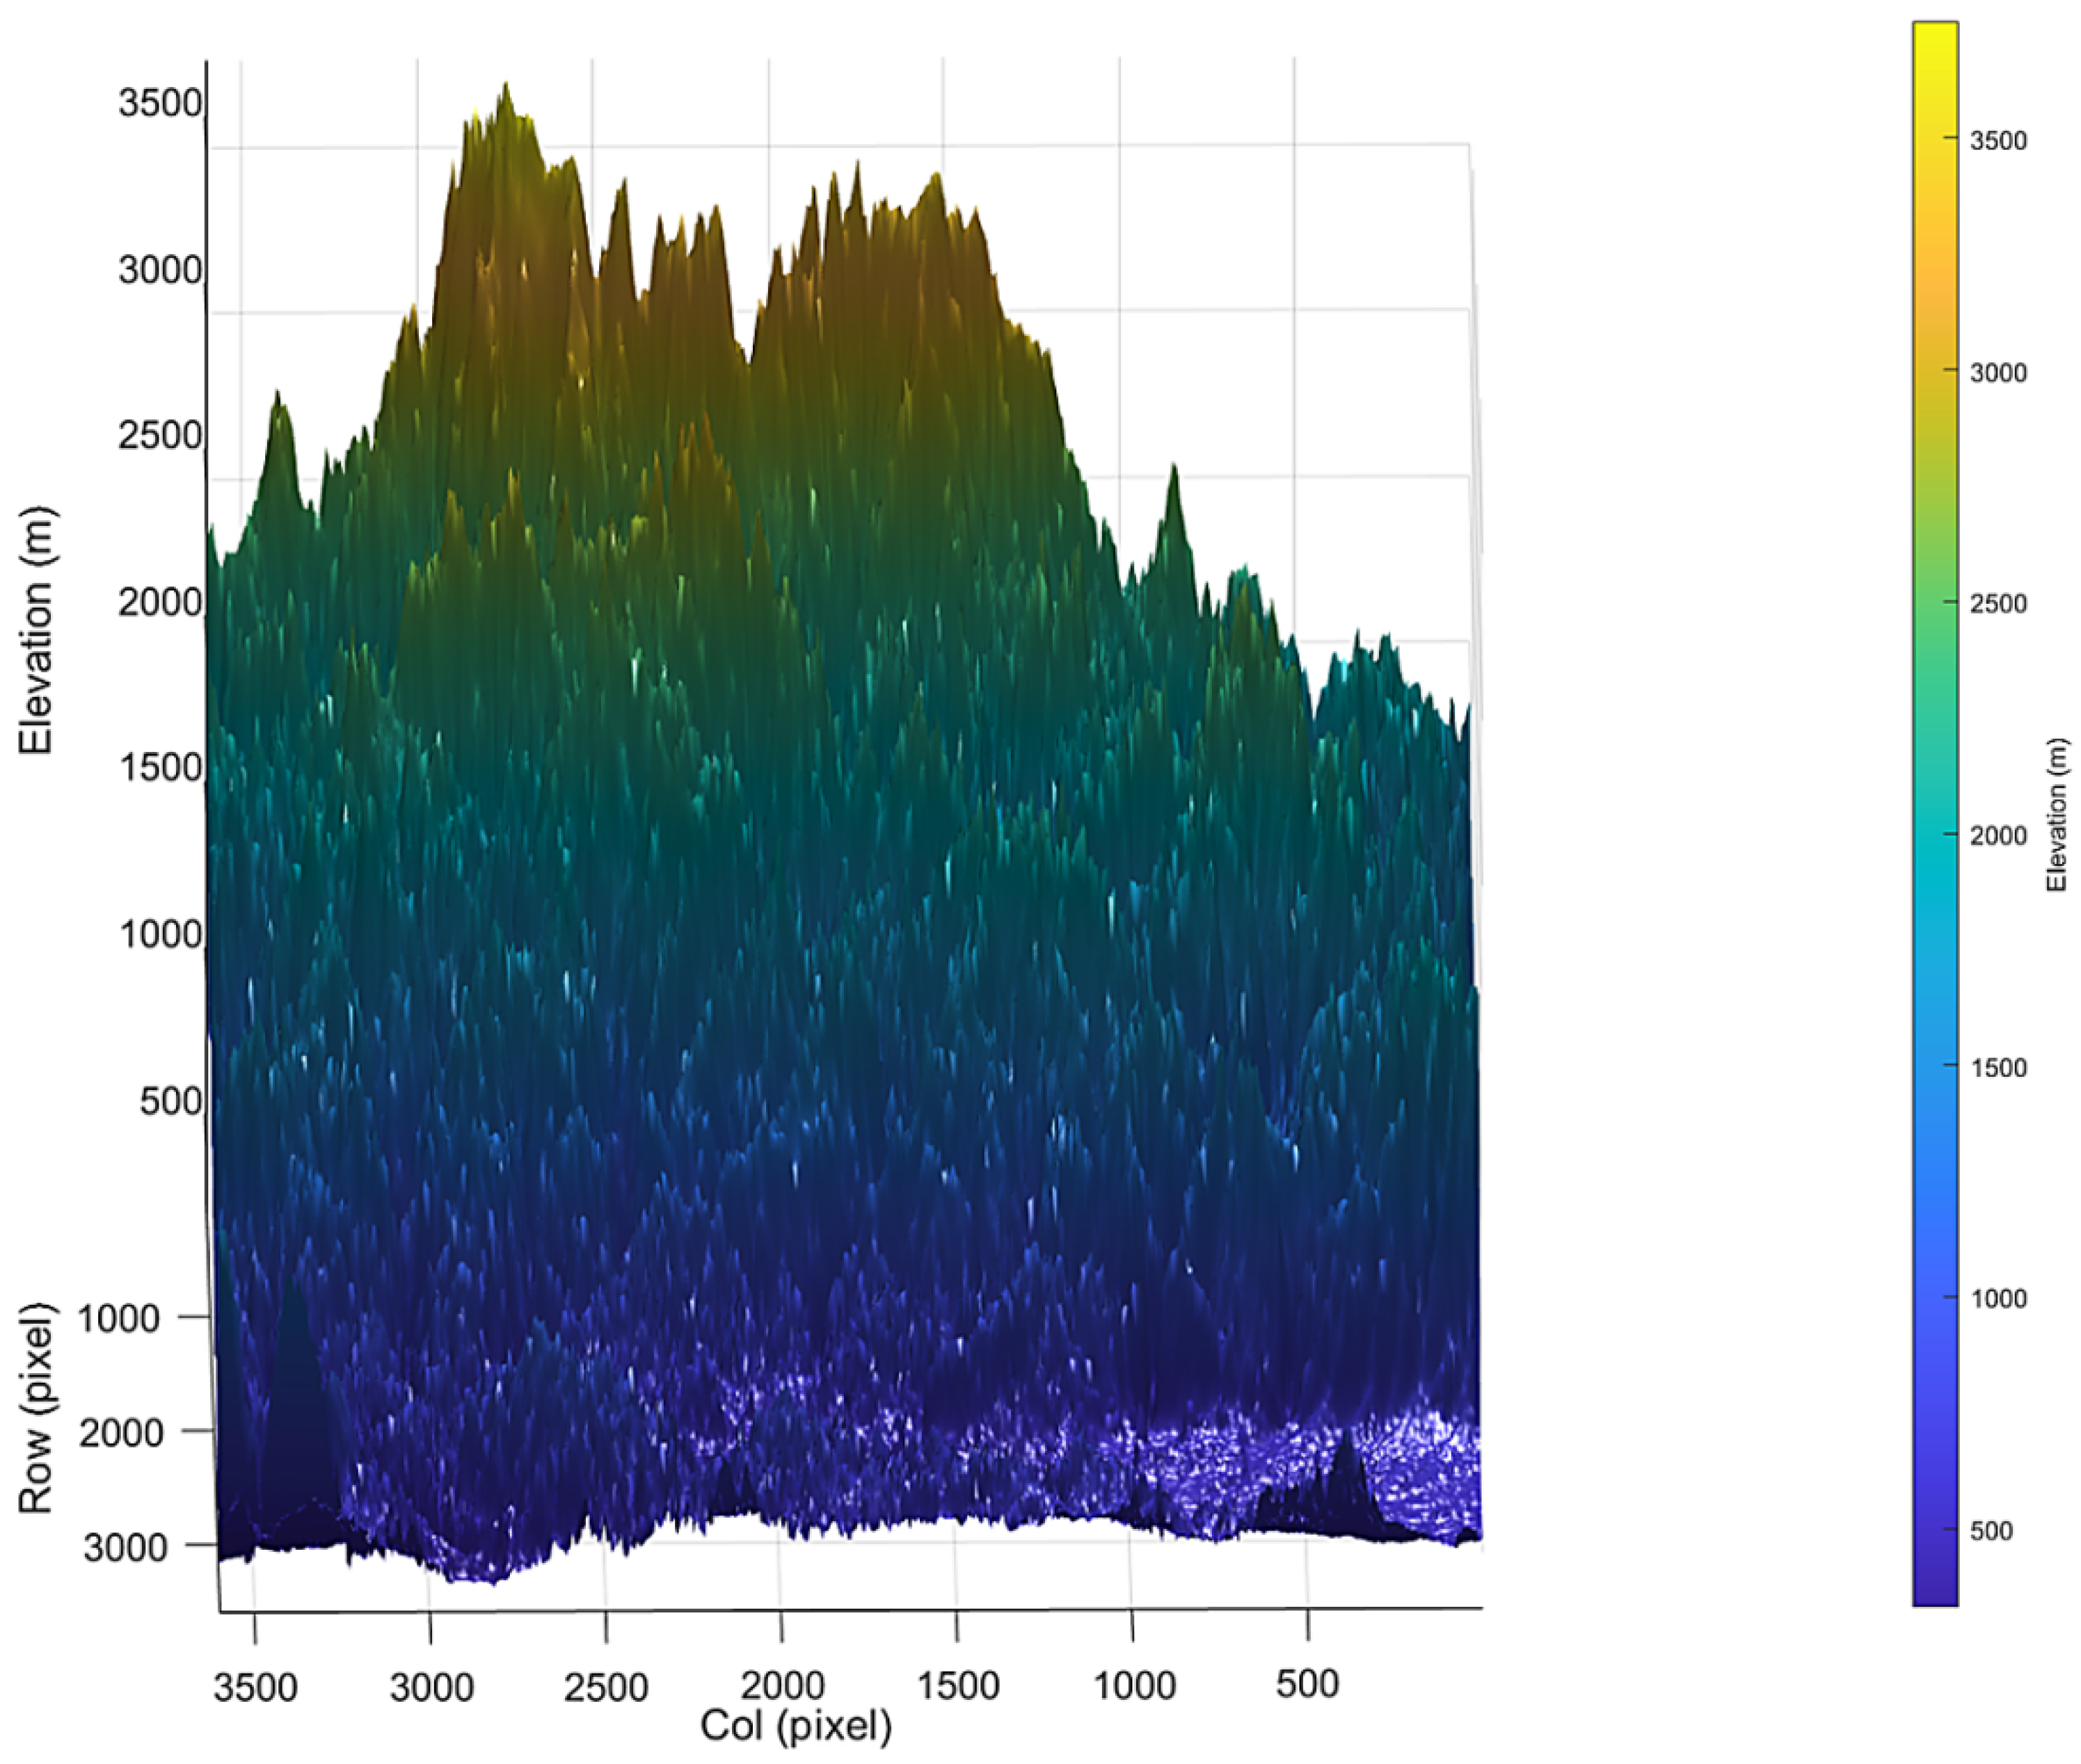
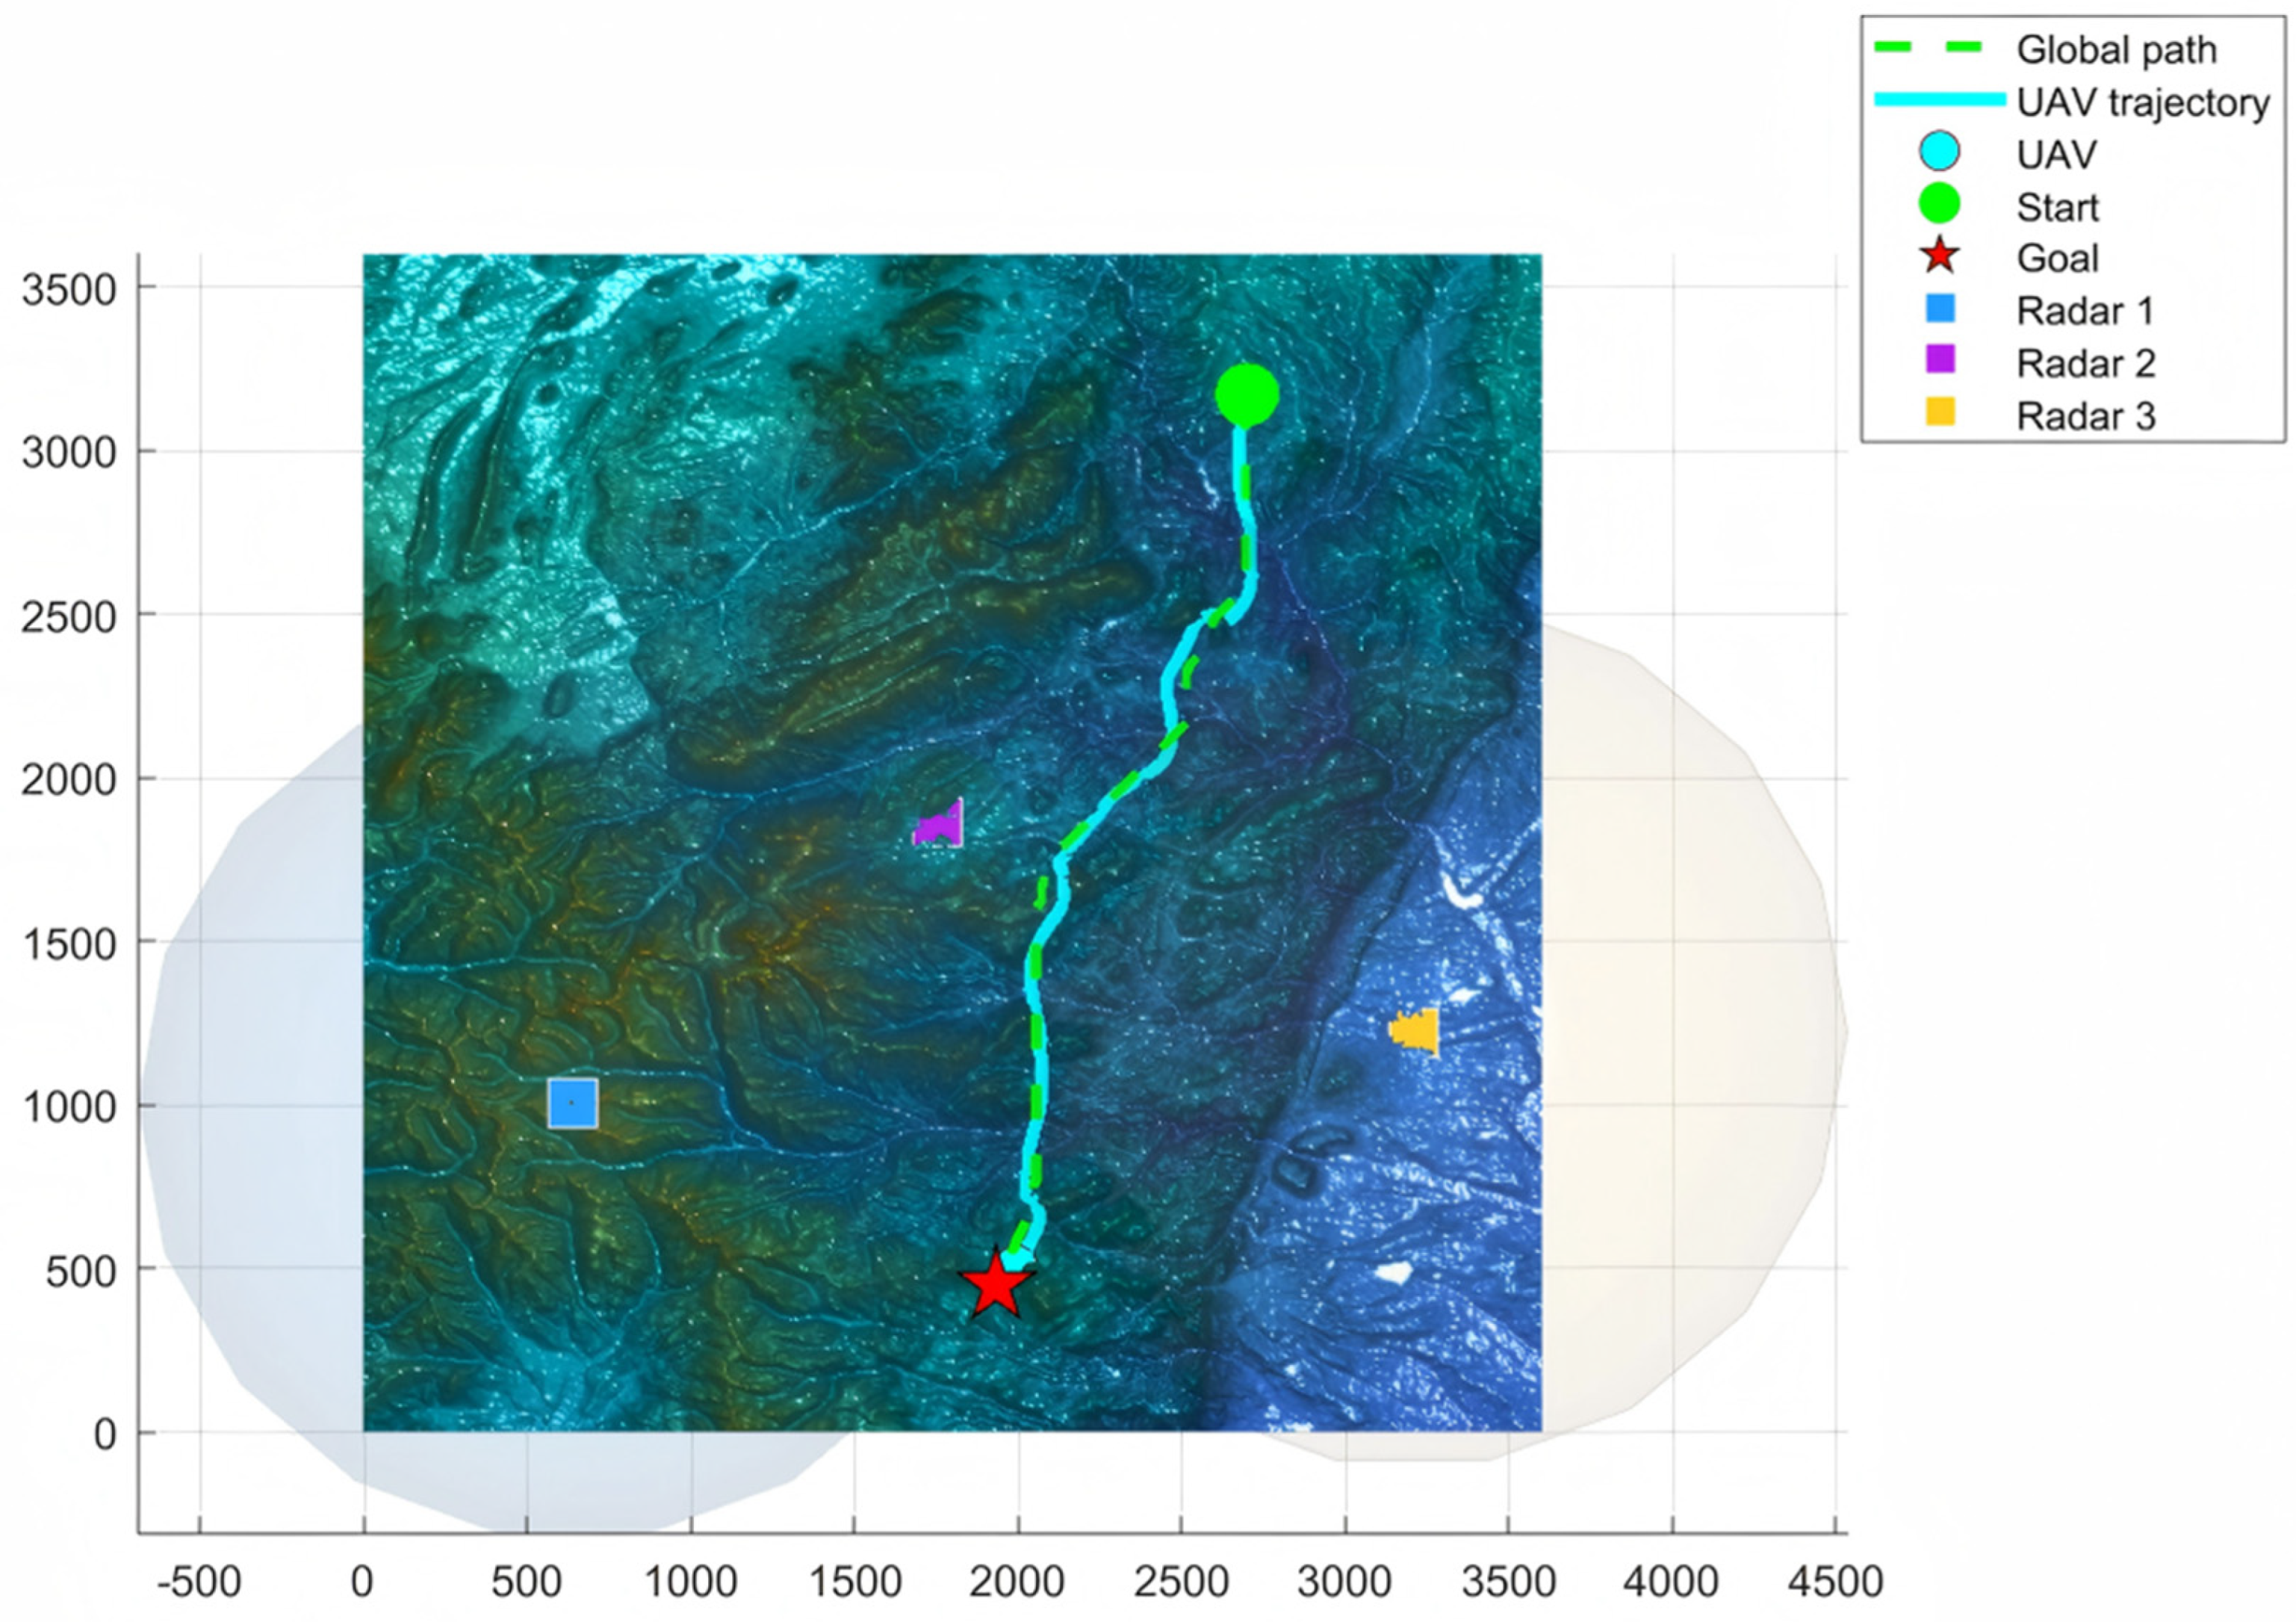
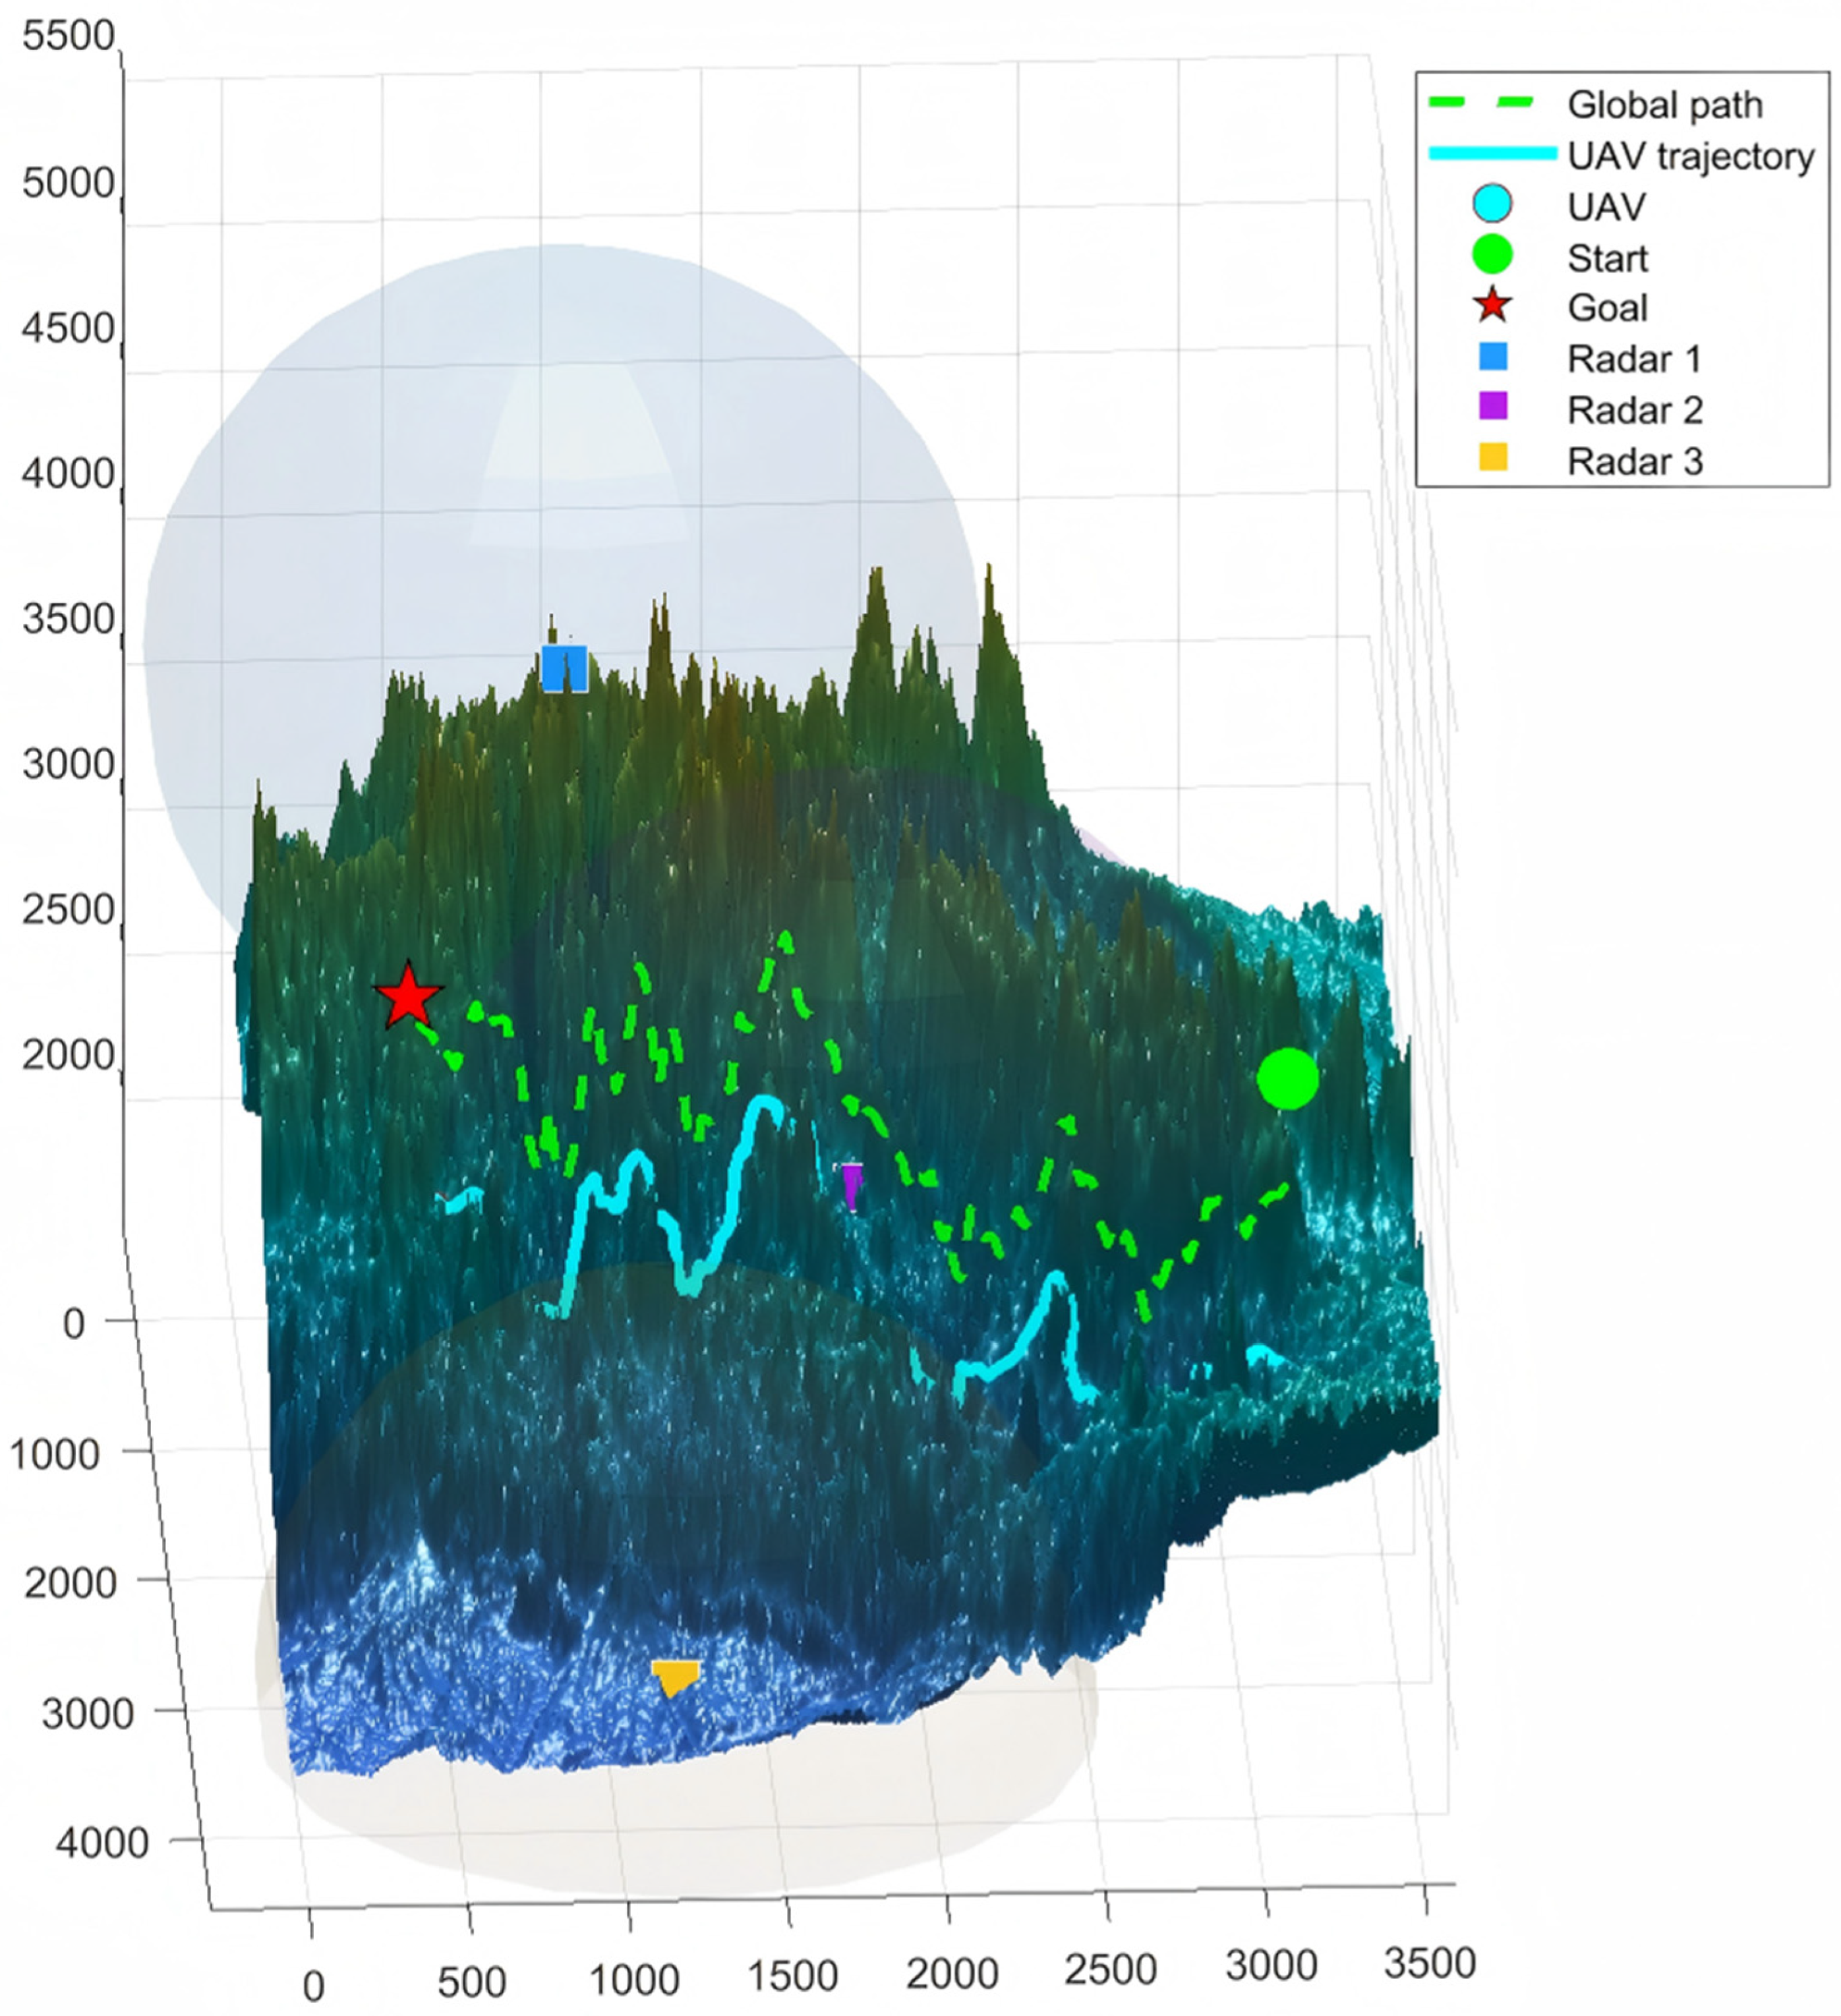
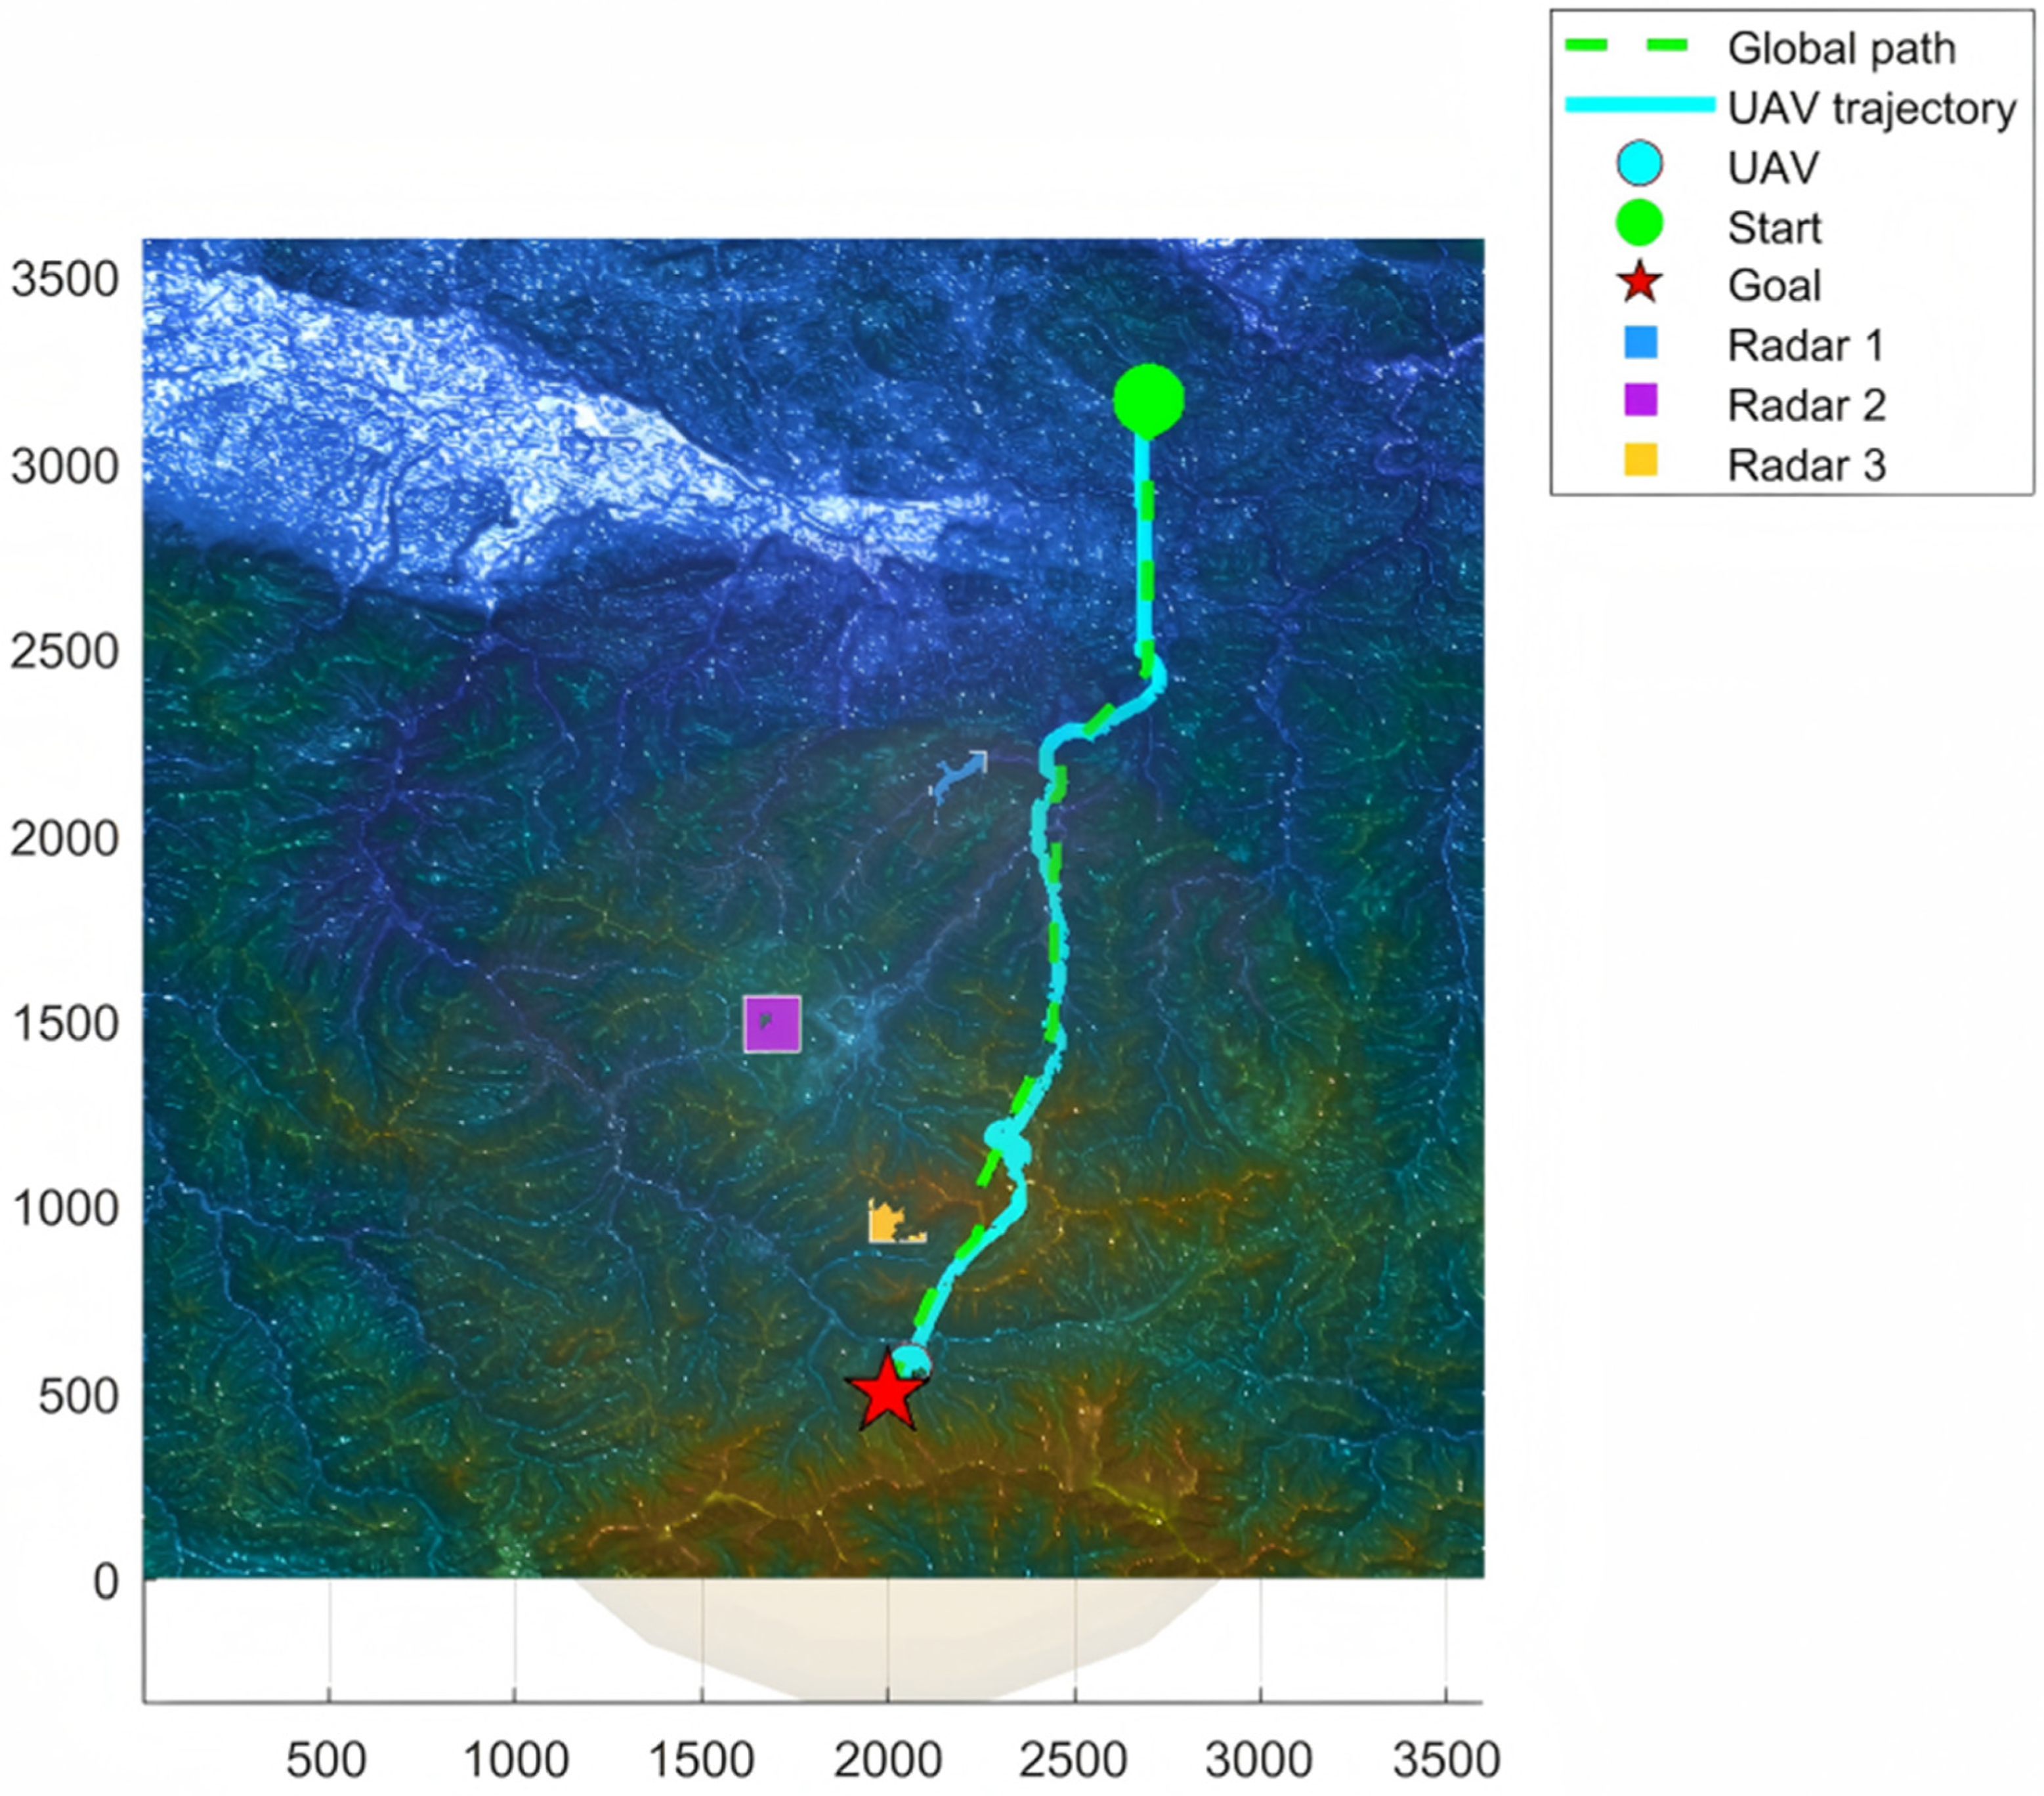
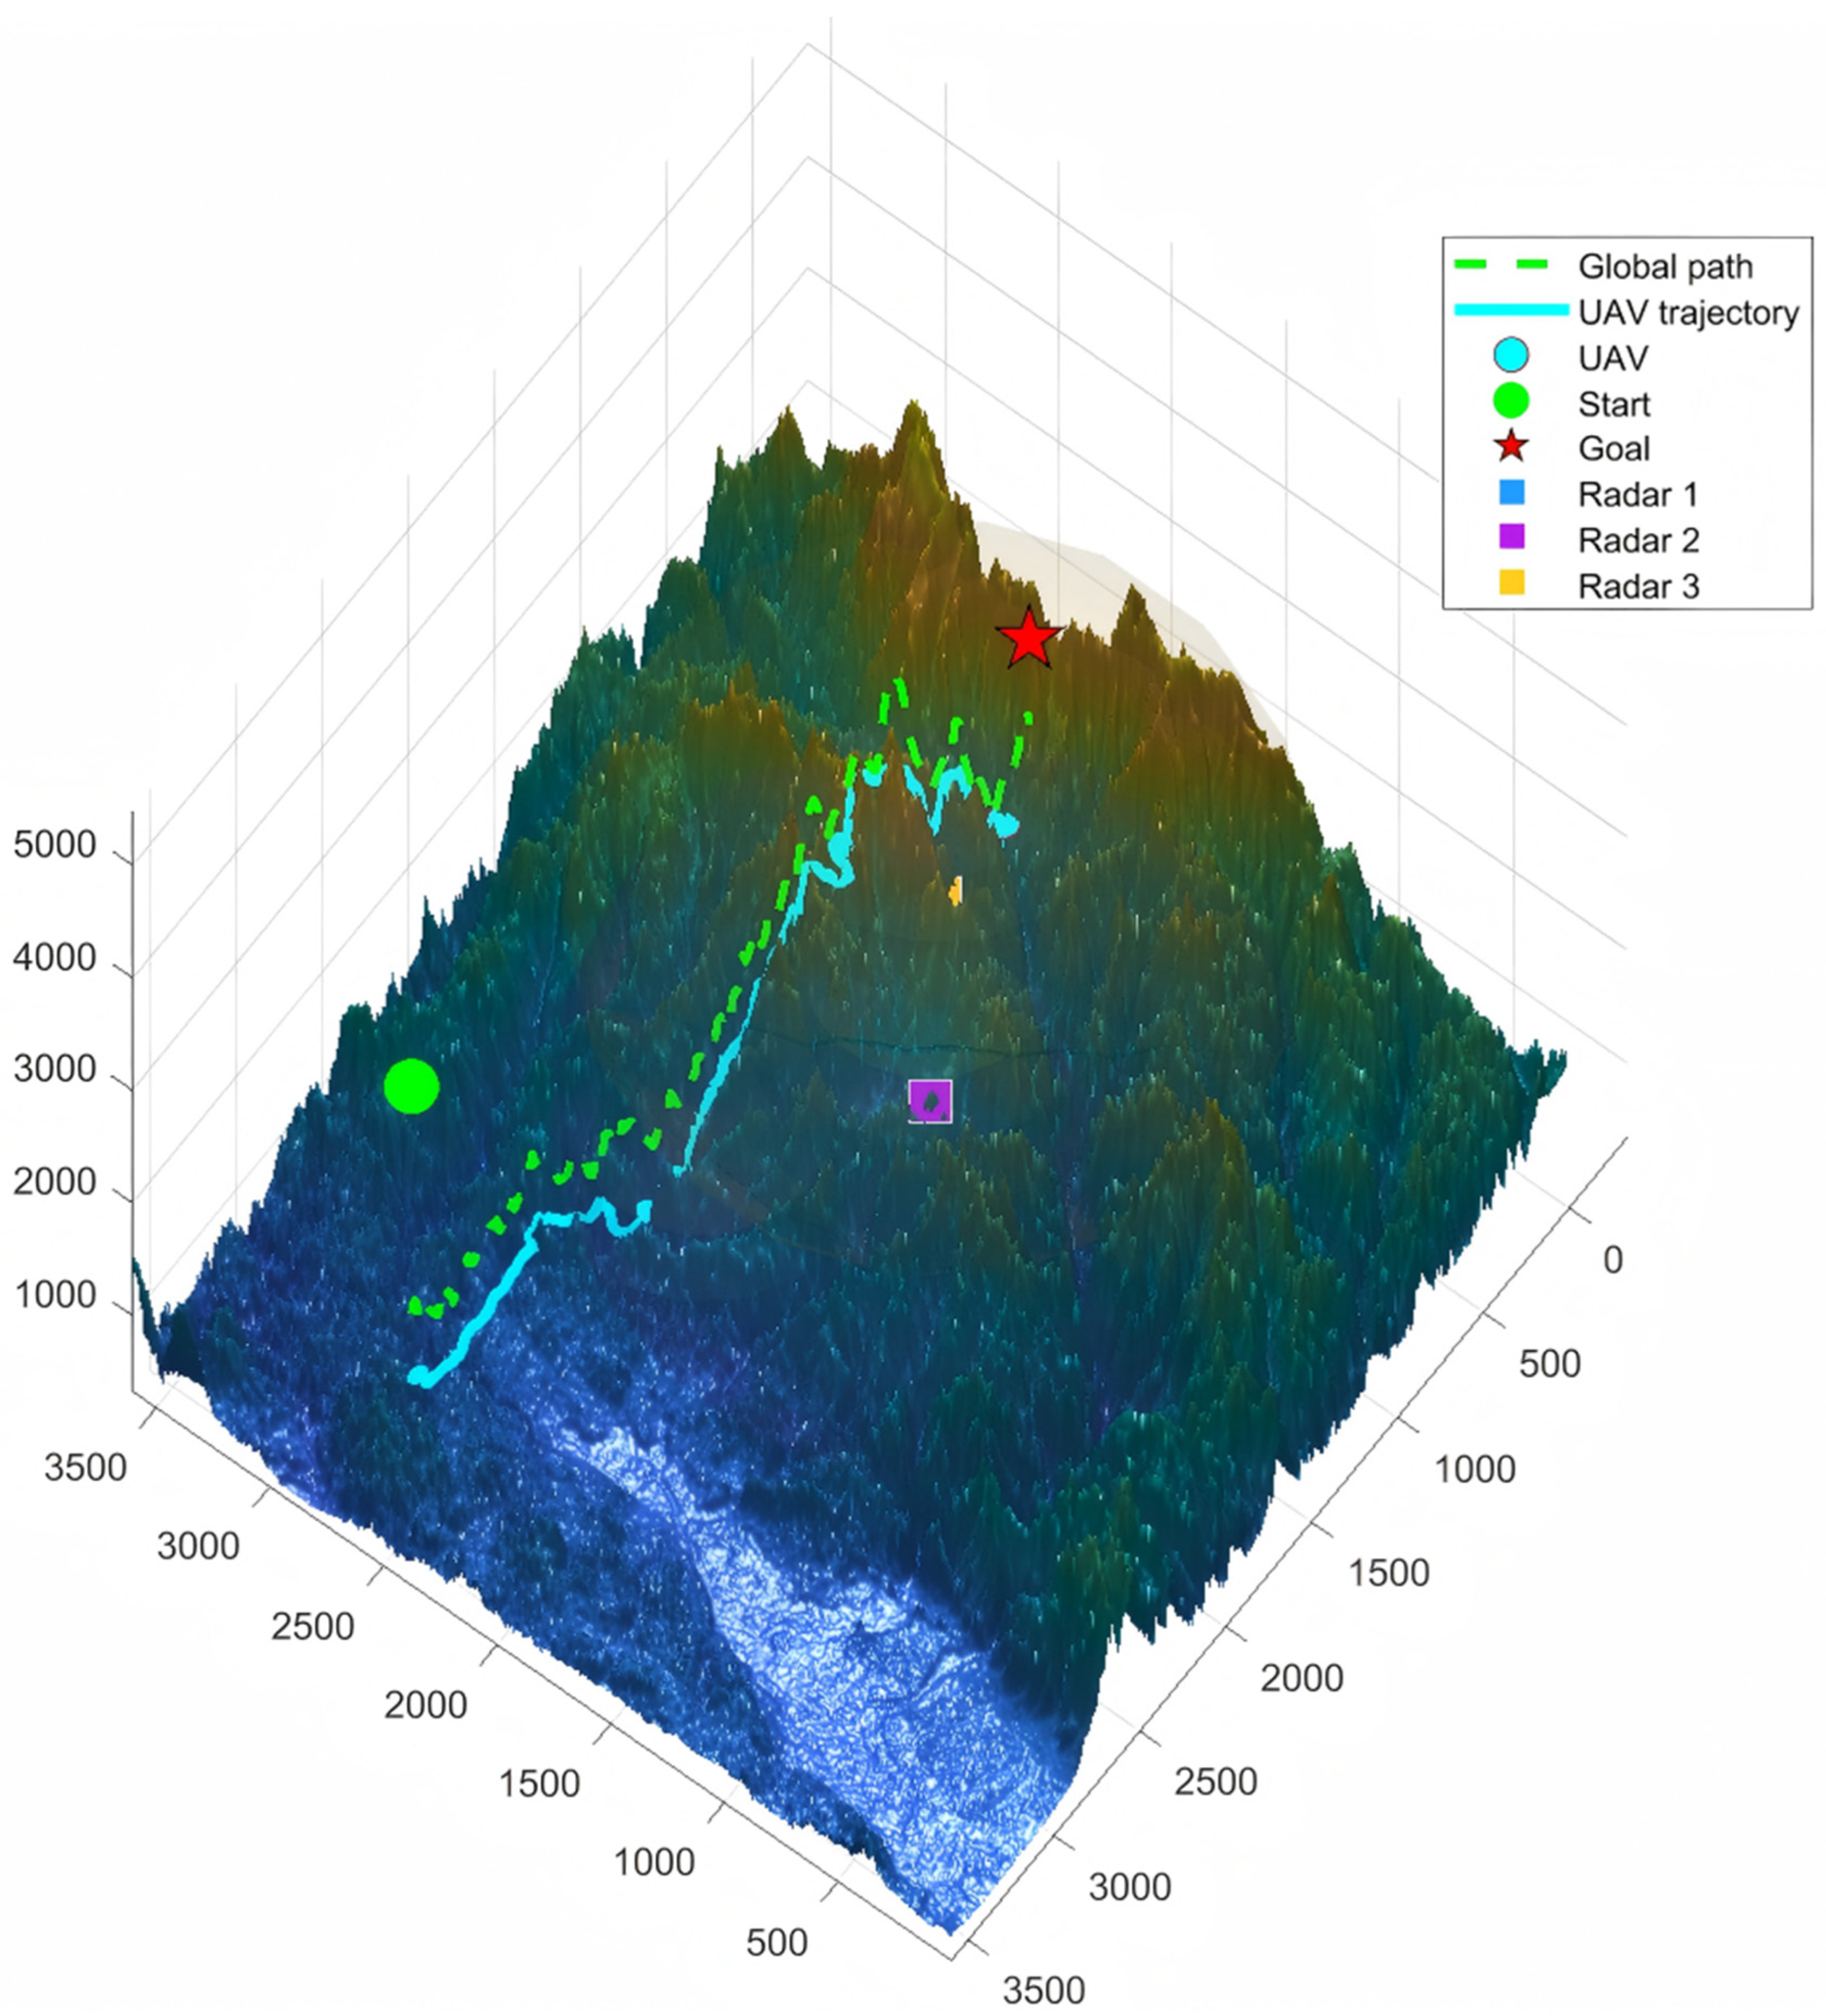
To clarify the experimental scope, this study evaluates two DEM-based mountainous terrain zones for simulation-based comparison. Terrain Zone 1 is generated from ASTGTMV003_N39W106 and Terrain Zone 2 is generated from ASTGTMV003_N33E107. In each terrain zone, one nominal start-goal pair and one radar-patrol configuration are specified. Therefore, the comparative experiments include two terrain zones and two nominal path-planning tasks. To extract terrain attributes such as slope and aspect within the study area, two terrain map files are downloaded and processed in MATLAB. Dataset [
68] covers the region of 33–34° N and 107–108° E (1° × 1°). This area is located in southwestern Shaanxi, China, within the Qinling Mountains, and represents a typical complex mountainous environment. Dataset [
76] covers the region of 39–40° N and 106–105° W (1° × 1°). This area lies in central Colorado, USA, within the Rocky Mountains, and is also representative of mountainous terrain.
4.2.1. Compared Global Reference Planners and Common Local MPC Executor
(1) Theta*: Theta* introduces any-angle connections within the A* framework, enabling a polyline path on grids that more closely approximates continuous-space trajectories. It is used as a geometry-oriented graph-search reference planner [
22].
(2) D* Lite: D* Lite is a classic incremental replanning algorithm suitable for scenarios where environmental information is updated over time. In this study, it is used as a representative geometry-oriented replanning method under moving radar configurations [
77].
(3) RRT*: RRT* is a typical sampling-based planning method operating in continuous space and represents a “sample-and-optimize” paradigm for trajectory generation. It is included to compare feasibility and convergence behavior under complex terrain constraints [
25].
(4) Risk-A*: Risk-A* is the proposed global reference planner. It constructs a spatio-temporal radar-detection feasibility map and combines the no-detection-threshold-exceedance constraint with a detection-margin-based soft risk cost, thereby generating a global reference path with sufficient separation from the detection boundary.
For a fair comparison, Theta*, D* Lite, RRT*, and Risk-A* are used only as different global reference-path generators. After a global reference path is obtained, all methods are executed by the same finite-control-set local MPC module described in
Section 3.2.5. The UAV kinematic model, control bounds, AGL bounds, prediction horizon, control-candidate grids, radar motion model, LOS/range-gating test, radar-equation-based detectability metric, and detection threshold are kept identical for all compared methods. Therefore, the comparison isolates the influence of the global reference-path generation strategy while maintaining the same local execution and safety-evaluation conditions.
It should be noted that using the same local MPC module does not imply that all global references remain locally feasible throughout the mission. During rollout enumeration, candidate trajectories that violate the no-detection-threshold-exceedance constraint are rejected for all methods. However, if a geometry-oriented baseline reference path drives the UAV into a state from which no detection-feasible rollout exists within the finite prediction horizon and finite control-candidate set, the local MPC update is marked as infeasible. In the reported statistics, the actually executed trajectory is still evaluated using the same range-gating, LOS, radar-equation thresholding, and exposure-time calculation. Therefore, the nonzero exposure time observed for baseline-MPC variants reflects loss of local safety feasibility caused by insufficient global detection-risk margin, rather than the use of a different radar model, a different threshold, or a relaxed evaluation criterion.
4.2.2. Experimental Setup and Statistical Strategy
For each simulation scenario, 50 repeated executions are conducted to evaluate algorithmic repeatability and stochastic variability. A simulation scenario is defined by a fixed DEM-based terrain zone, one nominal start-goal pair, and one radar-patrol configuration. During the 50 repeated executions, the terrain zone, start-goal locations, radar-patrol route, and initial radar states are kept identical across all compared methods. Therefore, the 50 repeated executions should be interpreted as repeated trials under the same mission geometry, rather than as 50 different terrain zones or 50 different start-goal pairs, ensuring strictly controlled experimental inputs and enabling fair comparisons.
For total flight time (T), path length (L), and LOS-visible duration, the results are reported as mean ± standard deviation (mean ± SD) together with the corresponding 95% confidence intervals (95% CIs) over all 50 trials. Exposure time Texp is reported conditionally for trials with detection-threshold exceedance, and nexp denotes the number of such exposed trials. To further assess whether the observed differences in continuous-valued metrics between the proposed Risk-A*-MPC framework and the baseline-MPC variants were statistically meaningful, pairwise two-sided Welch’s t-tests were conducted for T, L, and LOS-visible duration over all 50 trials. Exposed-trial Texp was not included in the Welch’s t-test analysis when the proposed method had no exposed-trial Texp samples. A significance level of p < 0.05 was adopted, and the resulting p-values are reported together with the comparative results. The 95% CI for T, L, and LOS-visible duration was calculated as , where and SD denote the reported mean and standard deviation over all 50 repeated executions. Exposed-trial Texp is reported as mean ± SD over the exposed trials; when nexp = 0, the metric is reported as N/A.
4.2.3. Evaluation Metrics
(1) Success rate (SR): the fraction of trials in which the actually executed trajectory satisfies the detection-threshold constraint over the entire mission, i.e., the effective detectability never exceeds the prescribed threshold.
(2) Total flight time (T, s): the total time required for the UAV to complete the navigation task.
(3) Exposed-trial exposure time (Texp, s): for trials with detection-threshold exceedance, the cumulative duration along the actually executed trajectory during which at least one radar satisfies the range-gating condition, the LOS condition, and the radar-equation-based threshold-exceedance condition. Trials without detection-threshold exceedance are not included in this conditional exposure-time statistic. The same exposure-time evaluator is applied to all compared methods.
(4) Path length (L, m): the total traveled distance of the UAV trajectory.
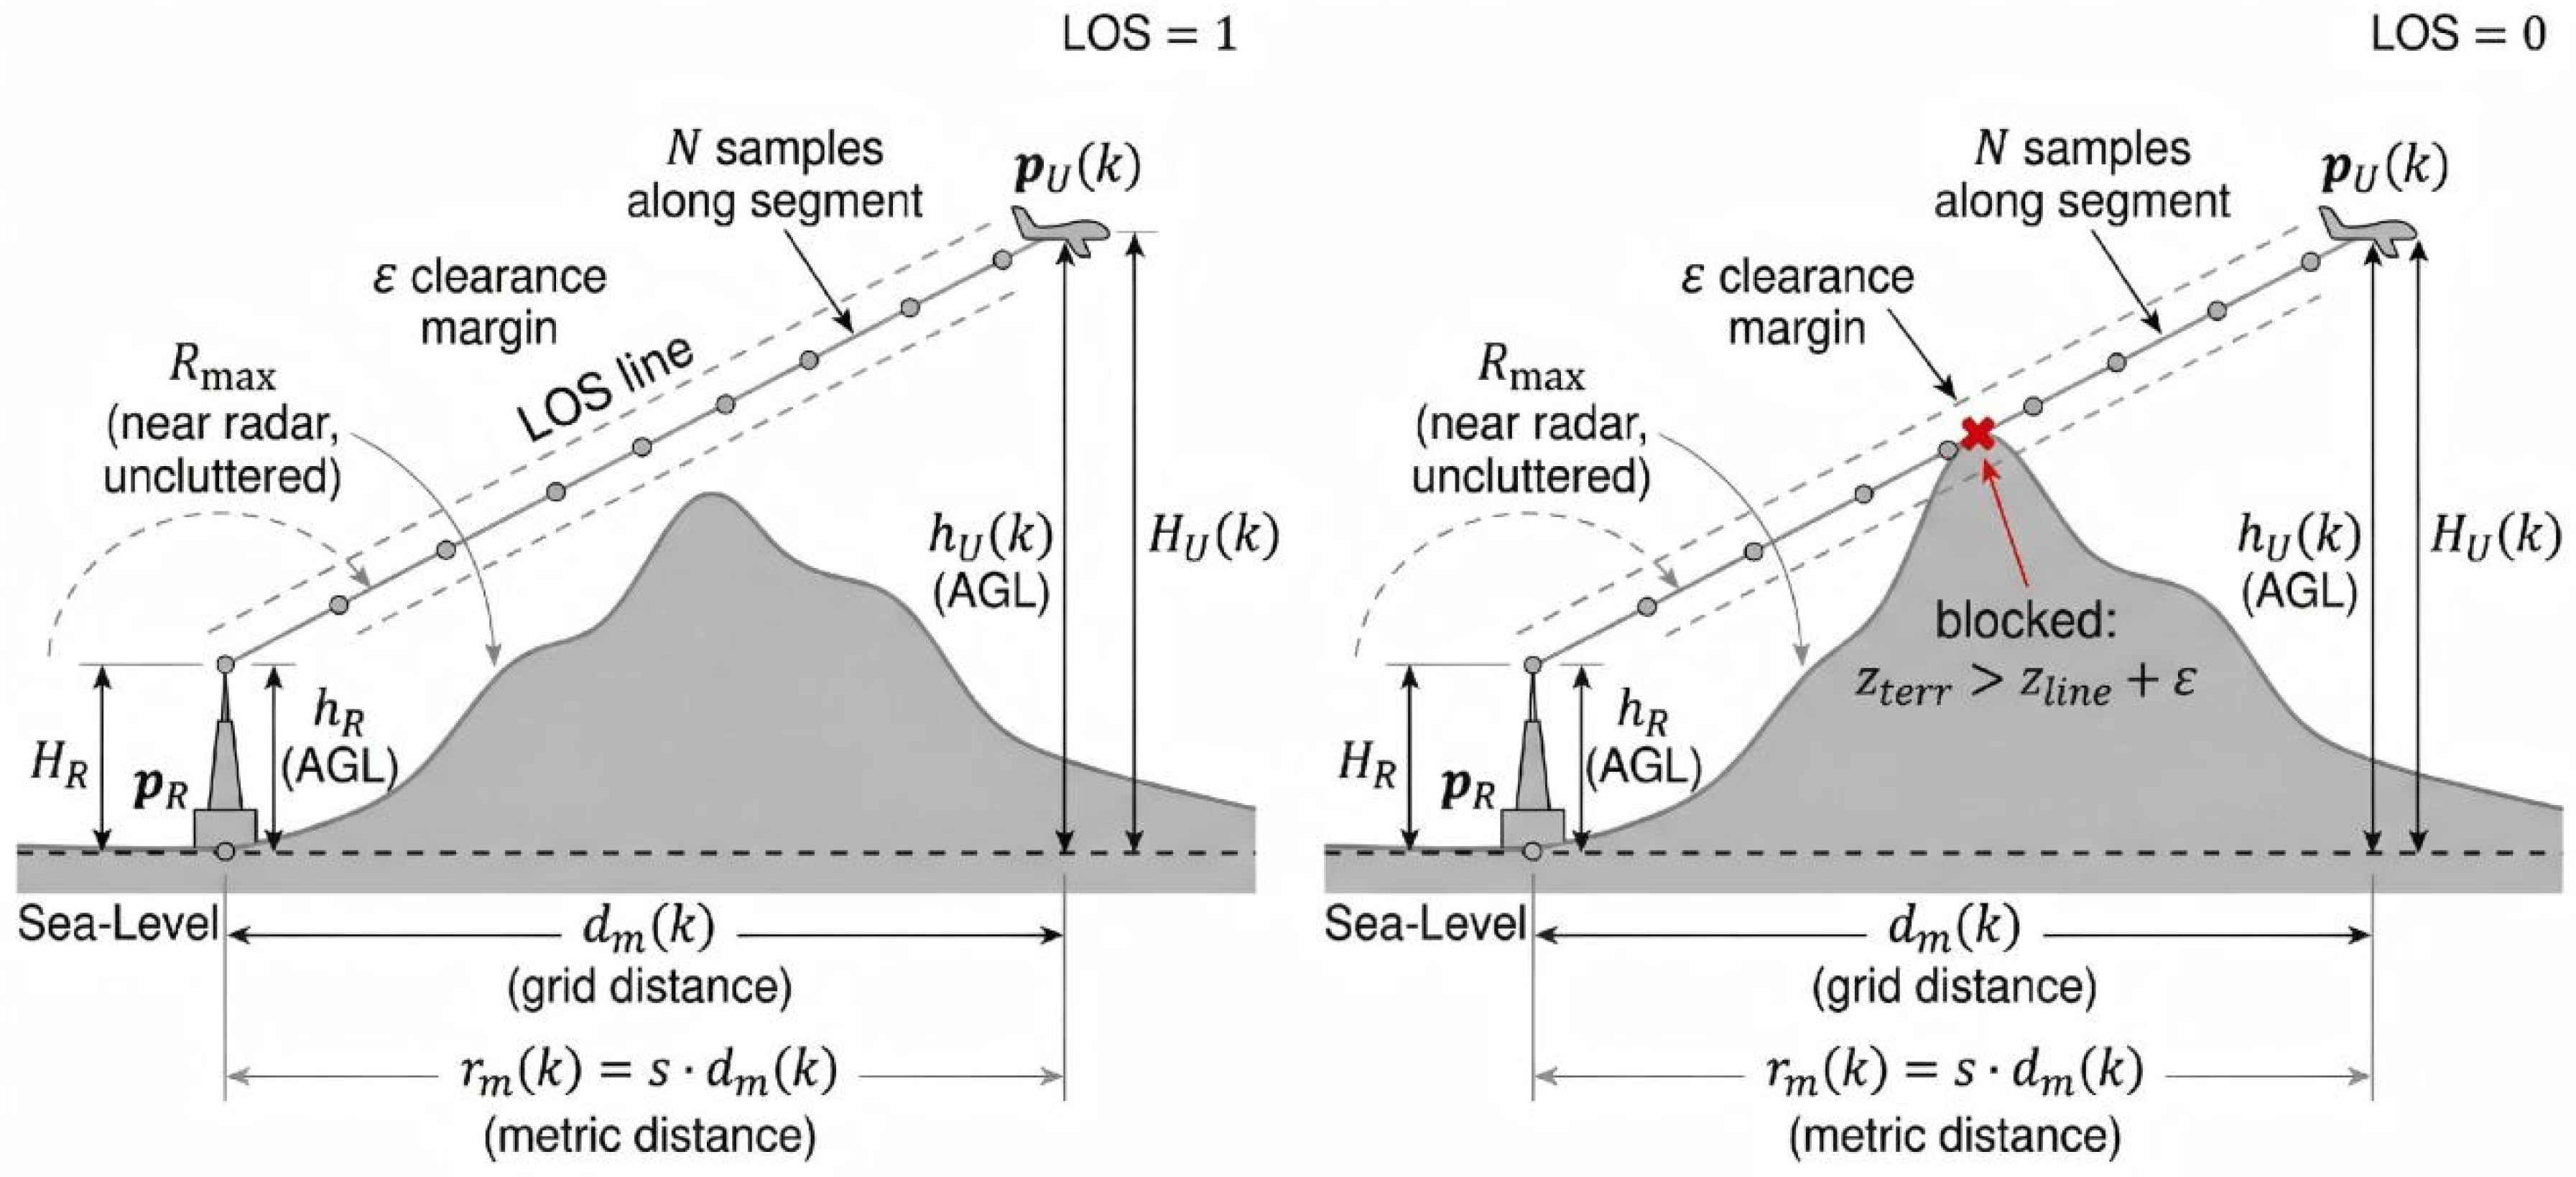
(5) LOS-visible duration (s): the cumulative duration during which the radar-UAV line of sight satisfies LOS = 1.
Unless otherwise stated, in Tables 1, 2 and 4–9, (T), (L), and LOS-visible duration are reported as mean ± SD [95% CI] over 50 trials, whereas exposed-trial Texp is reported as mean ± SD only over trials with detection-threshold exceedance; nexp denotes the number of exposed trials and can be obtained from the success count in the SR column. If the local MPC has no detection-feasible rollout at a certain control cycle, the trial is not regarded as satisfying the no-detection-threshold-exceedance requirement; when detection-threshold exceedance occurs, the cumulative exposure time from the actually executed trajectory is included in the exposed-trial Texp sample. This rule is applied identically to the proposed method and all baseline-MPC variants.
4.2.4. Scenario 1: Terrain Zone 1 with One Nominal Start-Goal Pair
With the above parameter settings, terrain data ASTGTMV003_N39W106 [
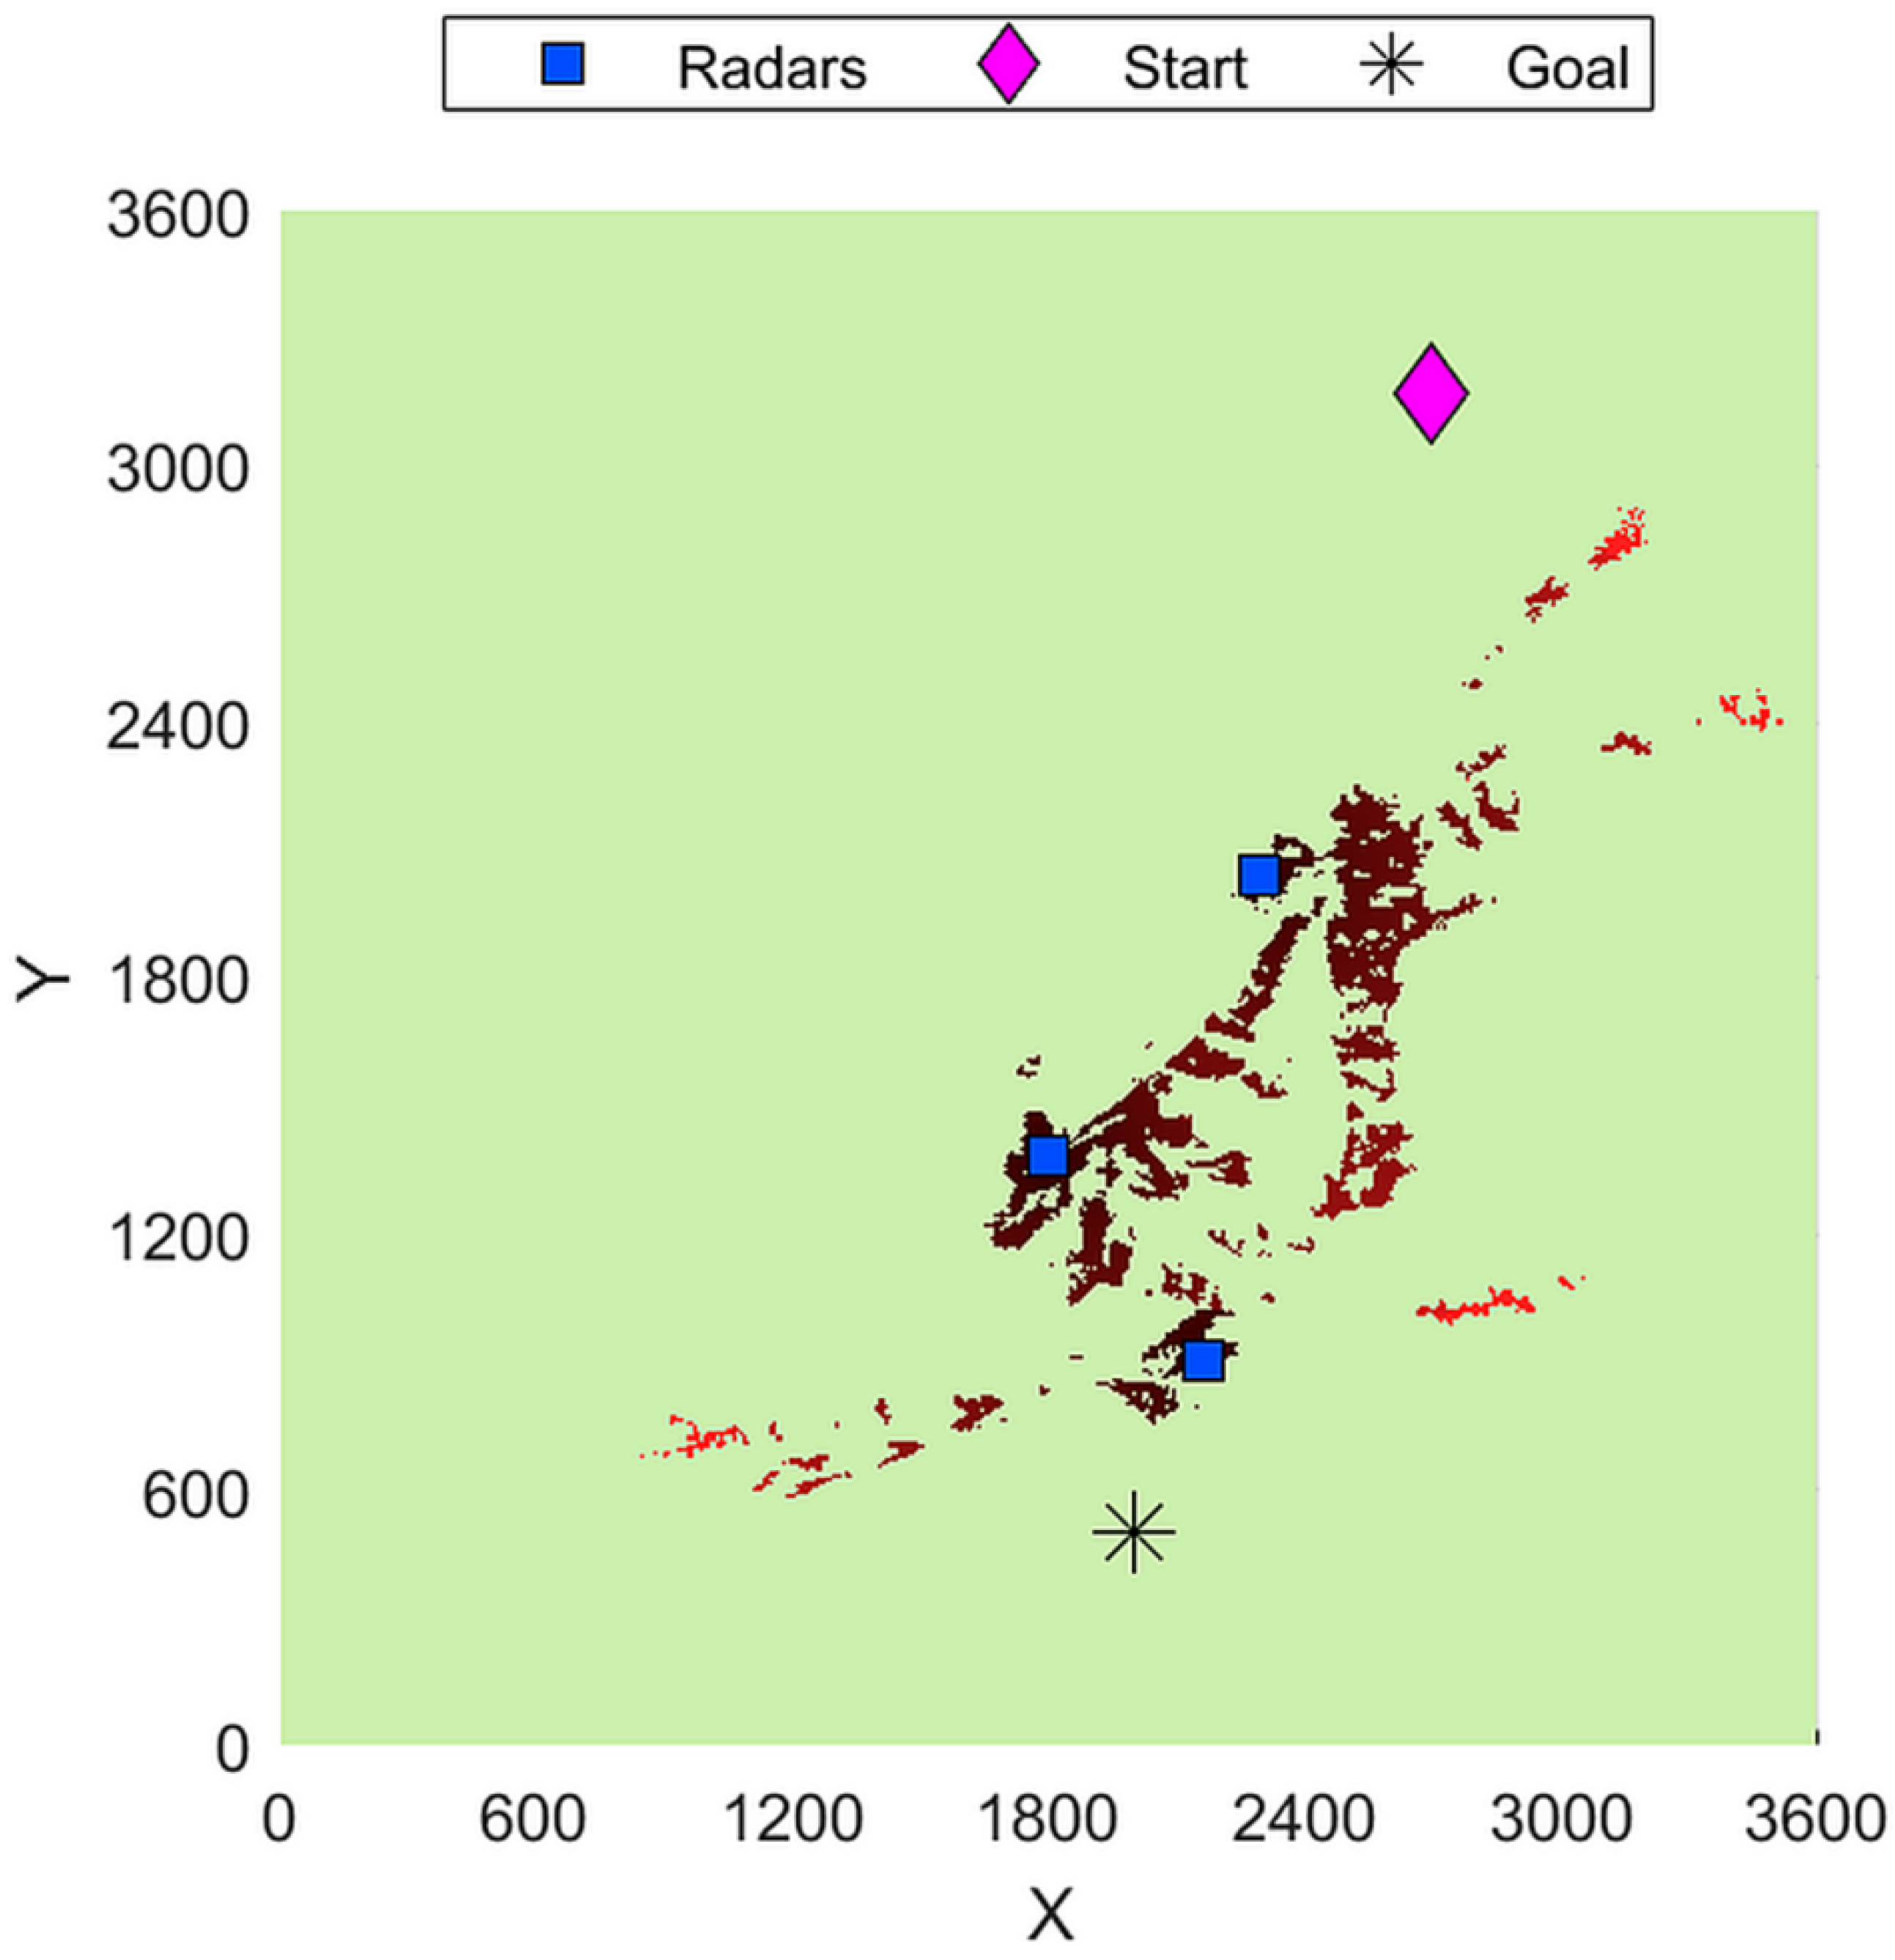
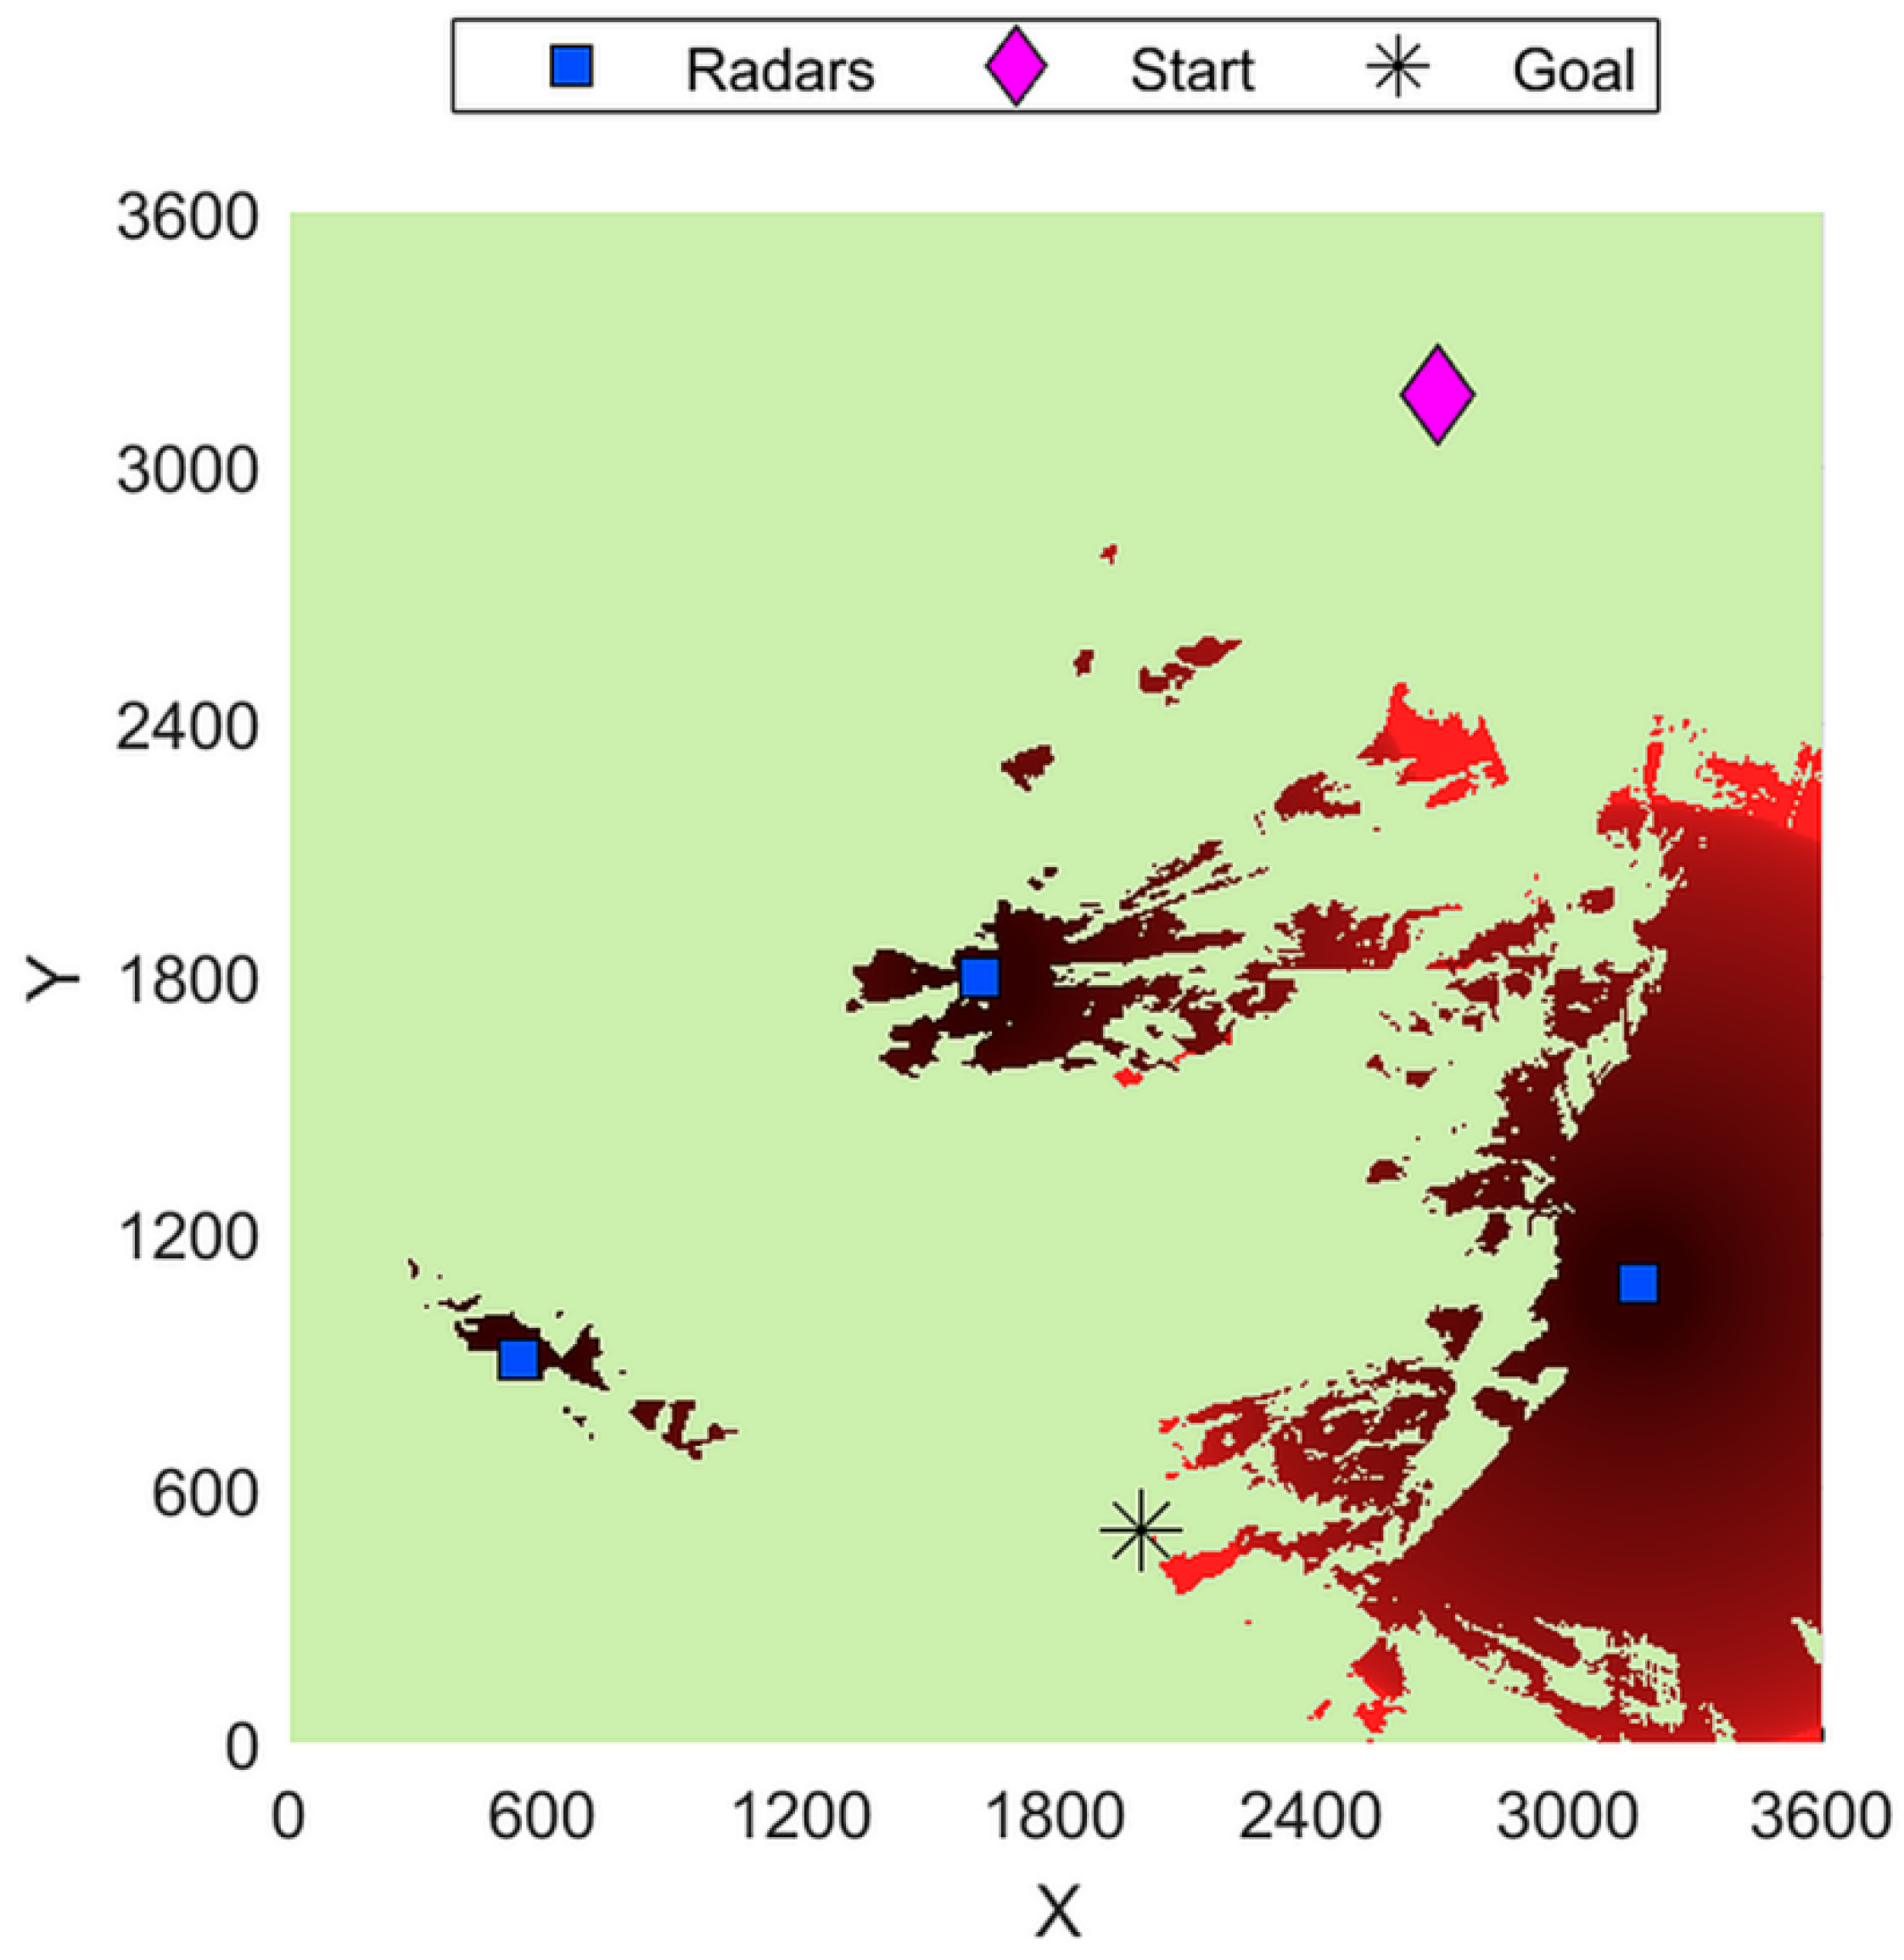
76] are loaded. The resulting global risk heat map is shown in
Figure 10. Red regions indicate areas where the detectability metric exceeds the threshold
, whereas green regions indicate areas below
.
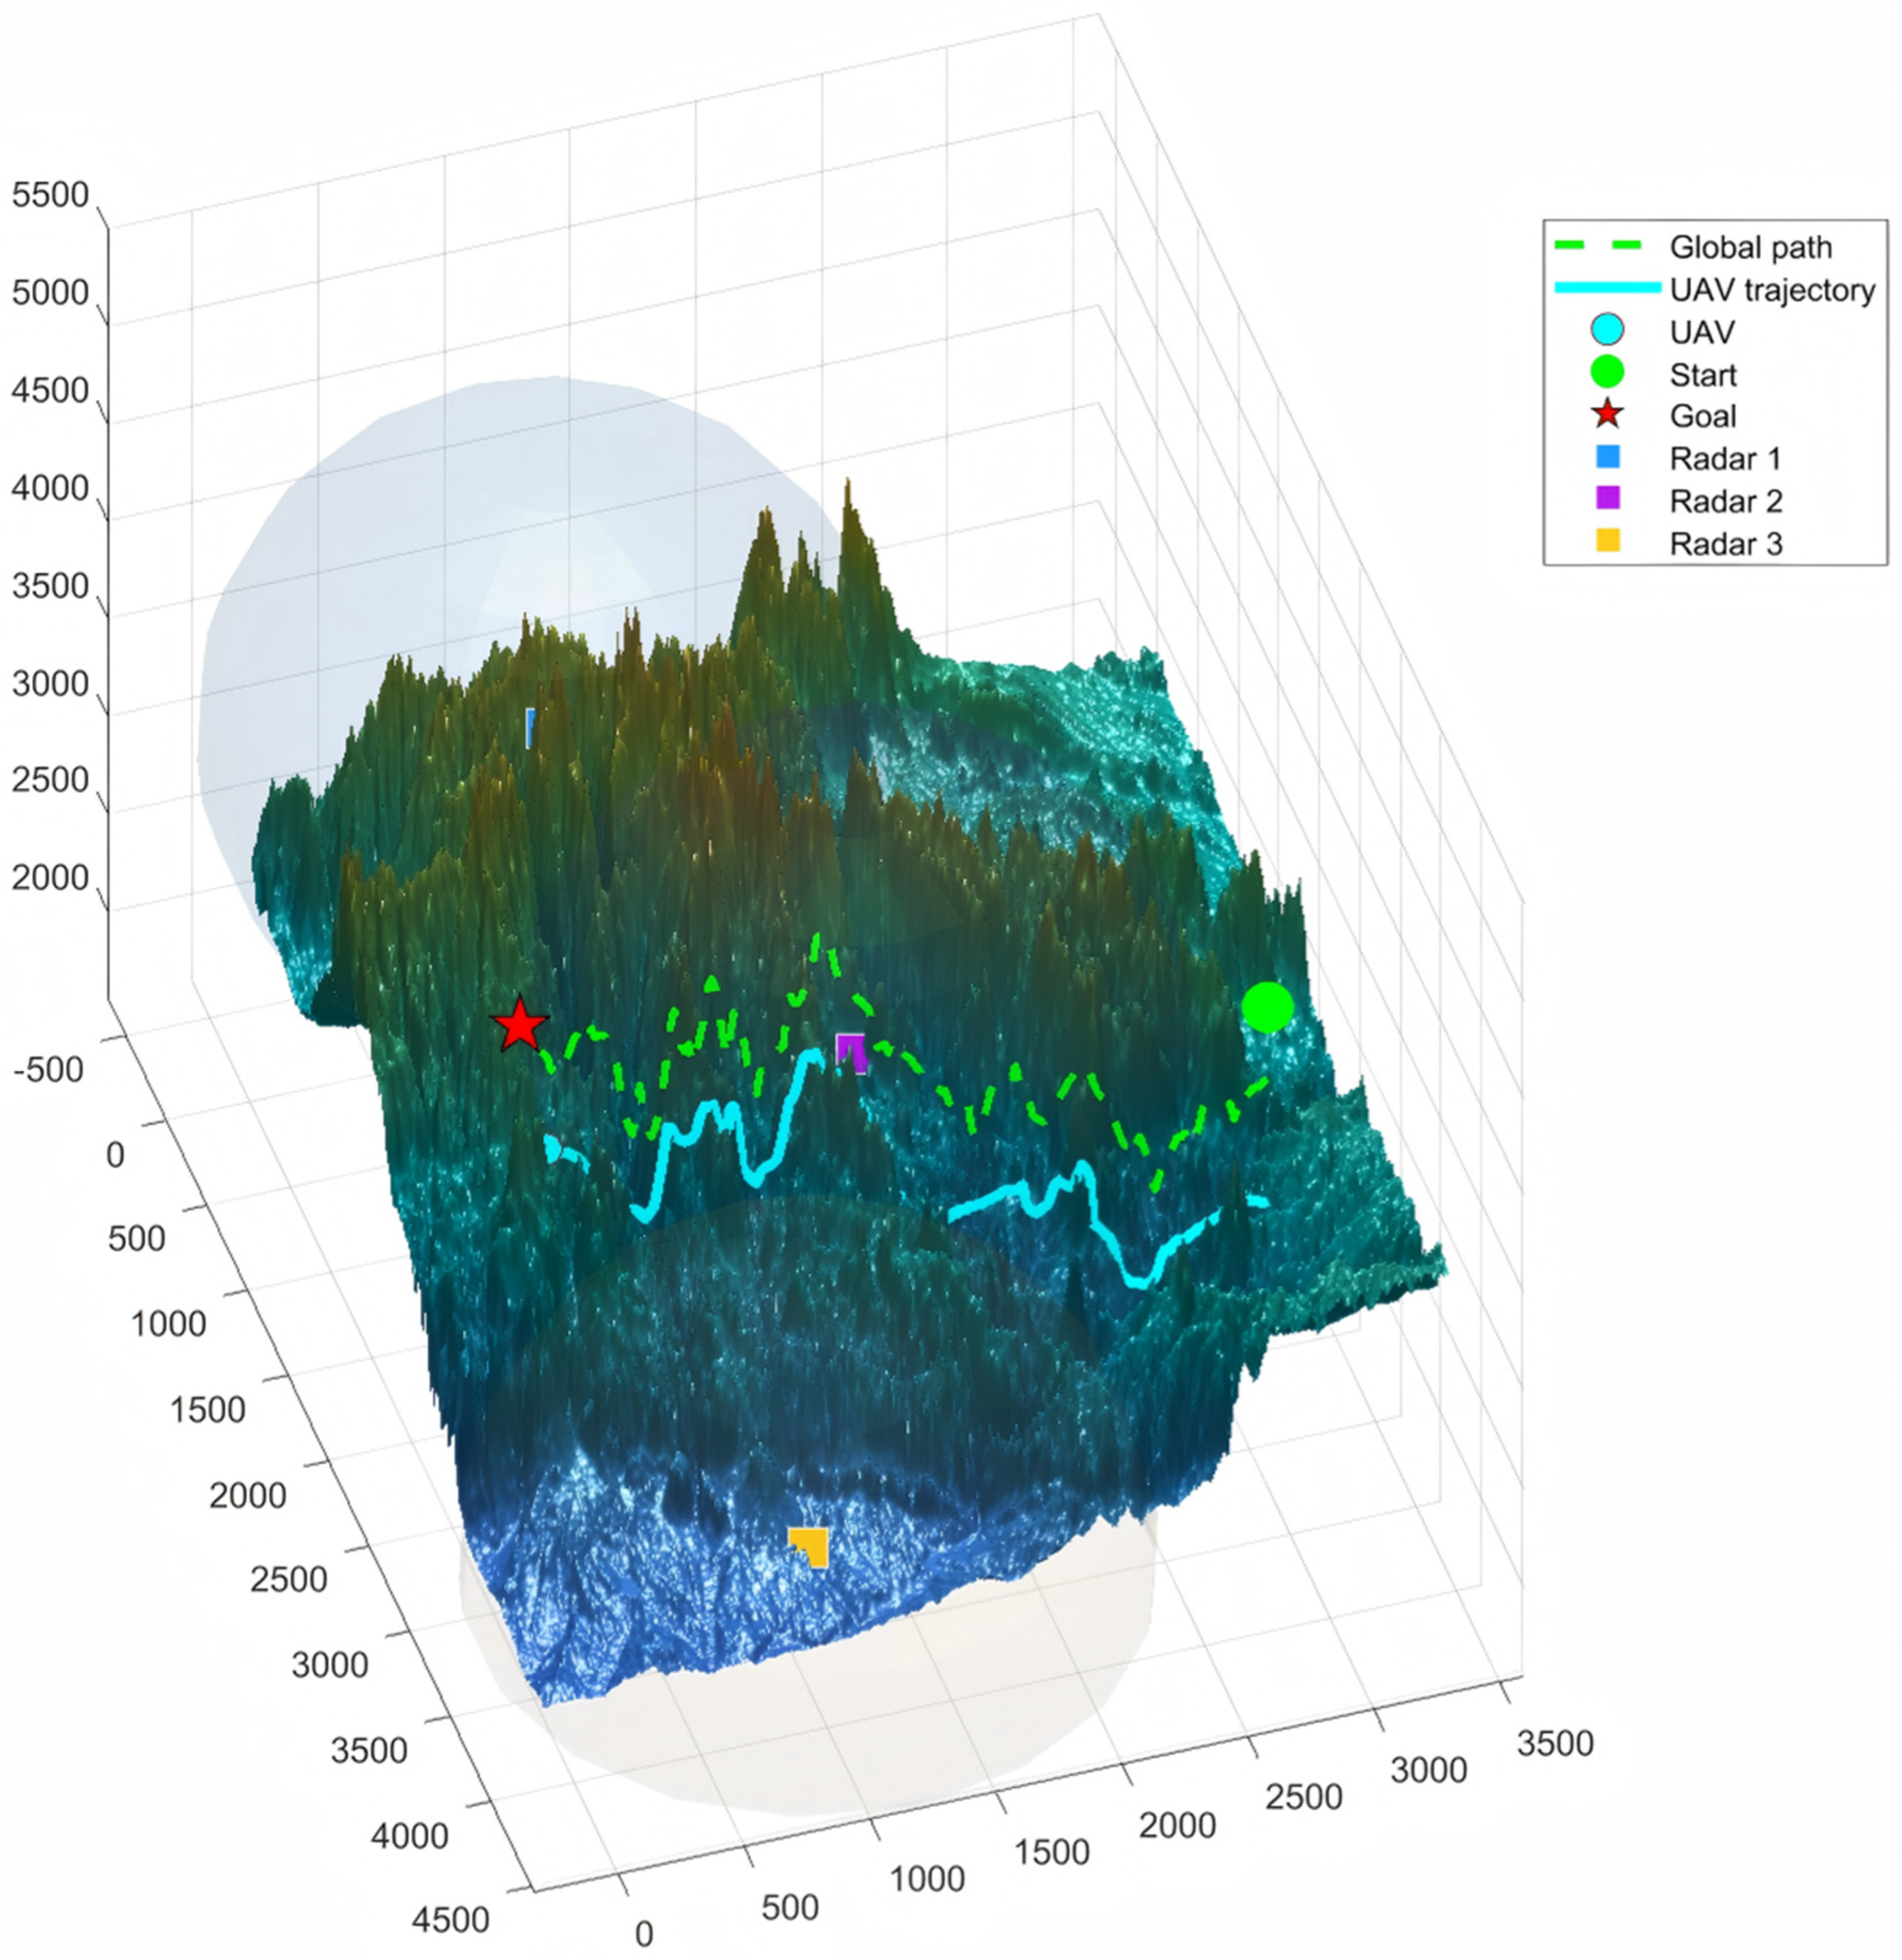
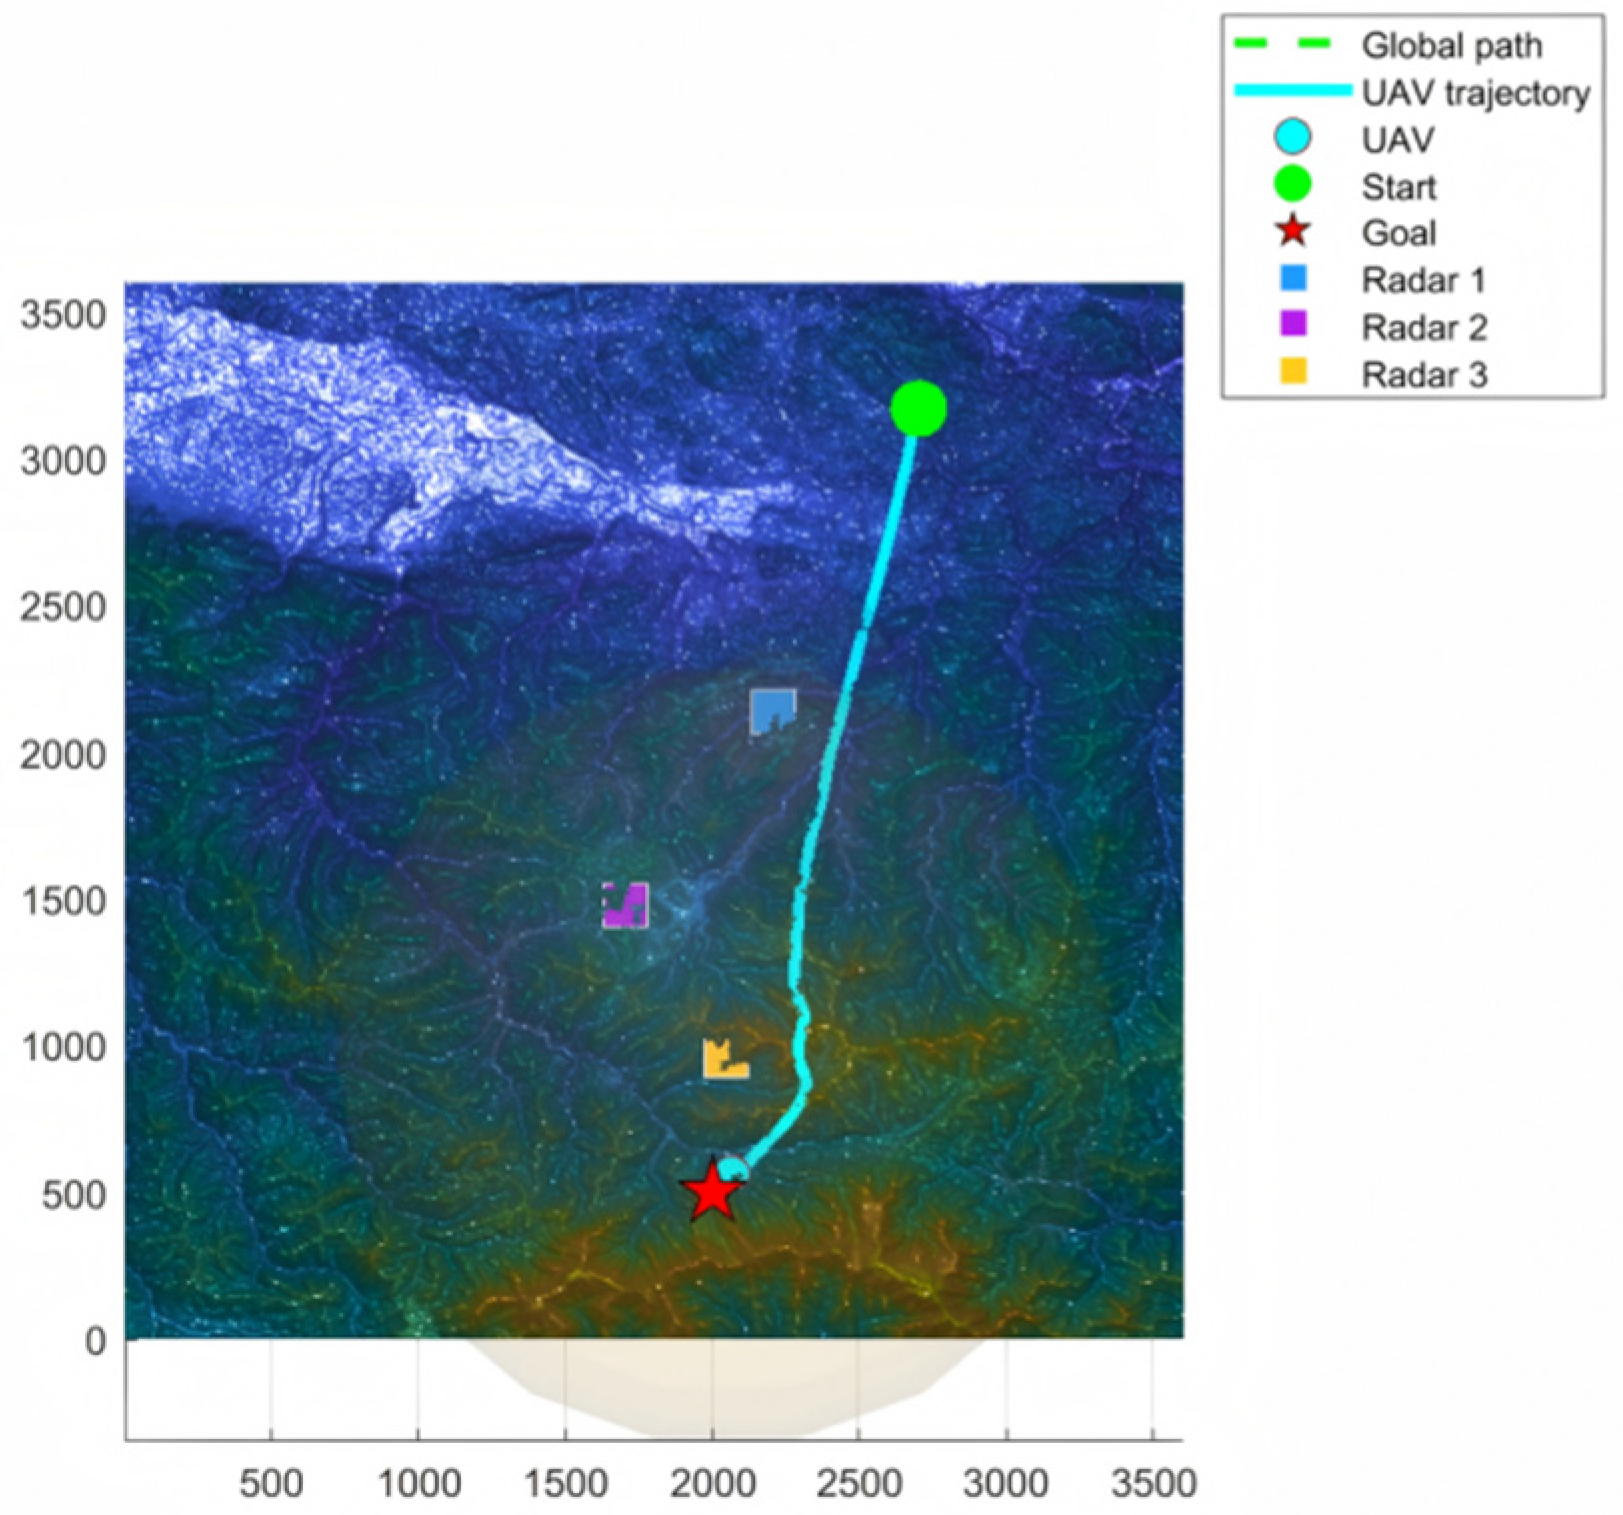
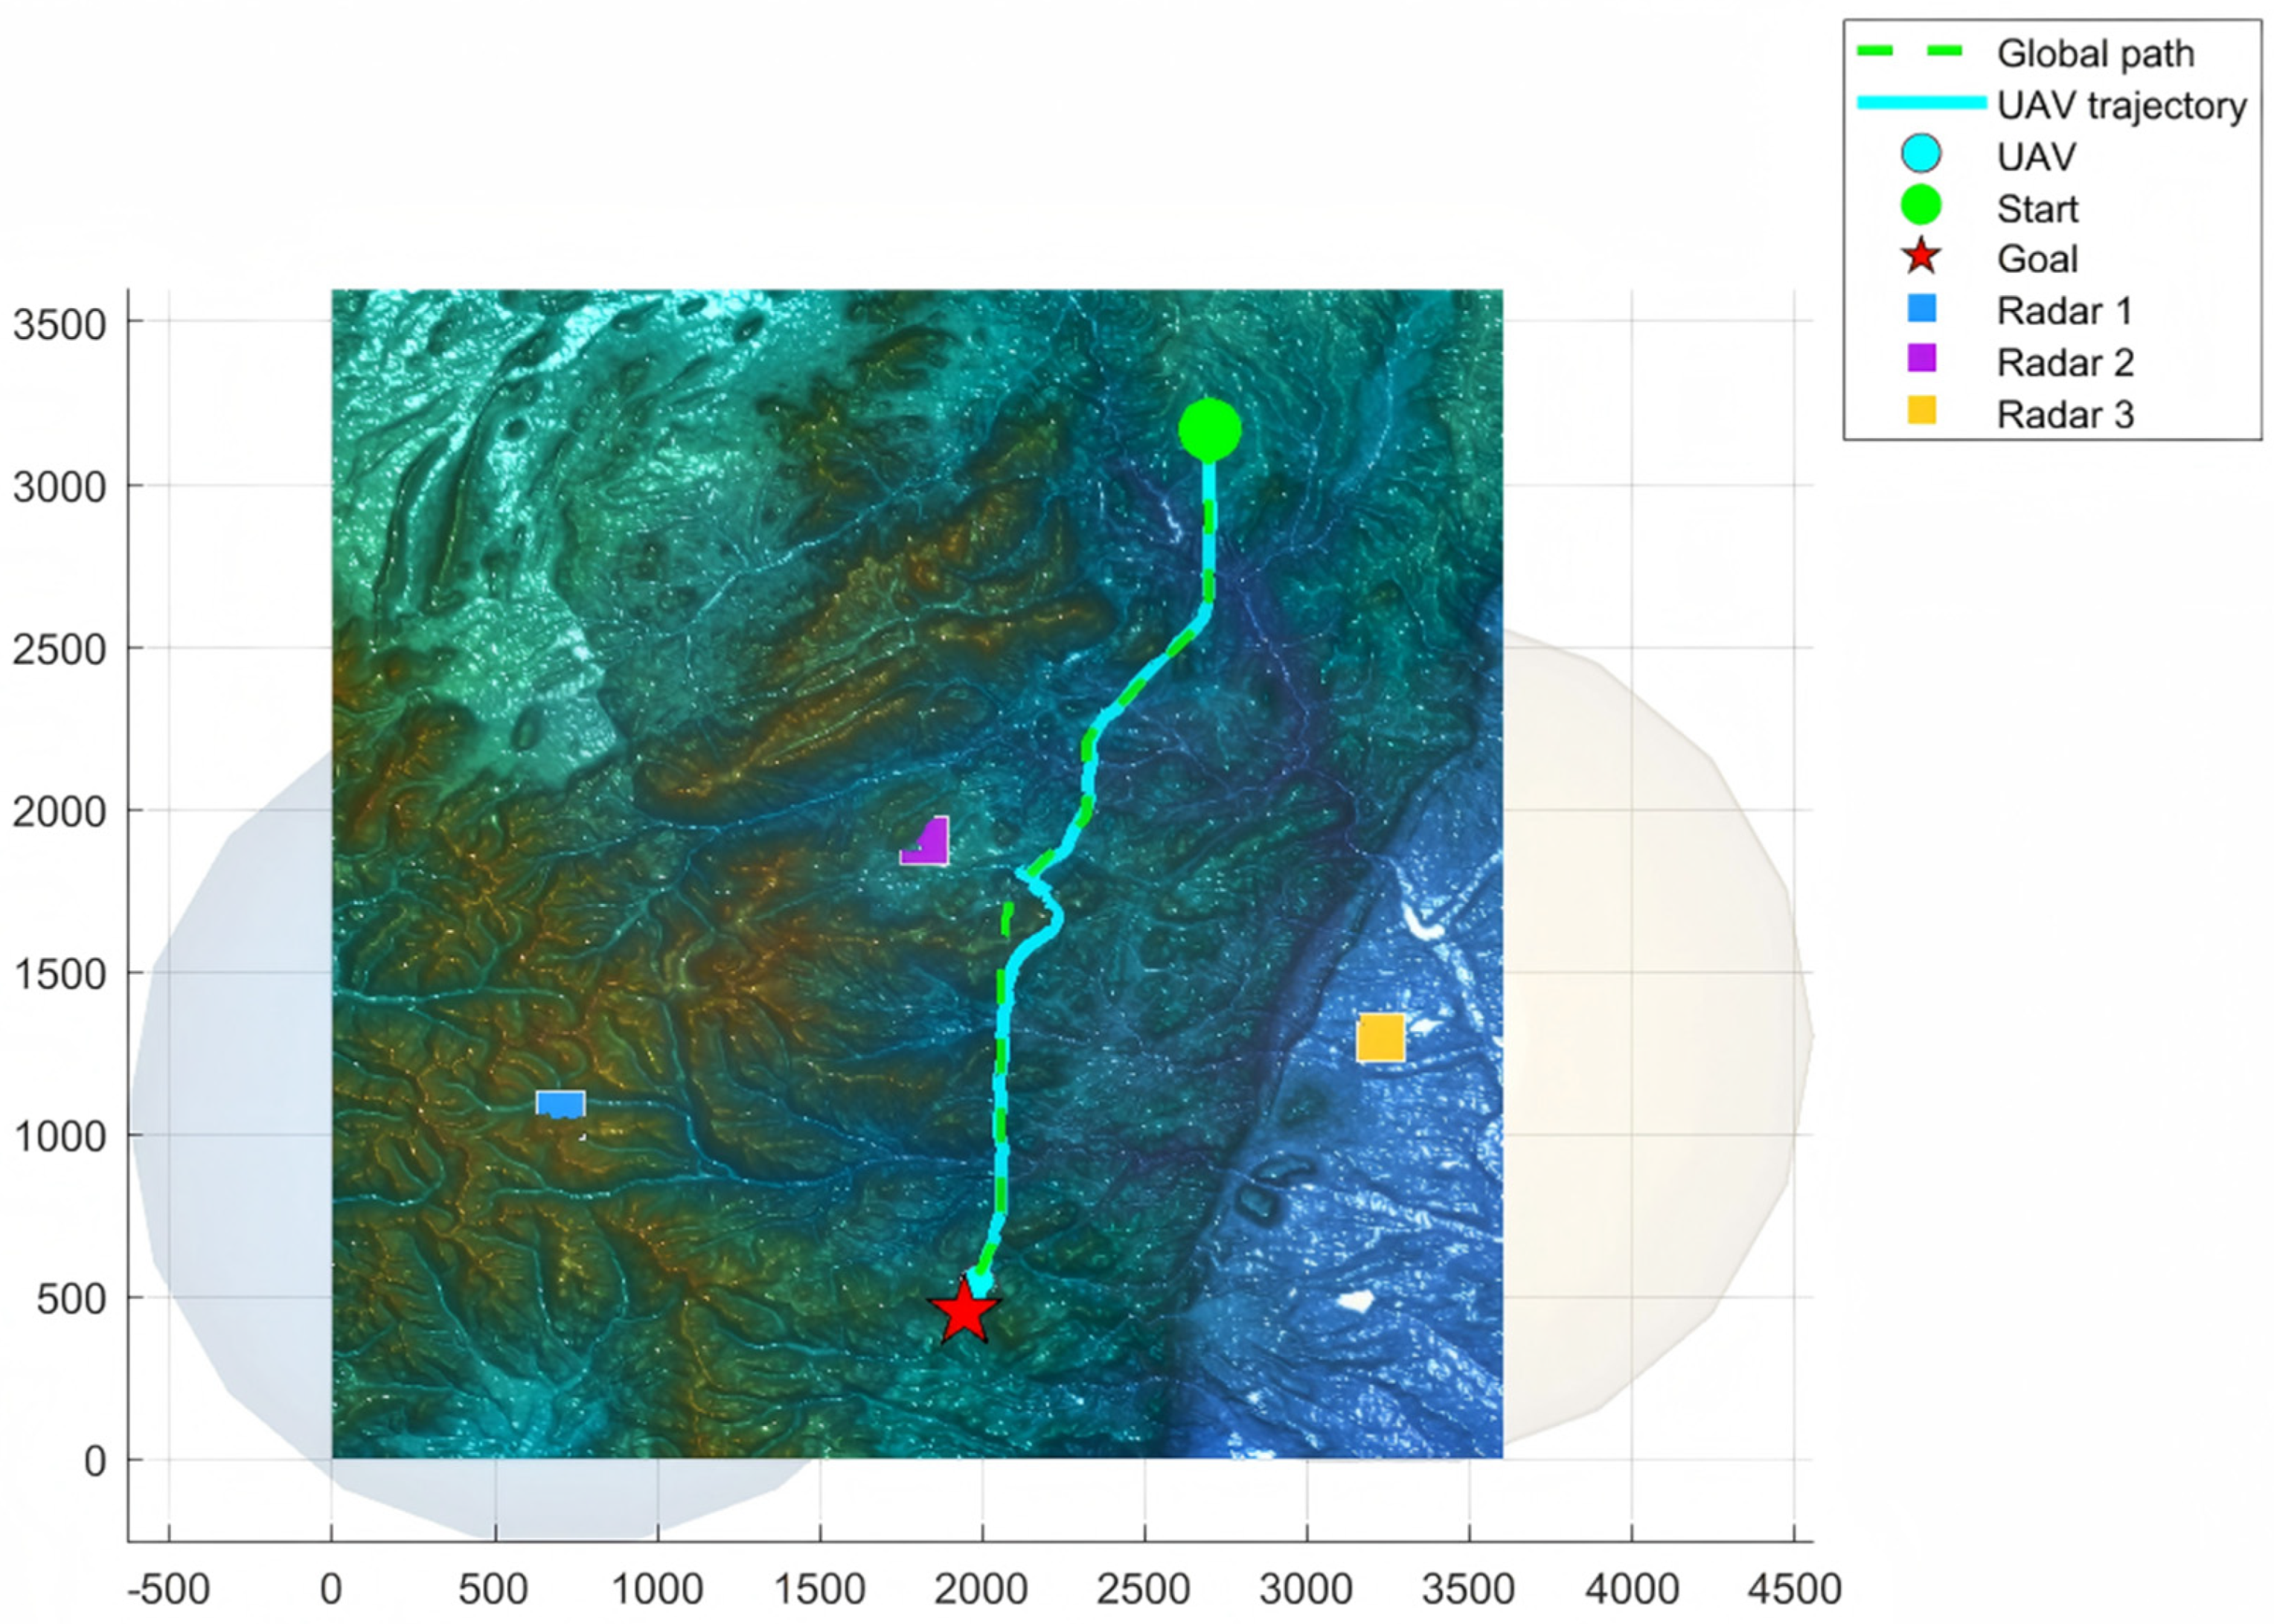
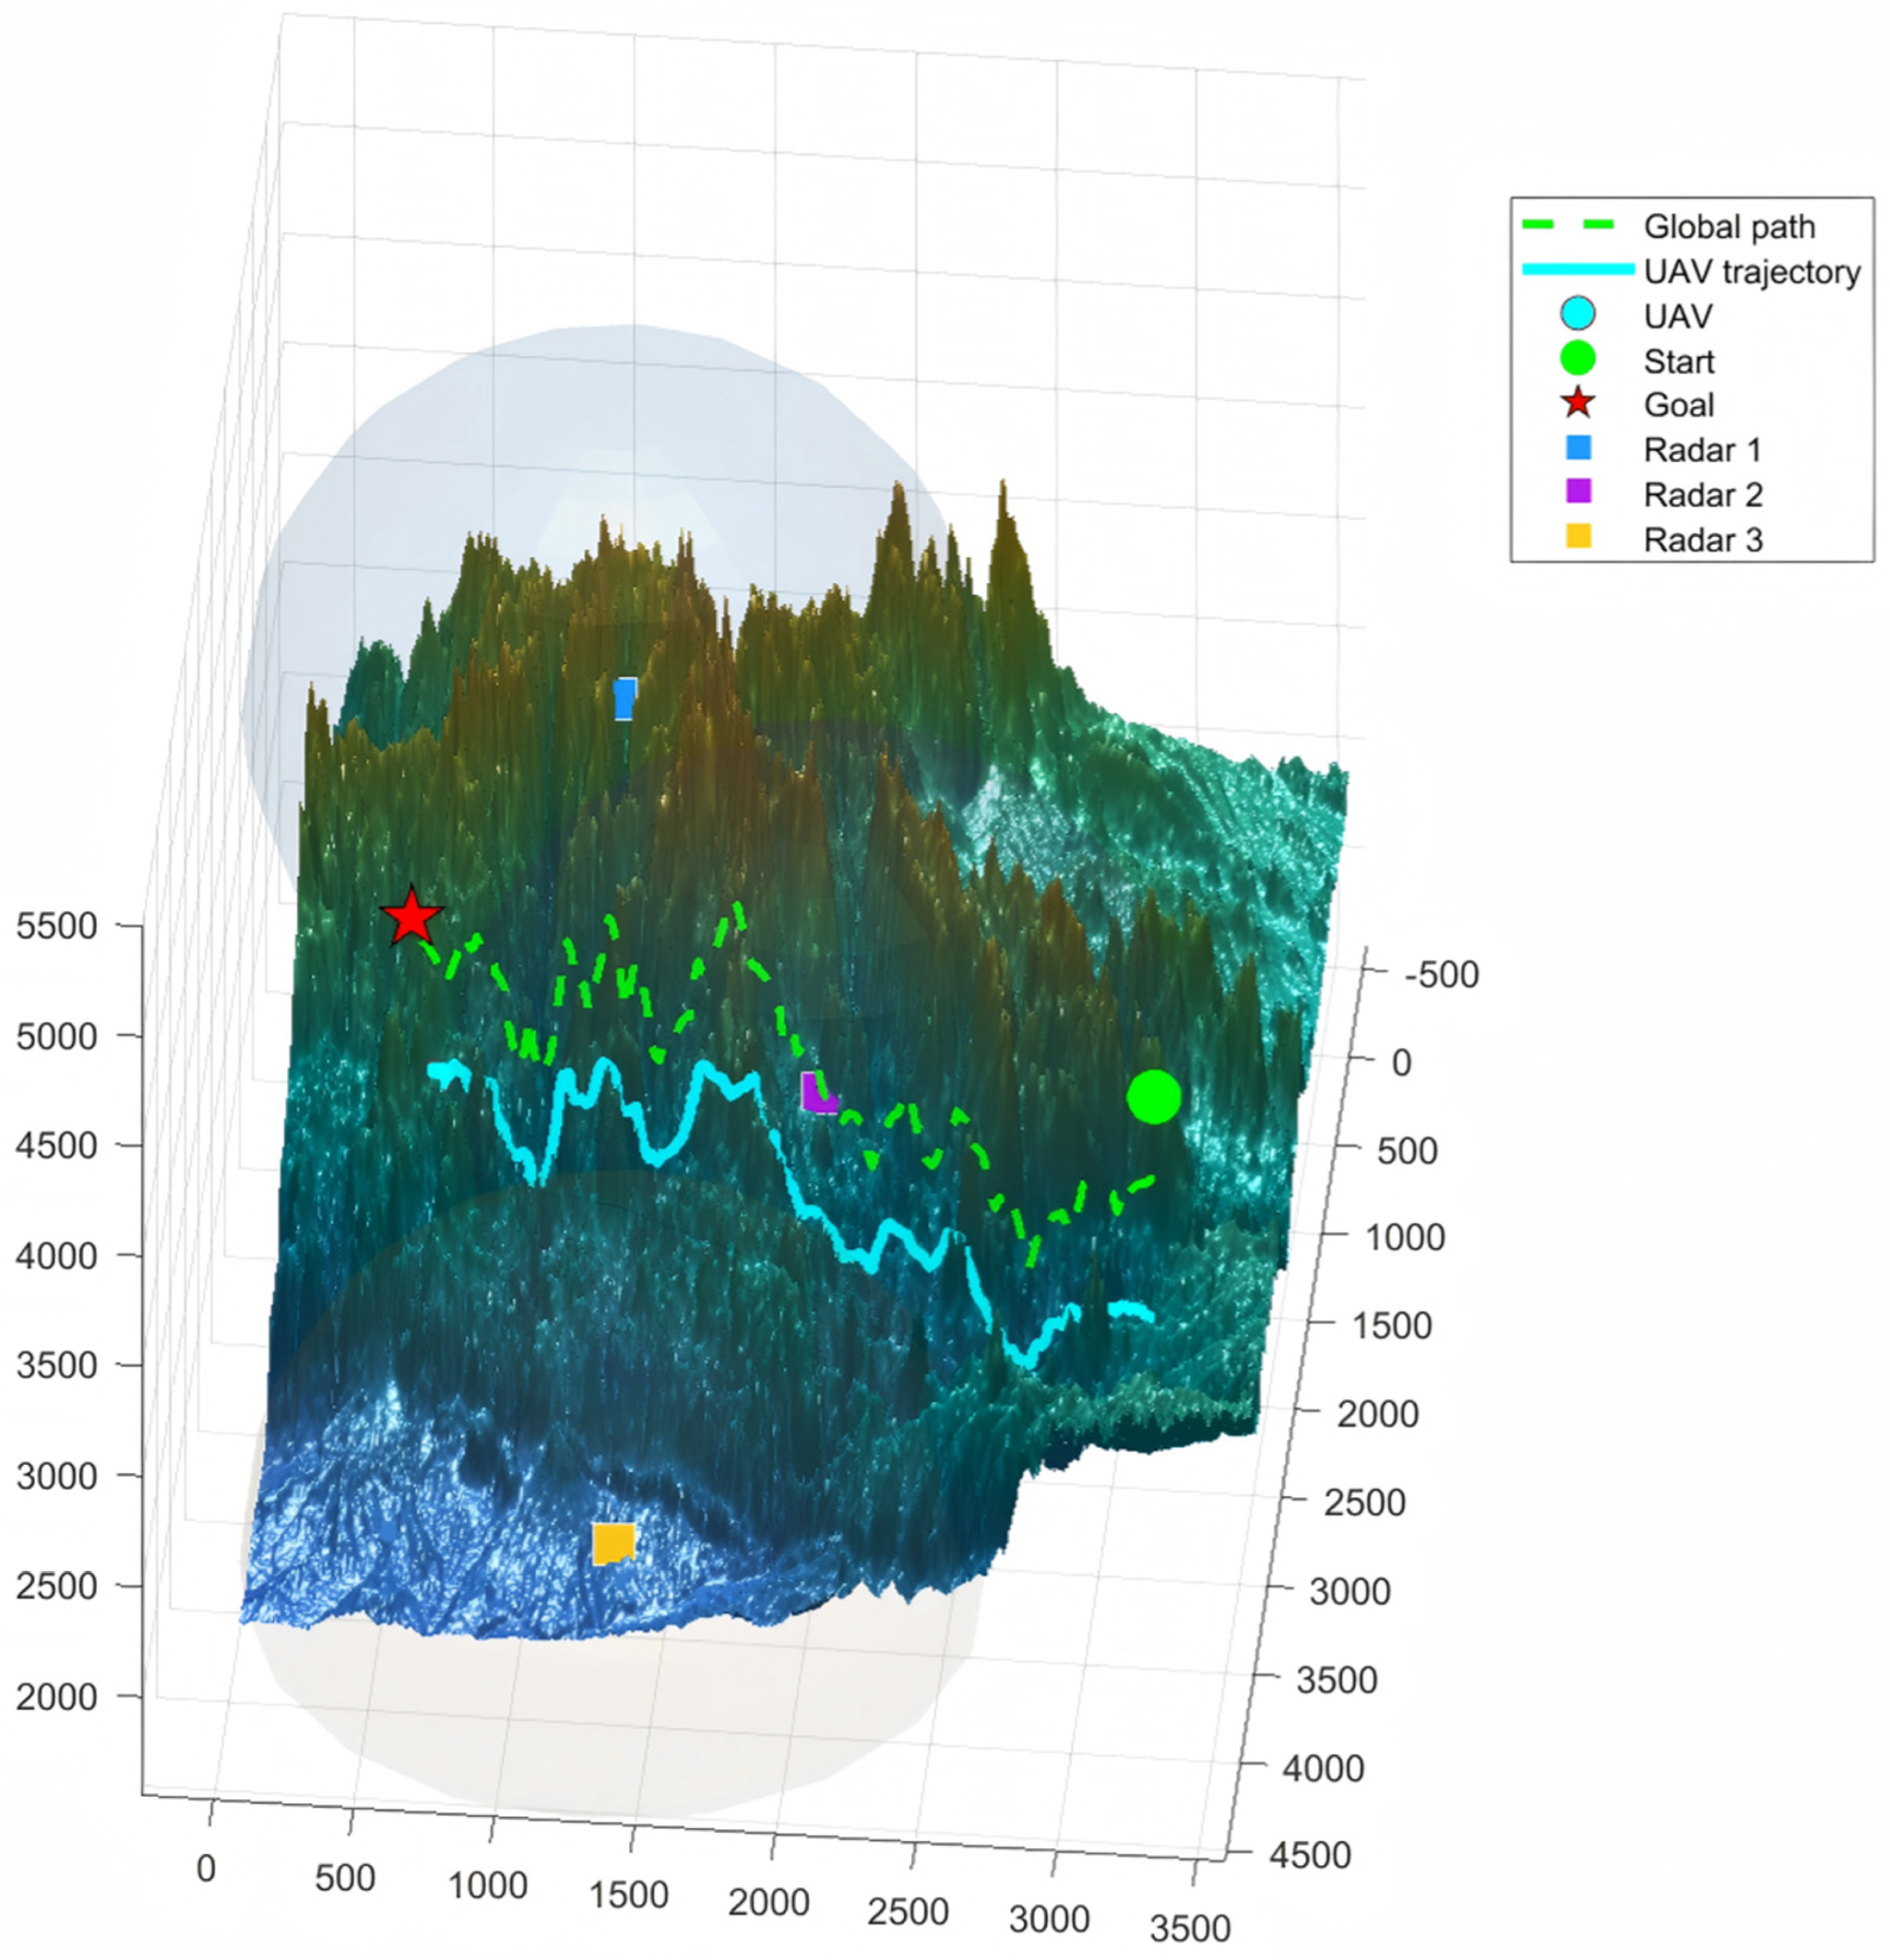
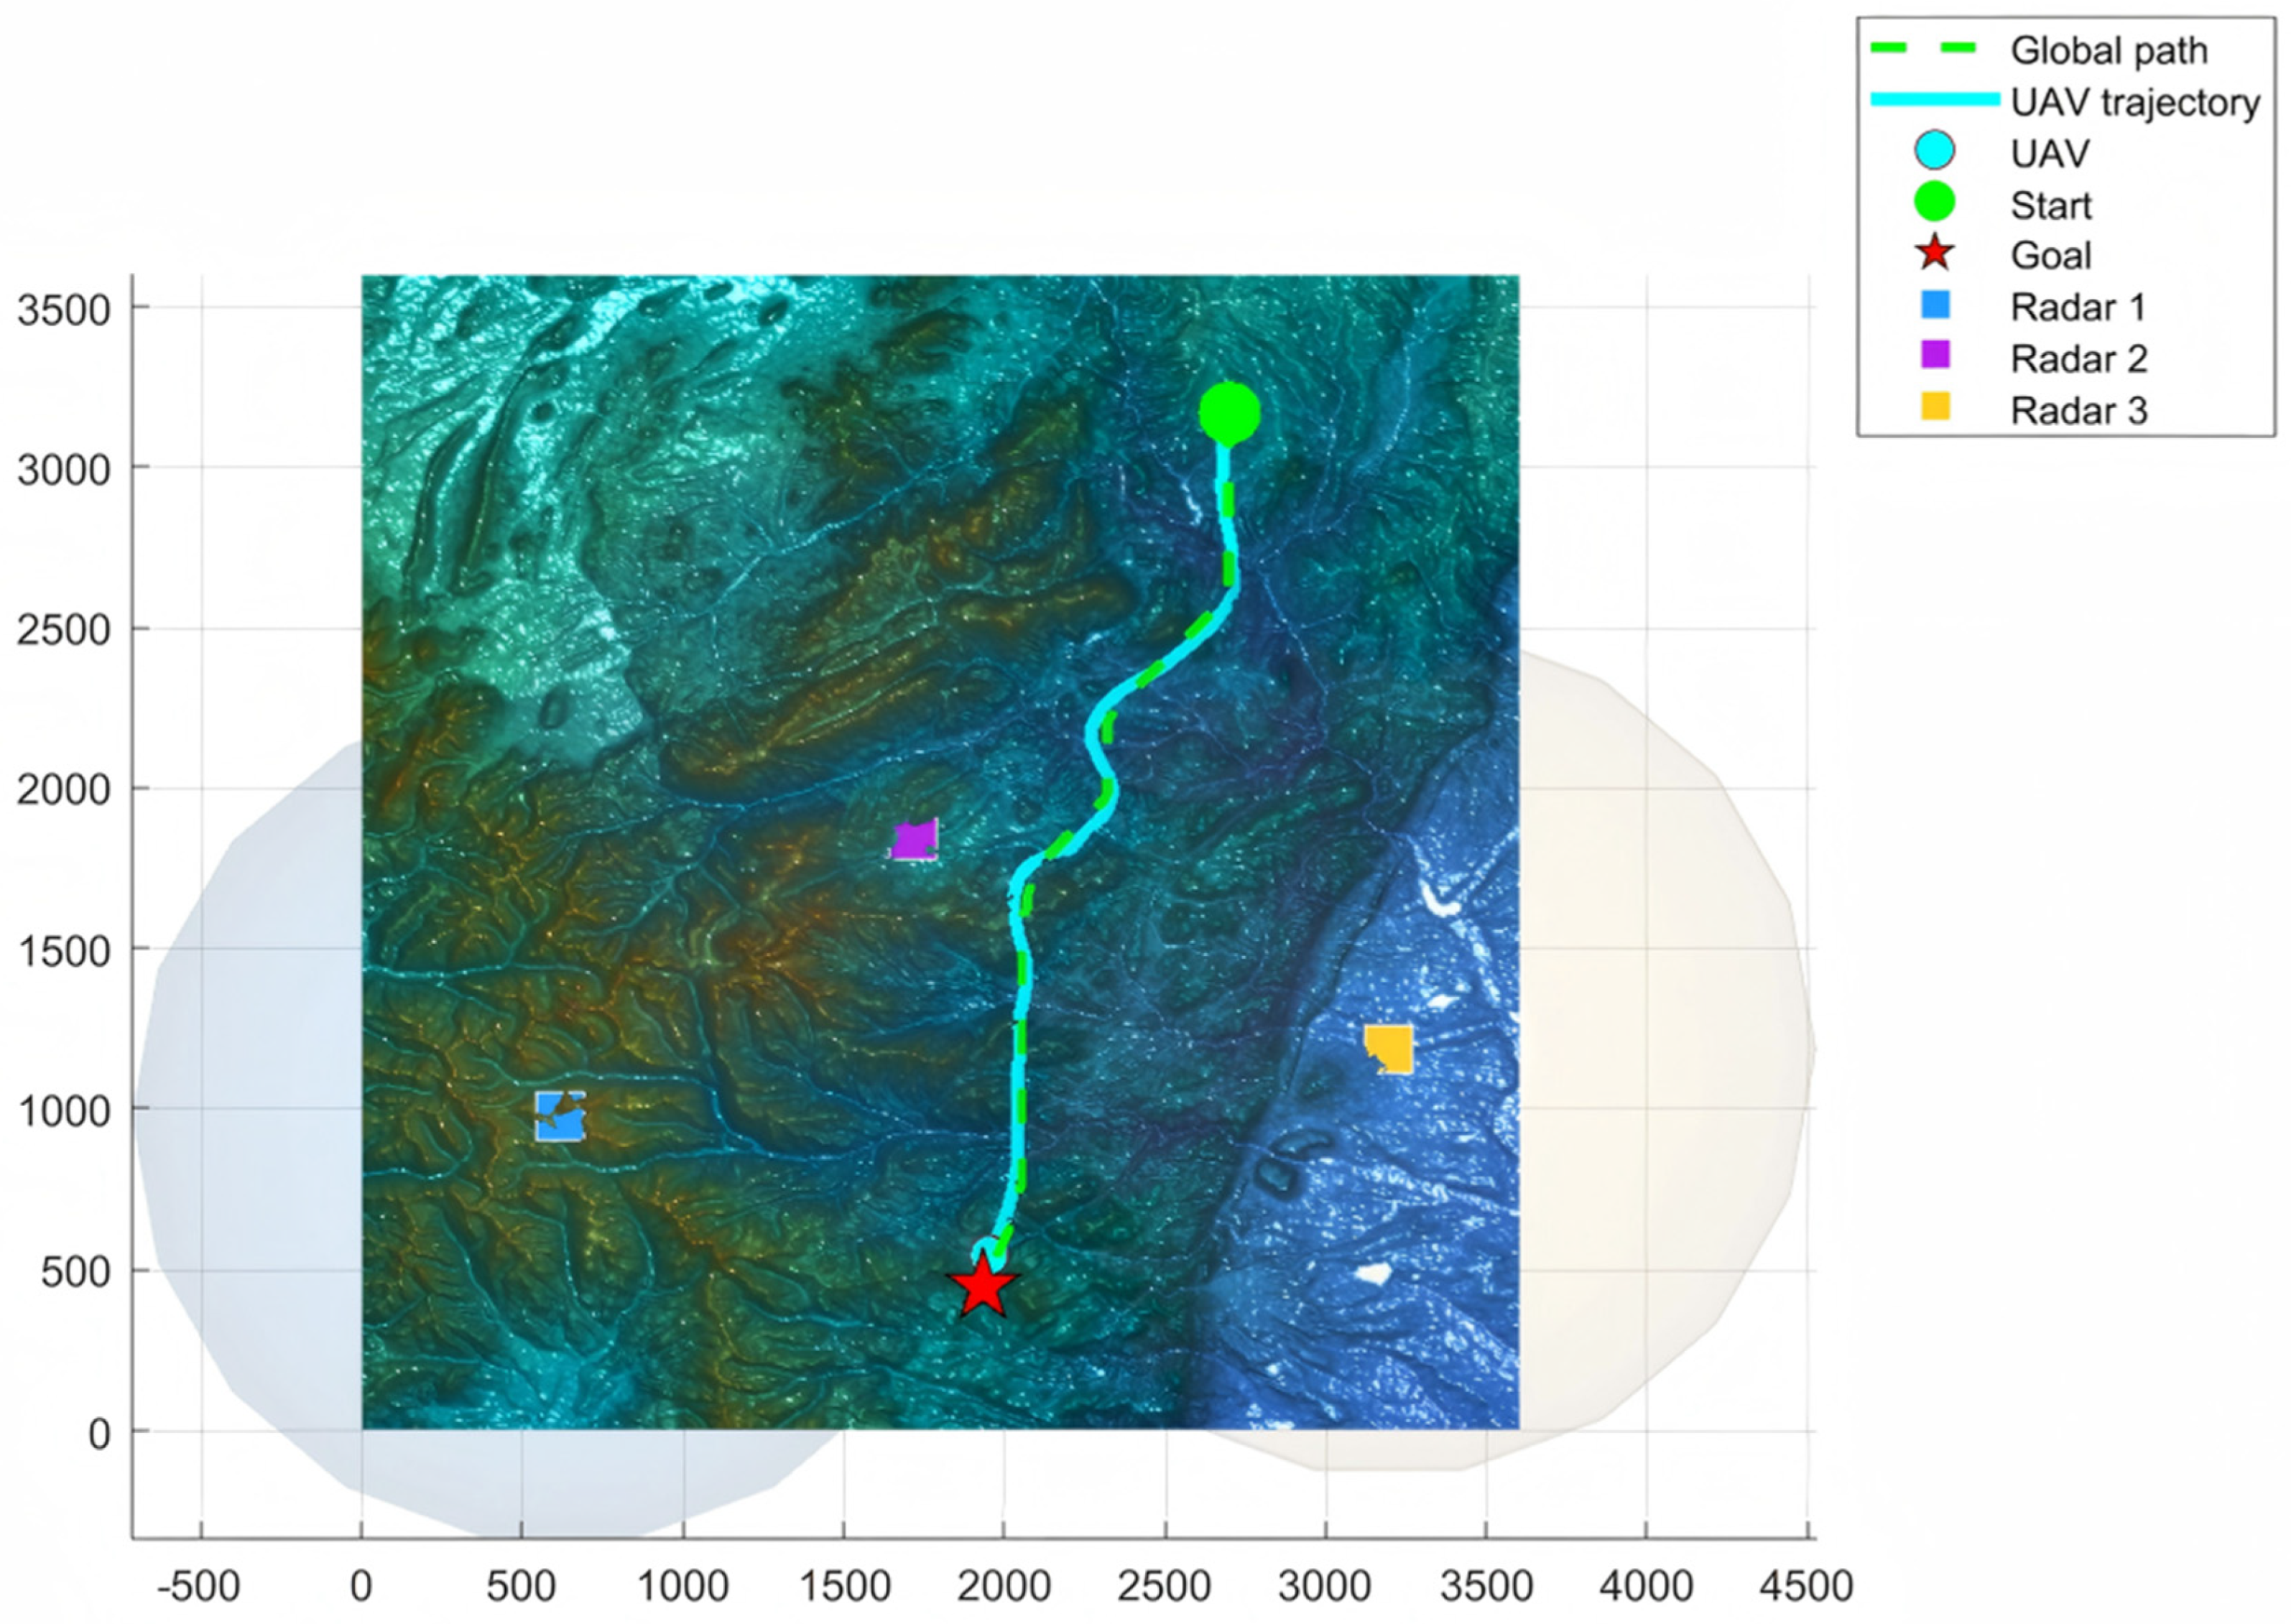
Figure 11 and
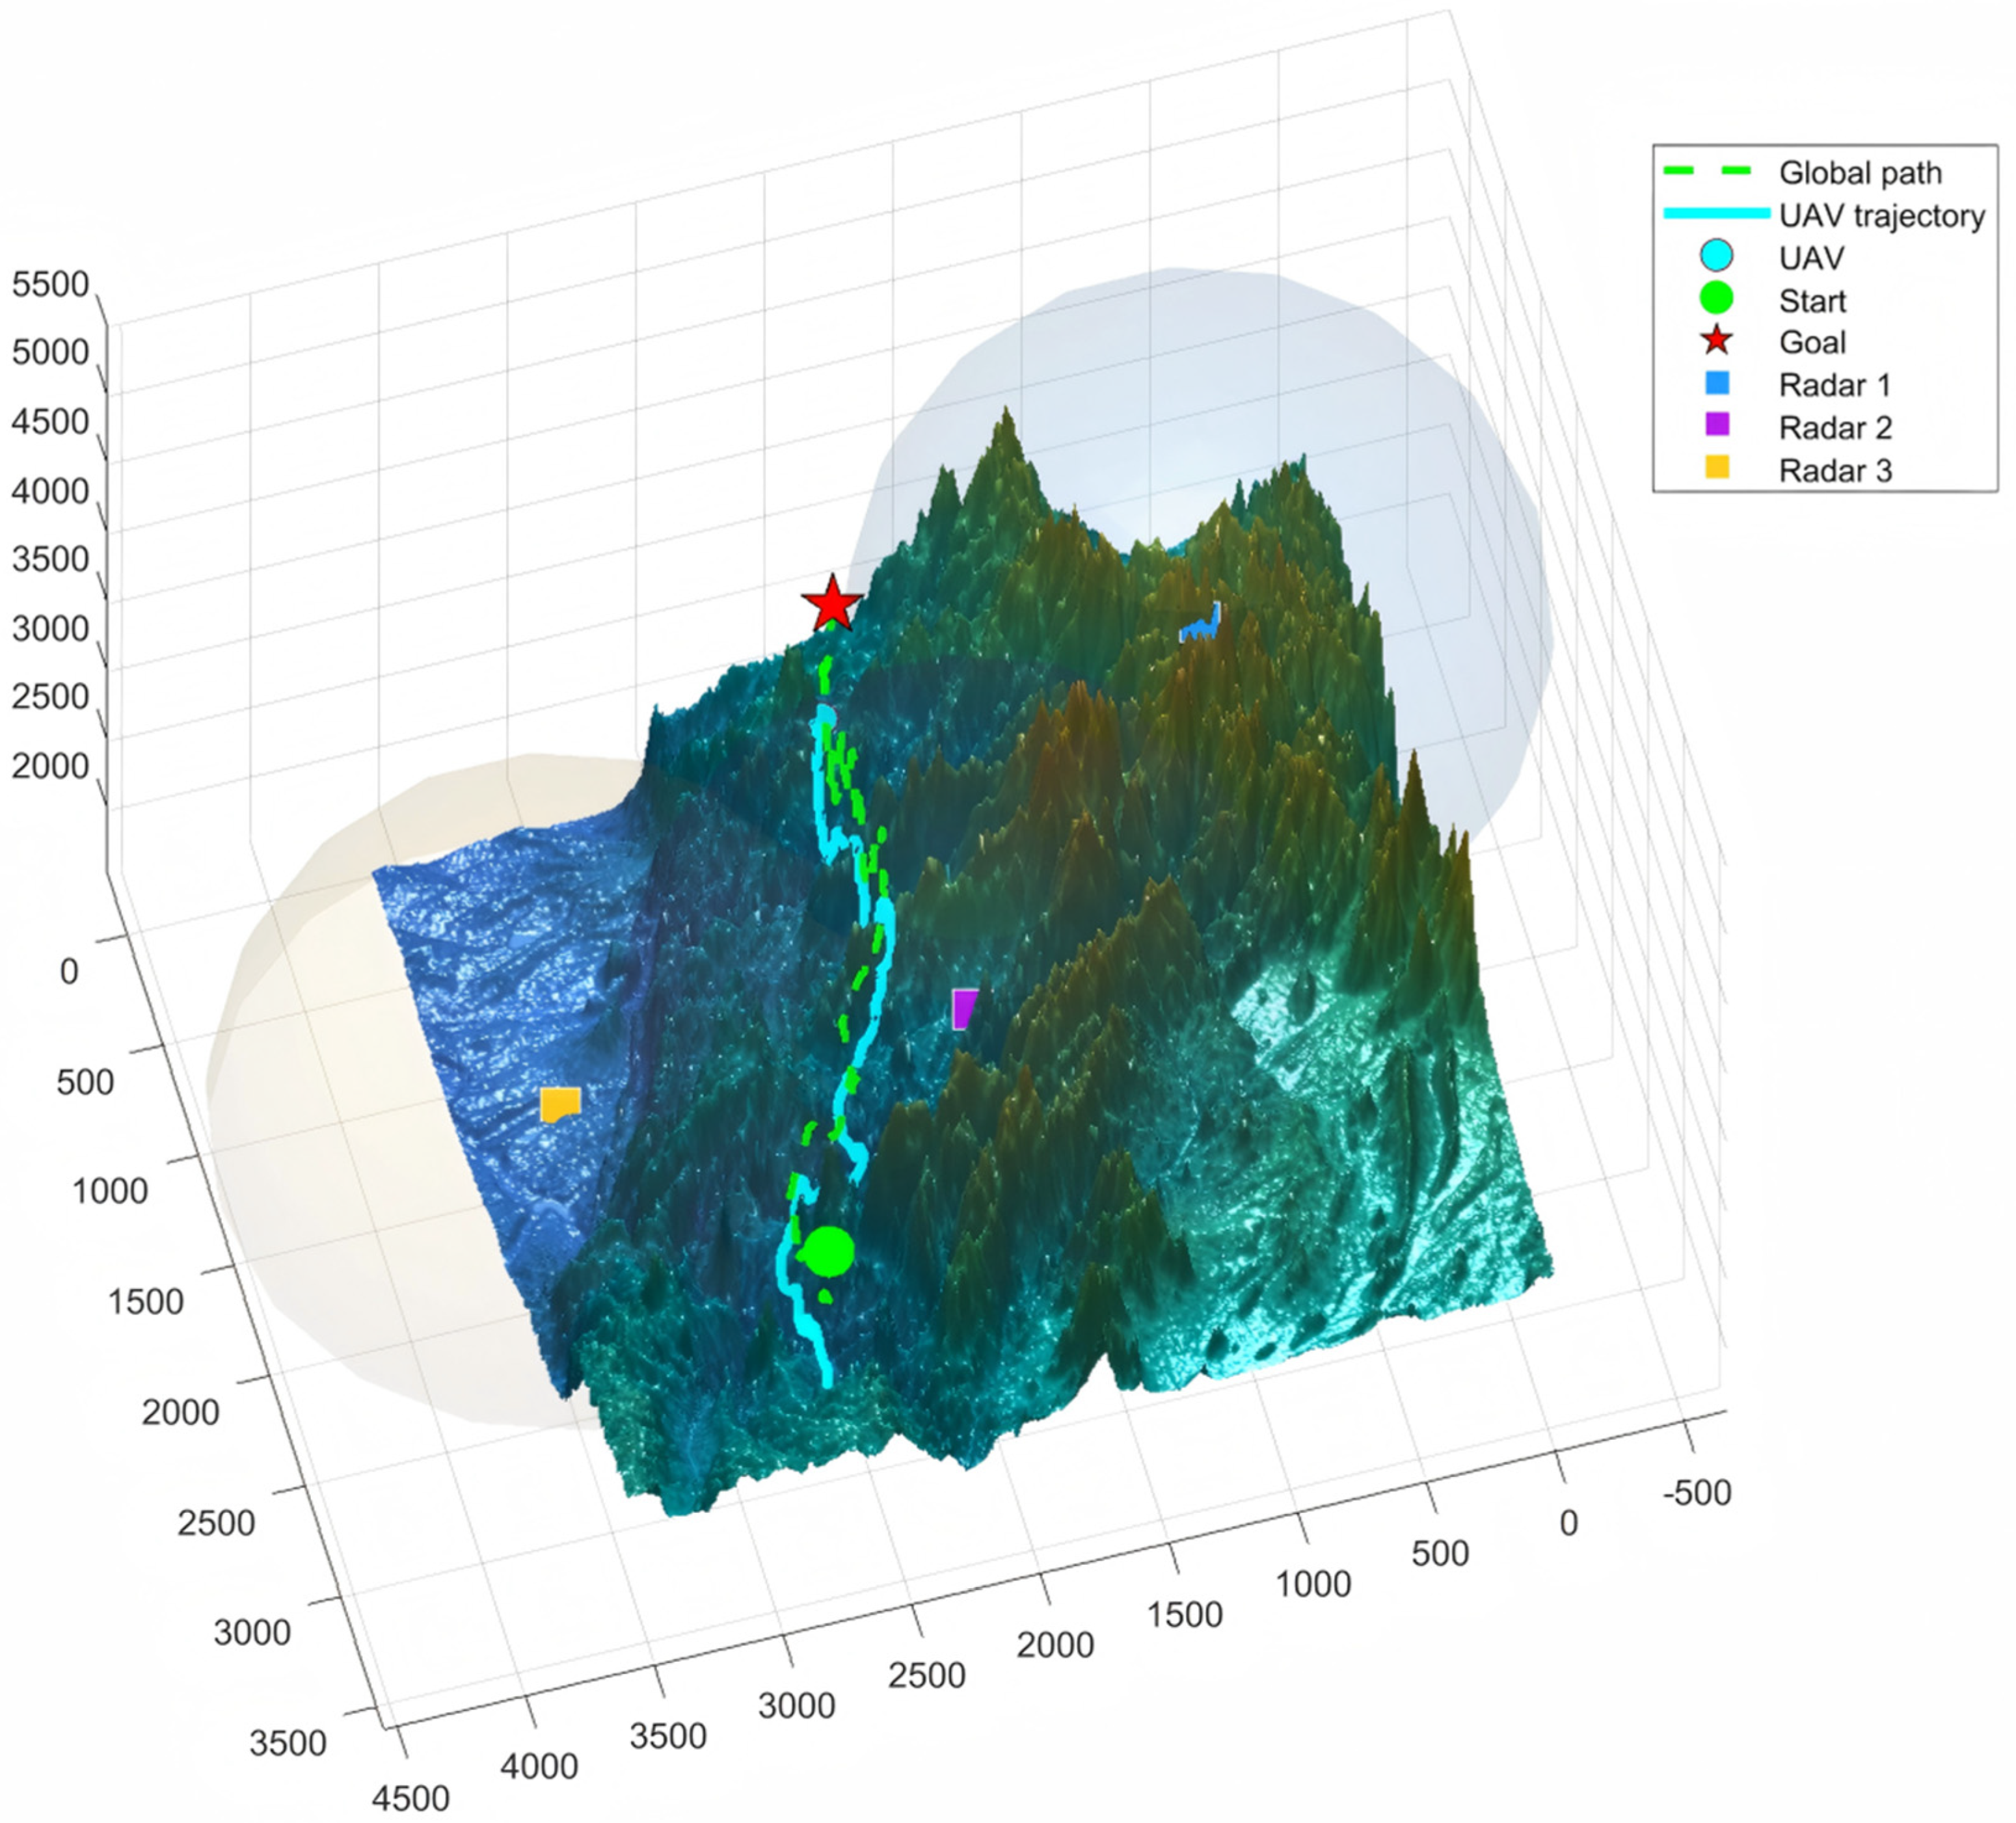
Figure 12 present the two-dimensional and three-dimensional views, respectively. By comparing
Figure 11 and
Figure 10, it can be observed that the overall trajectory mainly follows the global route planned by Risk-A*, which guides the UAV to traverse the globally low-risk (green) region. In addition, when passing near Radar 2, the trajectory is adjusted online by the MPC algorithm to ensure that the UAV is not successfully detected by hostile radars throughout the flight.
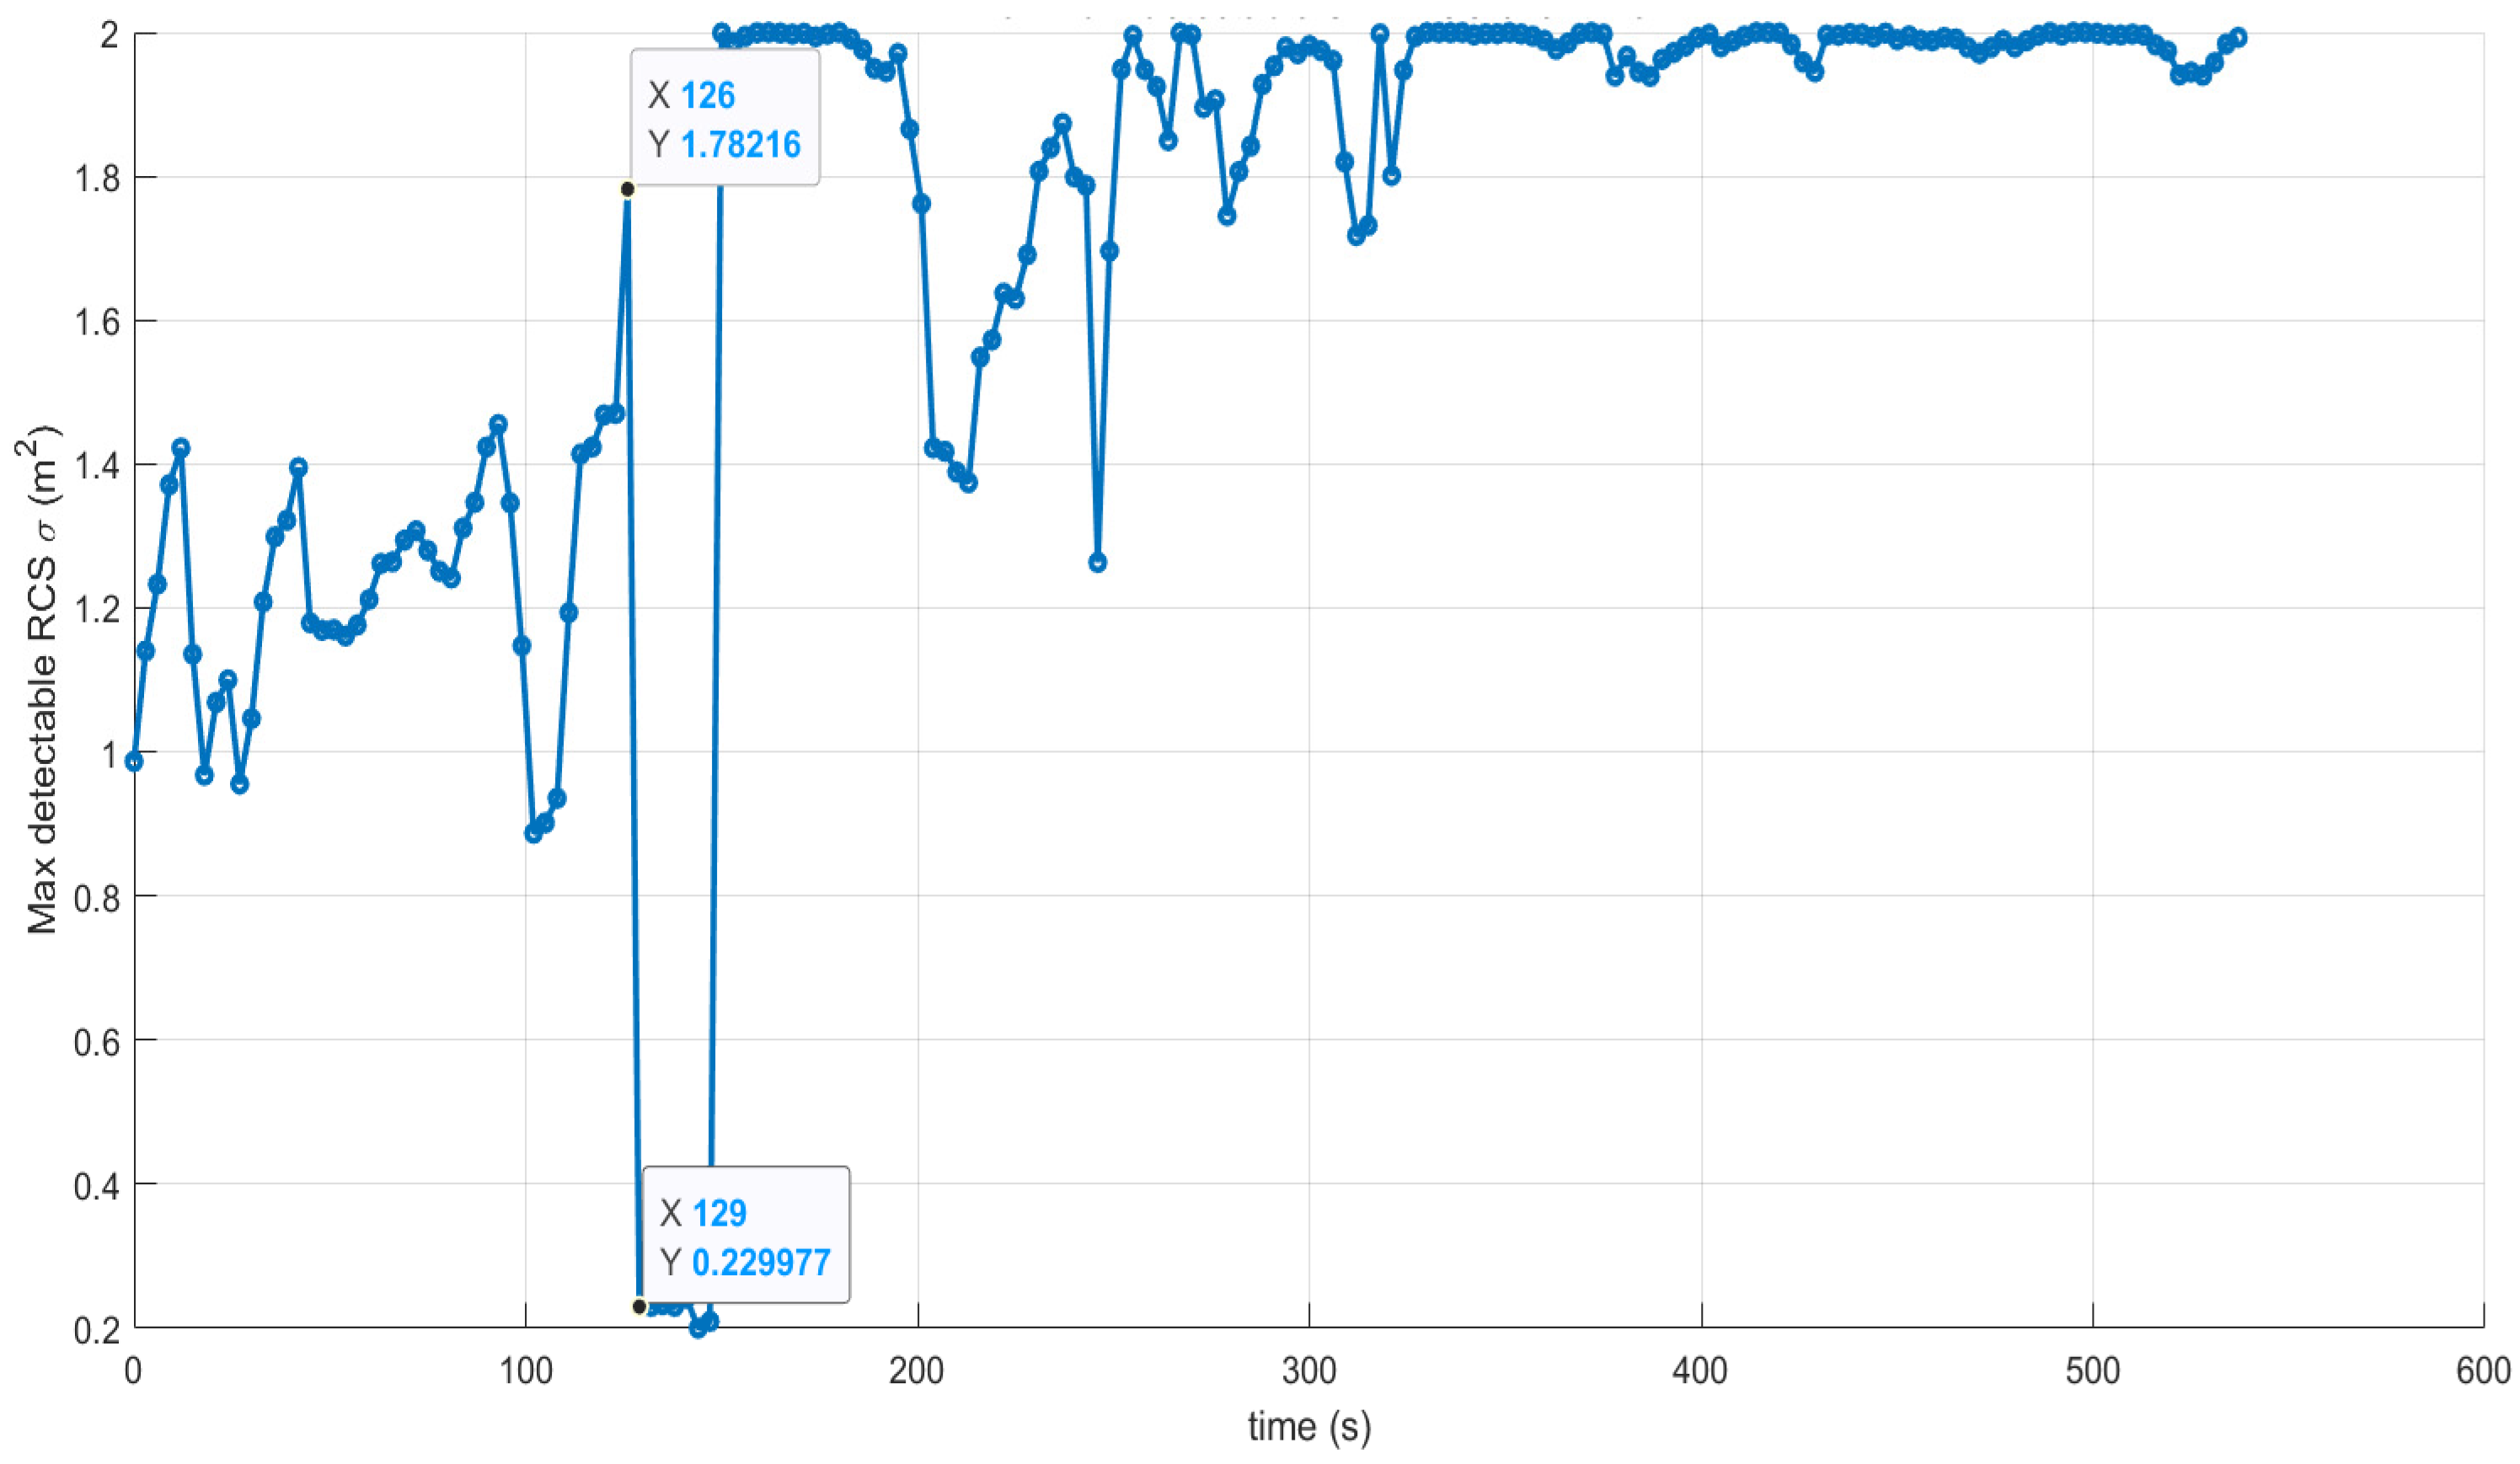
The LOS condition over the entire flight is analyzed, as shown in
Figure 13. The global LOS equals 1 only during a short interval (129–156 s). As shown in
Figure 14, the global effective detectability
never exceeds the prescribed threshold
. Therefore, no exposure event occurs during the mission.
To evaluate the comprehensive performance of the proposed Risk-A*-MPC framework under complex mountainous terrain and dynamic radar-based sensing constraints, three representative global reference planners, namely Theta*, D* Lite, and RRT*, are selected as baselines and combined with the same local MPC executor. For all methods, the same terrain dataset, start-goal pair, radar-patrol configuration, UAV kinematic constraints, local MPC parameter settings, radar detection model, and detection threshold are used. The only planned difference is the global reference-path generation strategy. This setting ensures that the comparison reflects whether the global planner can provide a reference path with sufficient detection-risk margin for the common local MPC executor. The comparative results are reported in
Table 1.
4.2.5. Scenario 2: Terrain Zone 2 with One Nominal Start-Goal Pair
To examine whether the observed performance trend persists in a second mountainous-terrain setting, additional tests are conducted on Terrain Zone 2 generated from the ASTGTMV003_N33E107 dataset [
68]. The corresponding global risk heat map is shown in
Figure 15.
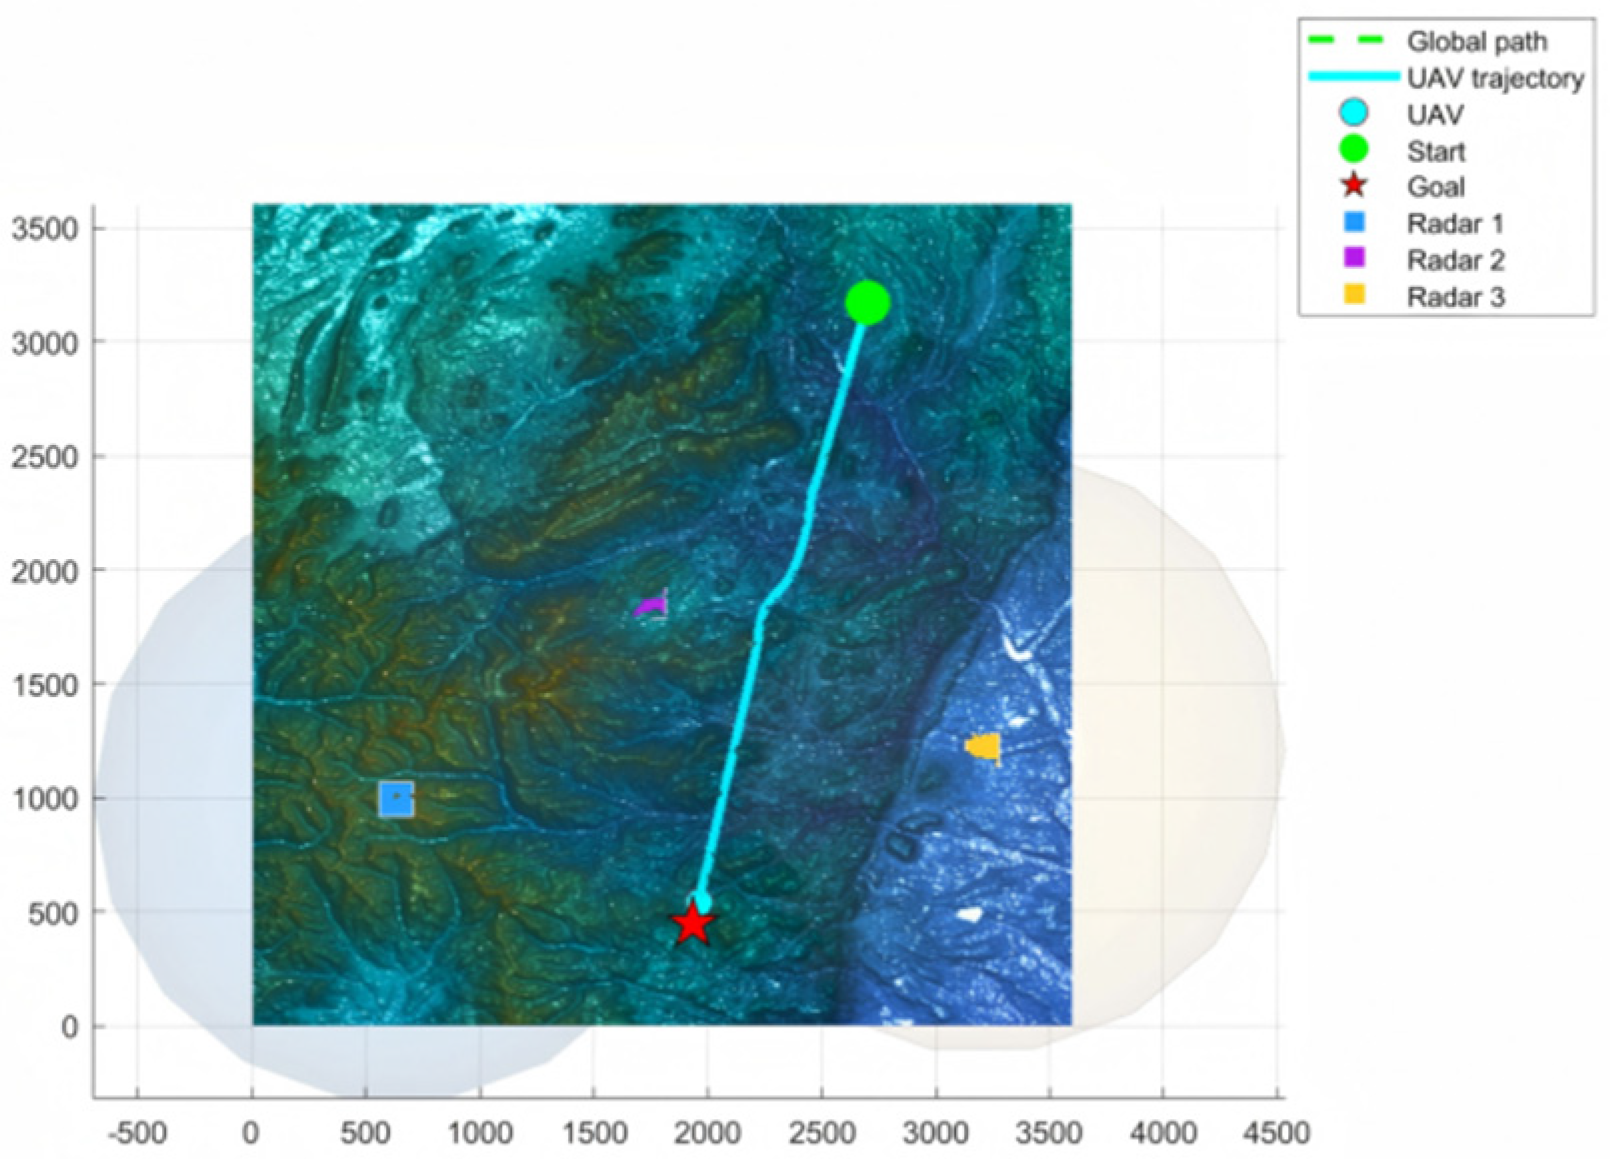
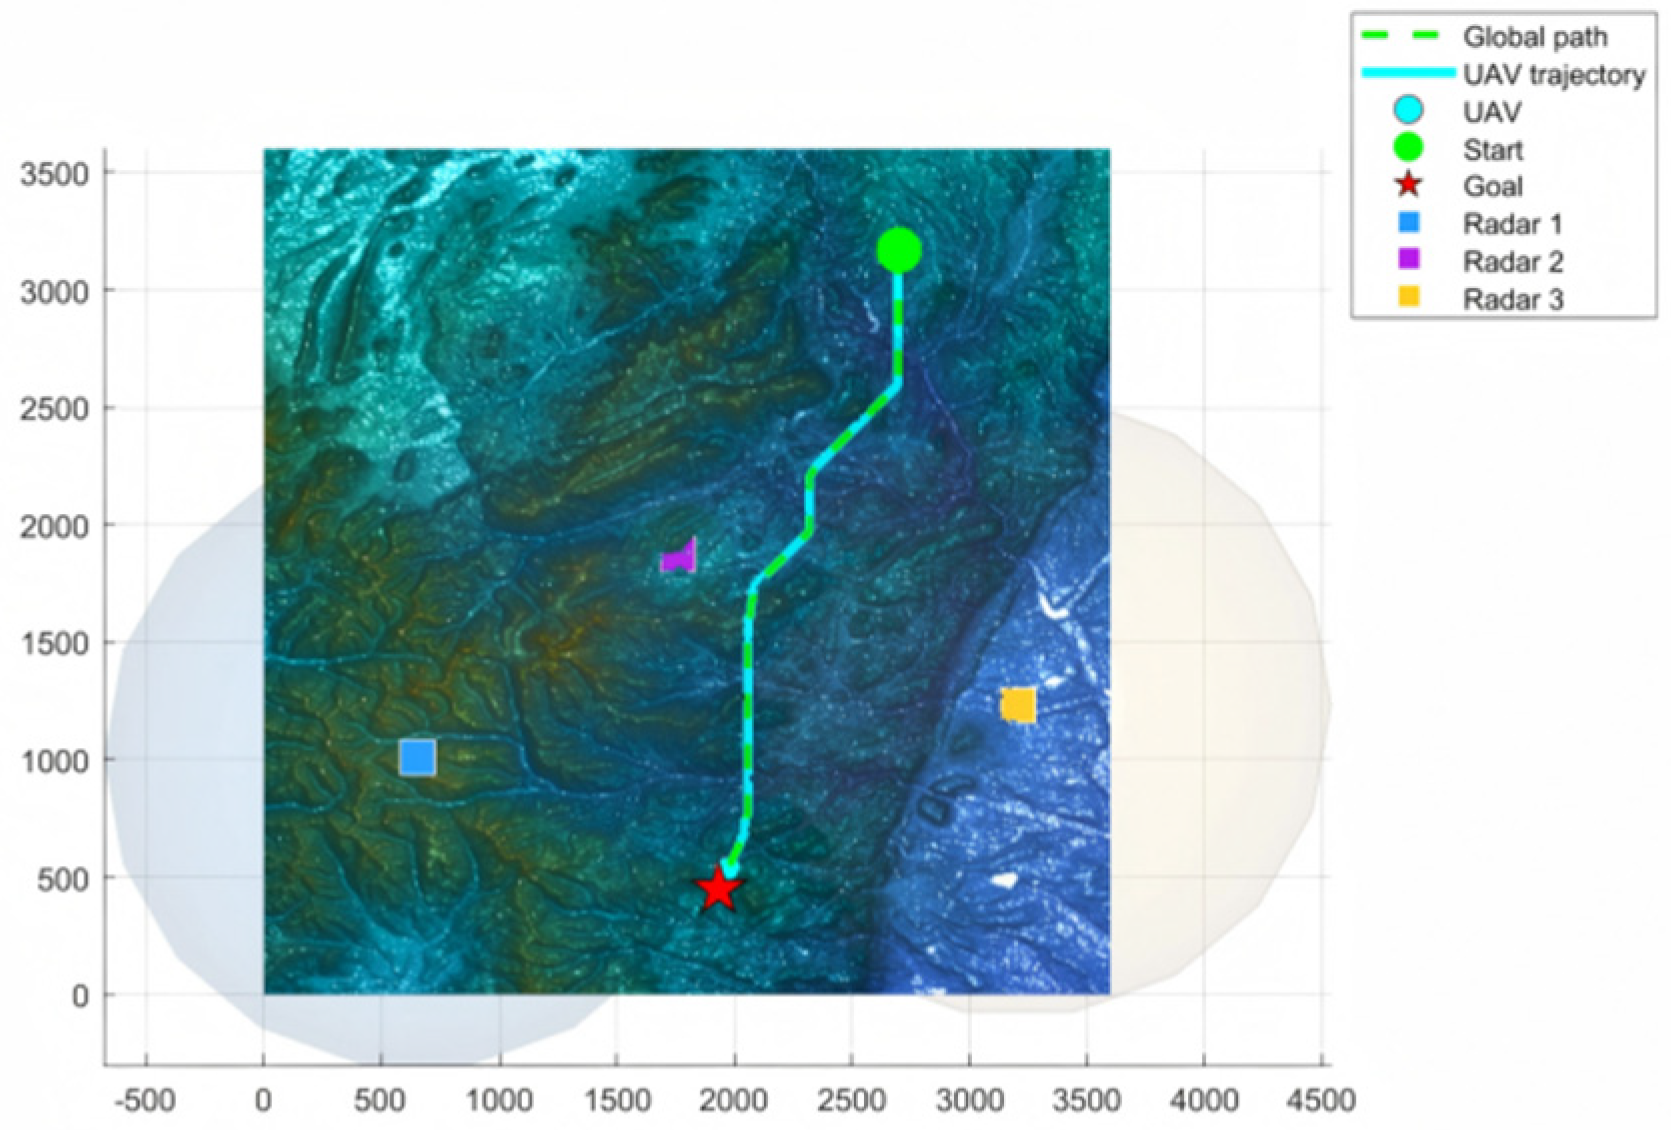
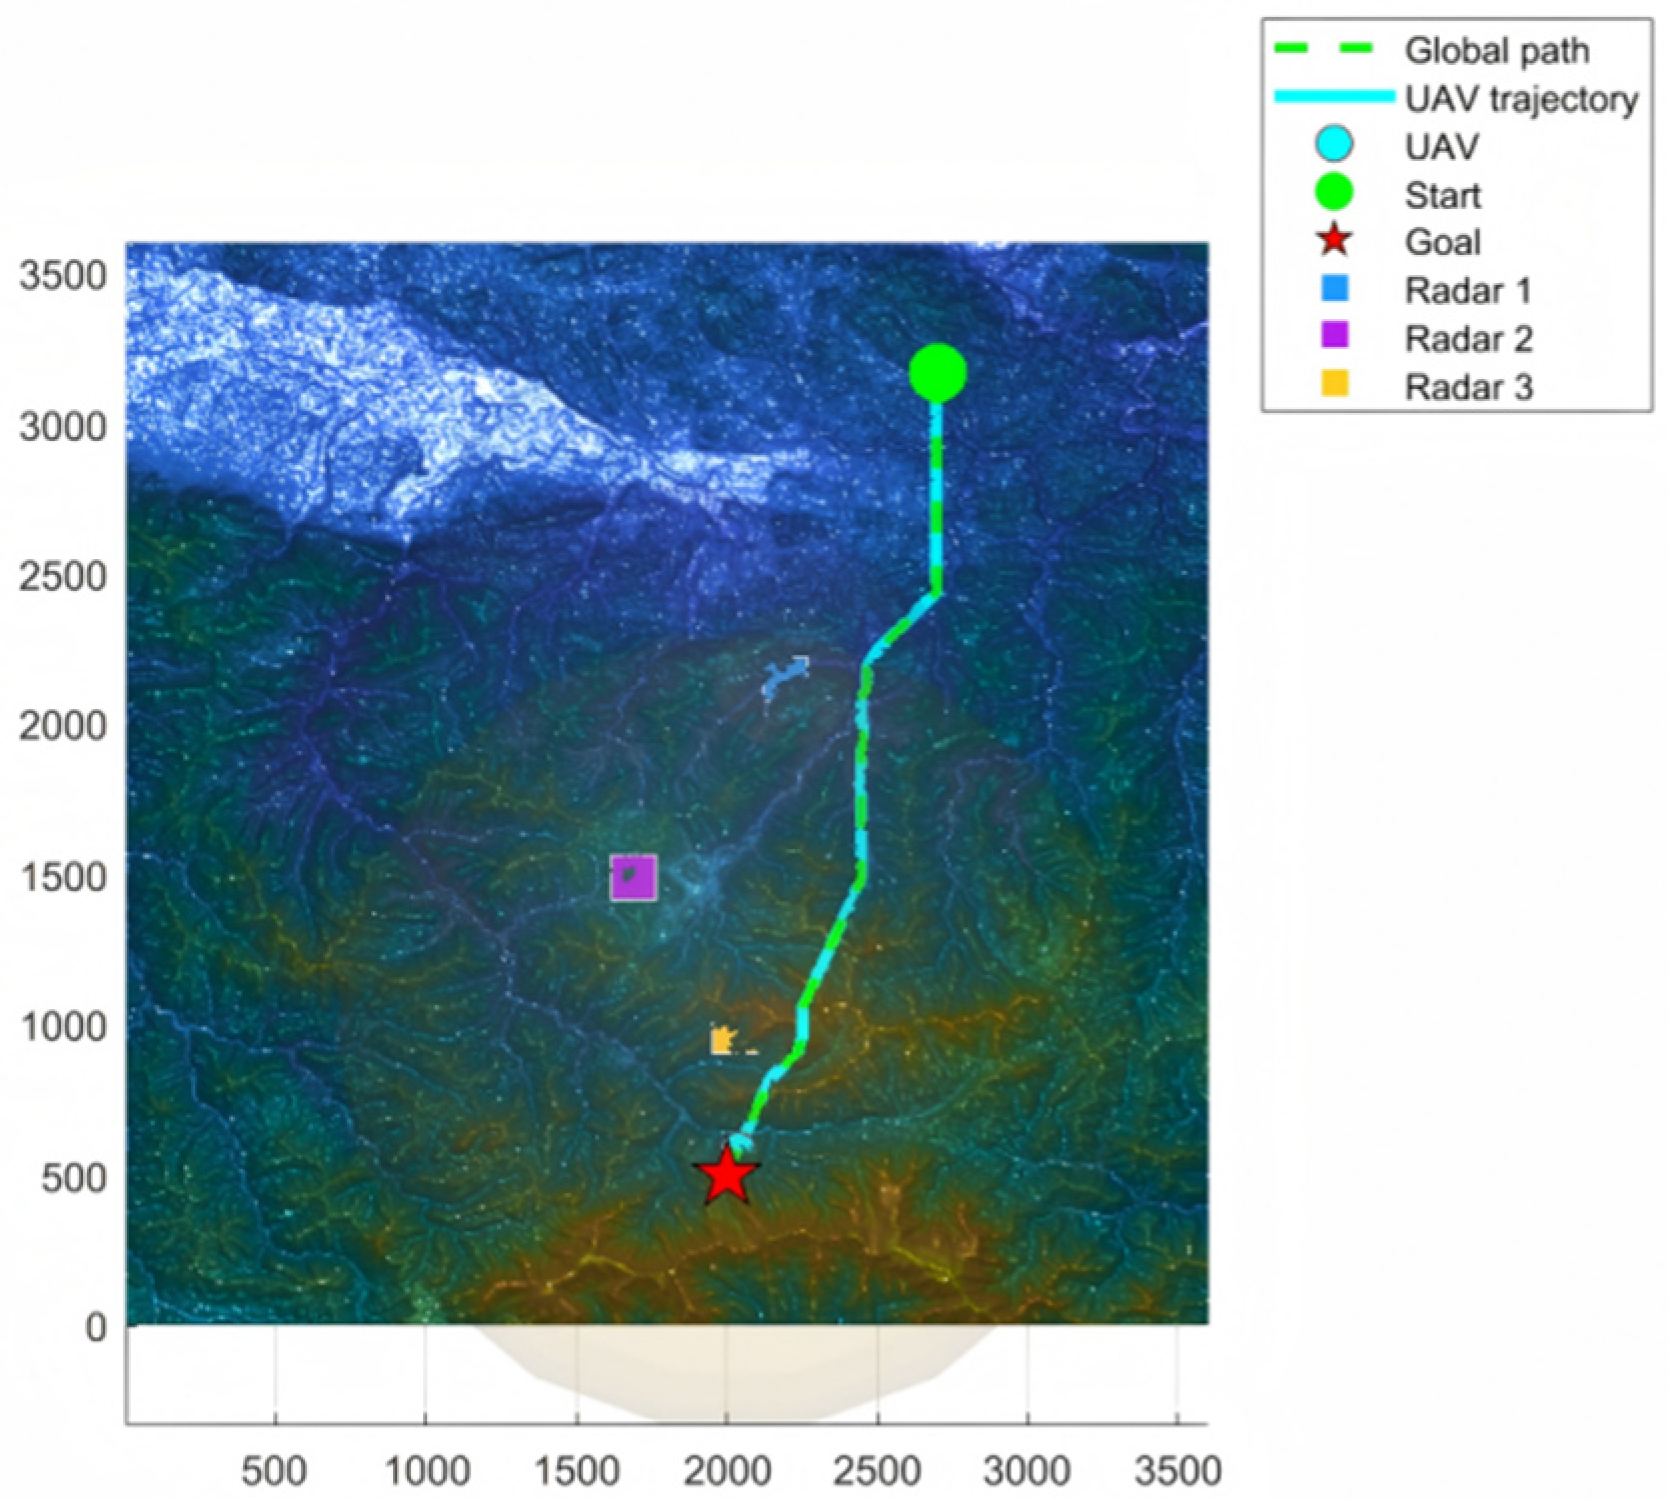
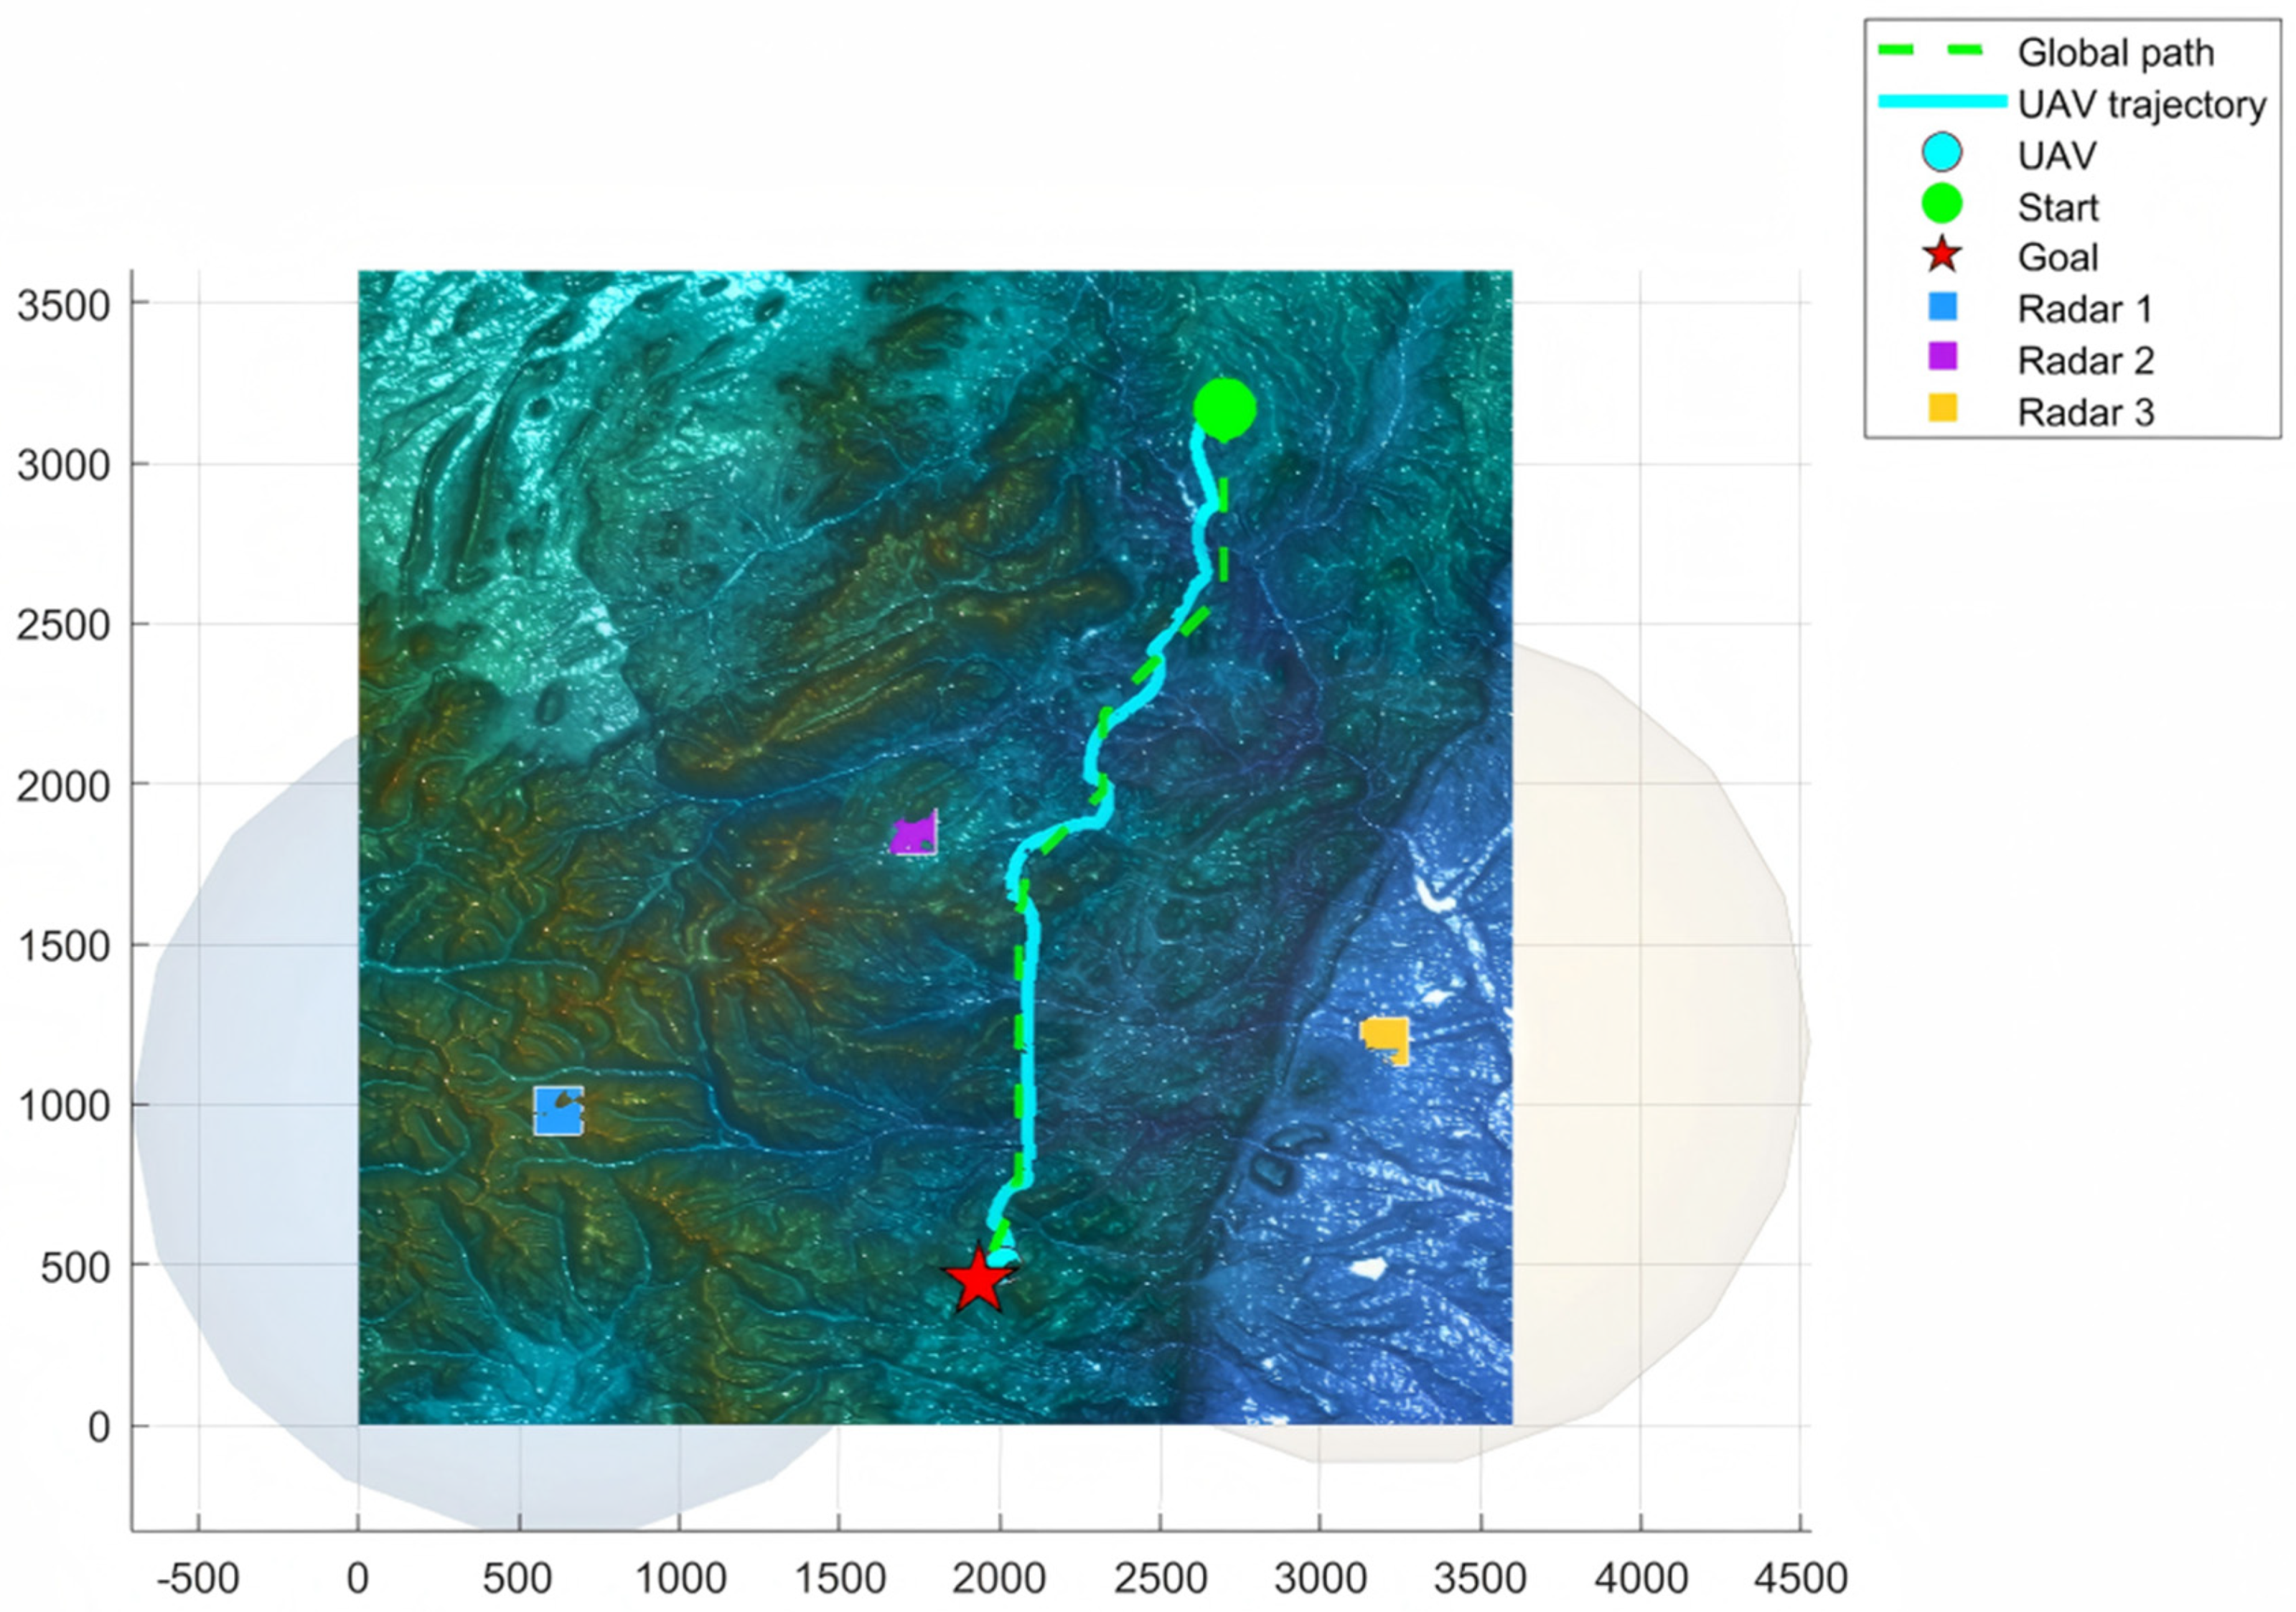
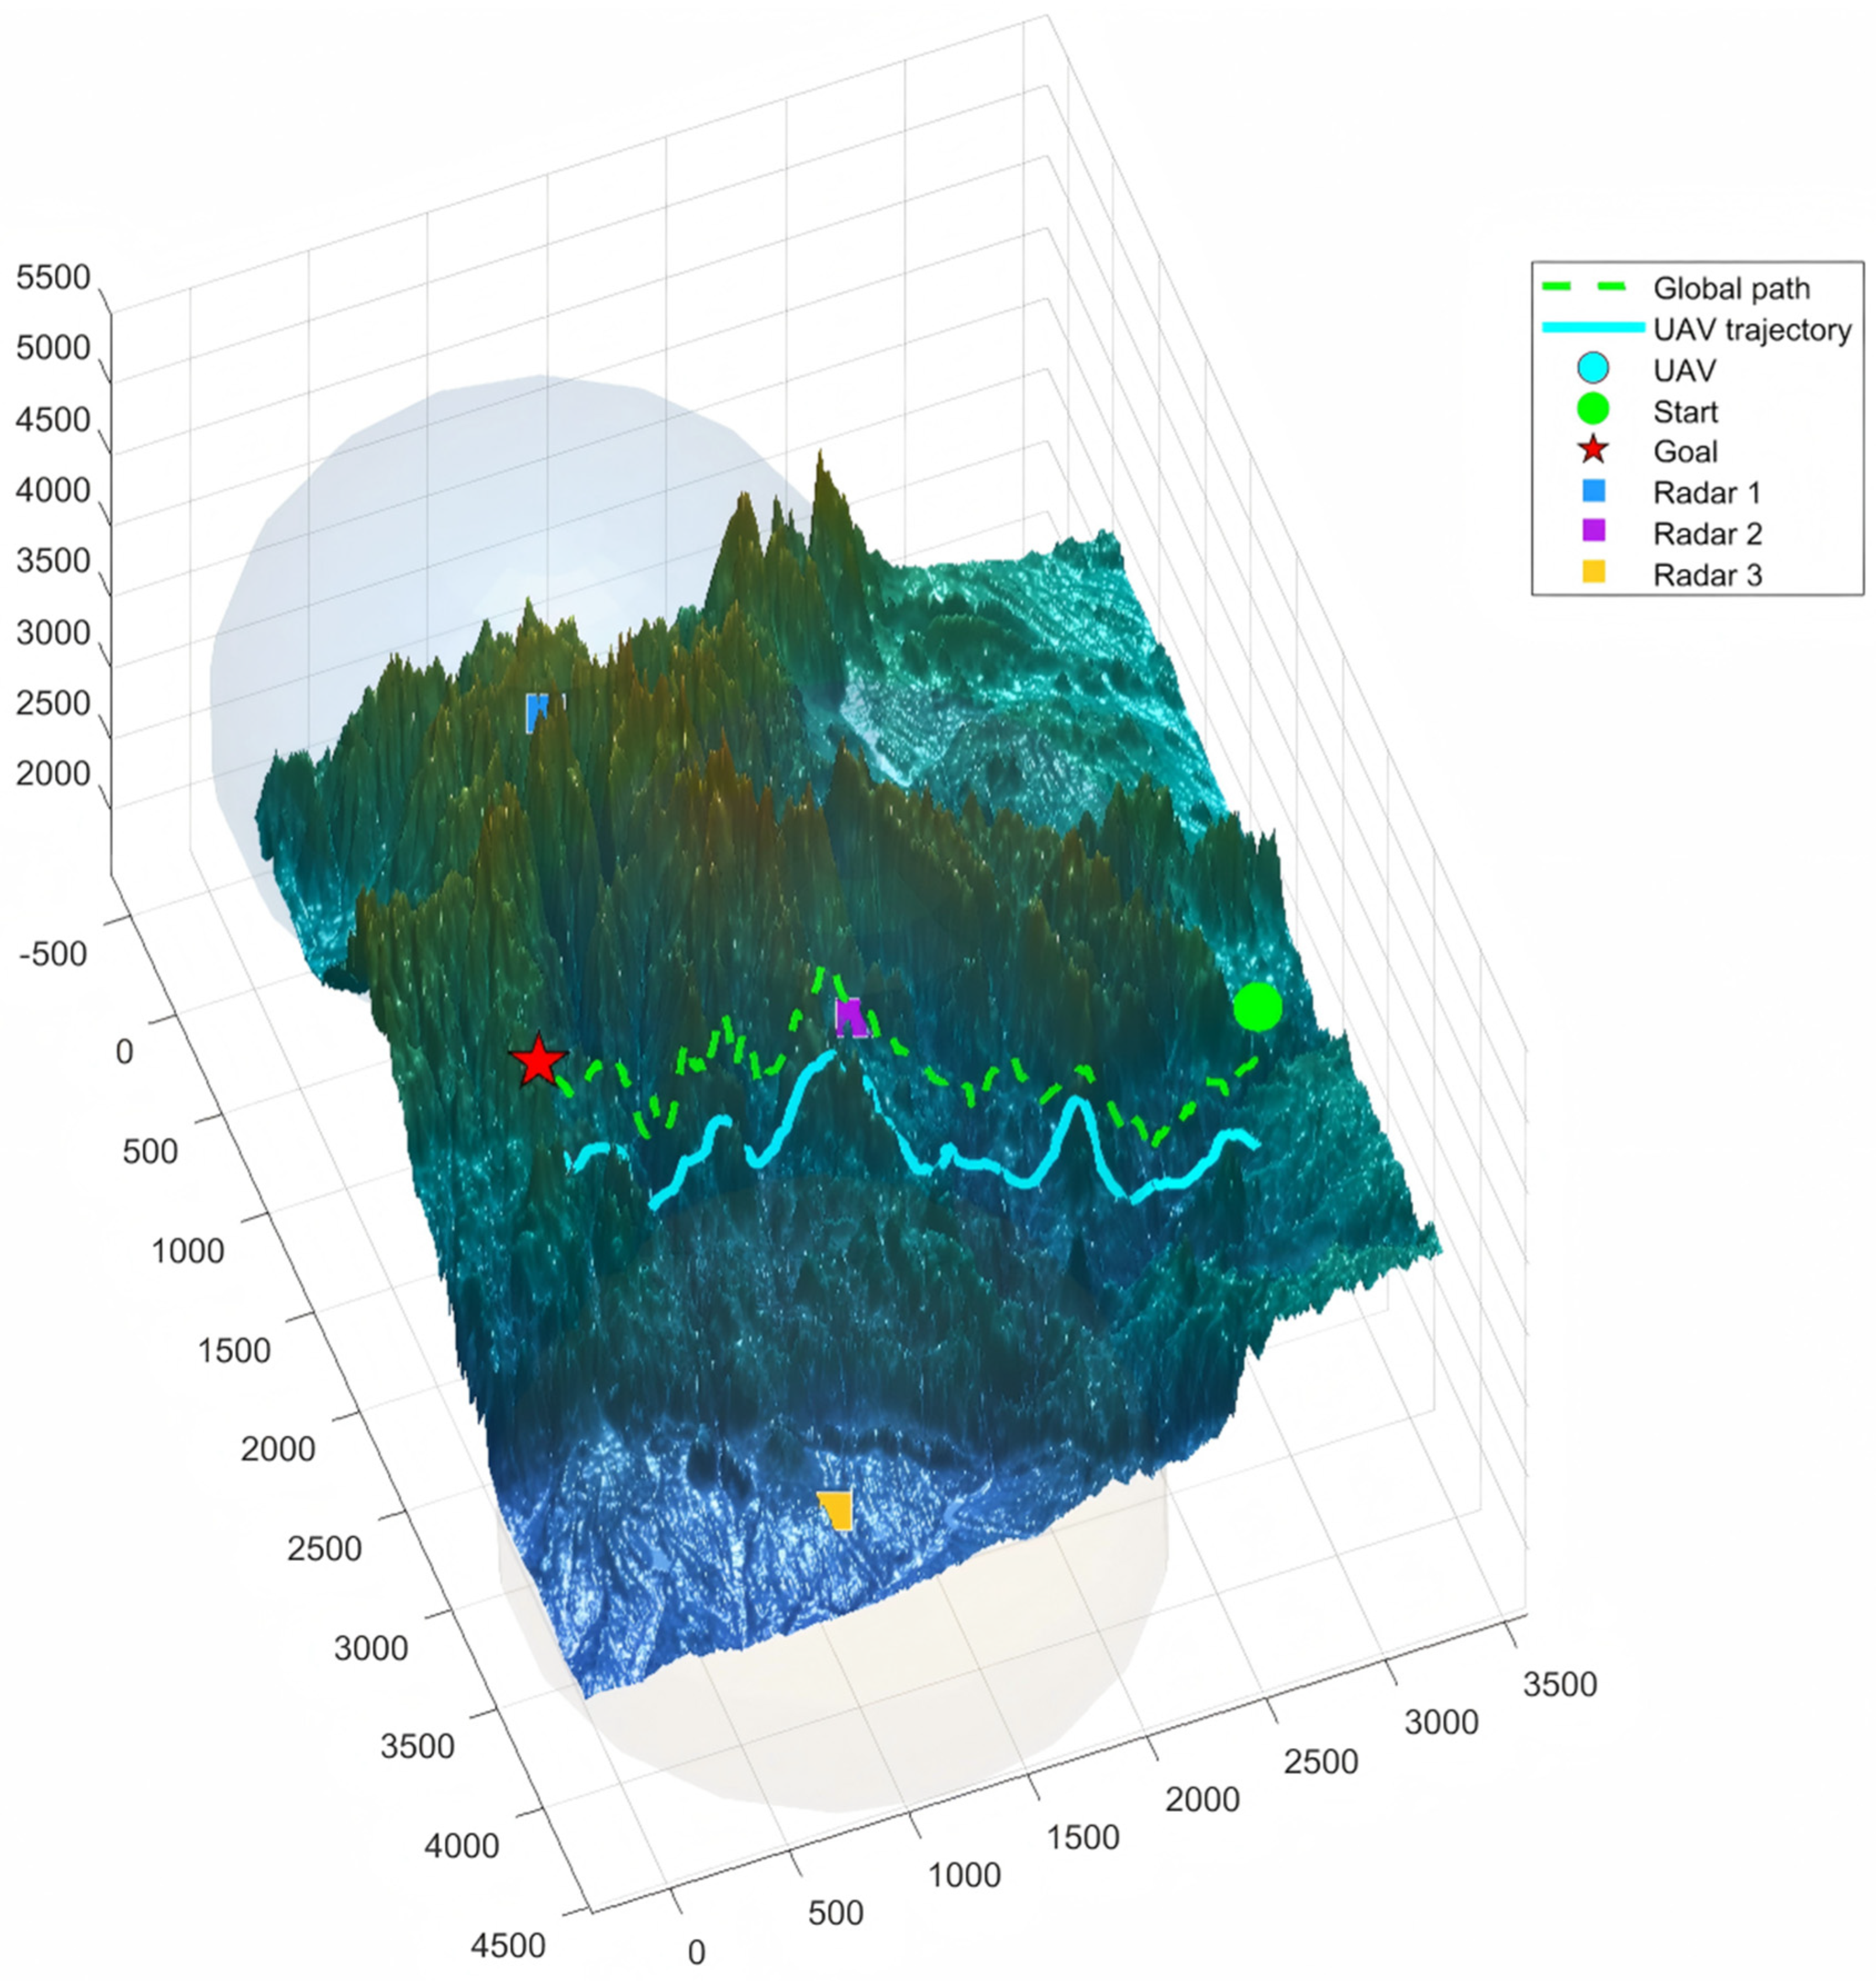
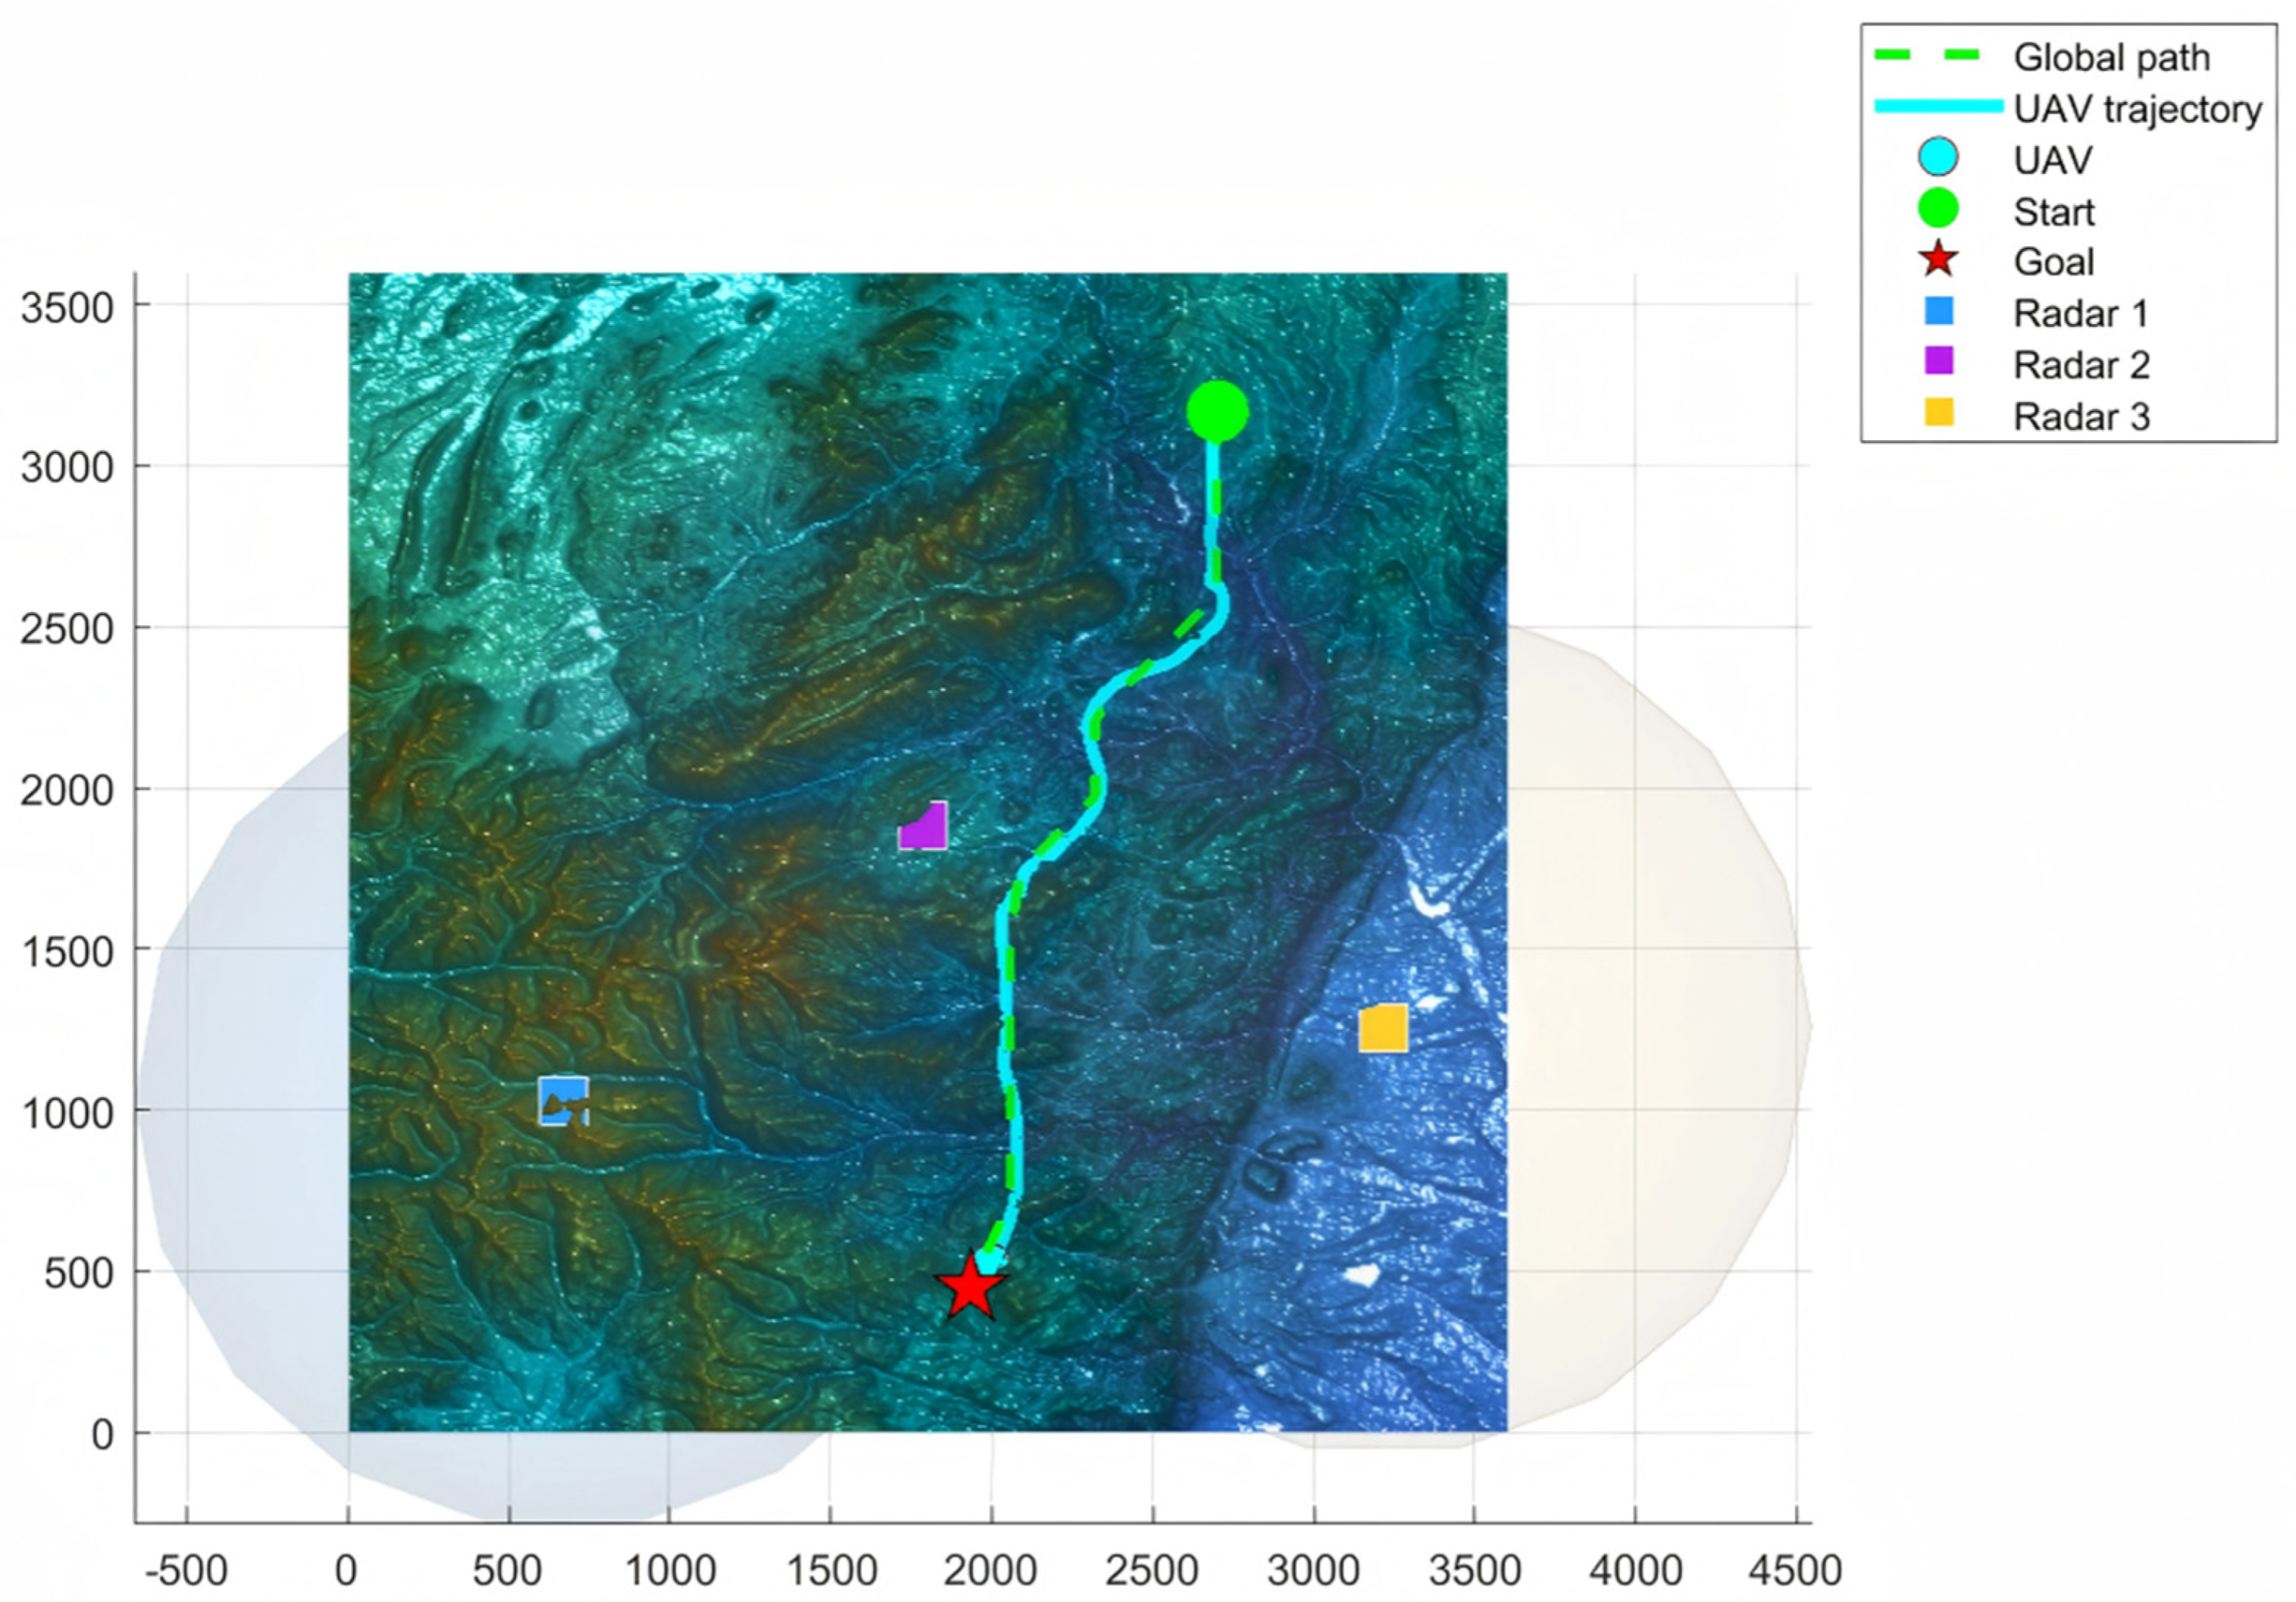
Figure 16 and
Figure 17 present the two-dimensional and three-dimensional views, respectively. By comparing
Figure 16 and
Figure 15, it can be seen that the overall trajectory mainly follows the global route planned by Risk-A*, guiding the UAV through the globally low-risk (green) region. In addition, near Radar 3, online adjustments are performed by the MPC algorithm to account for radar motion, ensuring that the UAV is not successfully detected by hostile radars during the mission.
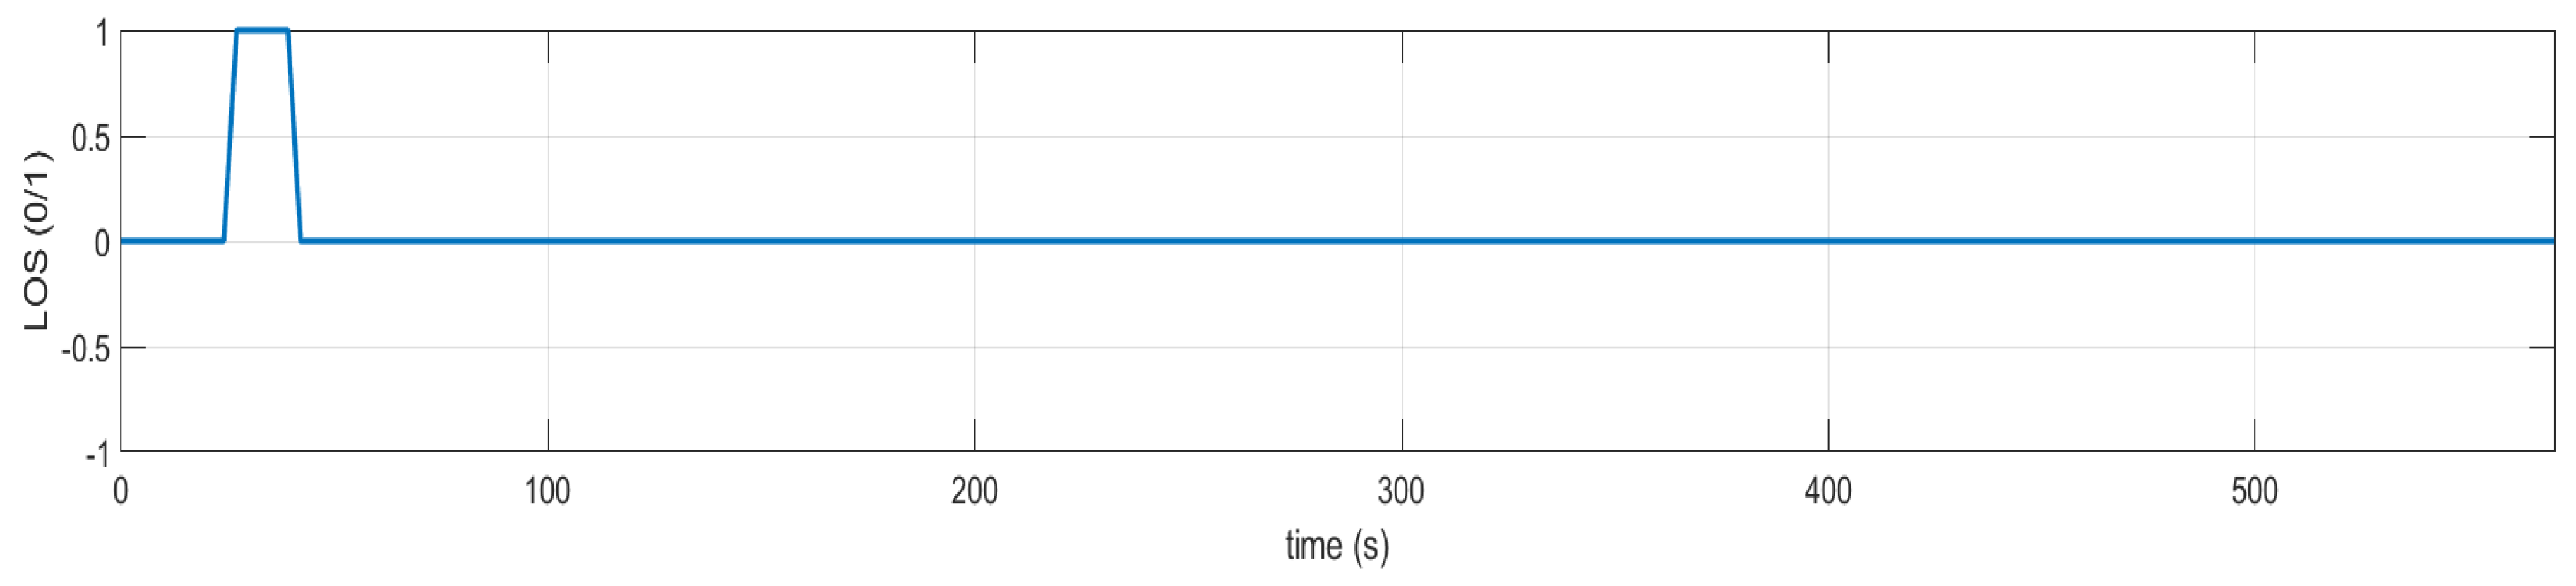
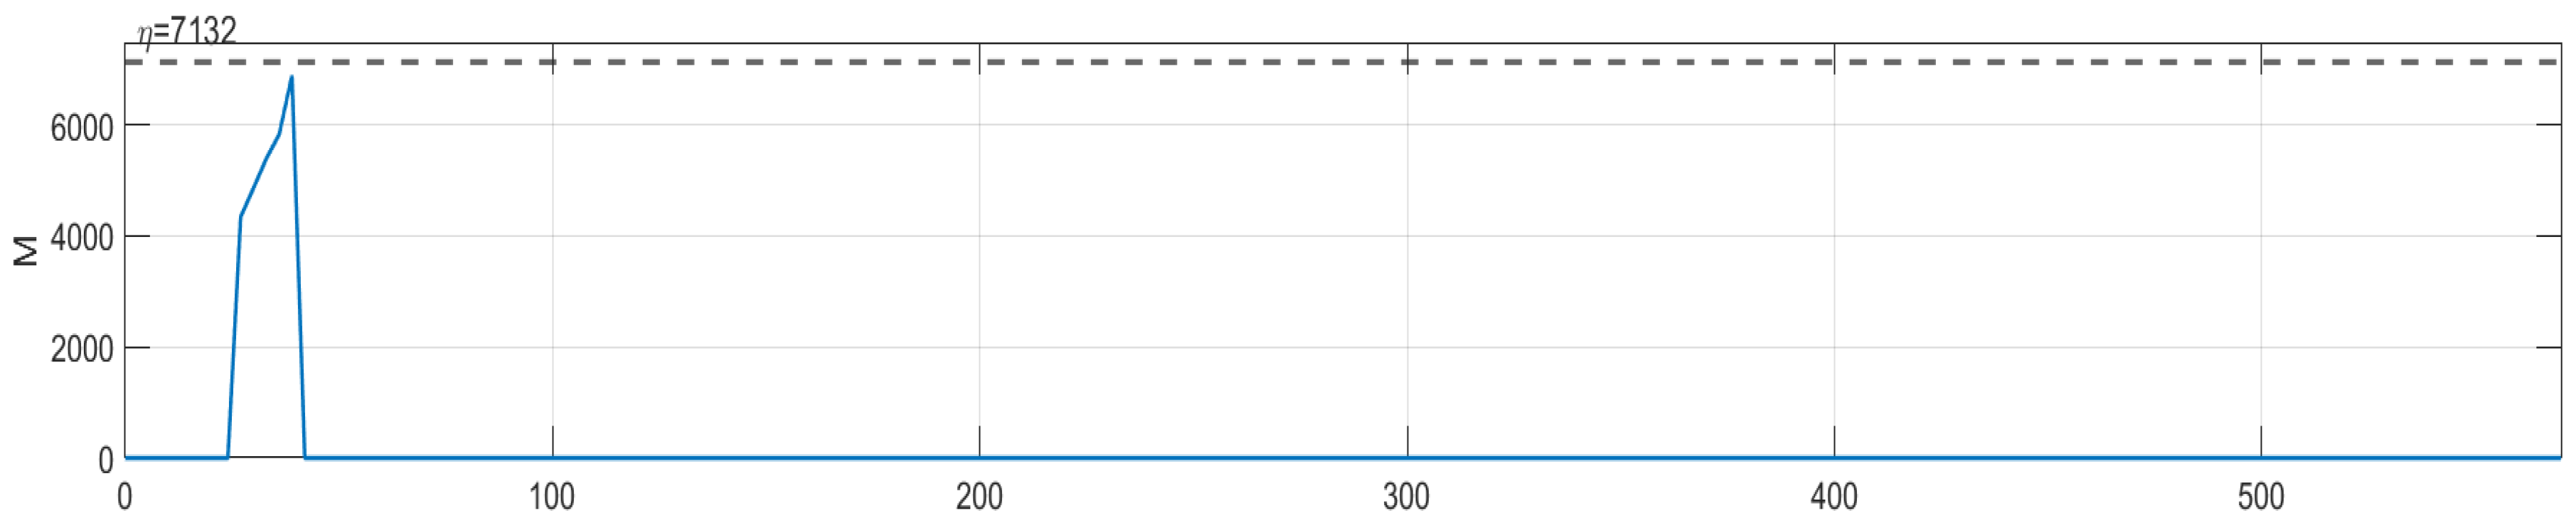
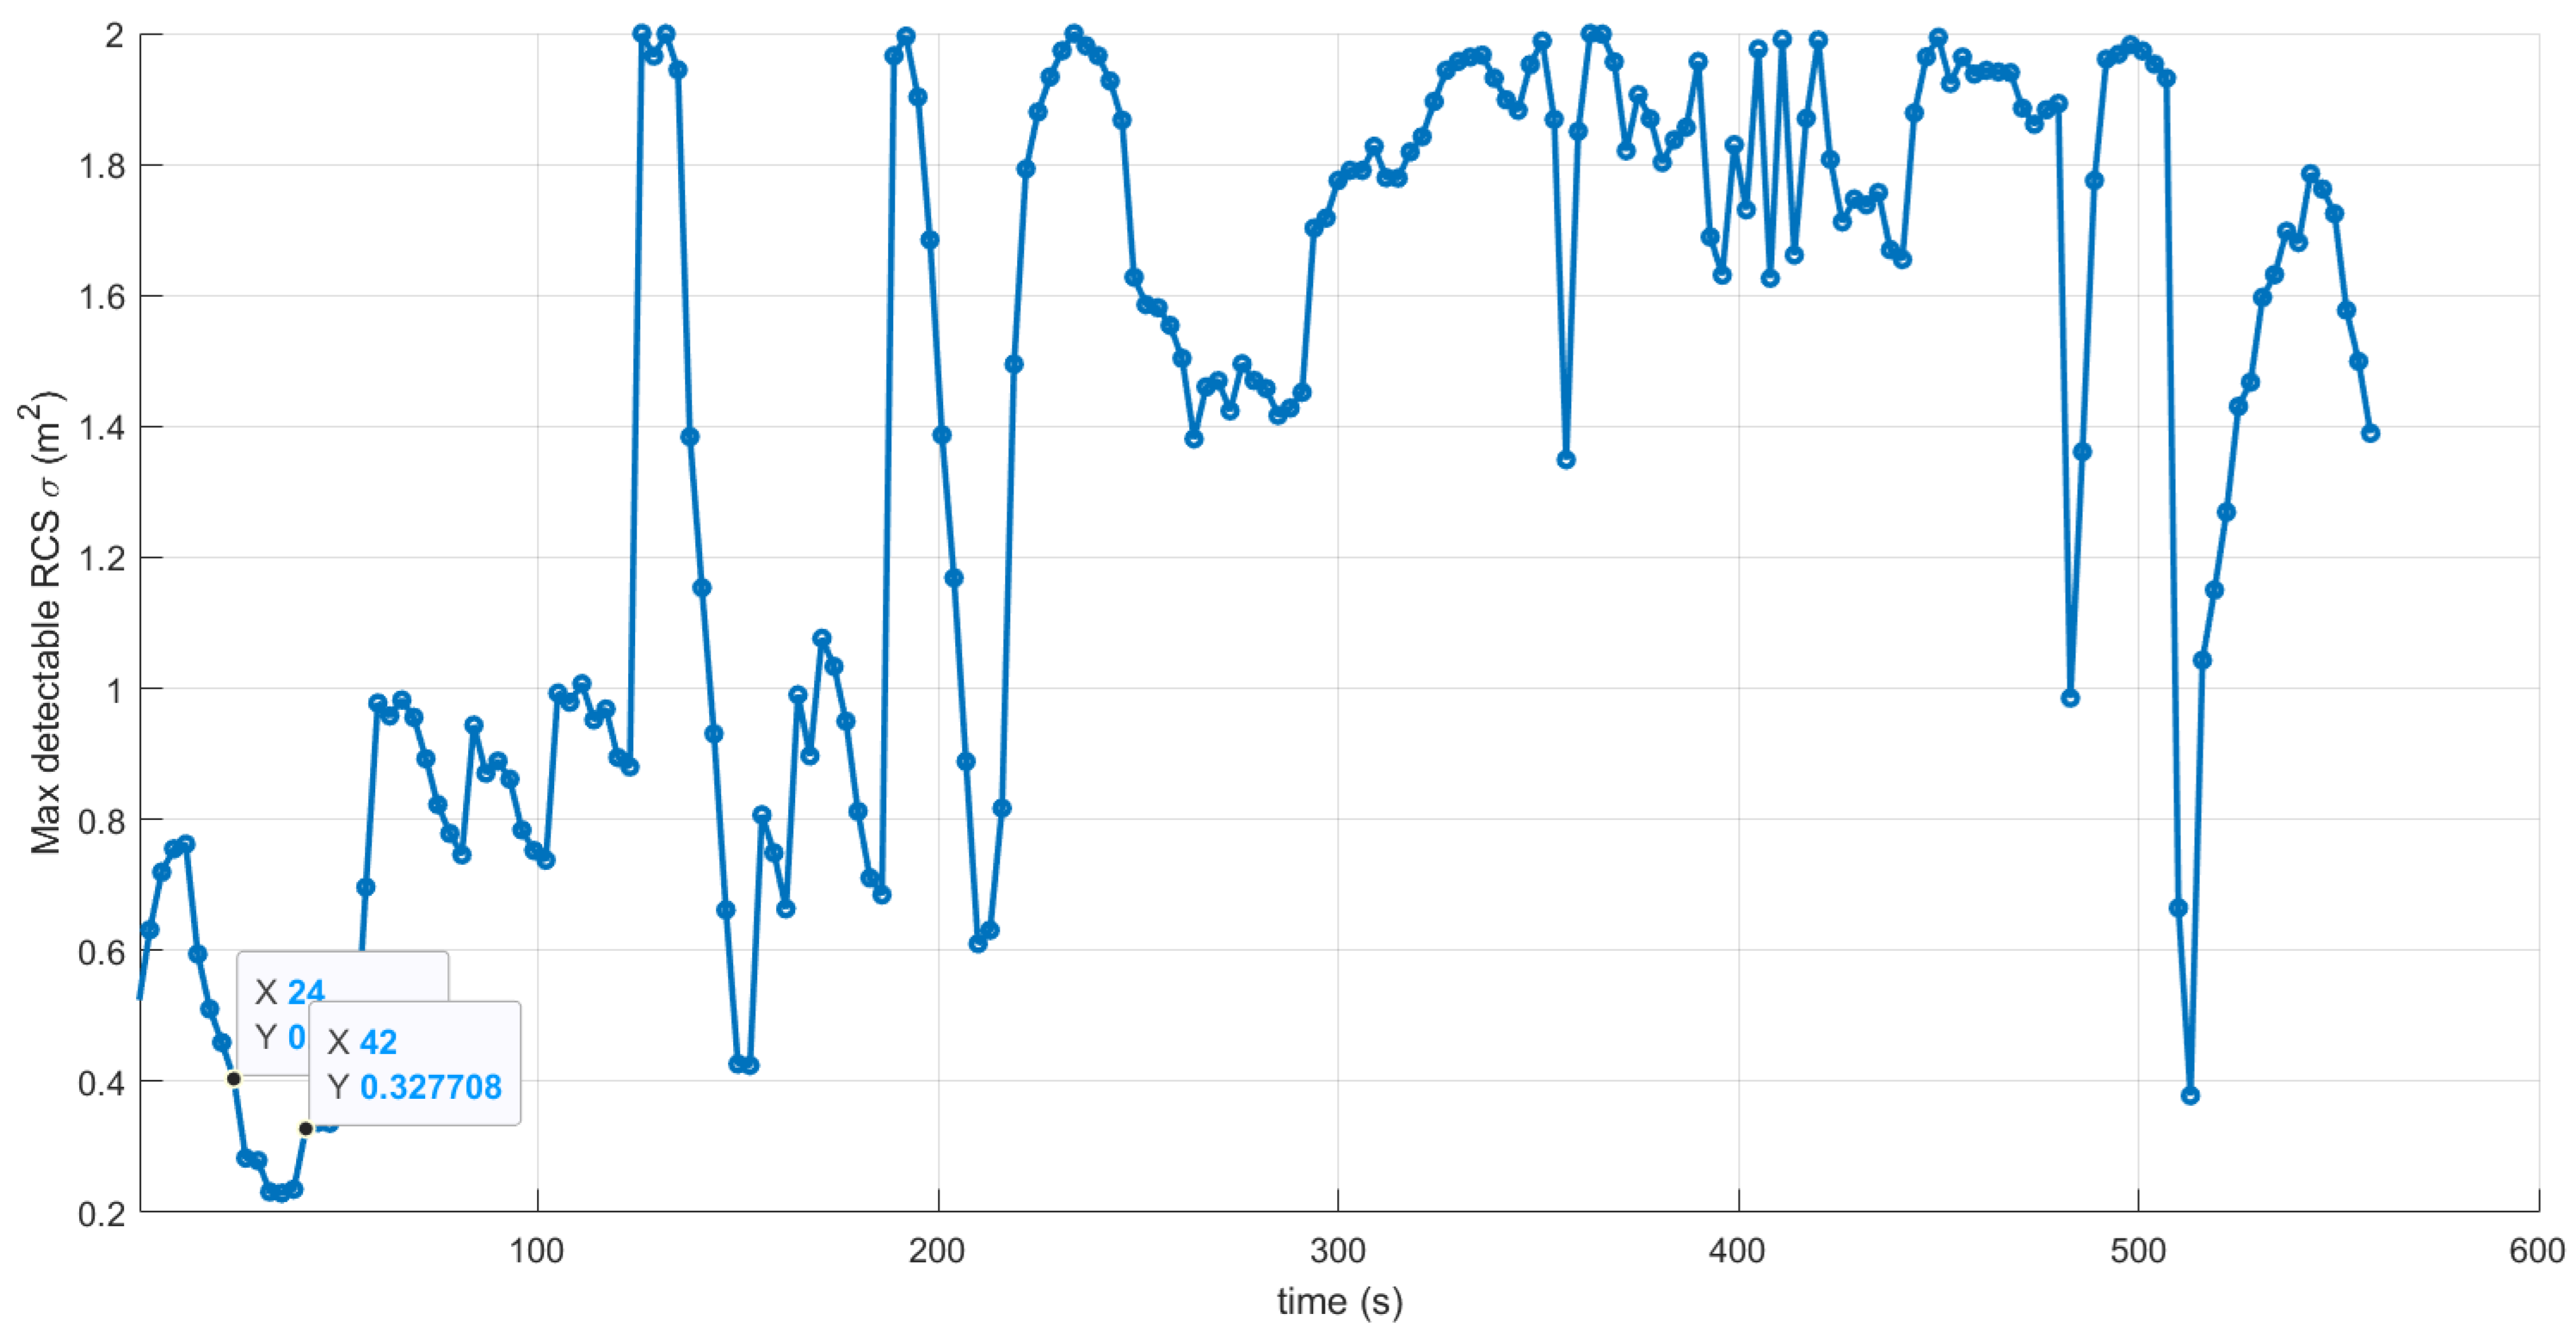
The results obtained by the Risk-A*-MPC framework in Scenario 2 are illustrated above. The LOS condition over the entire flight is analyzed. As shown in
Figure 18, the global LOS equals 1 only during a short interval (24–42 s). As shown in
Figure 19, the global effective detectability
never exceeds the prescribed threshold
; this indicates that the entire flight can be completed with zero exposure.
Under identical conditions, 50 independent trials are conducted, and the statistical results are summarized as follows.
Pairwise comparisons were conducted between Risk-A*-MPC and each baseline-MPC variant using two-sided Welch’s t-tests for T, L, and LOS-visible duration. SR, nexp, and exposed-trial Texp were reported descriptively and were not included in the Welch’s t-test analysis; p-values smaller than 0.001 are reported as p < 0.001.
4.2.6. Comparative Result Analysis
Table 1 and
Table 2 present the descriptive comparison between the proposed method and three baseline-MPC variants under identical terrain conditions and the same radar detection model, where T, L, and LOS-visible duration are reported as mean ± SD with 95% CIs, whereas exposed-trial T
exp is reported as mean ± SD only over exposed trials;
Table 3 reports the pairwise Welch’s
t-test results for T, L, and LOS-visible duration. Overall, the proposed Risk-A* + MPC framework achieves a more favorable balance between safety (success rate SR and exposure time T
exp) and mission efficiency (total flight time T and path length L). In addition to the mean values, the standard deviations and 95% CIs reported in
Table 1 and
Table 2 further reveal the stability, uncertainty range, and consistency of the different methods across repeated independent trials.
- (1)
Safety comparison
From the mission success rate SR and the exposed-trial statistics, it can be observed that the proposed Risk-A*-MPC framework consistently achieves SR = 1 under the prescribed detection threshold , with in both scenarios. The baseline-MPC variants are evaluated with the same local MPC executor, the same UAV kinematic constraints, the same radar detection model, and the same exposure-time evaluator. Their nonzero exposure times should therefore not be interpreted as being caused by different MPC constraints or different detection thresholds. Instead, they arise because Theta*, D* Lite, and RRT* generate geometry-oriented reference paths that do not explicitly construct a spatio-temporal detection-feasible corridor. Consequently, these reference paths may guide the UAV close to, or even into, regions where the detection-risk margin is too small. Under the finite prediction horizon, bounded turn/climb rates, and finite control-candidate set of the common MPC executor, the local planner may then have no detection-feasible rollout available. In such cases, the executed trajectory is counted as a safety failure when the same range-gating, LOS, and radar-equation threshold tests indicate threshold exceedance.
The descriptive results in
Table 1 and
Table 2 and the pairwise Welch’s
t-test results in
Table 3 support this interpretation. In both scenarios, the proposed Risk-A*-MPC framework descriptively attains the highest SR and yields
, indicating that no detection-threshold exceedance occurred in the 50 repeated executions. This indicates that the zero-exposure property is achieved consistently rather than occasionally. The pairwise Welch’s
t-test results further quantify the differences in the all-trial continuous metrics, while exposure safety is compared descriptively using SR, n
exp, and exposed-trial T
exp. By comparison, the baseline-MPC variants produce exposed trials and nonzero exposed-trial T
exp values, showing that detection-threshold exceedance still occurs in some repeated executions. In Scenario 1, Theta*-MPC, D* Lite-MPC, and RRT*-MPC yield T
exp values of 20.3 ± 8.7 s, 14.6 ± 6.3 s, and 18.9 ± 9.5 s, respectively, while in Scenario 2 the corresponding values are 12.4 ± 5.8 s, 8.7 ± 4.1 s, and 11.5 ± 5.4 s. These results indicate that the main advantage of the proposed method lies in maintaining local MPC feasibility by providing a globally structured detection-risk-aware corridor, rather than merely relying on the same local MPC module to recover from an unfavorable global reference path.
- (2)
Efficiency comparison
In terms of total flight time T and path length L, the proposed method incurs a moderate and controlled increase in mission time and path length to ensure safety. Compared with other methods, the global reference path generated by Risk-A* tends to exploit terrain masking to traverse low-risk regions. Although this strategy increases geometric path length and flight time in the tested scenarios, it significantly reduces exposure time. This demonstrates that the performance gain primarily stems from risk modeling and safe corridor selection, rather than simply detouring by excessively increasing path length.
The mean ± SD statistics provide additional insight into this trade-off. In Scenario 1, the proposed method yields T = 555.0 ± 11.2 s and L = 92,500 ± 1580 m, whereas in Scenario 2 it yields T = 588.6 ± 13.4 s and L = 98,102 ± 1740 m. These values are slightly larger than those of Theta*-MPC, D* Lite-MPC, and RRT*-MPC in terms of the mean, which is consistent with the original observation that the proposed framework may require somewhat longer flight time and path length in order to maintain a safer low-risk corridor. However, the standard deviations of T and L for the proposed method remain comparatively small in both scenarios. In particular, the variability of T and L is lower than that of Theta*-MPC and RRT*-MPC, and is also smaller than that of D* Lite-MPC. Therefore, the slightly increased mean flight time and path length should be interpreted as a controlled and repeatable safety-oriented trade-off, rather than as unstable planning behavior caused by occasional extreme detours.
- (3)
Relationship between LOS duration and exposure
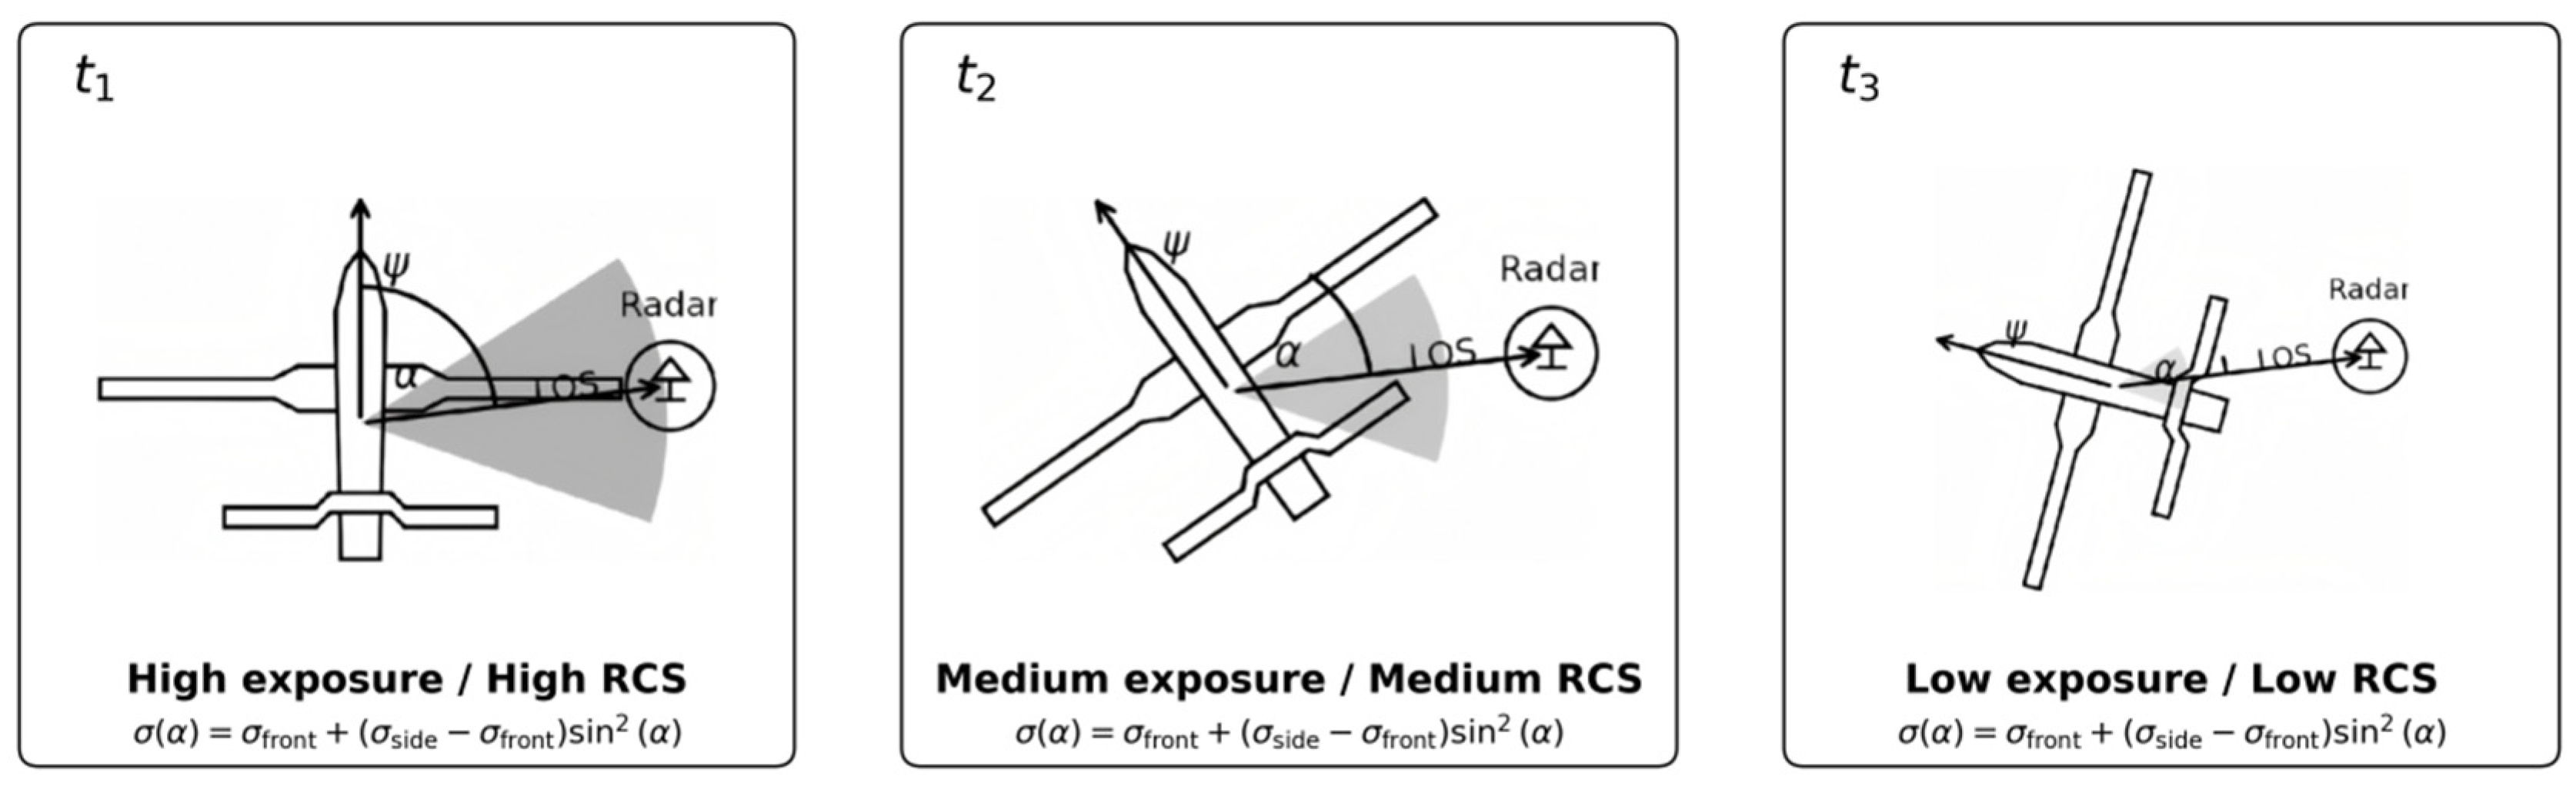
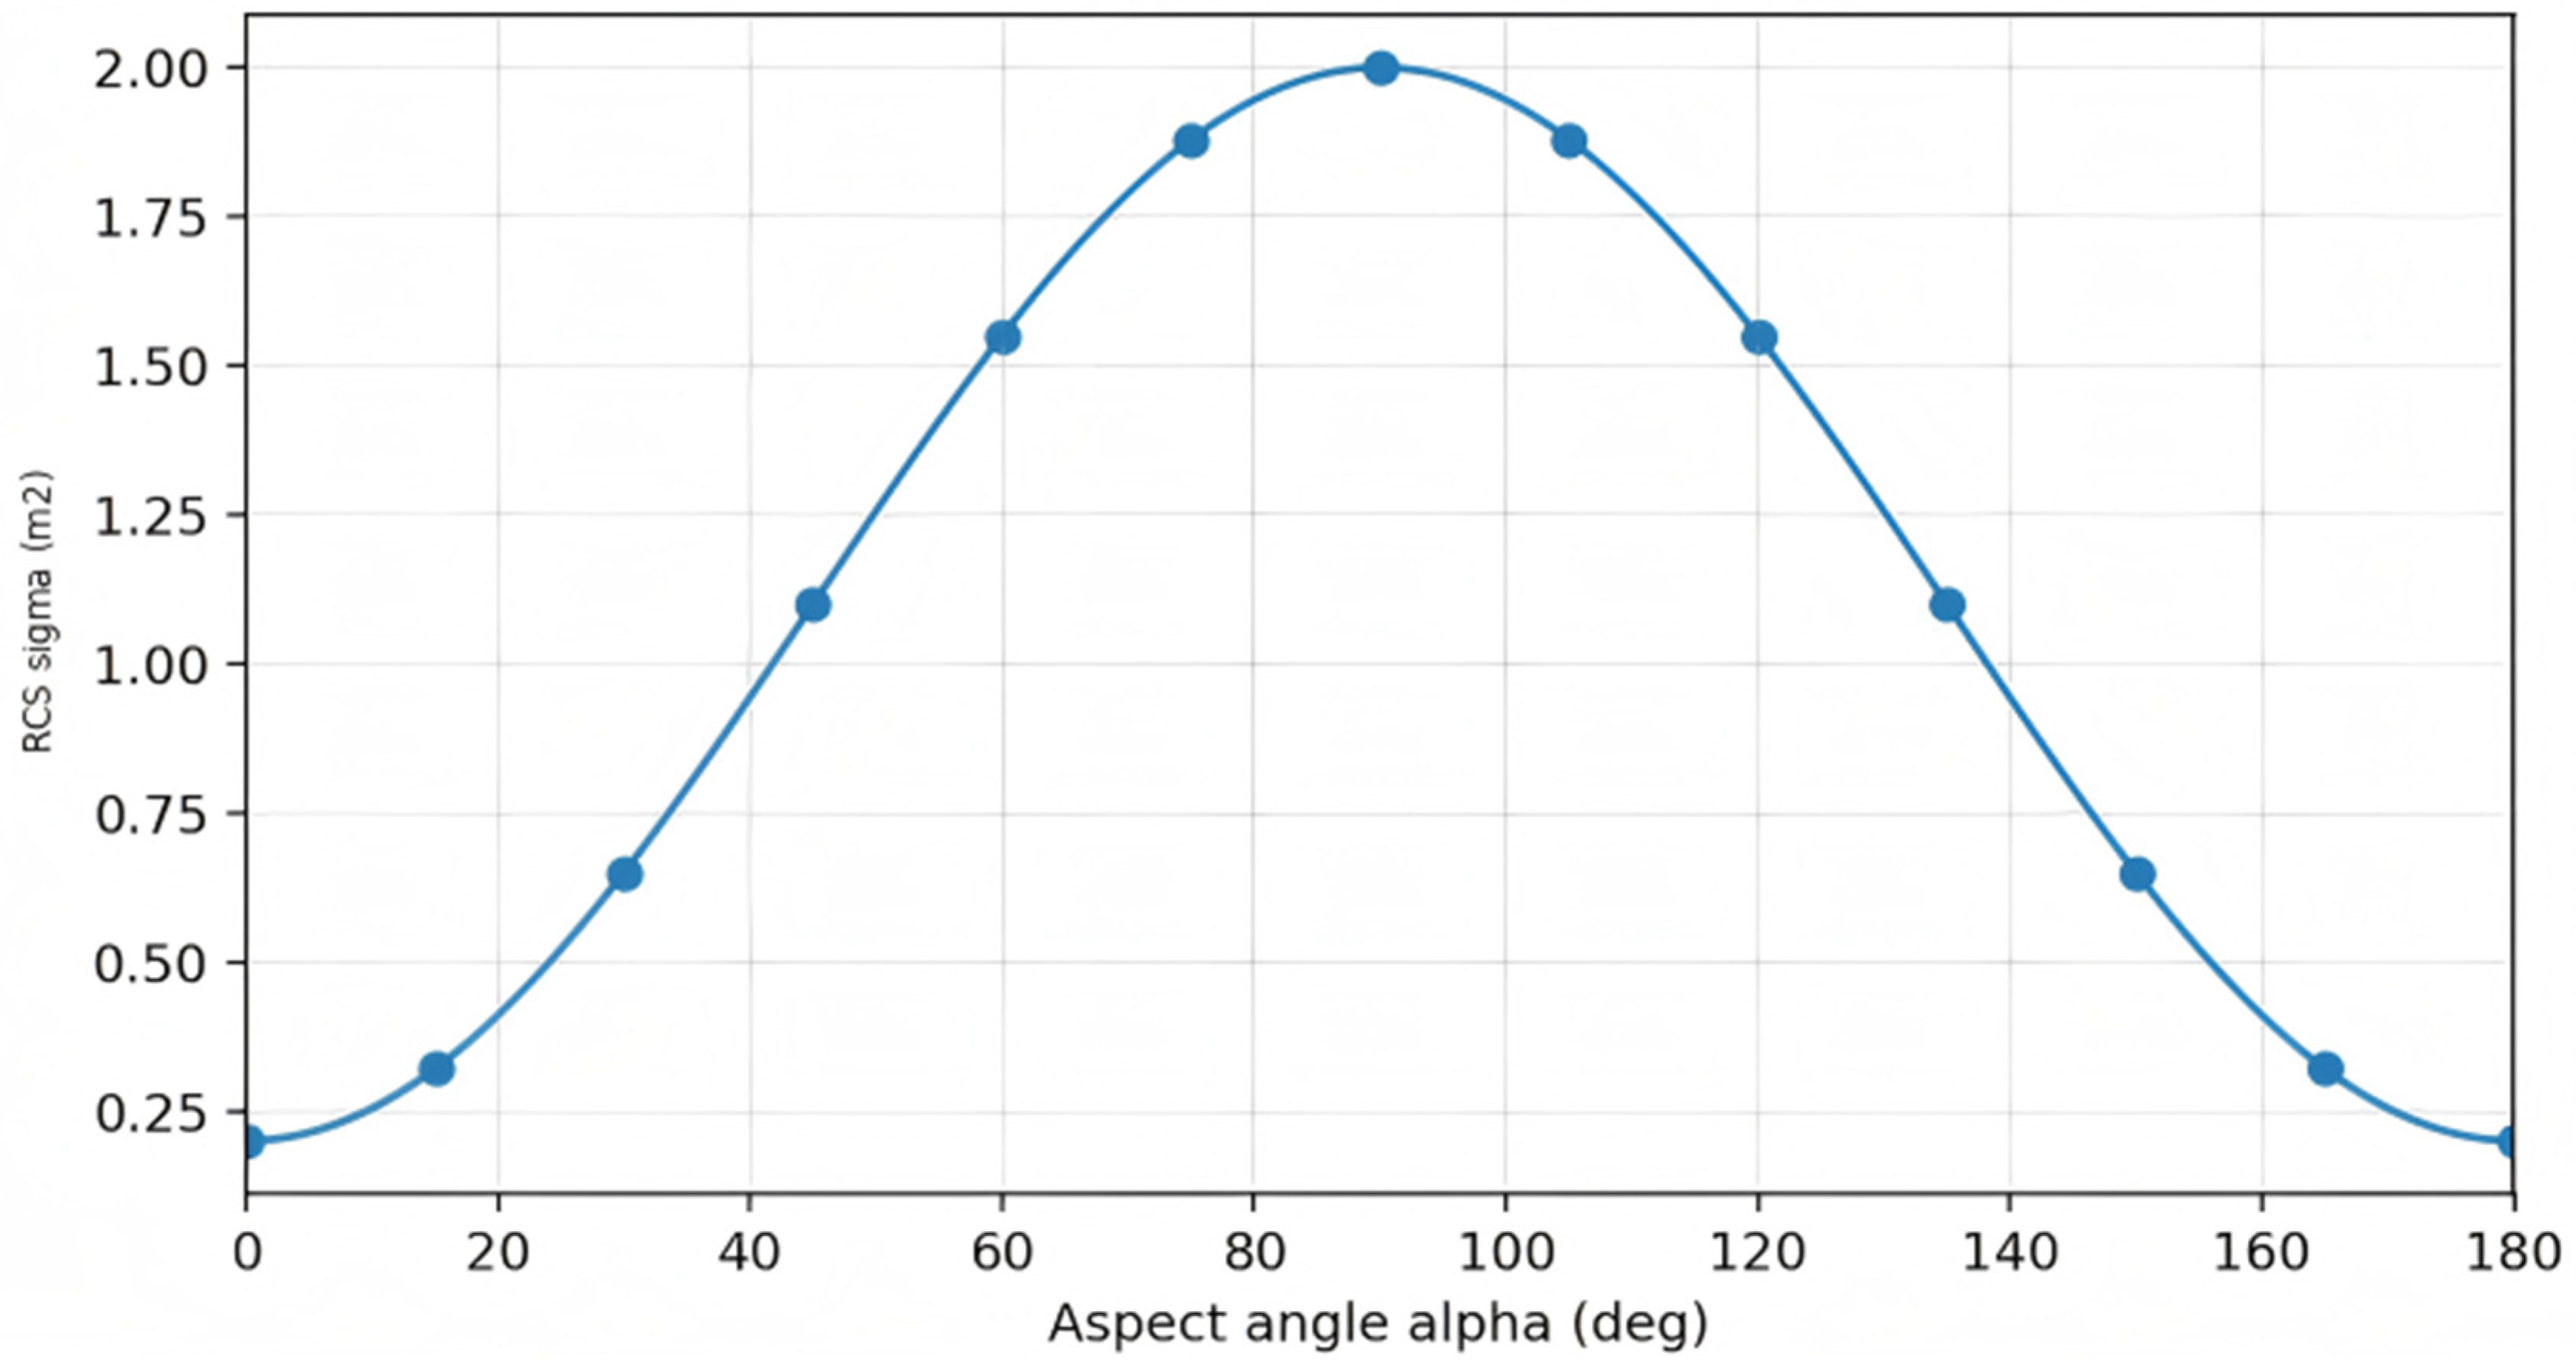
It is important to emphasize that is a necessary condition for successful detection, but it does not inevitably lead to the detectability metric exceeding the threshold . Exposure is jointly determined by the range gating condition and the detectability threshold. Therefore, the occurrence of short intervals with without exposure is not contradictory. The decisive factor is whether the effective detectability exceeds . Through the combination of a globally safe reference path and local dynamic refinement, the proposed method ensures that even when short-duration events occur, the UAV can dynamically adjust its RCS to maintain , thereby achieving a significant reduction in Texp.
The LOS-visible duration results in
Table 1 and
Table 2, together with the corresponding
p-values in
Table 3, further clarify this point. In Scenario 1, the proposed method has a LOS-visible duration of 26.9 ± 3.0 s [26.0, 27.8]. It is significantly lower than that of Theta*-MPC and RRT*-MPC (
p = 0.023 and
p = 0.002, respectively), while it is only numerically lower than that of D* Lite-MPC and the difference is not statistically significant (
p = 0.077). In Scenario 2, the proposed method has a LOS-visible duration of 18.0 ± 4.3 s [16.8, 19.2], which is significantly lower than that of Theta*-MPC (
p < 0.001), whereas the differences relative to D* Lite-MPC and RRT*-MPC are not statistically significant (
p = 0.526 and
p = 0.226, respectively). More importantly, despite the occurrence of LOS-visible intervals, the proposed framework yields n
exp = 0 in both scenarios, indicating that no detection-threshold exceedance occurs in the 50 repeated executions. This confirms that LOS visibility alone does not determine exposure; instead, exposure is jointly determined by LOS visibility, range gating, detection-threshold exceedance, and heading-dependent RCS modulation.
Computational time was further evaluated to support the real-time execution claim for the online MPC layer. Runtime was measured as wall-clock time in MATLAB R2023b on a workstation equipped with an Intel Core i9-14900HX CPU and 64 GB RAM running Windows 11; no MATLAB parallel pool was used during the online MPC timing test. MPC solve time was recorded at every control cycle in the two main terrain-zone scenarios, and the reported statistics were computed over all MPC updates from the 50 repeated executions in each scenario. In Scenario 1, the mean MPC solve time was 0.286 ± 0.092 s, the 95th percentile was 0.472 s, and the maximum solve time was 0.684 s. In Scenario 2, the mean MPC solve time was 0.331 ± 0.108 s, the 95th percentile was 0.548 s, and the maximum solve time was 0.812 s. No deadline violation was observed among the recorded MPC updates in either main terrain-zone scenario, because every recorded solve time remained below the 3 s control update period. These results demonstrate that the online MPC layer satisfies the real-time execution requirement on the tested computational platform for the two main terrain-zone scenarios. The initial global Risk-A* planning and lower-frequency replanning are outside the 3 s local MPC update loop and are therefore considered separately from the online MPC real-time budget. In summary, although mainstream baselines exhibit advantages in geometric optimality and replanning efficiency, they are not specifically designed for the “hard detection constraint + dynamic radar detectability” scenario studied in this work. The proposed Risk-A*-MPC framework integrates a “global low-risk corridor” with “local hard-constrained correction,” achieving higher observed mission success rates, fewer exposed trials, lower exposed-trial exposure levels, and more stable performance across repeated trials while avoiding excessive online computational burden, thereby validating the overall superiority of the framework.