Article

Designing C2 Links for BVLOS UAS Operations


1
Faculty of EEMCS, Delft University of Technology, 2628 CD Delft, The Netherlands
2
AnyWi Technologies, 2312 NR Leiden, The Netherlands
*
Author to whom correspondence should be addressed.
Drones 2026, 10(6), 397; https://doi.org/10.3390/drones10060397
Submission received: 17 March 2026 / Revised: 6 May 2026 / Accepted: 18 May 2026 / Published: 22 May 2026
(This article belongs to the Section Drone Communications)

Highlights

What are the main findings?
  • Defining and achieving bandwidth and latency performance metrics that cater for Beyond Visual Line-of-Sight (BVLOS) drone operations is a complex study that requires the design and analysis of telecommunication networks, avionics hardware, and embedded software.
  • MBSE (Model-Based Systems Engineering) effectively consolidates complex requirements from EU regulators, telecom providers, and drone operators, facilitating focused design and regulatory alignment.
What are the implications of the main findings?
  • Key attributable metrics for BVLOS operations can be targeted to specific stakeholders and provide realistic goals for long-term sustainable planning as BVLOS operations transit from rural to urban areas in Europe.
  • The MBSE method is shown to provide a baseline design that is iterative and translatable to similar operational scenarios, and which will enhance speed of regulatory approval while taking into account the new and evolving safety and technical requirements being made by EU regulatory bodies.

Abstract

Unmanned Aircraft Systems (UAS) have seen a significant growth in civilian space over the past decade. The number one ranked challenge in UAS operations in Europe is regulatory obstacles such as the Specific Operations Risk Assessment (SORA) for 2023–2025. Existing approaches have focused on individual technical solutions (radio technologies, redundancy schemes, or cryptographic protections) or on high-level safety analysis, but have not integrated regulatory compliance, risk assessment, and repeatable systems models that directly support SORA artifact generation and rapid adaptation across BVLOS operational contexts. Thus, the current state-of-the-art apparatus lacks a systematic Model-Based Systems Engineering (MBSE) approach that can cater to Command and Control (C2) data-link design for Beyond Visual Line-of-Sight (BVLOS) missions. In this work, we propose an MBSE methodology designed to assist engineers in designing a C2 data link for BVLOS drone operations that complies with SORA regulations in the Netherlands and Europe. To validate the use of MBSE in a wide range of complex drone operations, we demonstrate how subtle modifications in the proposed engineering models can be made without any major overhaul of new SORA applications, and this is validate these changes through laboratory software tests and simulations.

1. Introduction

Unmanned Aircraft Systems (UAS) have seen a significant growth in terms of their presence in civilian space during the past decade. This rising trend stems primarily from the use of drones in Visual Line-of-Sight (VLOS) drone operations. In the period 2023–2024, an independent think tank reported a record 35.7% increase in the number of VLOS drone operations conducted in Europe and, notably, an increase of 1.1 to 1.8 million flight hours [1]. However, within the same period of time, there has only been an increase of 2.6% for Beyond Visual Line-of-Sight (BVLOS) drone operations, recording a stagnant 0.4 million flight hours. Various think tank reports have published survey results in which UAS operators have consistently identified regulatory obstacles as the primary challenge to conducting BVLOS drone operations in 2023 and 2024 [2]. This trend is reaffirmed in the latest think tank report [3]. In particular, operators largely attribute this challenge to the stringent Specific Operations Risk Assessment (SORA) framework, which was adopted by the European Aviation Safety Agency (EASA) in 2019.
SORA was created to bridge the gap that exists between commercially available drones in the Open Category, and manned aircraft in the Certified Category [4]. This gap is labeled as the Specific Category where heavy unmanned drones can fly high or far. More specifically, the Specific Category refers to drones that weigh more than 4 kg, or fly above 120 m, or are situated more than 2 km away from the UAS operator. EASA adopted the latest version of SORA 2.5 in 2024. We have been able to understand why SORA is not easy to adhere to by studying the methodology related to the ten steps of SORA that UAS operators have had to comply with [5], as shown in Table 1.
Researchers have successfully applied the SORA framework for VLOS flight operations with Specific Assurance Integrity Level (SAIL) I and II, which typically relate to VLOS drone operations [6]. However, the bottleneck to pushing the approval limits to higher SAIL III and IV is understandable, as BVLOS operations are more complex in nature as they require more automation [7]. With a basic understanding of the ten SORA steps, we need to define specific and measurable goals to help UAS operators conduct BVLOS drone operations.
The goals will specifically address the technical capability of command and control (C2) data links that enable drone operations BVLOS. Reliable and secure C2 data links are the backbone of drone operations BVLOS, ensuring continuous command, telemetry and contingency control when the pilot cannot see the aircraft. Without robust and redundant links, safety, regulatory compliance and mission effectiveness cannot be guaranteed. Although several solutions have been published to guide UAS operators in applying for SORA [8,9], solutions only go as far as to address the operational parameters under which the drone will operate [10]. However, none of the literature has proposed a means for regulators to understand how drones are designed to comply with the OSO at the required robustness levels.
To this end, this paper aims to bridge the gap between the regulators’ limited technical knowledge and the motivation for engineers to meet user needs in the design of a BVLOS data-link system by using Model-Based Systems Engineering (MBSE), which to the best of the author’s knowledge has not been addressed before. Hence, the contributions of this paper are as follows.
  • Develop an MBSE guide for designing C2 data links in BVLOS operations.
  • Link architecture diagram connectors to system functions, enabling their use in regulatory verification.
  • Align software verification tests with requirements tied to validated MBSE objectives.
The remainder of the paper is organized as follows. Section 2 describes the state-of-the-art background on SORA and Network Communication. Section 3 introduces the proposed approach that looks at system engineering models. The corresponding test and validation results are presented in Section 4. Our conclusions are derived in Section 5.

2. Preliminaries

2.1. Specific Operations Risk Assessment (SORA)

Building on the introduction, SORA is a methodology and regulatory framework developed by the Joint Authorities for Rulemaking on Unmanned Systems (JARUS) to assess and mitigate risks for specific UAS operations that fall outside of the low-risk open category [4]. SORA provides a structured process to evaluate the operation, identify hazards, quantify risk, and define technical and operational mitigation to ensure that the remaining risk is acceptable to the competent authority. SORA is necessary because many UAS missions inherently involve flight operations over people, or flights in complex airspace that carry heterogeneous and context-dependent risks that generic rules cannot cover. SORA gives regulators and operators a common and repeatable way to demonstrate that a proposed operation has been evaluated and that appropriate safeguards are in place to protect people, property, and other airspace users. The purpose of SORA is to deliver a consistent and transparent risk-assessment process that consenting authorities can use to evaluate non-standard UAS operations.
By defining the technical, operational, human factor, and procedural mitigation necessary to reduce risks to acceptable levels, SORA creates a clear pathway for complex or higher-risk missions to gain regulatory approval. In doing so, it also supports the safe expansion of UAS activities and promotes harmonization across jurisdictions by offering a commonly accepted framework for assessing operational risk. However, the issue of complying with SORA regulations is a huge and complex problem that has plagued UAS operators for more than two consecutive years [2]. SORA regulation is a common problem given its widespread adoption by 28 EASA member states [11], as shown in Table 2. SORA is a common problem because its detailed, case-by-case risk assessments and stringent mitigation requirements create substantial technical, administrative and regulatory burdens for UAS operators across many jurisdictions. This requires us to analyze how successful UAS operators in EASA member states have been in their attempt to apply for SORA approvals. Based on Table 2, we can observe the five countries with the highest number of Operational Authorization (OA) applications; a mandatory requirement to fly under SORA. They are Poland, Germany, the Czech Republic, the Netherlands, and France.
We have also been able to learn that to bypass OA, operators in countries such as Spain, Romania, Denmark, and Lithuania could have aligned their operations with Standard Scenarios (STS) [12], as seen by their exceptionally high number of STS applications to avoid the failure to apply for OA. This can be seen in the last column in Table 2, where the ratio of STS to OA is greater than ten. According to EASA, an operator does not need to apply for an OA to perform an operation covered by an STS [5]. Currently, there are two STS cases. The first published scenario is for drones that weigh less than 25 kg and fly VLOS operations below 120 m in urban or suburban environments. The second published scenario applies to the same drones that fly up to 1 km or 2 km if an airspace observer is deployed to provide an additional 1 km VLOS. In addition to analyzing the number of STS applications, the number of OA applications also needs further analysis to determine the complexity of non-standard operations. Based on two of the top five countries (namely, Poland and the Czech Republic), we witness that a vast majority of registered drone operators hold basic A1/A2/A3 authorizations for Open Category flights. The number of these A1/A2/A3 applications nearly equals the total number of registered operators, so only a small proportion pursue or successfully obtain the OA required for higher-risk, SORA-governed operations.
This pattern indicates a low uptake and success rate for SORA OA in these countries, with most operators remaining confined to lower risk visual line-of-sight activities. Hence, the Netherlands, being one of the three remaining countries in the top five (the others being Germany and France), is a suitable country of choice for which to research their drone operations tied to OA under the SORA framework.
Given that research has been done to help UAS operators complete each step of the SORA process, the current bottleneck in BVLOS operations lies in exceeding successfully attained SAIL levels I and II [13], which usually refer to VLOS operations where the drone can fly only within 1 to 2 km. As shown in Table 1, step 7 is a crucial stage in the SORA process because it evaluates the aggregate effectiveness of all proposed mitigation and supporting evidence. Consequently, achieving SAIL III and IV is particularly challenging in terms of convincing regulators to approve BVLOS applications. The critical shift from SAIL II to SAIL III raises the operational context to flights over more populated areas, which has increasing intrinsic risk, thus raising the bar for required mitigation. Meeting these higher SAIL levels is substantially more complex and costly for BVLOS because technical requirements demand extensive design, testing and validation. The need to produce rigorous, traceable design evidence, therefore, makes regulatory approval for SAIL III and IV much more difficult to achieve than for VLOS SAIL levels. MBSE can address this gap by generating the structured design artifacts and traceability necessary to substantiate the claims evaluated in step 7 and to support regulatory assessment for higher SAIL BVLOS operations. Regarding SAIL V and VI, we know that the Dutch Human Environment and Transport Inspectorate has yet to approve them at the time of publication, as such drones require an additional EASA Type Certificate (TC) [14], thus confirming that the current bottleneck in the SORA process is SAIL III and IV of the SORA process.
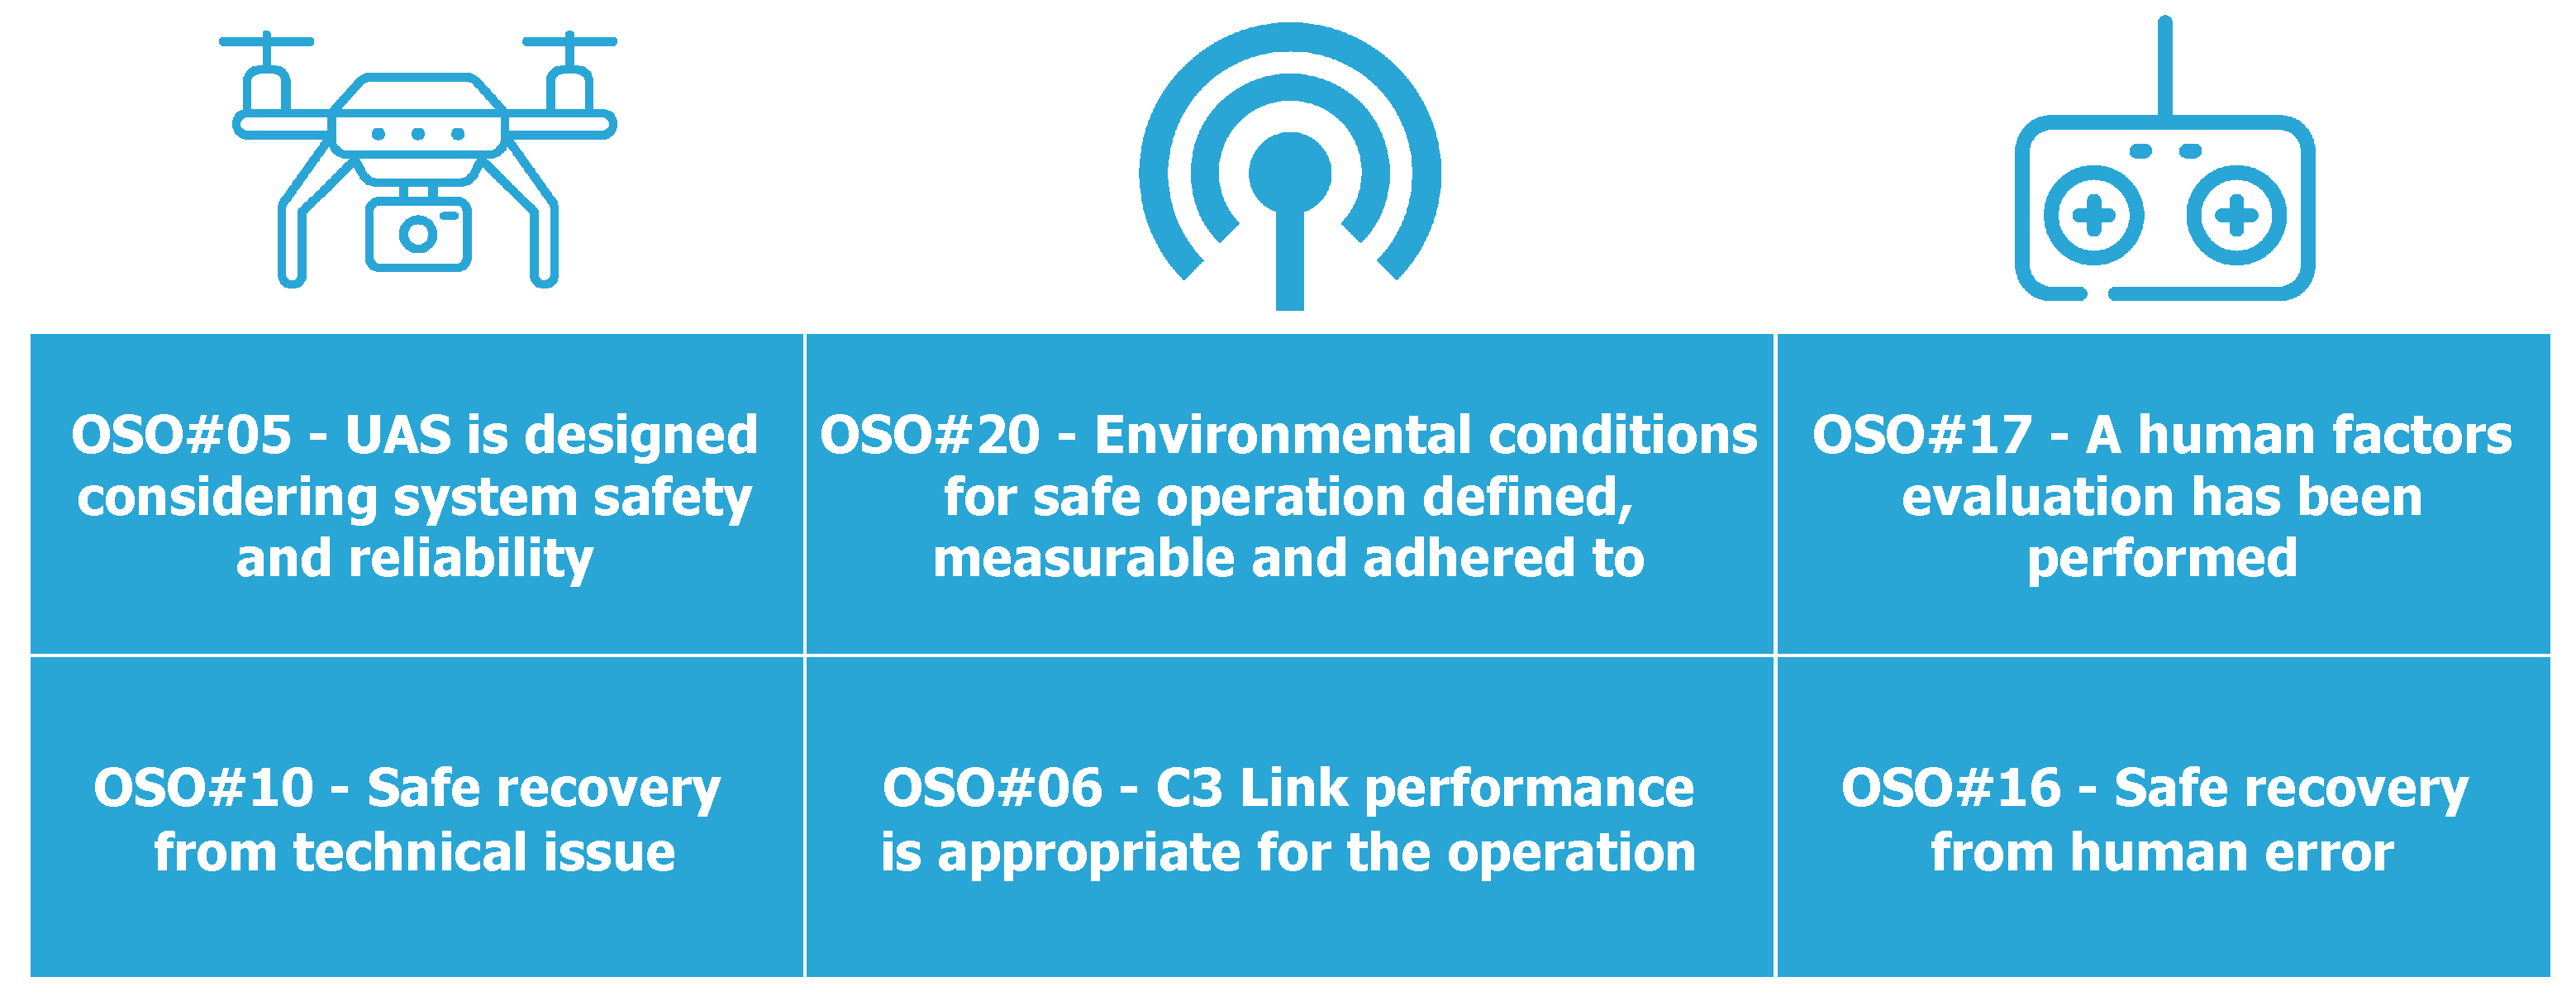
Although safety can be achieved when ground and air risks are within safe confinement in Step 8 of the SORA process, the key question lies in demonstrating the robustness levels required for the OSO that are necessary to achieve SAIL levels III and IV in step 9 of SORA. From an engineering perspective, we can examine the relevant Operational Safety Objectives (OSO) that address the necessary C2 data links needed for BVLOS operations, as reflected in Figure 1. These relevant OSO include OSO #05, which focuses on the design of the UAS with system safety and reliability in mind; OSO #06, which is the main objective that ensures that the performance of the C2 link is appropriate for operation [15]; OSO #10, which refers to the safe recovery of technical issues; OSO #16, which emphasizes the safe recovery of human error; OSO #17, which involves an evaluation of the human–machine interface to ensure its suitability for the mission; and OSO #20, which requires hardware to adhere to the environmental conditions defined and measured.
The six OSOs summarized in Figure 1 aim to address the risks related to C2 data links and to address the safety concerns of BVLOS drone operations. Having filtered a select list of OSO, the validation of the selected OSO that helps in the design process of the data link to satisfy the needs of the UAS operator will be shown in Section 3.1. There, we construct the operational diagram and the mission capability diagram [16] based on realistic operational activities and confirm the six OSO through the validation process. Although most of the discussion until now has focused around the topic of SORA and C2 data links, SORA has made a brief mention of the third “C” in addition to C2 data links. The third “C” refers to Communication [17], more specifically referring to the exchange of information between surrounding aviation platforms, including Air Traffic Control (ATC). The purpose of identifying all aviation platforms is to prevent collisions between manned aircraft and unmanned aircraft-like drones.
The system implemented in Europe since the beginning of 2024 is called Remote ID [18], and aims to identify all drones in Europe’s shared airspace. It transmits pertinent information from the drone. In addition to a drone’s unique identifier, location (latitude, longitude, and geometric altitude), velocity, and take-off location, Remote ID devices can send a timely emergency status to all compatible receivers when a drone malfunctions. Given that information from the Remote ID protocol can be transmitted with the aid of an additional module, this research can proceed to focus on the original intended design of the C2 data links and comply with previously identified objectives in SORA version 2.5.

2.2. Drone Communication Networks

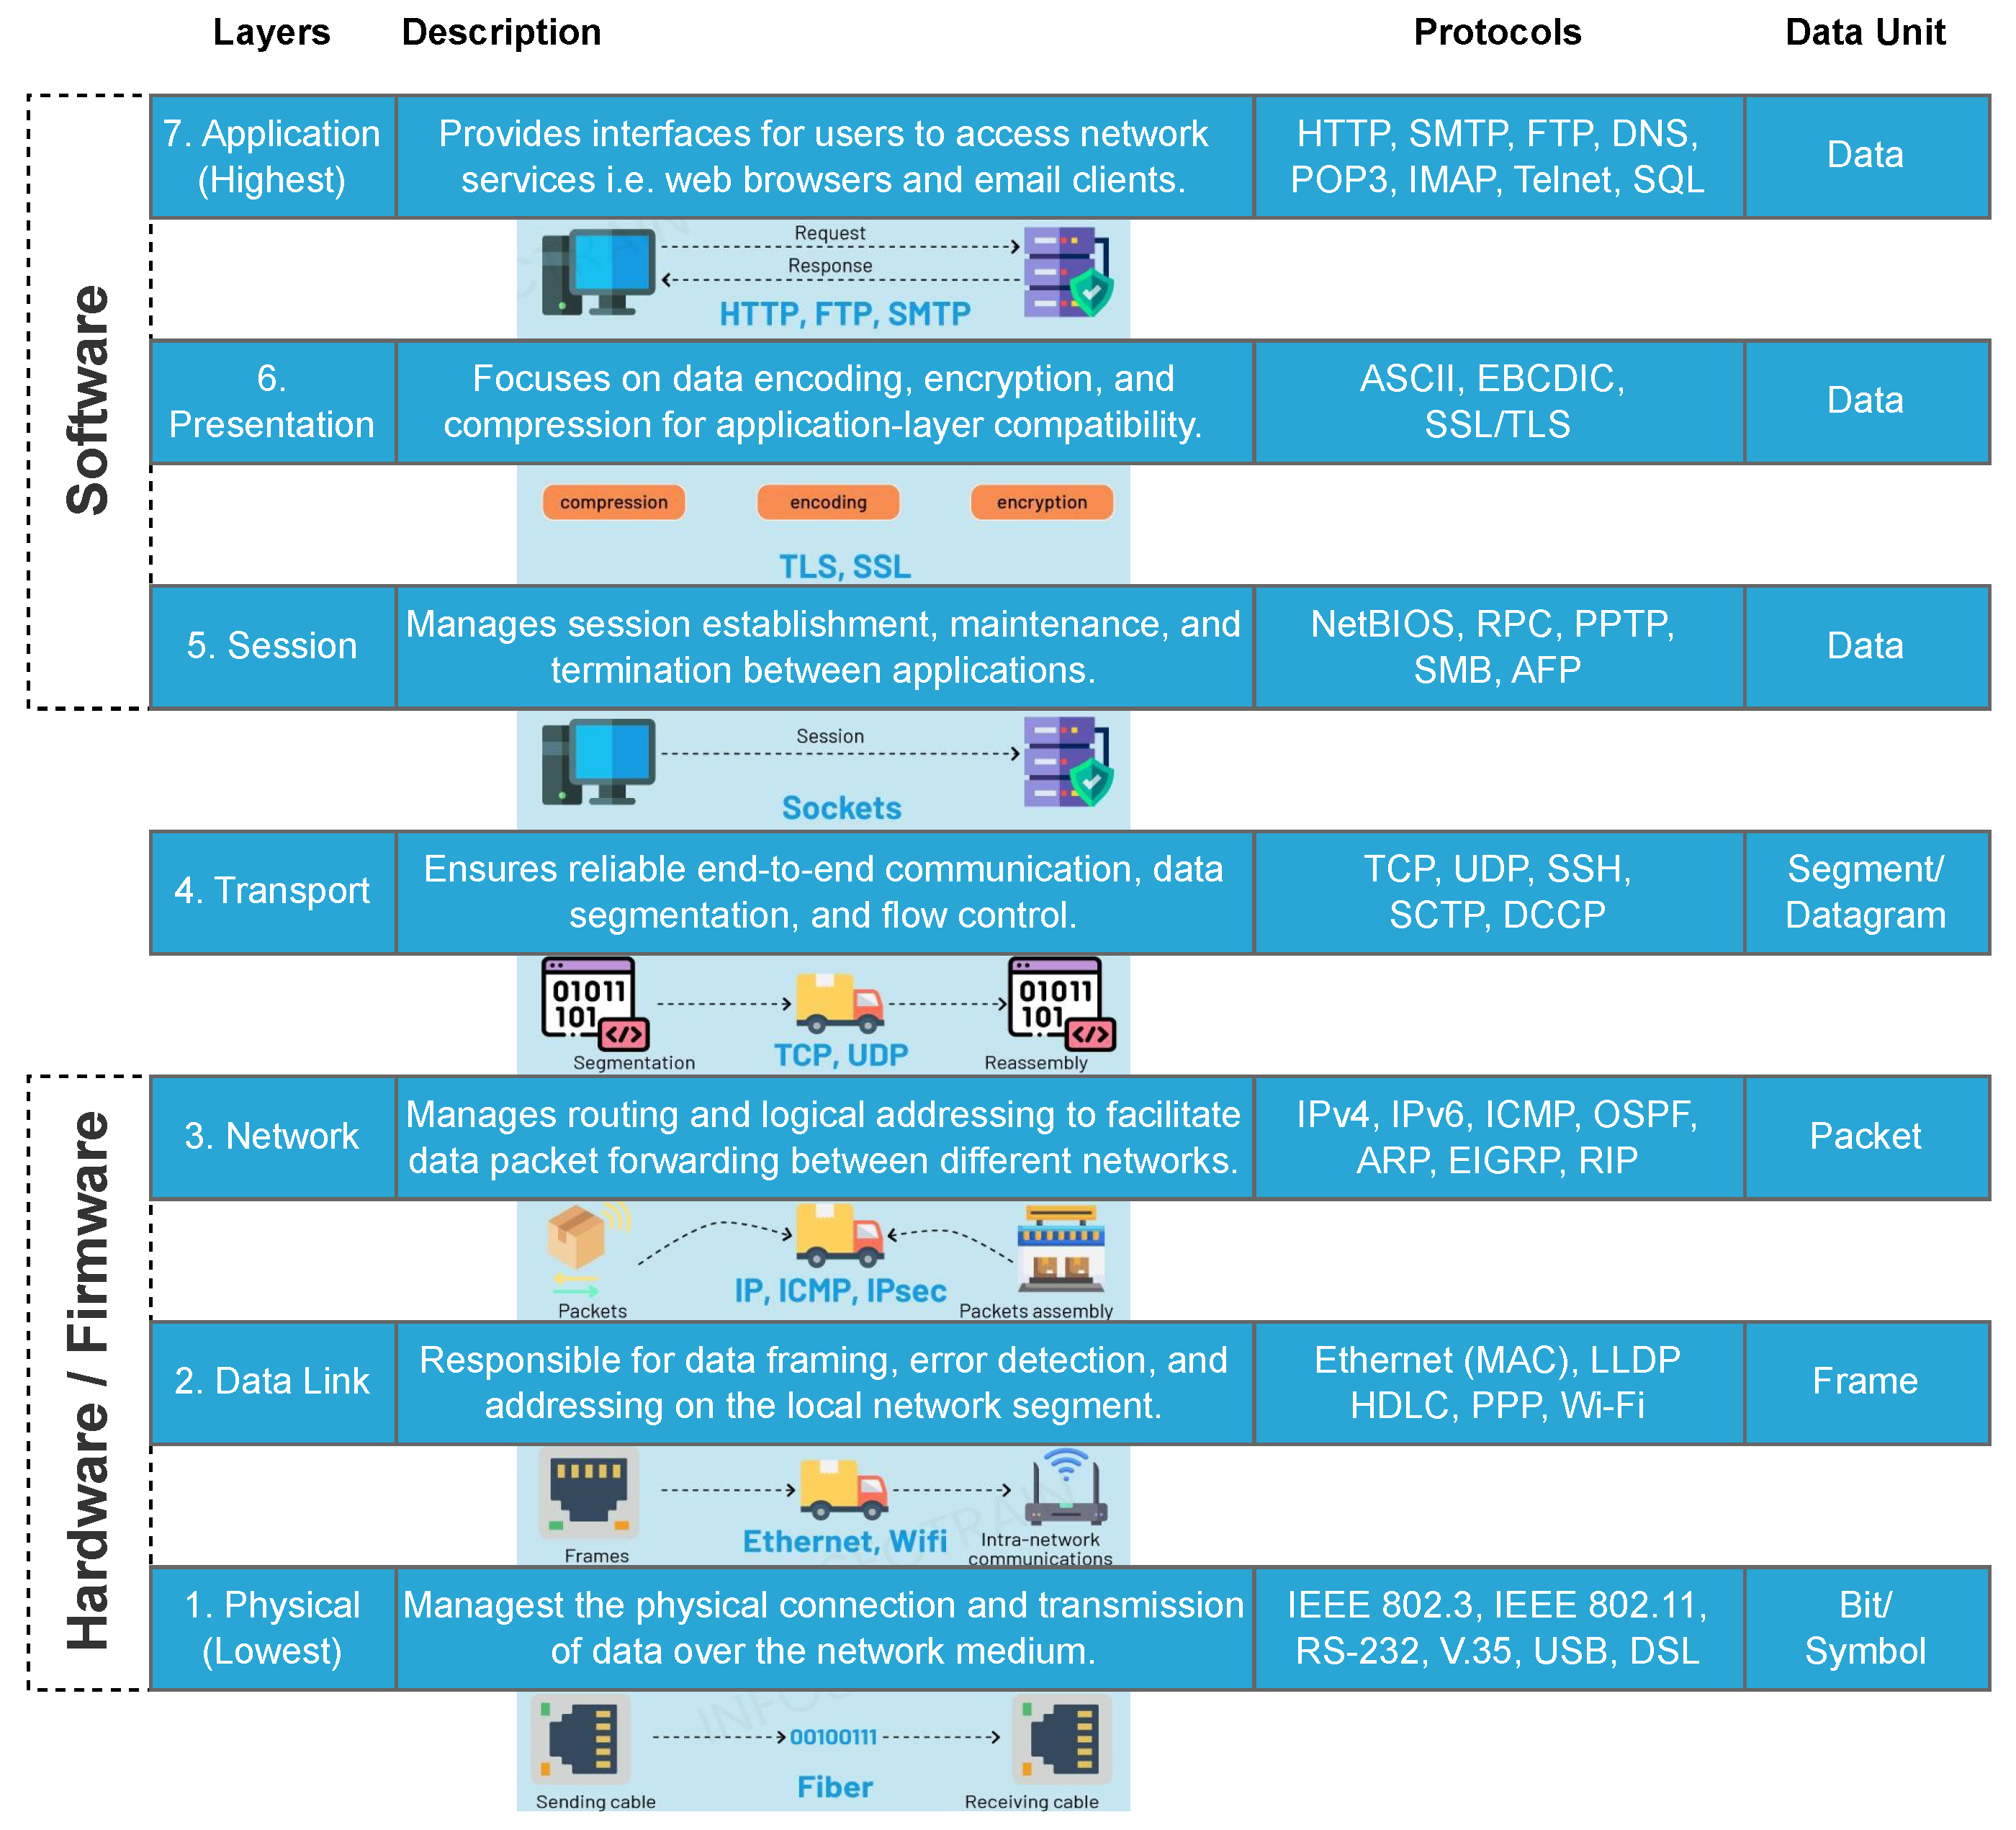
A deep understanding of SORA regulations must be complemented with a strong foundational knowledge of network communication in BVLOS drones. The Open Systems Interconnection (OSI) model is a technical framework to guide engineers in designing layered networks. OSI divides the data-exchange process into seven distinct layers, as seen in Figure 2. In this paper, the OSI layering is used as a design-decomposition aid to assign software functions to abstraction levels. It is not a claim that deployed UAS systems implement the full OSI stack as the TCP/IP model is the practically deployed reference for modern UAS communications.
However, in the context of drone communication networks, the OSI model provides a useful reference to understand how data are transmitted and received between the drone and the ground control station (GCS). Drone communication networks can be grouped into three main categories based on the technological services used in industry: unlicensed bands, cellular networks, and Satellite Communication (SatCom).
Unlicensed bands (e.g., 2.4 GHz and 5 GHz) are widely accessible and low-cost technologies (WiFi and Bluetooth) suitable for short-range direct drone–controller links [19]. They are simple to implement and common in consumer/recreational drones. Unlicensed bands have a limited range and susceptibility to co-channel and adjacent-channel interference from many other devices. They are best suited for local inspections, hobbyist use, and short VLOS operations where low cost and ease of deployment are priorities. Cellular networks (4G/LTE and 5G) provide wide coverage and high data rates, allowing long-range control, real-time telemetry and video streaming [20]. 5G improves LTE with ultra-low latency, higher capacity, and better support for massive device connectivity, which is advantageous for autonomous and fleet operations [21]. Cellular networks are dependent on the commercial operator infrastructure, which implies variable availability and network policies. Cellular networks are promising candidates for industrial BVLOS missions when combined with coverage planning, resilience measures and regulatory alignment. SatCom offers near-global coverage and is indispensable for operations beyond the reach of the terrestrial network (remote-, maritime-, and polar regions).
Although SatCom incurs a higher cost and typically has a higher latency than terrestrial links, it acts as a resilient backup or primary link when cellular/unlicensed coverage is unavailable or unreliable. Nonetheless, despite the fact that services such as network technologies exist in the market, it is necessary to investigate how data-link technologies function and the key working principles that allow such C2 data links to comply with SORA regulations [22]. The purpose of this research is to investigate the hardware and underlying scheduling software and also to convey the essential information to regulators in the form of system engineering (SE) models so that it demonstrates compliance with SORA regulations. In particular, we propose an MBSE approach, which meets OSO and enables safe BVLOS flight operations.

3. MBSE for Safe BVLOS Flight Operations

The established facts on SORA regulations and drone communication networks provide the necessary background information for readers to understand the current state and progress of technology for carrying out BVLOS drone operations. However, a key question to answer would be what purpose and need drone technology serves in terms of BVLOS drone operations.
With the Netherlands having an aging population and facing higher labor costs [23], drones with BVLOS capability can be an essential resource to bridge the labor shortage gap relating to the necessary inspection of critical national infrastructure. Examples of critical national infrastructure include long power-transmission-line networks [24] and the tall wind turbines [25,26] that exist in giant wind farms. So, given the incentive to improve the safety of maintenance crews at a lower cost, drones with BVLOS capability are increasingly being adopted in such maintenance operations.
These examples require drones from the Specific Category because such operations generally fly above 120 m for the inspection of modern wind turbines [25,26], or stretch further than 2 km when power is delivered from one province to another [24]. Furthermore, inspection of wind turbine blades requires specialized imaging sensors that would incur additional weight and make the entire drone weigh more than 4 kg.
As such, the operational, logical and physical architectures constructed in this paper follow directly from the operational needs and constraints described above and together form a structured path from the mission intent to implementable system design. Operational considerations, long-range routes, high-altitude inspections and heavy sensor payloads define the actors, activities and information flows in the operational diagram. Those actors and flows are then translated into the logical architecture, into the required functions and into the interfaces between those functions. Finally, the physical architecture assigns these functions to the concrete software elements and specifies redundancy, interface connections and resource allocations needed to meet operational performance and safety goals.
This top-down mapping from operational to logical to physical architectures helps solve the overall task by making requirements traceable and testable as each operational need becomes a functional requirement in the logical model and then a measurable performance or verification requirement in the physical design. That traceability supports focused design decisions and identifies where mitigation or redundancy are required to satisfy SORA OSO. It also structures verification evidence whereby logical models show which functions must be exercised in tests and the physical architecture shows how to instrument hardware and software to produce the data that regulators require in step 7 of SORA.

3.1. Operational Architecture Diagram

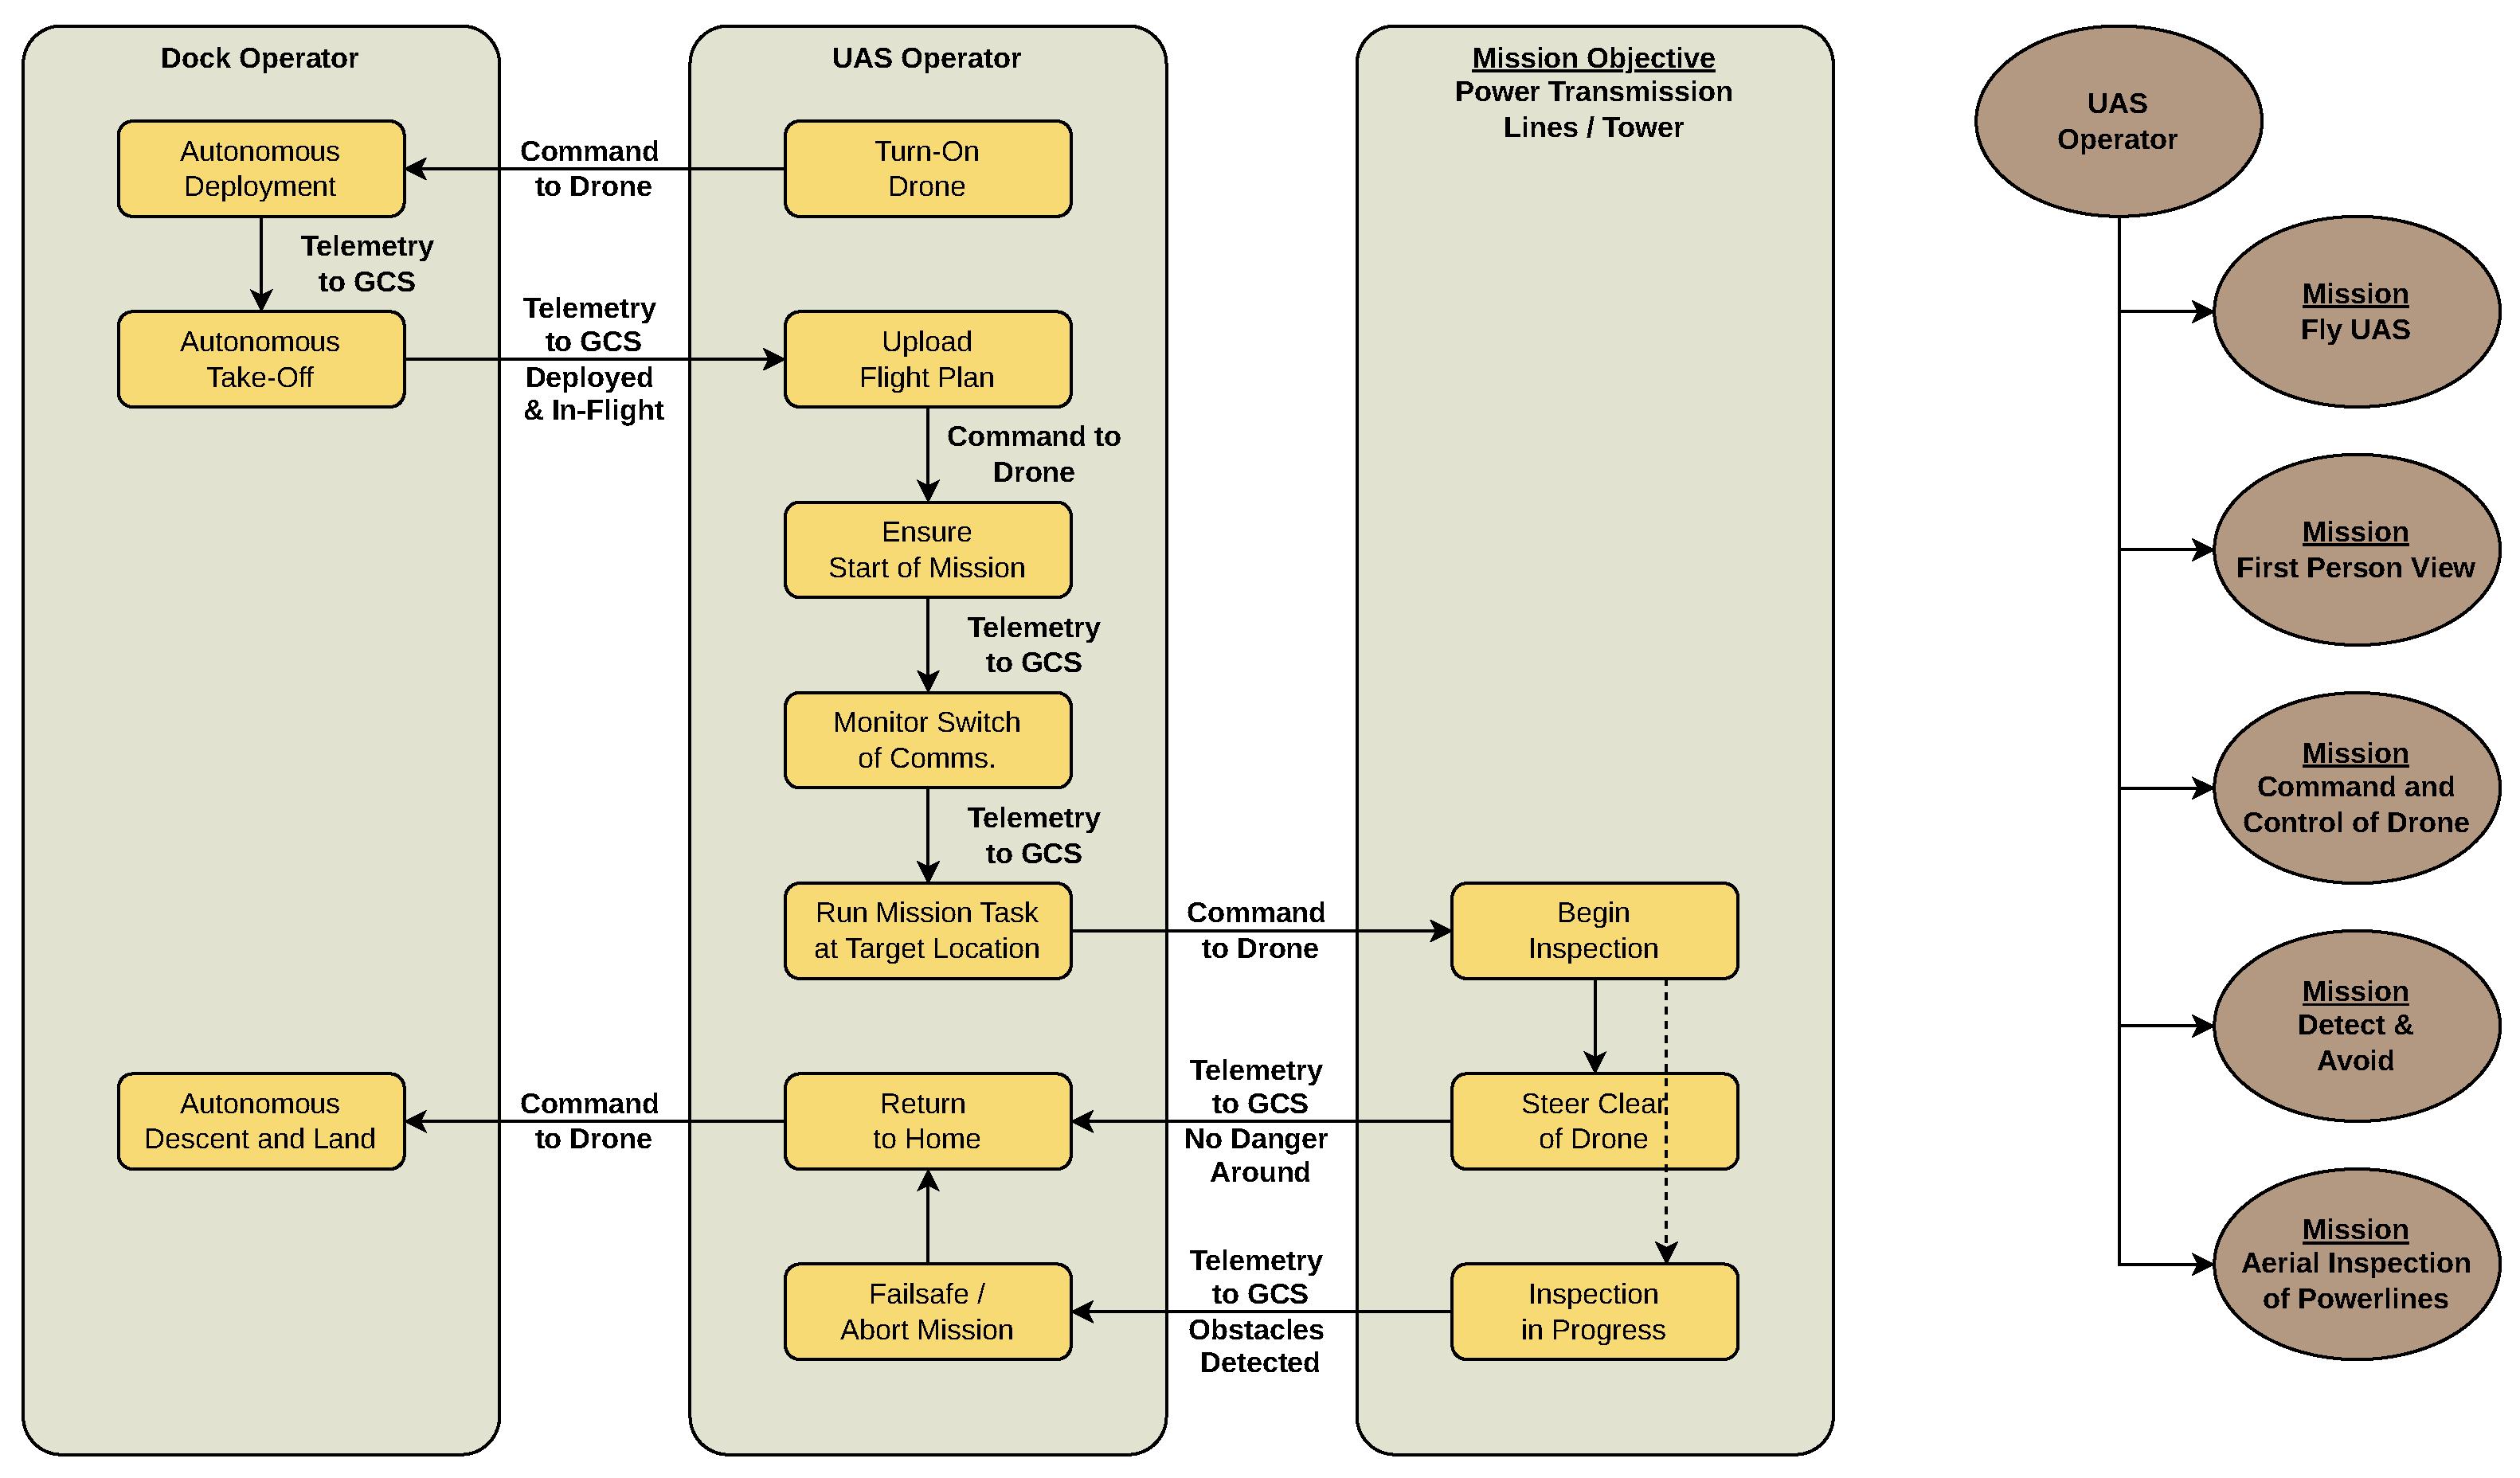
If drones are increasingly being adopted in such maintenance operations, we must first follow an SE approach and investigate the needs of a UAS operator when their drone operation evolves from a VLOS operation to a BVLOS operation. A suitable method to illustrate these needs is to build the operational diagram and the mission capability diagram [16] based on realistic operational activities. As shown in Figure 3, the operational diagram represents the UAS operator who has command and control over a drone that is performing a mission to inspect long power transmission lines. Not only can the operational diagram provide a visual representation of the UAS operator’s needs, it also serves as a validation and confirmation of the six OSO found in Figure 1 and of whether they aid in the design process of the C2 data link required in the mission. In the GCS, the drone operator turns on the drone via remote commands to deploy the drone from the dock.
In the diagram, the operational step of transmitting commands and receiving telemetry is linked to OSO #06, which defines the required performance of the C2 data link. Poor C2 performance leads to a loss of operational capability to communicate with the drone. The transition of operational steps to and from the OSO operator also links to OSO #10, #16 and #17. Whenever the UAS operator becomes confused during flight operations, system designers must identify the root causes that confound the operator. Designers must determine whether a software bug or missing network metrics obscure the operator’s view of drone state, or whether an overly complex user interface increases the probability of human error. The drone control information, including feedback, state estimation and any on-board autonomy that converts commands into actuator movement, is sent back to the drone operator in the form of telemetry. When the drone is equipped with C2 data links, the UAS operator has the ability to command the drone and fly towards the power transmission line for inspection.
While the drone is cruising towards the target destination for maintenance inspection, it will alternate between available BVLOS connections such as cellular networks or satellite networks. On the other hand, when the drone is able to complete the inspection, it can proceed to return home safely, which is a complete mission cycle. However, a sudden obstacle can hinder inspection and cause the drone to abort the mission and fly home. Thus, the C2 process is linked to OSO 06 that matches the higher objective OSO 05 for the drone to fly safely and not crash since the C2 data link is a sub-module installed on a drone. As for the other four OSOs, they are lower-level objectives in a hierarchal grouping [27] that support OSO 06.
In summary, Figure 3 serves as the first contribution for UAS operators to emulate and adapt from VLOS to BVLOS drone operations. This is so that when Figure 3 is submitted, regulators have a clear understanding of the main details of the BVLOS operation before studying the functions of the drone hardware or software required in the mission. This is because the operational diagram can standardize most BVLOS drone flights where a drone flies to an intended target destination. However, the exact mission at the destination is the defining difference between the various operational diagrams.

3.2. Logical Architecture Diagram

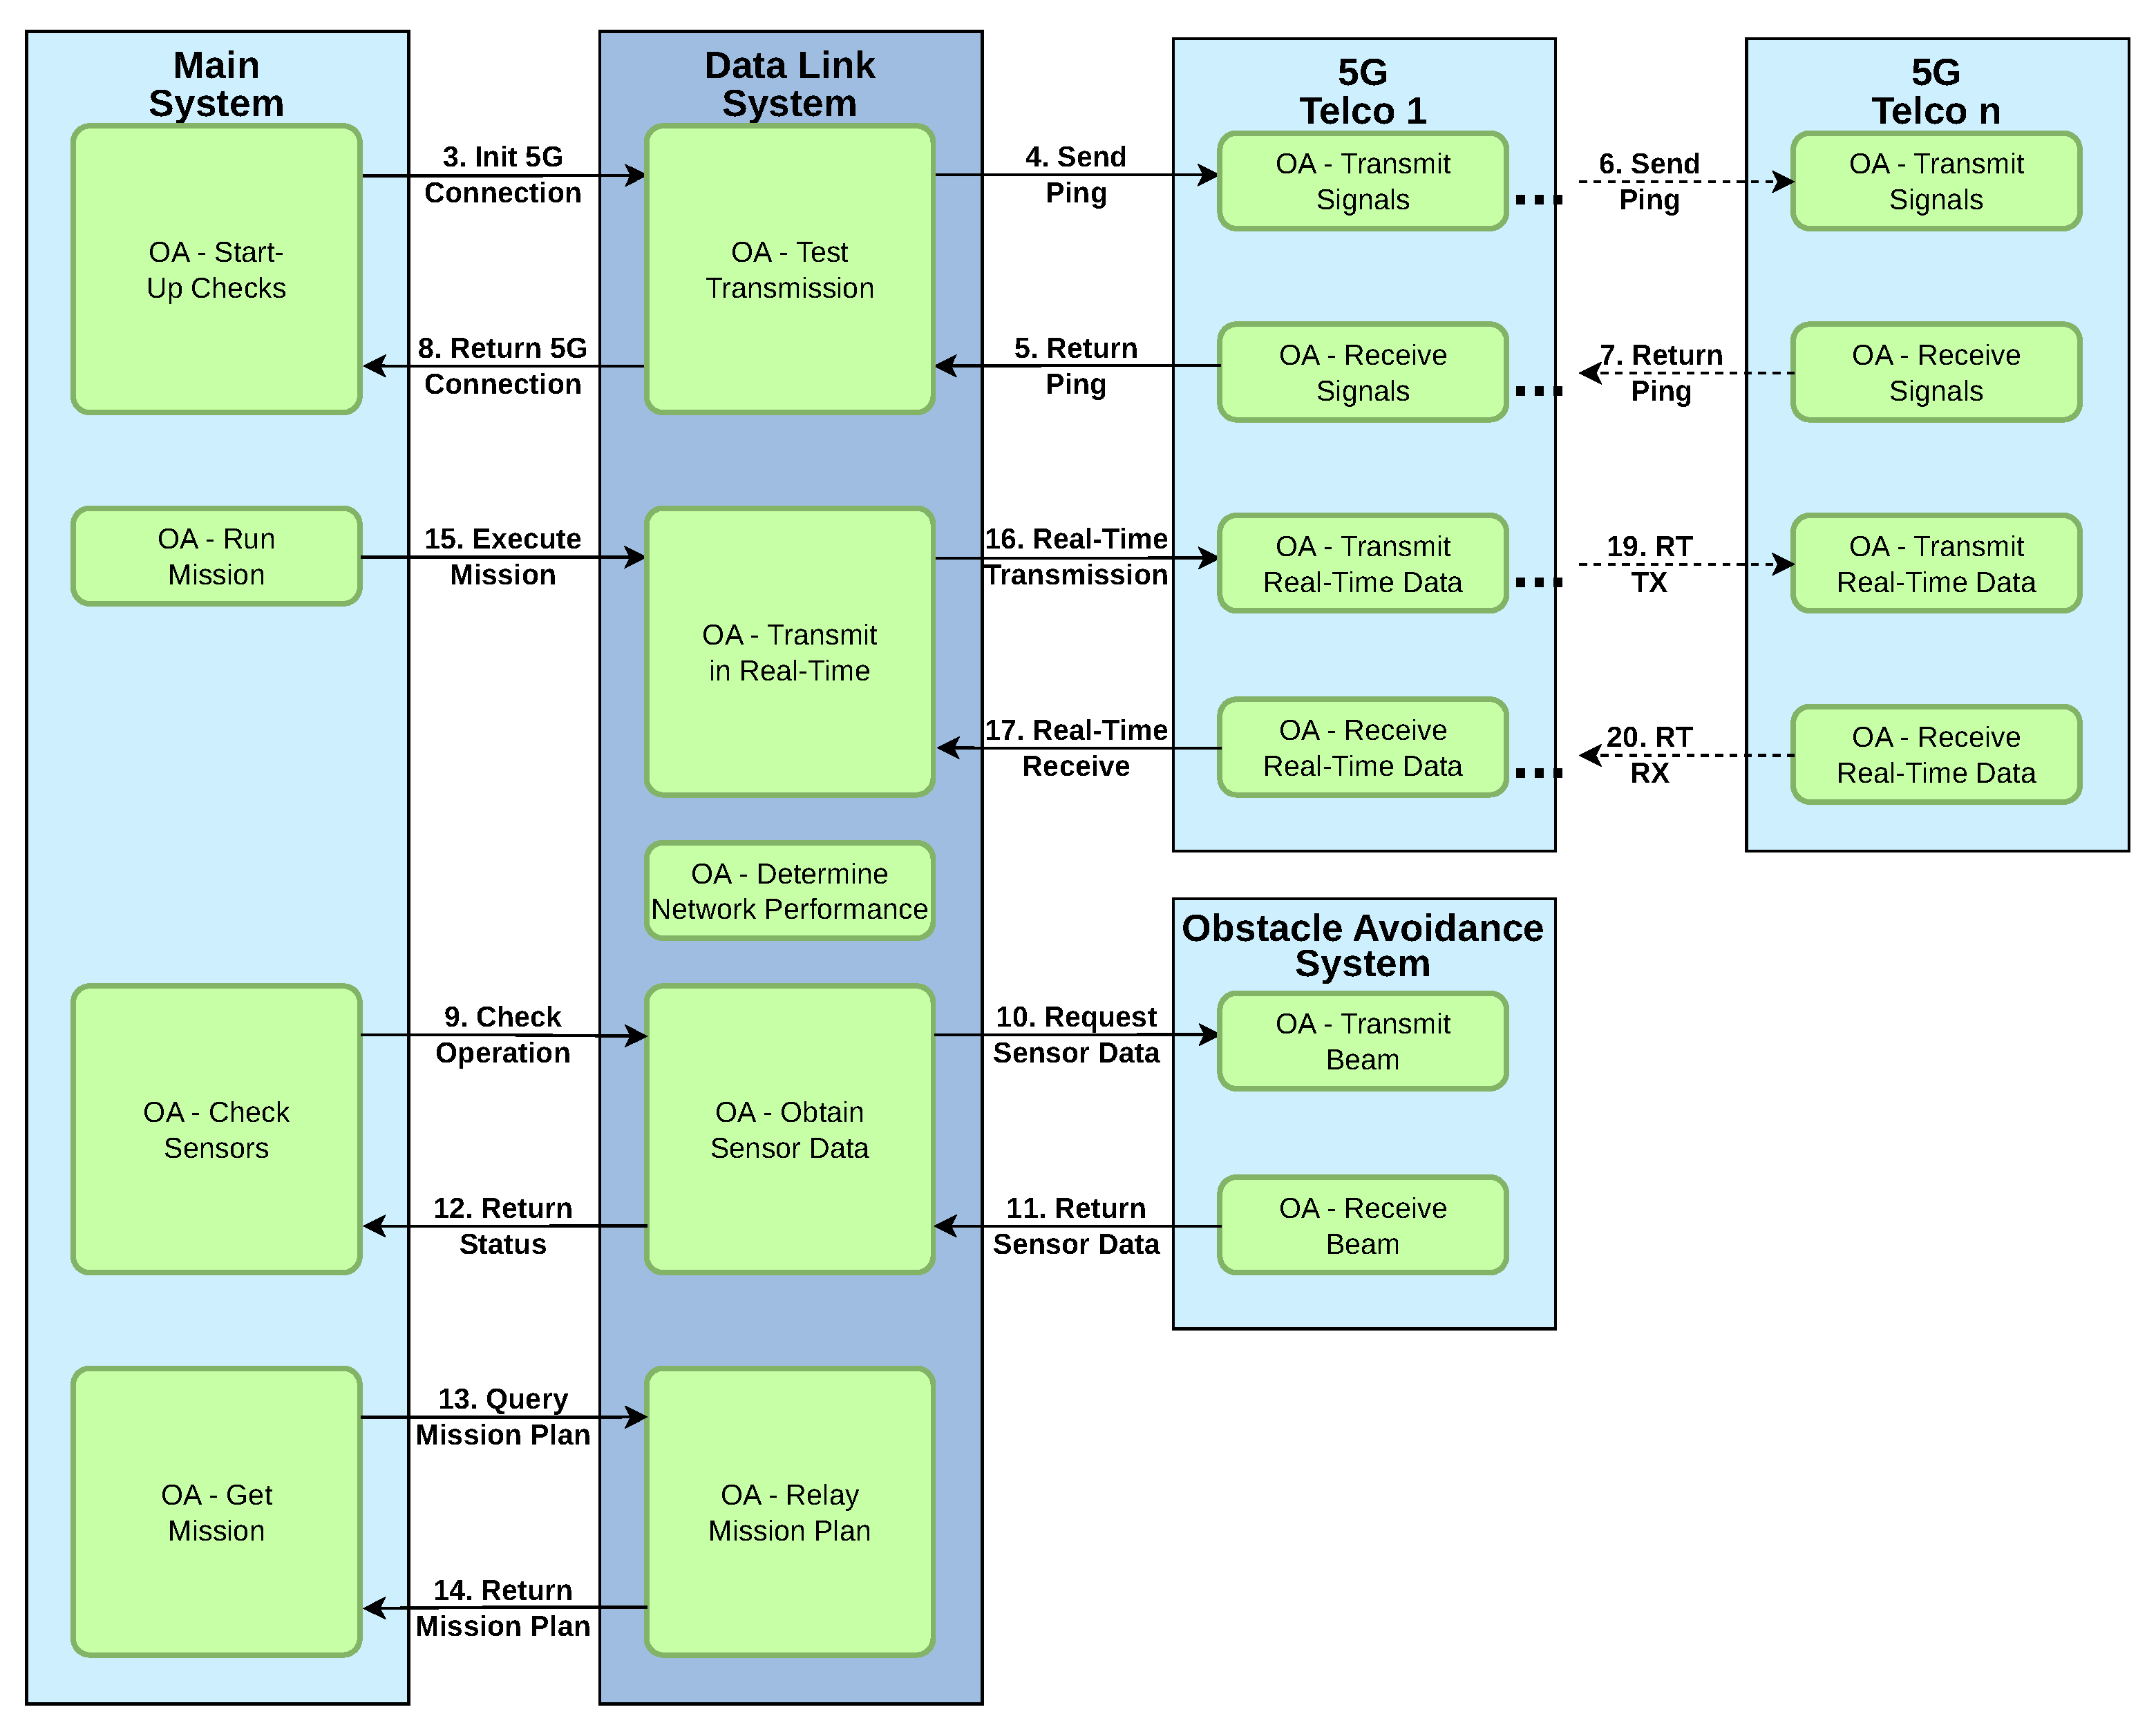
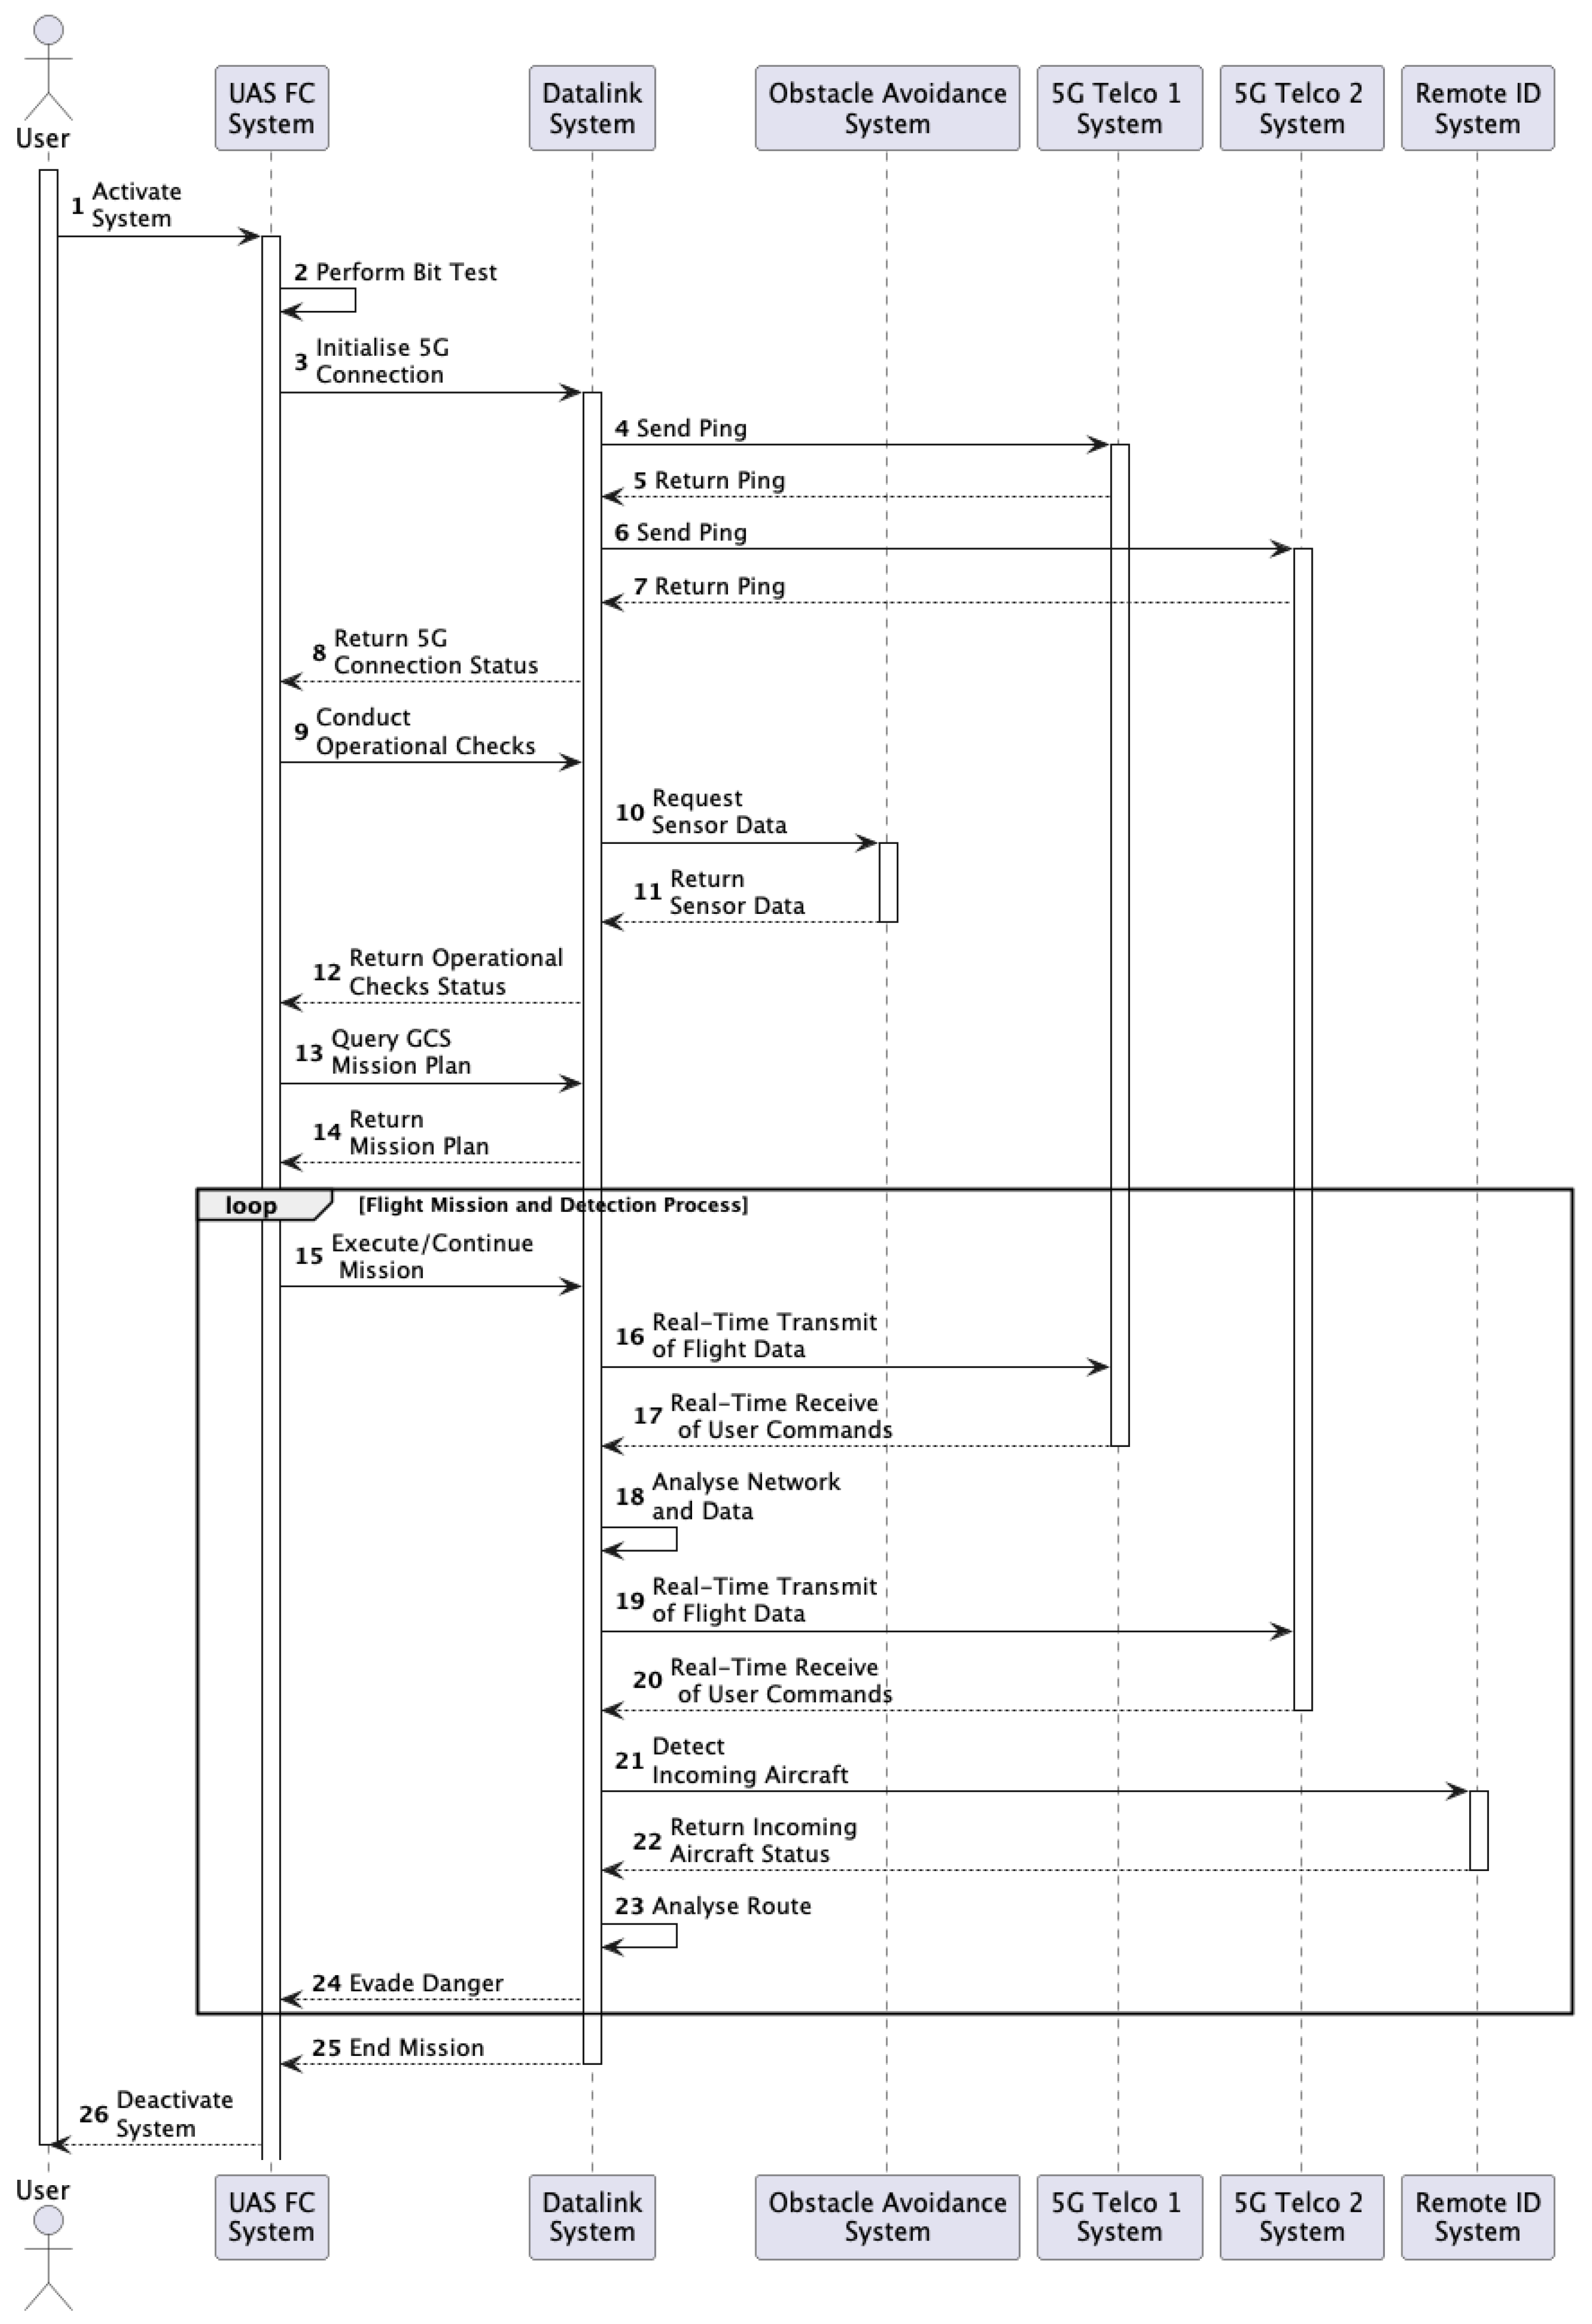
The operational architecture diagram defined in the previous Section 3.1 helps validate the selected OSO and define the requirements of the usual SE process. Having a set of requirements, we will then need to translate them into functions that can meet them. However, in engineering, coming up with functions themselves means nothing without understanding how to achieve them via hardware and software. So, we model how a C2 data-link functions using a sequence diagram in which the operator starts by activating the drone system, as drawn in Figure 4. The operator will conduct tests where the flight controller communicates with the data-link system by initializing a cellular connection during pre-flight activities.
When the ping message is sent successfully, the BVLOS drone can switch from the preliminary ping test and proceed to the secondary stage of real-time transmission during the mission. The conventional sequence diagram can be represented in finer detail when designed with a logical architecture diagram, as shown in Figure 5, which also acts as a deeper design layer compared to the operational diagram in Figure 3.
In Figure 5, the highlighted green boxes inside each hardware logic module denote the features implemented to achieve the operational activities. When an arrow is drawn from one green box to the other, it represents functions that aim to meet the requirements. The key message is that green logical blocks expose interface and functional requirements, which, in turn, help designers make concrete hardware choices. The logical architecture, therefore, validates the operational diagram by specifying how functions map to hardware and by revealing the number and type of software interfaces that processors must support. Communication modules typically appear as one logical block with one or two functions, whereas a central processing unit (CPU) appears as a single logical block that implements many functions and interfaces to multiple communication modules. In other words, the CPU acts as the system brain, where it processes data and coordinates each connected module, so its interface count, performance, and resource budgets determine whether the individual functions of those communication modules can be achieved.
In summary, Section 3.2 is a deeper design layer that helps the designer make hardware selection choices. Given that better and newer hardware will become available in the market over time, designers can adapt Figure 5 with each new hardware improvement. For example, 5G cellular modules made by Telit or Sierra Wireless can provide the features of signal transmission in real-time while the data-link system can use an NXP Layerscape communication processor, which features TrustZone technology that provides a secure environment for sensitive data. When the hardware design process is firm, the next stage is to look at the design of the software with the help of the physical architecture diagram. The physical architecture diagram will also help designers create the necessary software tests to verify the performance of the C2 data link on a drone that is simulated to switch cellular links when it travels towards the target destination.

3.3. Physical Architecture Diagram

The logical architecture diagram defined in the previous Section 3.2 helps to define the hardware on which the C2 data-link software is to be built. However, before any software engineer plans any architecture for the software, there is a need to first understand an essential consideration in communication system design. In any communication system design, there is a trade-off between coverage, capacity and quality. Coverage depends on radio propagation parameters such as cell tower placement, antenna height, transmission power and frequency bands. Capacity is related to bandwidth, which is measured in megabits per second. Quality relates to latency and reliability, namely round-trip times and packet loss.
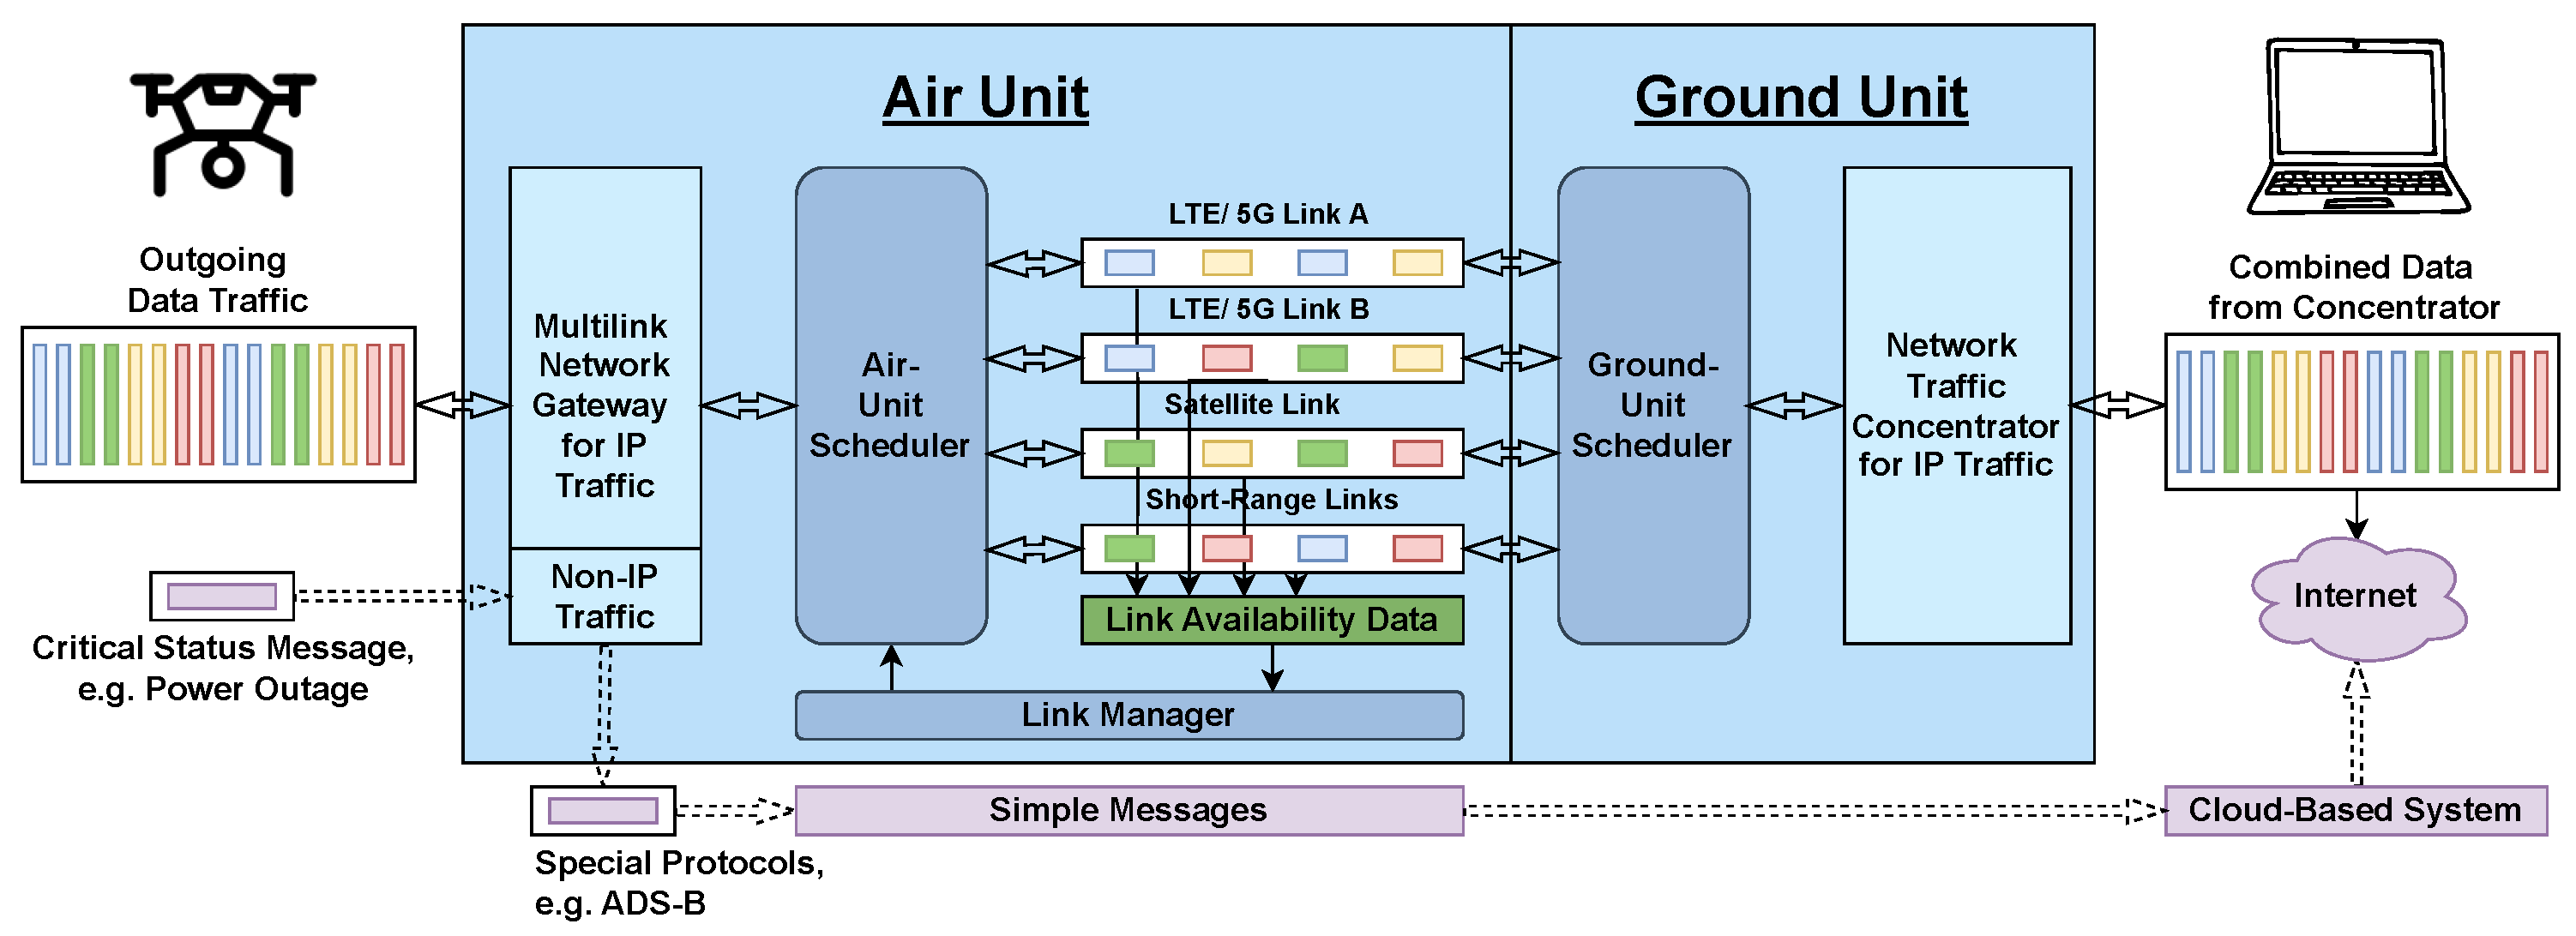
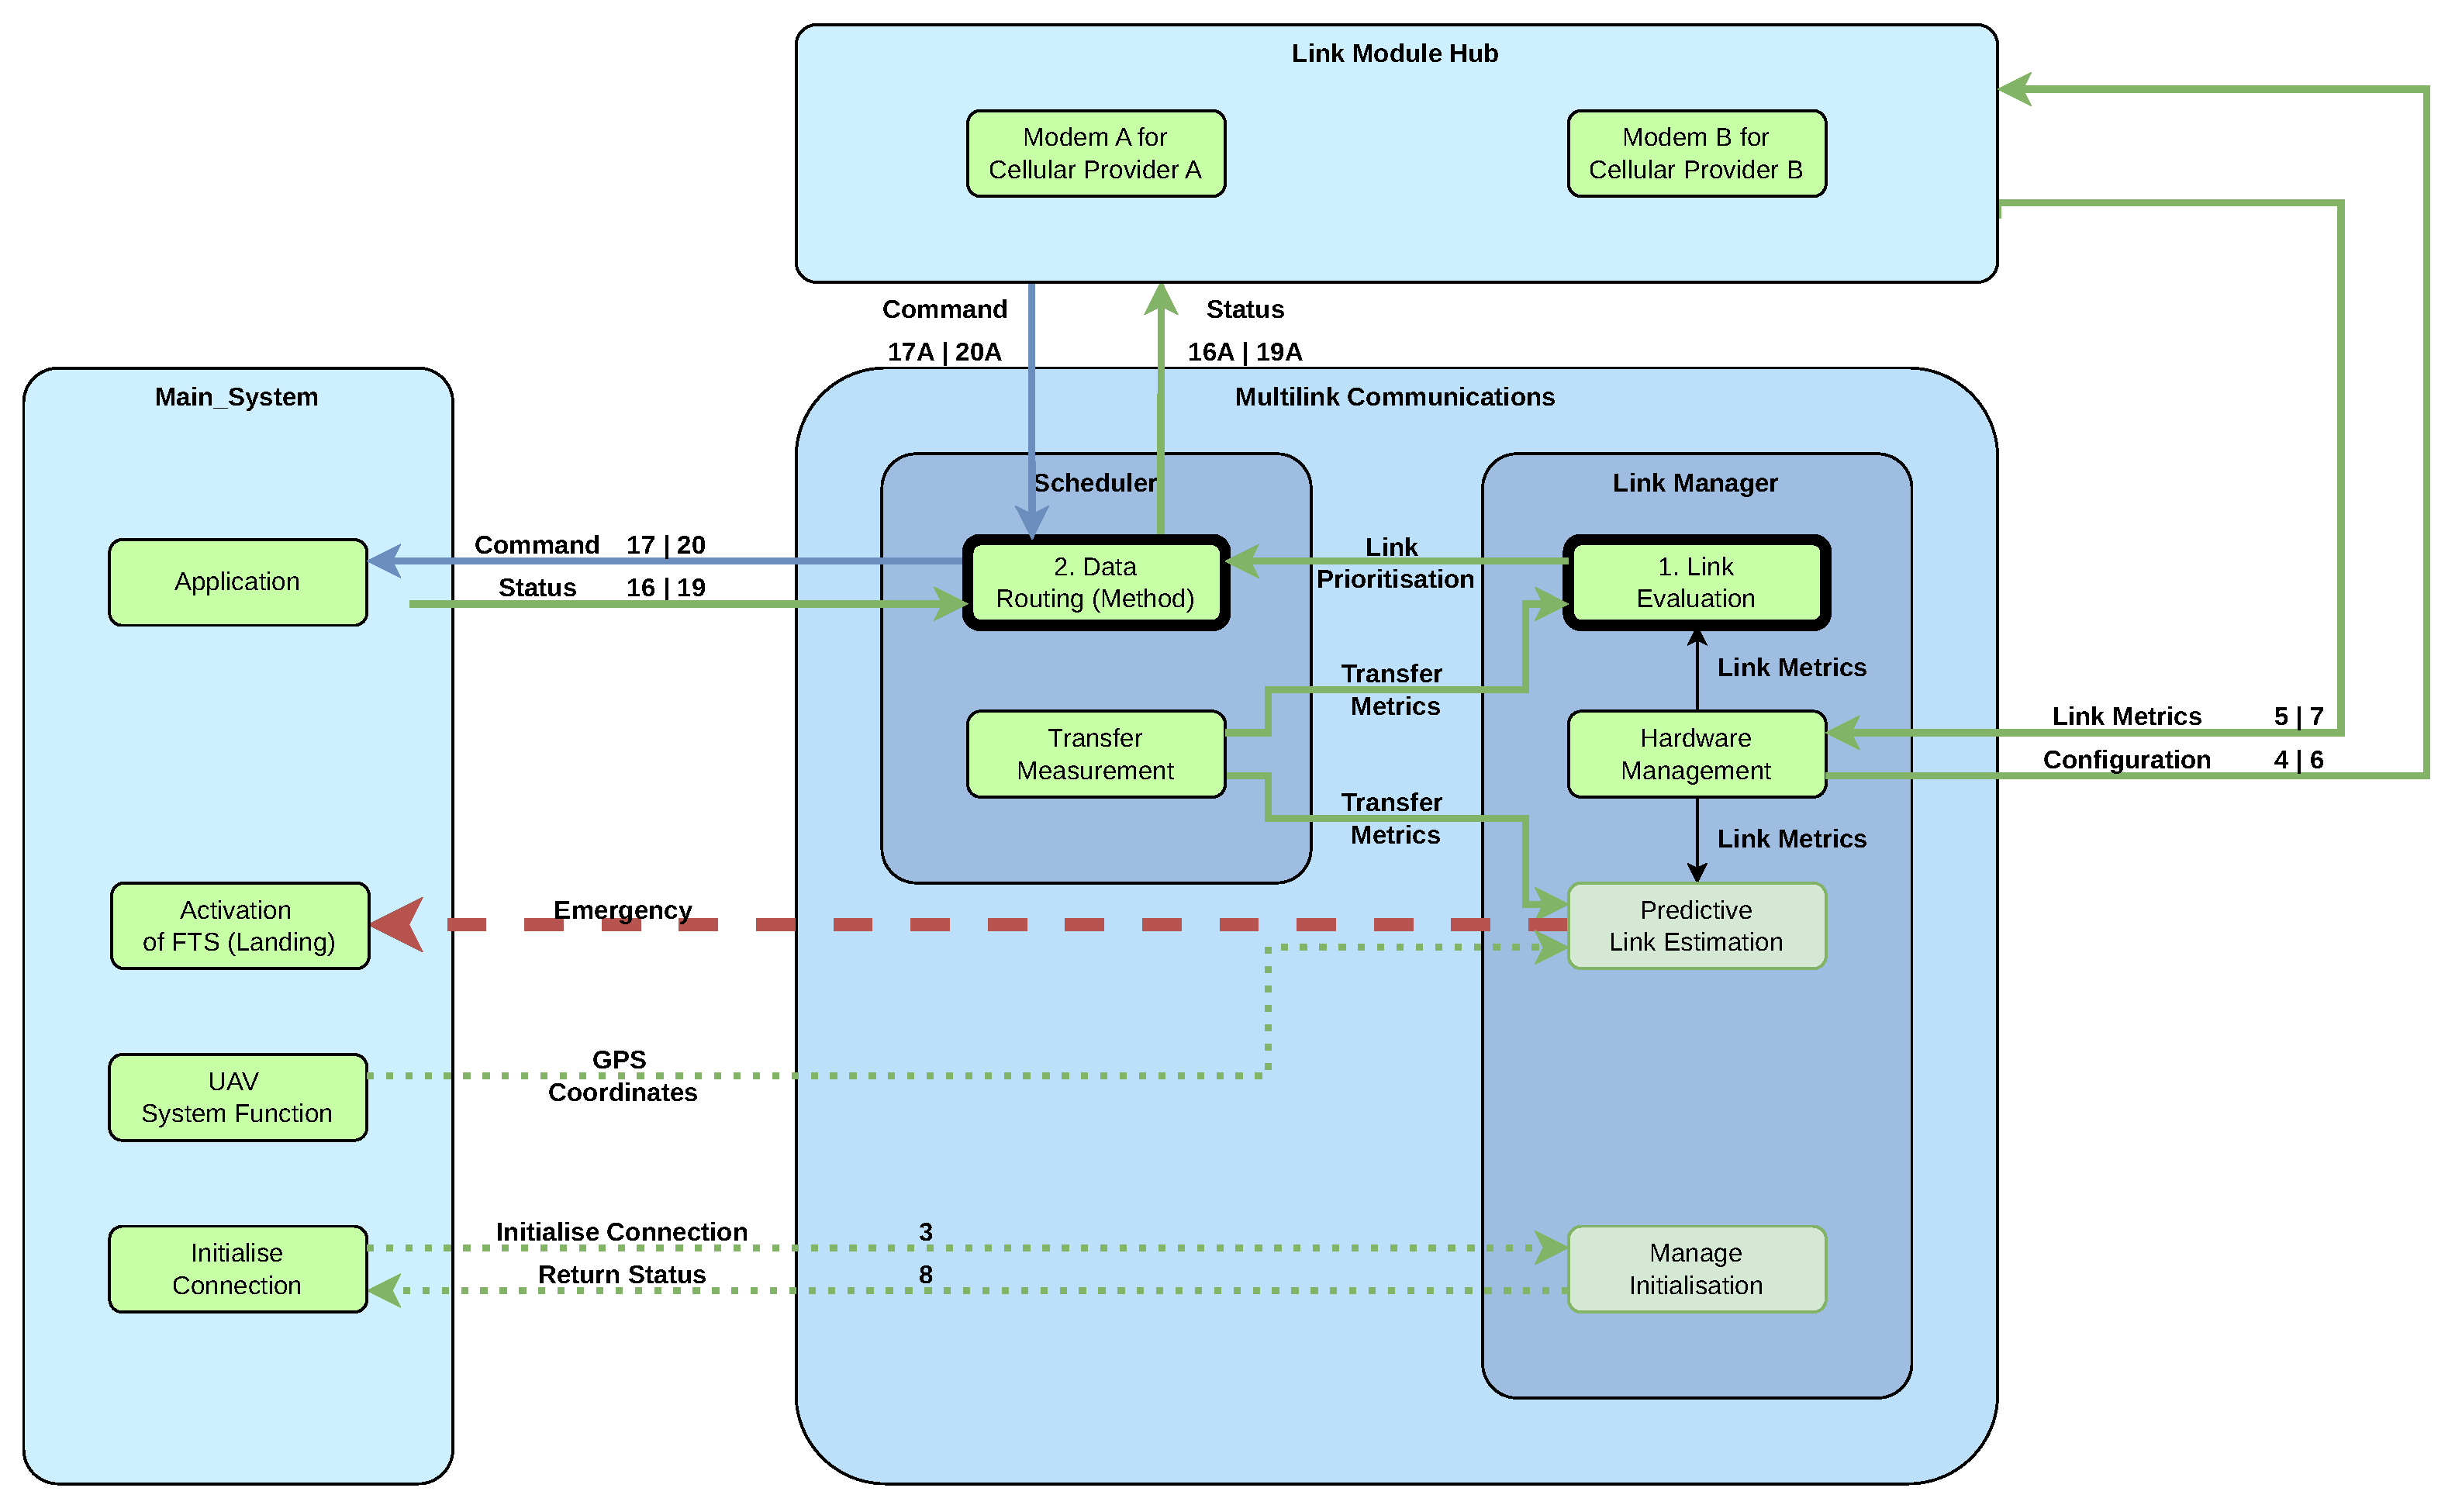
Given that coverage is within the control of Mobile Network Operators (MNOs), it can be assumed that the usage of cellular network modules is in operational areas with healthy cellular coverage [28]. Hence, the design of the C2 data-link software aims to balance and optimize the capacity and quality aspects of the network connection during BVLOS drone operations. Hence, the two goals of capacity and quality in a piece of network communication software are the key focus in the software engineering process. As data-link software is developed, Figure 6 reflects a ground-up example of system architecture for a C2 data link. Taking reference from Figure 6, the drone on the left is sending an outgoing message to the GCS [29]. In the middle are two blocks which correspond to two separate blocks of hardware, namely the air data-link unit and the ground data-link unit. Within each piece of hardware, unique software design blocks enable the function of the C2 data-link system. The first block is a scheduler software module that follows an algorithm to decide which route to send the packets. In order of priority, the scheduler can send data packets to cellular data links, followed by satellite links. Only during the take-off and landing phases can the scheduler choose to send data packets over short-range links like Wi-Fi. However, a normal cellular link is ideal for use during take-off as it minimizes the switching time from Wi-Fi when the drone flies towards the target destination. The link manager is another software block that obtains essential metric data on the performance and availability of the respective links and periodically updates the scheduler in a feedback loop for the scheduler to make alterations to its routing decisions. With the design of the scheduler and the link manager, the design of the physical architecture as seen in Figure 7 can be drawn to explain how the bandwidth capacity and latency quality can be improved.
The Scheduler operates primarily on the Network Layer (Layer 3) of the OSI model. It is responsible for determining how data packets are distributed across multiple cellular links by implementing path-selection and scheduling algorithms. Routing decisions that determine which network path to use are a network-layer function executed by the link manager.
The Scheduler also operates at the network layer to manage packet distribution across the paths selected by the link manager. The scheduler consists of two main components:
  • Packet Distribution: Manages packet distribution and load balancing across available paths to optimize data throughput.
  • Transfer Measurement: Monitors data-transfer performance to support efficient path-utilization decisions.
The Link Manager, operating in the network layer (Layer 3) of the OSI stack, evaluates link quality by monitoring latency. It comprises four key components:
  • Link Evaluation: Assesses real-time link metrics to prioritize the most reliable communication paths.
  • Hardware Management: Configures modem settings and manages physical resources.
  • Predictive Link Estimation (future software add-on): Anticipates link conditions to maintain stable connection.
  • Manage Initialization (future software add-on): Handles the coordination of the boot-up sequence between the main system and the C2 data-link system when intricate startup management is needed.
Together, these components enable a dynamic multilink communication system where the link manager handles link-level quality, while the scheduler directs network-level data routing with optimized bandwidth. In essence, the physical architecture diagram not only reflects the company’s system architecture but also correlates with the logical architecture diagram designed in Figure 5. Thus, this creates a cohesive design flow from the operational architecture diagram to the logical architecture diagram, and, finally, to the physical architecture diagram.

4. Test Results for Bandwidth and Latency

This section outlines the essential tools and environments used to establish the test setup to verify internal C2 data-link improvements. It will describe two different setups: one for testing bandwidth and the other for testing latency.

4.1. Test Setup for Bandwidth

The throughput tests were managed within a virtualized Linux environment running Ubuntu 22.04 LTS. With the use of a M2 Pro MacBook Pro equipped with 16 GB of Random Access Memory (RAM), virtualization was managed using Parallels Desktop software, allowing multiple instances of Ubuntu to run concurrently and smoothly. This configuration enables simulation of communication links and network nodes in BVLOS operations without requiring new flight trials during early-stage software validation. Importantly, related LTE flight activities were carried out within the ADACORSA project, funded by the ECSEL Joint Undertaking (Grant No. 876019), while detailed technical evidence is documented in project deliverables that are confidential and not publicly released [30]. Therefore, the purpose of the VM setup in this paper is to provide MBSE-focused, reproducible software verification and to establish a redeployable baseline for later operational integration. Given that small errors can grow into compound errors when software is scaled up using multiple virtual machines (VM) to become a complex system, the first step is always to determine bugs and error messages in the software. Hence, the use of a single VM is needed to verify the execution of the software on the drone client and the GCS server side. It serves as an initial verification step to confirm the basic functioning of the communication stack within a controlled environment.
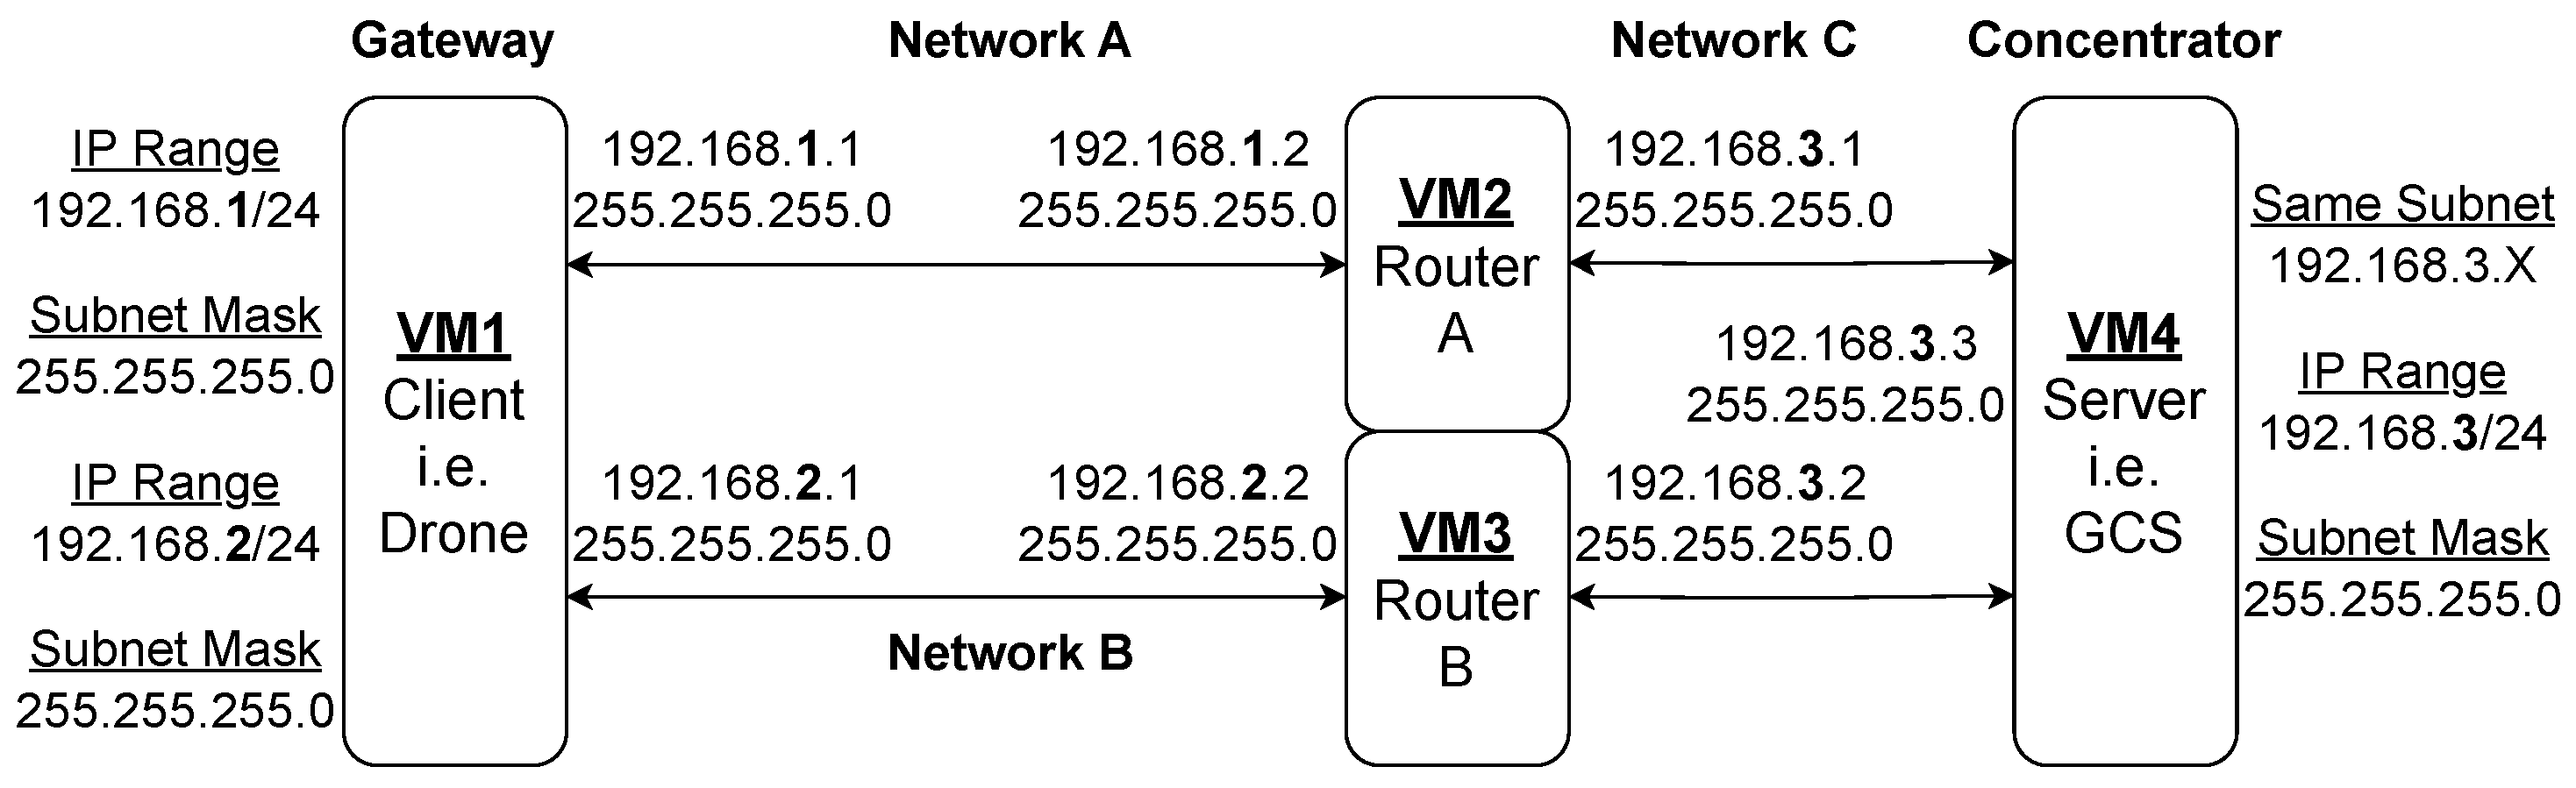
After verifying that software components such as the aforementioned scheduler and link manager can operate as intended through the single VM setup, we transit from the functional module test and scale to four VMs. The goal is to simulate a realistic network topology that includes two separate cellular networks, as shown in Figure 8. In this particular configuration, two virtual machines represent the cellular network routers of network providers A and B, respectively. Then, at both ends, VM 1 acts as the drone client, while VM 4 acts as the GCS server. This scenario enables evaluation of the C2 data-link software to manage connections on dual network paths, reflecting a platform to analyze routing decisions and link switching within a multi-network environment. In fact, the test setup scenario in Figure 8 represents the Figure 7 that we aim to test in a real-life BVLOS scenario. For the evaluation of network bandwidth performance within the virtualized test environment, open source iPerf3 was used. iPerf3 is widely used to measure the maximum achievable bandwidth in communication networks, providing detailed metrics such as throughput and packet loss. These measurements assess the bandwidth and reliability of communication links in the C2 data-link system. An example of the command used on the drone client VM to test bandwidth is shown in Listing 1.
Listing 1: iPerf3 command example.
iperf3 -c <server_IP_address> -B <client_IP_address> -t 10
Given such meaningful, reproducible bandwidth tests for C2 links, they are executable with minimal setup and no specialized hardware. A basic VM-to-VM iPerf3 test rapidly exposes link capacity, transient drops and sustained throughput limits. It, therefore, guides early design choices (e.g., required modem bandwidth, expected video up-link rates, or need for compression). Because the test is easy to automate and reproduce, it provides straightforward evidence that can feed MBSE traceability and regulatory verification artifacts.

4.2. Results for Bandwidth

In this particular investigation, we analyzed the baseline code and made improvements to the scheduler from a software system and algorithm perspective. The implementation of the modification for the scheduler improved the bandwidth for the sender 1-fold, while the bandwidth for the GCS increased 3-fold, as shown in Table 3. The delivery success rate of the scheduler also improved from the original 41% to 82%, allowing more data to be sent through and improving the effectiveness of the data-link software. Table 3 summarizes the aggregate improvements most relevant for design decisions and regulatory evidence, while Table 4 and Table 5 provide interval-by-interval baseline and modified scheduler measurements (transfer, bitrate, retransmissions and congestion window).
As shown in Table 4 and Table 5, the modified scheduler software sustains higher transfer and bitrate in most intervals despite transient drops, which is consistent with the higher end-to-end data received and delivery success summarized in Table 3. This means that not only serial message data can be accommodated, but that the increased bandwidth can also accommodate higher bandwidth signals like video feed data when drones have an onboard camera that captures a video feed of their surroundings. The improved and repeatable iPerf3 results provide quantified evidence of software changes to help regulators understand software upgrades when UAS operators submit documentation for SORA approvals that include iterative upgrades [20].
Furthermore, repeatability of the bandwidth test also helps in terms of proving the reliability numbers of the data-link software and ensuring that the drone is safe for use in operations. In BVLOS drone operations, lower levels of onboard automation increase the UAS operator’s reliance on remote sensing, so the GCS is required to provide the greater situational awareness delivered by video feeds or other sensor streams. The ability to transmit higher-resolution video and more frequent telemetry, therefore, directly reduces the cognitive burden on the UAS operator and supports safer manual or semi-autonomous decision-making during inspection of power transmission lines. In this study, the observed increase is interpreted as a software-efficiency effect under unchanged hardware: reduced processing overhead, fewer forwarding interruptions and improved runtime robustness increased end-to-end throughput.
No manual TCP parameter tuning (for example, fixed TCP window reconfiguration) was applied. Instead, software-level stabilization reduced interruption and retry pressure, which is consistent with the measured improvement in delivered data. These positive results also helped to validate the allocation shown in Figure 7 whereby the Command paths (17A and 20A) and Status paths (16A and 19A) that carry control and telemetry traffic are the same channels whose capacity improves after the scheduler software modification. This traceability linking measured performance back to specific physical interfaces and labeled paths confirms that the design choices embodied in the physical architecture produce the expected operational capability of higher capacity video and telemetry at the GCS and more reliable command delivery to the air unit.

4.3. Test Setup for Latency

Latency measurements were conducted using two Intel-based Linux laptops to better represent various connectivity latencies. Laptop 1, acting as drone client, is an MSI GS65 Stealth Thin 8RF, while Laptop 2, acting as GCS server, is a Lenovo ThinkPad E15 Gen 2. Both laptops were installed with Ubuntu 22.04 LTS and were connected via two methods. The first connection is a direct wired Ethernet cable that provides a stable low-latency link. The second connection uses the Wi-Fi networks available to the laptops to introduce transport-layer RTT variability and an alternative path for failover triggering. We note that 802.11 Wi-Fi uses a contention-based MAC (CSMA/CA), which is fundamentally different from the scheduled MAC used in LTE/5G cellular links. Wi-Fi is, therefore, not used here to model the radio-access or MAC-layer behavior of drone C2 links. Rather, it serves as a readily available second interface that allows the link-manager-failover logic to be exercised under variable latency conditions in a controlled and reproducible lab environment.
To measure network latency between the two laptops, the ICMP-based ping command was used. This tool sends a series of echo request packets to the target host and reports the Round-Trip Time (RTT) for each packet. An example command used for latency testing is shown in Listing 2.
Listing 2: Ping command example.
ping -c 100 <server_IP_address>

4.4. Results for Latency

The goal of the link manager is to optimize the switching between multiple link interfaces, ensuring stable connectivity from the drone client to the GCS server during moments when an active link goes down or experiences continued degradation. During the test of the modified link manager, the C2 data link experienced a disconnect from the Ethernet link, as seen in Listing 3.
Listing 3: Interface Status Log and Failover Trigger.
2025-08-05 23:02:48 - enp60s0 is UP (CABLE CONNECTED)
2025-08-05 23:02:49 - enp60s0 is UP (CABLE CONNECTED)
2025-08-05 23:02:50 - enp60s0 is UP (CABLE CONNECTED)
2025-08-05 23:02:51 - enp60s0 is UP (CABLE DISCONNECTED)
 
DEBUG: Cable disconnect detected! Triggering failover...
In real time, there was an automatic fail-over to the secondary Wi-Fi connection and it was completed in approximately 0.12 s, minimizing interruption in the drone client’s network communication, as depicted in Listing 4. Although this test is not fully representative of a switch from cellular links, given the hardware constraints in this project, it still shows that the software can improve by 1.5 s when switching from cellular network to Wi-Fi, as demonstrated in a previous flight trial conducted in November 2023. This possible 92% reduction in switching time can be replicated when future flight trials can be performed with testing of the cellular link modules.
Listing 4: Failover Completion Time.
Failover completed in 0.116455208 s
Furthermore, after a successful switch over to a secondary Wi-Fi connection, connectivity tests to a remote node (10.0.0.1) of the GCS server were performed successfully using the ping command shown in Listing 2. The RTT averaged around 54 ms, with no packet loss observed after successful switch-over, as shown in Listing 5.
Listing 5: Ping Test Output to 10.0.0.1.
2. Testing connectivity to 10.0.0.1:
 
PING 10.0.0.1 (10.0.0.1) 56(84) bytes of data.
64 bytes from 10.0.0.1: icmp_seq=1 ttl=64 time=9.41 ms
64 bytes from 10.0.0.1: icmp_seq=2 ttl=64 time=65.6 ms
64 bytes from 10.0.0.1: icmp_seq=3 ttl=64 time=87.2 ms
 
--- 10.0.0.1 ping statistics ---
3 packets transmitted, 3 received, 0% packet loss, time 2003 ms
rtt min/avg/max/mdev = 9.409/54.088/87.221/32.799 ms
To make the timing assessment explicit from a real-time systems perspective, we evaluated the link manager against three timing-oriented acceptance criteria in this test scenario: bounded failover interruption, continuity after recovery and latency stability after recovery. For bounded interruption, failover completion was measured at 0.116 s (Listing 4), which indicates sub-second recovery in the tested setup.
For continuity, no packet loss was observed in the post-failover measurement window (0% packet loss in Listing 5). For latency stability, RTT min/avg/max/mdev values are reported to expose central tendency and spread after recovery rather than mean latency alone. These timing indicators provide traceable evidence for C2 performance and safe recovery objectives in the selected OSO set (especially OSO #06, #10, and #16). In general, these results demonstrate that the modified link manager is able to quickly detect link failures and execute failover procedures with minimal latency. This improvement is critical to maintain reliable C2 links in BVLOS drone operations. The ping test also acts as a way to convince operators that the connectivity test is standardized and that the logs of the data link are simple to understand when failure occurs during BVLOS drone operations. The ping test helps validate the allocation shown in Figure 7, specifically the link metrics paths (5 and 7) that determine the link-quality metrics of the connections. The function of monitoring link metrics is, therefore, key to triggering timely link switching by the link manager. It is able to detect early deterioration and initiate failover before control or situational-awareness degradation becomes critical: in BVLOS drone operations, where the drone may be traveling at high speeds and is far from the operator. By enforcing automated and metric-driven switching policies, the link manager reduces the reliance on manual intervention, shortens recovery time after transient faults and preserves the end-to-end latency and delivery guaranties required for safe command and telemetry exchange.

4.5. Validation of Results

Based on the results, we can see a marked improvement in two key aspects. Firstly, by modifying the scheduler software, the bandwidth has improved along with the reduction in frequency of failed transmissions. Secondly, by modifying the link manager, the latency has improved. The latency improvement is assessed against the three timing-oriented acceptance criteria introduced in Section 4.4: (i) bounded failover interruption (measured at 0.116 s), (ii) post-failover continuity (0% packet loss in the measured window), and (iii) RTT stability after recovery (min/avg/max/mdev = 9.409/54.088/87.221/32.799 ms). These timing indicators provide traceable evidence for the C2 performance and safe recovery objectives of OSO #06, #10, and #16. If we recall the analysis of the OSO in Section 2, the level of SAIL IV is currently the main target of SORA that is being considered for approval in the Netherlands. The SAIL level IV indicates medium class levels for the six relevant OSOs selected in Figure 1 and are believed to be achievable after obtaining improvements in software tests based on the structured approach we have used.
However, in cases where bandwidth and latency are considered insufficient to support high-speed flight during the cruise phase of a BVLOS drone mission, a practical mitigation strategy is to reduce the high speed of the drone by half during the cruise phase so that the margin of error distance can be reduced by half at the same latency. This trade-off between flight speed and communication reliability highlights the importance of adaptive flight planning in BVLOS operations. By adjusting operational parameters such as speed based on real-time link quality and environmental conditions, operators can optimize mission success while maintaining compliance with safety requirements and while acknowledging its negative impact on operational efficiency due to limited battery life.
Based on the illustrated methodology of designing a C2 data link that meets SORA requirements, it is important to explore how this design can be adapted to support various BVLOS drone missions. Different operational scenarios pose unique challenges and require adapted solutions to ensure safe and compliant drone flights.

4.6. Adapting C2 Data Link for New-Use Case

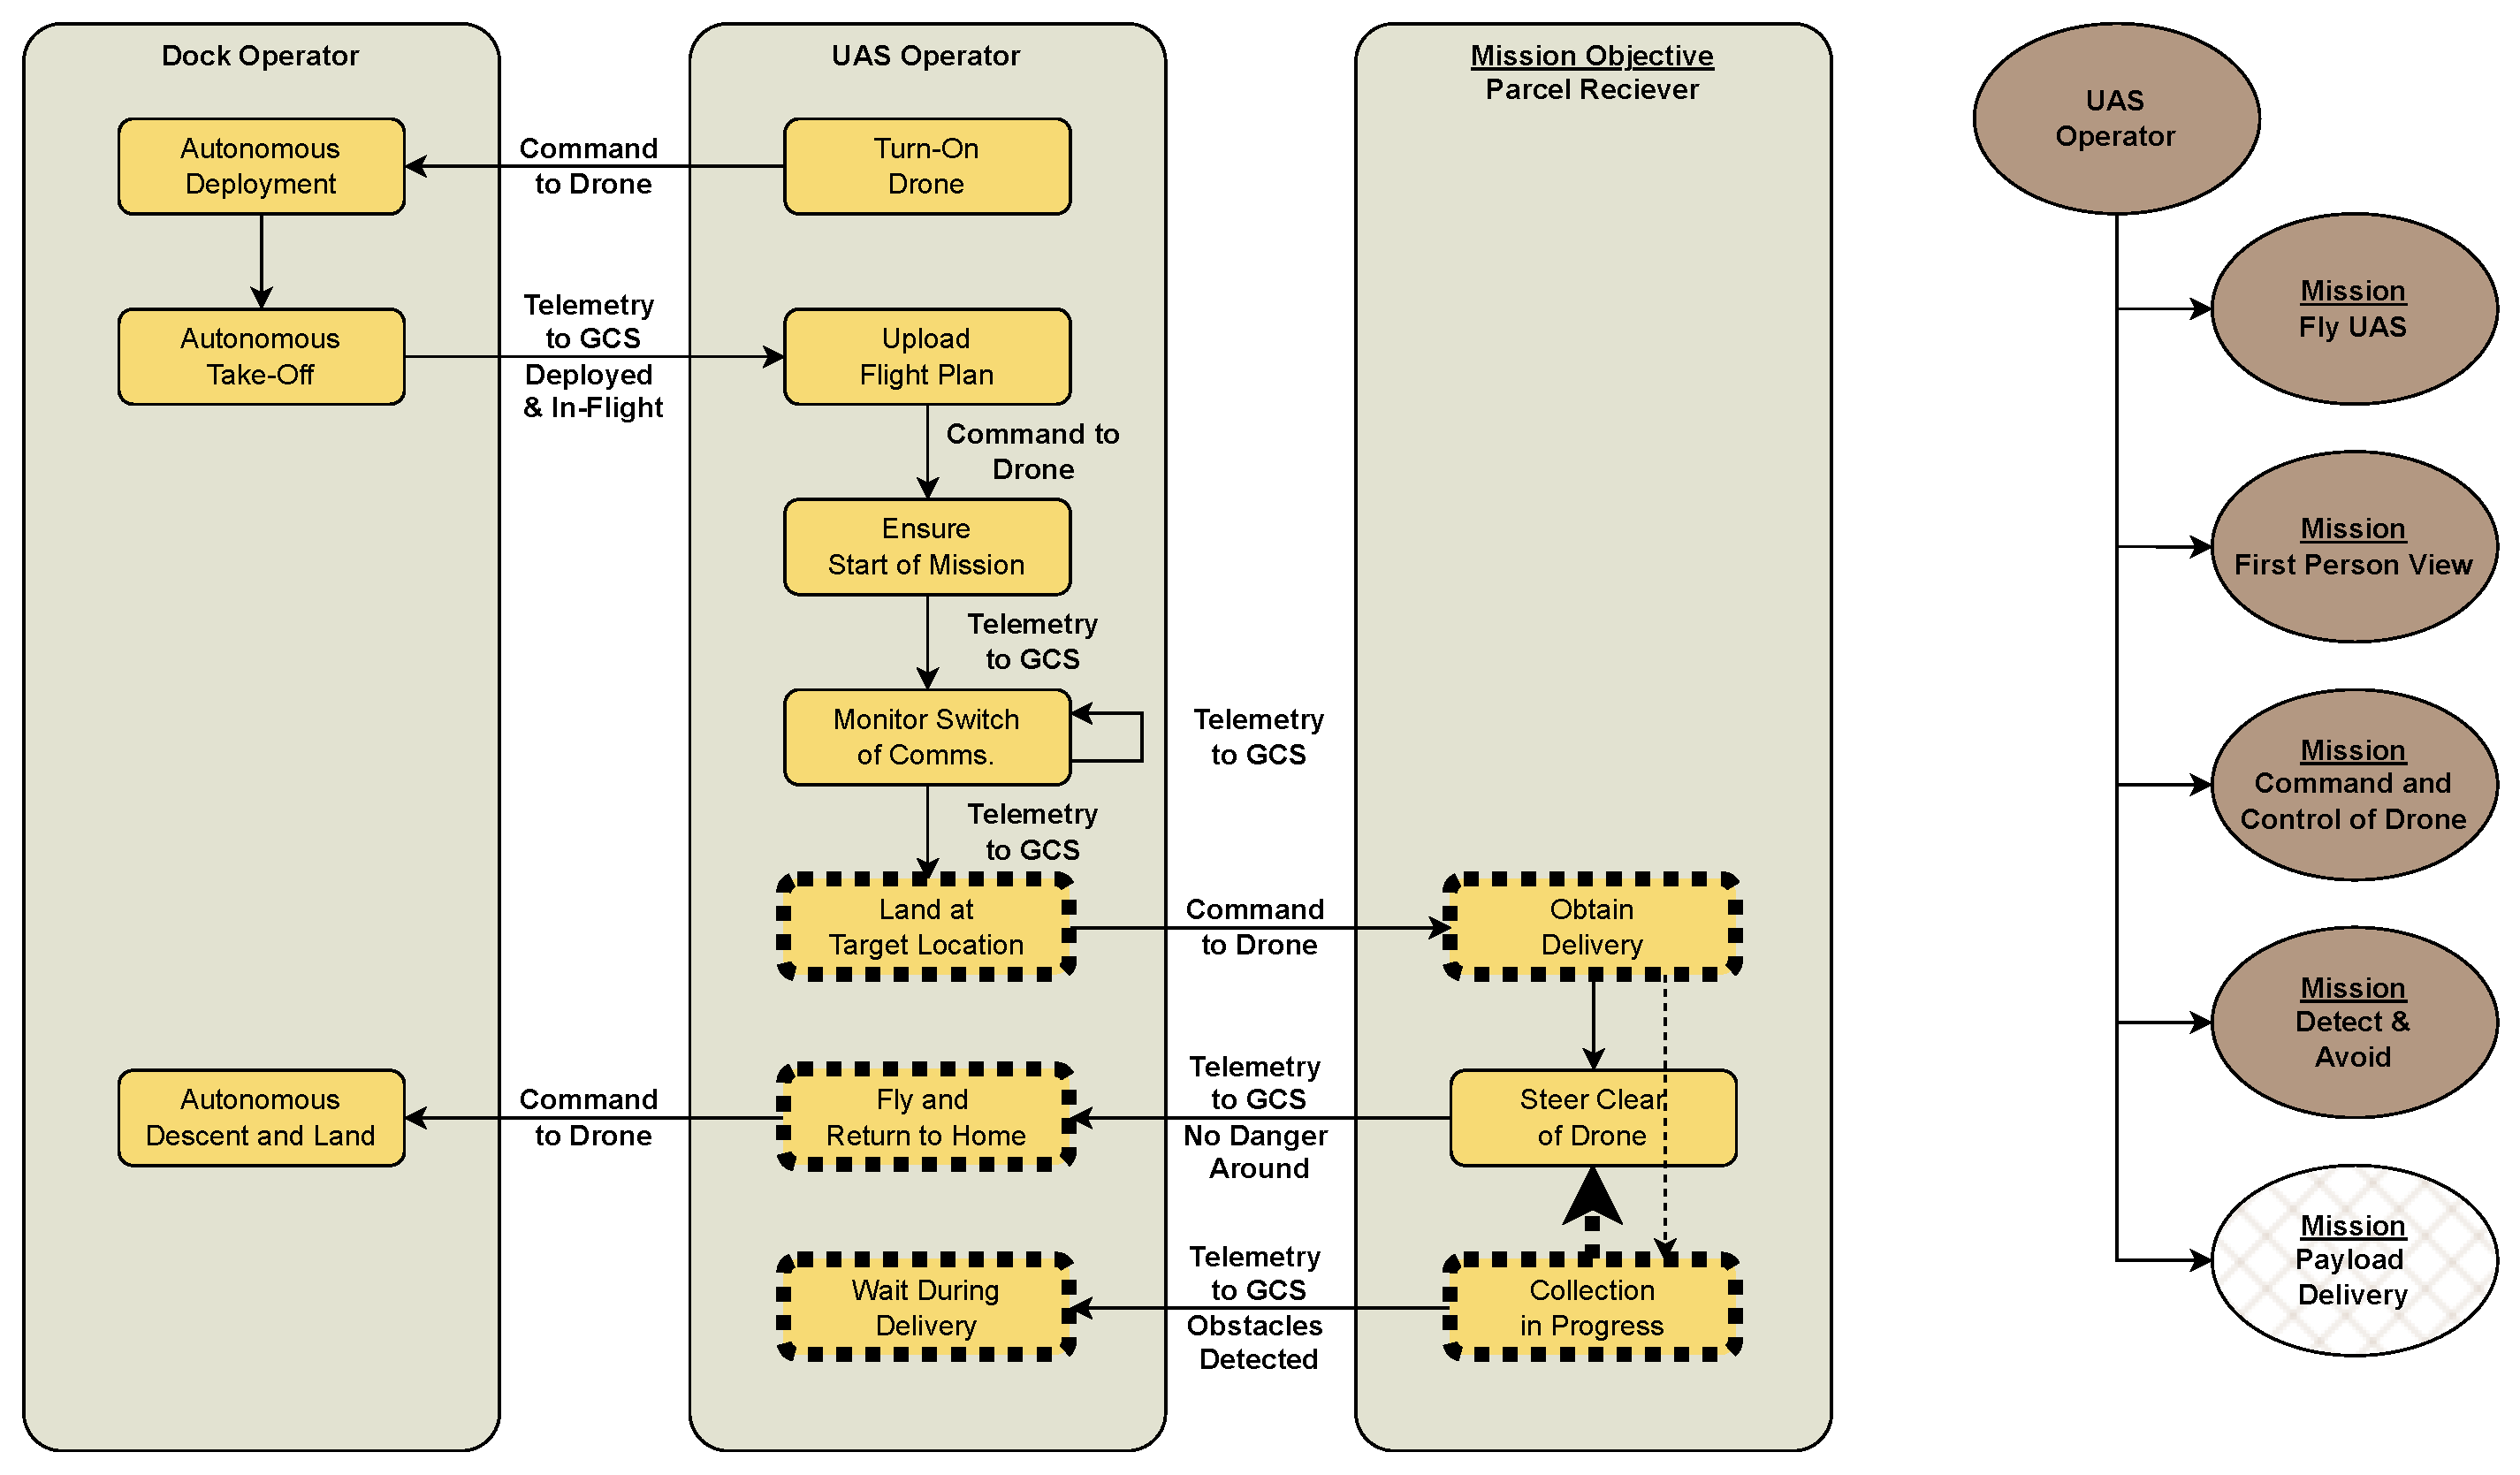
In order to extend the positive benefits of MBSE, the key question lies in how UAS operators can use the current designs in this research and apply them to their own-use cases. Recalling the operational use case shown in Figure 3, it described UAS operators flying drones to perform aerial inspection of power transmission lines, and the operational diagram can be adapted to that shown in Figure 9.
This adaptation of the operational diagram reflects that a parcel-delivery drone needs to land on the ground for the parcel receiver to retrieve the parcel in the drone’s payload box. As such, the drone cannot abort the mission and fly back to the home destination. Instead, the drone in its idle state can only wait until the parcel receiver steers clear of the drone. Only when the drone senses that the parcel receiver has steered clear can the UAS operator control the drone to take-off and fly back home to its docking station.
These changes in the operational diagram show that operational complexity increases when humans need to interact with an idle drone on the ground. However, the quick and easy modifications documented in the operational diagram help UAS operators coordinate with relevant engineers, i.e., mechanical, electronics, and software engineers, to communicate effectively on the changes requested by new clients who engage in their UAS services.
Not only that, but this paper makes a claim that the implemented changes can be consolidated in documents, with the aid of MBSE diagrams, for regulators to better understand and review. In fact, this will reduce the approval barriers, as the MBSE diagrams act as a standardized medium for reviewers. This is because the goal of this paper is to reduce the administrative burden on reviewers (by standardizing the syntax of such diagrams), who can instead focus on the actual content specific to the drone operations that requires review.
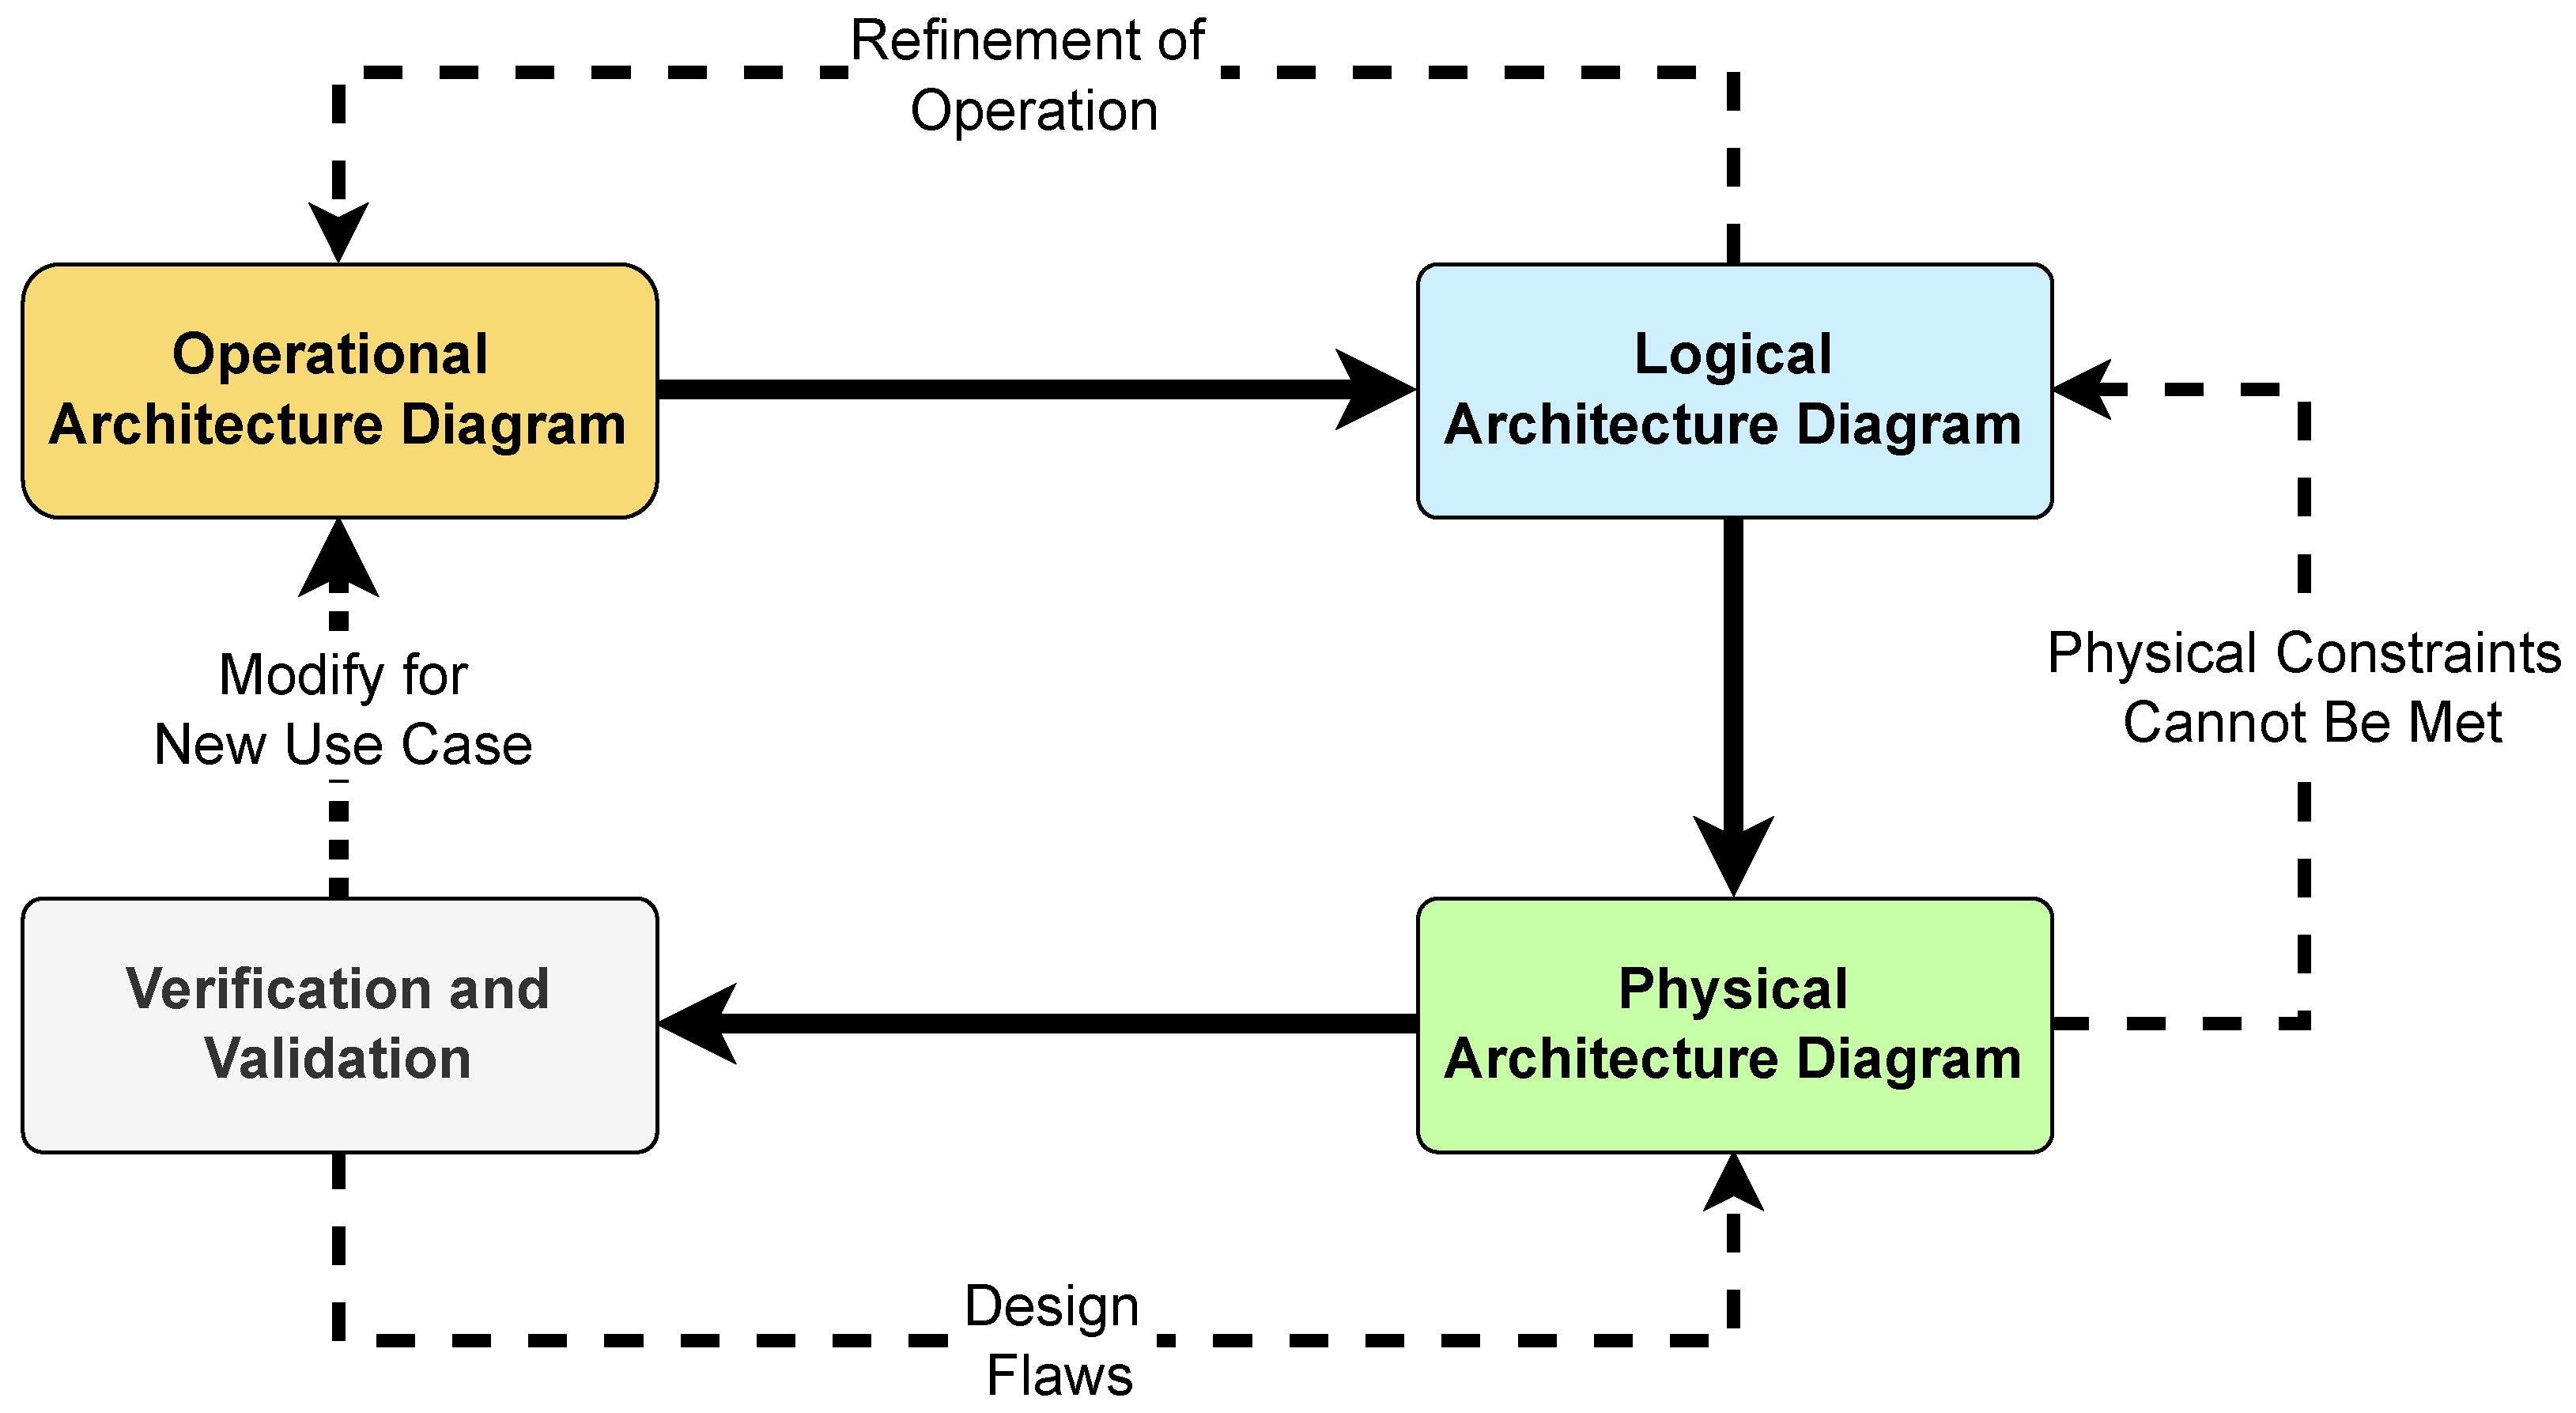
In summary, we have seen and understood the MBSE process, as we learned from the high-level operational diagram shown in Figure 3, followed by the logical architecture diagram shown in Figure 5, and the physical architecture diagram shown in Figure 7. With the positive verification and validation in Section 4 and the further adaptation in Figure 9, this learning cycle, which can be adopted by UAS operators, is well-illustrated in Figure 10.

5. Conclusions

This paper presented a custom MBSE process for the design, verification, and validation of C2 data links supporting BVLOS UAS operations. The approach enables traceability for operational activities through logical and physical architectures to verifiable software behavior, supporting integration of complex requirements across regulators, telecom systems and avionics.
Model-driven verification demonstrates that targeted software improvements can yield substantial performance gains: sender throughput doubled, GCS throughput tripled, and delivery success rate increased from 41% to 82%. Timing-critical behavior was also validated, with link failover achieved in ∼0.12 s and stable post-failure performance (54 ms RTT, 0% packet loss), improving C2 availability.
These results show that MBSE provides a scalable and iterative framework for defining and verifying key BVLOS performance metrics, enabling focused design improvements and supporting regulatory alignment. The approach offers a transferable baseline for similar operational scenarios and facilitates faster adaptation to evolving safety and technical requirements.
Future work will focus on physical validation through hardware-in-the-loop testing and real-world BVLOS flight trials to assess latency, jitter, packet loss and failover performance under representative operational conditions.

Author Contributions

Conceptualization, B.T.W.C., R.T.R. and M.L.; methodology, B.T.W.C. and R.T.R.; software, B.T.W.C.; validation, B.T.W.C.; formal analysis, B.T.W.C.; investigation, B.T.W.C.; resources, R.T.R. and M.L.; data curation, B.T.W.C.; writing—original draft preparation, B.T.W.C.; writing—review and editing, R.T.R. and M.L.; visualization, B.T.W.C.; supervision, R.T.R. and M.L.; project administration, R.T.R. All authors have read and agreed to the published version of the manuscript.

Funding

This work is partially conducted under the ShapeFuture project, funded by the Chips Joint Undertaking and national funding agencies under grant agreement No. 101139996.

Data Availability Statement

The data presented in this study are available on request from the corresponding author.

Conflicts of Interest

Author Morten Larsen was employed by the company AnyWi Technologies. The remaining authors declare that the research was conducted in the absence of any commercial or financial relationships that could be construed as a potential conflict of interest.

References

  1. Boedecker, H. Global Drone Industry Review 2025|Drone Industry Insights 2025; Technical Report; Drone Industry Insights: Hamburg, Germany, 2025. [Google Scholar]
  2. Alvarado, E. Global Drone Industry Review 2024|Drone Industry Insights 2025; Technical Report; Drone Industry Insights: Hamburg, Germany, 2024. [Google Scholar]
  3. Kay, W. The State of the Drone Industry 2025—Free White Paper|Drone Industry Insights 2025; Technical Report; Drone Industry Insights: Hamburg, Germany, 2025. [Google Scholar]
  4. Nikodem, F.; Rothe, D.; Dittrich, J.S. Operations Risk Based Concept for Specific Cargo Drone Operation in Low Altitudes. In Automated Low-Altitude Air Delivery: Towards Autonomous Cargo Transportation with Drones; Springer International Publishing: Cham, Switzerland, 2022; pp. 25–48. [Google Scholar] [CrossRef] [Scilit]
  5. Habibi, H.; Rao, D.M.K.K.V.; Sanchez-Lopez, J.L.; Voos, H. On SORA for High-Risk UAV Operations under New EU Regulations: Perspectives for Automated Approach. arXiv 2023. [Google Scholar] [CrossRef] [Scilit]
  6. Martinez, C.; Sanchez-Cuevas, P.J.; Gerasimou, S.; Bera, A.; Olivares-Mendez, M.A. SORA Methodology for Multi-UAS Airframe Inspections in an Airport. Drones 2021, 5, 141. [Google Scholar] [CrossRef] [Scilit]
  7. Politi, E.; Varlamis, I.; Tserpes, K.; Larsen, M.; Dimitrakopoulos, G. The future of safe BVLOS drone operations with respect to system and service engineering. In 2022 IEEE International Conference on Service-Oriented System Engineering (SOSE); IEEE: New York, NY, USA, 2022; pp. 133–140. [Google Scholar]
  8. Terkildsen, K.H.; Jensen, K. Towards a Tool for Assessing UAS Compliance with the JARUS SORA Guidelines. In 2019 International Conference on Unmanned Aircraft Systems (ICUAS); IEEE: New York, NY, USA, 2019; pp. 460–466. [Google Scholar]
  9. Rothe, D.; Nikodem, F. System Architectures and Its Development Efforts Based on Different Risk Classifications. In Automated Low-Altitude Air Delivery: Towards Autonomous Cargo Transportation with Drones; Springer International Publishing: Cham, Switzerland, 2022; pp. 263–288. [Google Scholar] [CrossRef] [Scilit]
  10. Rakotonarivo, B.; Drougard, N.; Conversy, S.; Garcia, J. Supporting drone mission planning and risk assessment with interactive representations of operational parameters. In 2022 International Conference on Unmanned Aircraft Systems (ICUAS); IEEE: New York, NY, USA, 2022; pp. 1091–1100. [Google Scholar]
  11. European Union Aviation Safety Agency (EASA). Drone Operations in EASA Member States—Statistics and Key; Information from Your Member State|EASA; EASA: Cologne, Germany, 2025. [Google Scholar]
  12. Janke, C.; de Haag, M.U. Implementation of European Drone Regulations - Status Quo and Assessment. J. Intell. Robot. Syst. 2022, 106, 33. [Google Scholar] [CrossRef] [Scilit]
  13. European Union Aviation Safety Agency (EASA). Specific Operations Risk Assessment (SORA); EASA: Cologne, Germany, 2023. [Google Scholar]
  14. Ministerie van Infrastructuur en Waterstaat. Technische Eisen Dronecategorie Specifiek; Ministerie van Infrastructuur en Waterstaat: The Hague, The Netherlands, 2025. [Google Scholar]
  15. Schalk, L.M.; Becker, D. Data Link Concept for Unmanned Aircraft in the Context of Operational Risk. In Automated Low-Altitude Air Delivery: Towards Autonomous Cargo Transportation with Drones; Springer International Publishing: Cham, Switzerland, 2022; pp. 303–332. [Google Scholar] [CrossRef] [Scilit]
  16. Badra, A.A.; Aïello, O.; Chaudemar, J.C. Applying a Model-Based Systems Engineering Approach to Model an Unmanned Aerial Vehicle Mission. In 2023 IEEE International Systems Conference (SysCon); IEEE: New York, NY, USA, 2023; pp. 1–7. [Google Scholar] [CrossRef] [Scilit]
  17. Peinecke, N.; Muhlhausen, T. Cargo Drone Airspace Integration in Very Low Level Altitude. In Automated Low-Altitude Air Delivery: Towards Autonomous Cargo Transportation with Drones; Springer International Publishing: Cham, Switzerland, 2022; pp. 247–262. [Google Scholar] [CrossRef] [Scilit]
  18. Tsotra, A. Critical Comparative Analysis of UAS Legislative Developments. ISPRS Ann. Photogramm. Remote Sens. Spat. Inf. Sci. 2024, X-4/W4-2024, 223–230. [Google Scholar] [CrossRef] [Scilit]
  19. Song, H.; Chung, J.M. Next-generation wireless communication technologies for improved disaster response and management. ETRI J. 2025, 47, 375–392. [Google Scholar] [CrossRef] [Scilit]
  20. Braunfelds, J.; Jakovels, G.; Murans, I.; Litvinenko, A.; Senkans, U.; Rumba, R.; Onzuls, A.; Valters, G.; Lidere, E.; Plone, E. Experimental Study on LTE Mobile Network Performance Parameters for Controlled Drone Flights. Sensors 2024, 24, 6615. [Google Scholar] [CrossRef] [Scilit] [PubMed]
  21. Kasurinen, T. LTE Mobile Network Technical Feasibility for Unmanned Aerial Vehicle BVLOS operations in a Rural Test Area. In Proceedings of the SESAR Innovations Days, Seville, Spain, 27–30 November 2023. [Google Scholar]
  22. Thangadorai, K.K.; Prakash, M.; Baddeley, M.; Pandey, A.; Sivalingam, K.M. Extending Boundaries with WiLong: A Field Study on Long-Range Wi-Fi Mesh Custom Solution. In 2024 IEEE 49th Conference on Local Computer Networks (LCN); IEEE: New York, NY, USA, 2024; pp. 1–9. [Google Scholar]
  23. Nagarajan, R.; Sixsmith, A. Policy Initiatives to Address the Challenges of an Older Population in the Workforce. Ageing Int. 2021, 48, 41–77. [Google Scholar] [CrossRef] [Scilit] [PubMed]
  24. Zomerdijk, W.; Gusain, D.; Palensky, P.; Cvetkovic, M. Open Data Based Model of the Dutch High-Voltage Power System. In 2022 IEEE PES Innovative Smart Grid Technologies Conference Europe (ISGT-Europe); IEEE: New York, NY, USA, 2022; pp. 1–6. [Google Scholar]
  25. Netherlands Aerospace Centre (NLR). Enabling Safe and Seamless Drone Operations; NLR: Amsterdam, The Netherlands, 2025. [Google Scholar]
  26. Lee, H.; Hwang, Y.M.; Lee, J.; Kim, N.W.; Ko, S.K. A Drone-Driven X-Ray Image-Based Diagnosis of Wind Turbine Blades for Reliable Operation of Wind Turbine. IEEE Access 2024, 12, 56141–56158. [Google Scholar] [CrossRef] [Scilit]
  27. Salma, V.; Schmehl, R. Operation Approval for Commercial Airborne Wind Energy Systems. Energies 2023, 16, 3264. [Google Scholar] [CrossRef] [Scilit]
  28. Tee, B.W.C.; Rajan, R.T.; Larsen, M. Achieving Coverage, Capacity and Quality in C2 Data Links for BVLOS UAS Operations. In Proceedings of the International Conference on Telecommunications (ICT), Thessaloniki, Greece, 20–22 May 2026. [Google Scholar]
  29. Finkhauser, J.; Larsen, M. Reliable Command, Control and Communication Links for Unmanned Aircraft Systems: Towards compliance of commercial drones. In DroneSE and RAPIDO ’21: Proceedings of the 2021 Drone Systems Engineering and Rapid Simulation and Performance Evaluation: Methods and Tools Proceedings; Association for Computing Machinery: New York, NY, USA, 2021. [Google Scholar] [CrossRef] [Scilit]
  30. ADACORSA Consortium. Airborne Data Collection on Resilient System Architectures (ADACORSA), ECSEL Joint Undertaking Grant Agreement No. 876019. Available online: https://cordis.europa.eu/project/id/876019 (accessed on 1 May 2026).
Figure 1. Six key objectives filtered from a list of twenty-four operational safety objectives that are related to C2 data links in terms of technical challenges, human error, or adverse operating conditions.
Drones 10 00397 g001
Figure 2. OSI model standardizes network communication into seven layers, clarifying processes from physical transmission to application-level services.
Drones 10 00397 g002
Figure 3. The mission capability diagram shows a list of mission aspects that must be fulfilled by the UAS operator. The operational diagram shows how the UAS operator commands the drone from Dock-to-Target Destination while controlling from a ground control system; solid lines indicate normal transitions between operational activities, while dotted lines indicate transitions to sudden (contingency) activities.
Drones 10 00397 g003
Figure 4. Sequence diagram shows the time-ordered interactions between system components during the operation to validate the requirements and constraints of a C2 data link in a drone.
Drones 10 00397 g004
Figure 5. Logical architecture diagram shows the functional components between each system component. Each solid line represents a function between functional components with specifications on exposed component interface for a C2 data link on a drone.
Drones 10 00397 g005
Figure 6. System architecture is a conceptual representation of the software design to aid in developing software features for a C2 data link on a drone [29].
Drones 10 00397 g006
Figure 7. Physical architecture diagram shows the finer details that include implementation components in the C2 data-link software meant for a drone. The solid lines represent the physical links between implementation components while the dotted lines represent the future software add-ons.
Drones 10 00397 g007
Figure 8. Network block diagram shows four virtual machines with client and server software running separately. Each virtual machine is programmed with specific IP addresses as part of the dual network paths.
Drones 10 00397 g008
Figure 9. Operational and mission capability diagram for parcel delivery. The dotted boxes represent the change from the original operational diagram meant for power transmission lines/tower inspection.
Drones 10 00397 g009
Figure 10. Summary of the MBSE process: starting from the high-level operational diagram, through logical and physical architectures, to verification and validation and operational adaptation illustrating the iterative learning cycle for UAS operators.
Drones 10 00397 g010
Table 1. Ten Steps of SORA.
StepDescriptionRemarks
1Concept of Operations (ConOps) DescriptionGather all technical, operational, and system information necessary to assess the risks of the intended UAS operation.
2Initial Ground Risk Class (GRC)Assess intrinsic factors such as UAS weight.
3Final GRCConsider design aspects and mitigation measures to establish the final GRC.
4Initial Air Risk Class (ARC)Evaluate the initial air risk based on the characteristics of the airspace.
5Residual ARCAssess residual air risk after applying strategic mitigation.
6Tactical Mitigation Performance Requirements (TMPR)Manage any remaining mid-air collision risks.
7Determine Specific Assurance Integrity Level (SAIL)Based on ConOps, final GRC and residual ARC.
8Determine Containment RequirementsEnsure that the target level of safety is achieved for ground and air risks.
9Identify Operational Safety Objectives (OSO)Demonstrate compliance with 24 OSOs at the required robustness levels.
10Comprehensive Safety PortfolioDemonstrate compliance with SORA regulations and document previous steps.
Table 2. Drone Operations in EASA Member States Ranked by Operational Authorization as shown by highest ranked with most dense shading [11].
No.CountryOrganisationNumber of Registered
Drone Operators
Number of OASTSA1/A2/A3STS/OA
19PolandUrząd Lotnictwa Cywilnego222,19034912,794209,81937
13GermanyBundesministerium für Digitales und Verkehr (BMDV)694,00028911346,6000
20Czech RepublicCivil Aviation Authority of the Czech Republic54,782272060,6360
10NetherlandsHuman Environment and Transport Inspectorate66,22824533072741
14FranceCabinets ministériels117,598195047,3890
2NorwayCAA Norway23,66016721534,5131
5DenmarkTrafikstyrelsen—Droner8315121151132,18512
4FinlandFinnish Transport and Communications Agency Traficom17,600911027,5000
9IrelandIrish Aviation Authority64516654619,2388
24SloveniaCivil Aviation Agency Slovenia57636415954542
17SpainAESA94,0334643,255140,432940
21AustriaAustro Control51,97844076,2620
28Greece-11,35042016,2100
15SwitzerlandFederal Office of Civil Aviation FOCA67,20033561,3310
23HungaryLégügyi Kockázatértékelési Hatósági Főosztály460331037520
3SwedenTransport Styrelsen39,03529057,3940
18ItalyItalian Civil Aviation Authority110,51822037,2340
26Romania-14,7102189898989428
8LithuaniaLietuvos Respublikos Seimo kanceliarija, biudžetinė įstaiga558319397409321
6EstoniaEstonian Transport Administration2976151048451
16PortugalANAC—Autoridade Nacional da Aviação Civil11,46012044880
25CroatiaCroatian Civil Aviation Agency262811065450
7LatviaCivilās aviācijas aģentūra4391104966965
11BelgiumFOD Mobiliteit en Vervoer23,1128018,9660
12LuxembourgDirection de l’Aviation Civile30634094,3620
27BulgariaDirectorate General “Civil Aviation Administration”33611026420
1IcelandThe Icelandic Transport Authority1562009300
22SlovakiaTransport Authority858001000
Table 3. Bandwidth test results for C2 data-link software comparing baseline and revised software implementations under identical hardware conditions. Sender transfer increased from 0.92 to 2.01 MBytes, GCS-received data increased from 0.38 to 1.65 MBytes, and delivery success rate improved from 41.72% to 82.09%.
MetricOriginal
Scheduler Software
Modified
Scheduler Software
Change
Total Data Transmitted0.92 MBytes2.01 MBytes+118%
Data Received by GCS0.38 MBytes1.65 MBytes+334%
Delivery Success Rate41.72%82.09%+96.7%
Table 4. Baseline Results for Original Scheduler Software.
IntervalTransferBitrateRetransmissions
(Retr)
Congestion
Window (Cwnd)
0.00–1.00 s76.4 KBytes625 Kbits/s032.5 KBytes
1.00–2.00 s173 KBytes1.41 Mbits/s042.4 KBytes
2.00–3.00 s0.00 Bytes0.00 bits/s043.8 KBytes
3.00–4.00 s96.2 KBytes788 Kbits/s048.1 KBytes
4.00–5.00 s127 KBytes1.04 Mbits/s059.4 KBytes
5.00–6.00 s191 KBytes1.56 Mbits/s079.2 KBytes
6.00–7.00 s0.00 Bytes0.00 bits/s097.6 KBytes
7.00–8.00 s255 KBytes2.09 Mbits/s0117 KBytes
8.00–9.00 s0.00 Bytes0.00 bits/s3117 KBytes
9.00–10.00 s0.00 Bytes0.00 bits/s1483.4 KBytes
0.00–10.00 s918 KBytes752 Kbits/s17Sender
0.00–11.95 s383 KBytes263 Kbits/s Receiver
Table 5. Results for Modified Scheduler Software.
IntervalTransferBitrateRetransmissions
(Retr)
Congestion
Window (Cwnd)
0.00–1.00 s341 KBytes2.79 Mbits/s045.2 KBytes
1.00–2.00 s255 KBytes2.09 Mbits/s053.7 KBytes
2.00–3.00 s127 KBytes1.04 Mbits/s062.2 KBytes
3.00–4.00 s191 KBytes1.56 Mbits/s070.7 KBytes
4.00–5.00 s382 KBytes3.13 Mbits/s087.7 KBytes
5.00–6.00 s0.00 Bytes0.00 bits/s1274.9 KBytes
6.00–7.00 s255 KBytes2.09 Mbits/s680.6 KBytes
7.00–8.00 s255 KBytes2.09 Mbits/s094.7 KBytes
8.00–9.00 s255 KBytes2.09 Mbits/s965.0 KBytes
9.00–10.00 s0.00 Bytes0.00 bits/s073.5 KBytes
0.00–10.00 s2.01 MBytes1.69 Mbits/s27Sender
0.00–10.46 s1.65 MBytes1.32 Mbits/sReceiver
Disclaimer/Publisher’s Note: The statements, opinions and data contained in all publications are solely those of the individual author(s) and contributor(s) and not of MDPI and/or the editor(s). MDPI and/or the editor(s) disclaim responsibility for any injury to people or property resulting from any ideas, methods, instructions or products referred to in the content.