Article

Energy-Aware Multilingual Vision–Language Models for Drone Smart Sensing

1
Department of Computer Applications in Science & Engineering, BARCELONA Supercomputing Center, 08034 Barcelona, Spain
2
Escuela Técnica Superior de Ingeniería (ICAI), Universidad Pontificia Comillas, 28015 Madrid, Spain
3
Estudis d’Informàtica, Multimèdia i Telecomunicació, Universitat Oberta de Catalunya, 08018 Barcelona, Spain
4
Department of Electrical and Computer Engineering, Boston University, Boston, MA 02215, USA
5
Human Centered AI, Data & Software, LUXEMBOURG Institute of Science and Technology, 4362 Esch-sur-Alzette, Luxembourg
6
Departamento de Informática de Sistemas y Computadores, Universitat Politècnica de València, 46022 València, Spain
*
Author to whom correspondence should be addressed.
Drones 2026, 10(5), 361; https://doi.org/10.3390/drones10050361
Submission received: 8 April 2026 / Revised: 4 May 2026 / Accepted: 7 May 2026 / Published: 9 May 2026
(This article belongs to the Special Issue Drone-Enabled Smart Sensing: Challenges and Opportunities)

Highlights

What are the main findings?
  • Inference energy and task accuracy are statistically independent (Spearman ρ = 0.001 , p = 0.995 ) across five open-source VLMs and thirteen languages, enabling energy-aware model selection without perception penalty; Phi-3-V, LLaVA-1.5, and LLaVA-1.6 form a Pareto-efficient frontier spanning a 2.5 × energy range ( 66.3 130.0  Wh per 1000 queries).
  • Low-resource languages (Arabic, Basque, and Luxembourgish) incur a double penalty: they simultaneously lower task accuracy and, for Arabic, result in substantially higher inference energy costs (up to 0.571 in score and + 90.4  Wh/1K), while Basque triggers inference collapse rather than genuine efficiency gains.
What are the implications of the main findings?
  • A formal UAV query budget model identifies the Pareto-optimal VLM for any platform; on the DJI Matrice 300 RTK LLaVA-1.6 is preferred, while the energy-constrained Matrice 30 calls for LLaVA-1.5, providing actionable guidelines for energy-aware drone smart sensing deployment.
  • The documented double penalty for low-resource languages has direct regulatory relevance under the EU AI Act’s non-discrimination requirements, underscoring the need for targeted multilingual fine-tuning before deploying VLM-based UAV perception systems in non-English-dominant operational regions.

Abstract
Drone-based smart sensing increasingly relies on Vision–Language Models (VLMs) for real-time scene interpretation, obstacle detection, and autonomous navigation reasoning. Deploying such systems at scale demands not only high perceptual accuracy but also energy efficiency, a critical constraint on battery-powered Unmanned Aerial Vehicle (UAV) platforms, and linguistic flexibility for multinational operational contexts. We present a systematic benchmarking framework that jointly evaluates perception performance and inference energy for five open-source VLMs across thirteen languages spanning six language families, including three low-resource varieties (Arabic, Basque, and Luxembourgish). Using imagery sampled from the Berkeley DeepDrive 10K (BDD10K), each model is evaluated on four sensing tasks of increasing difficulty scored via a sentence-transformer backbone, with energy measured following the AI Energy Score methodology (Wh per 1000 queries) through continuous NVML-based GPU power sampling. Across 65 language–model observations, LLaVA-1.6 achieves the highest perception score ( S ¯ = 0.160 ) while Phi-3-Vision attains the best energy efficiency ( 66.3 Wh/1000 queries); energy consumption and task accuracy are statistically uncorrelated (Spearman ρ = 0.001 ; p = 0.995 ). A formal UAV inference energy model instantiated for four commercial platforms confirms LLaVA-1.6 as Pareto-optimal on heavy-lift platforms (DJI Matrice 300/350 RTK) and LLaVA-1.5 on the energy-constrained Matrice 30; compact UAVs such as the Mavic 3 Enterprise exceed the budget of all evaluated models at standard query rates. Friedman tests reveal significant cross-language variability in energy demands ( χ 2 = 40.43 ; p = 3.5 × 10 8 ) and navigation reasoning performance ( χ 2 = 13.35 ; p = 0.010 ). Critically, we document a double penalty for low-resource languages, which simultaneously incur higher inference energy costs and lower task accuracy, with direct implications for equitable multilingual UAV deployments.

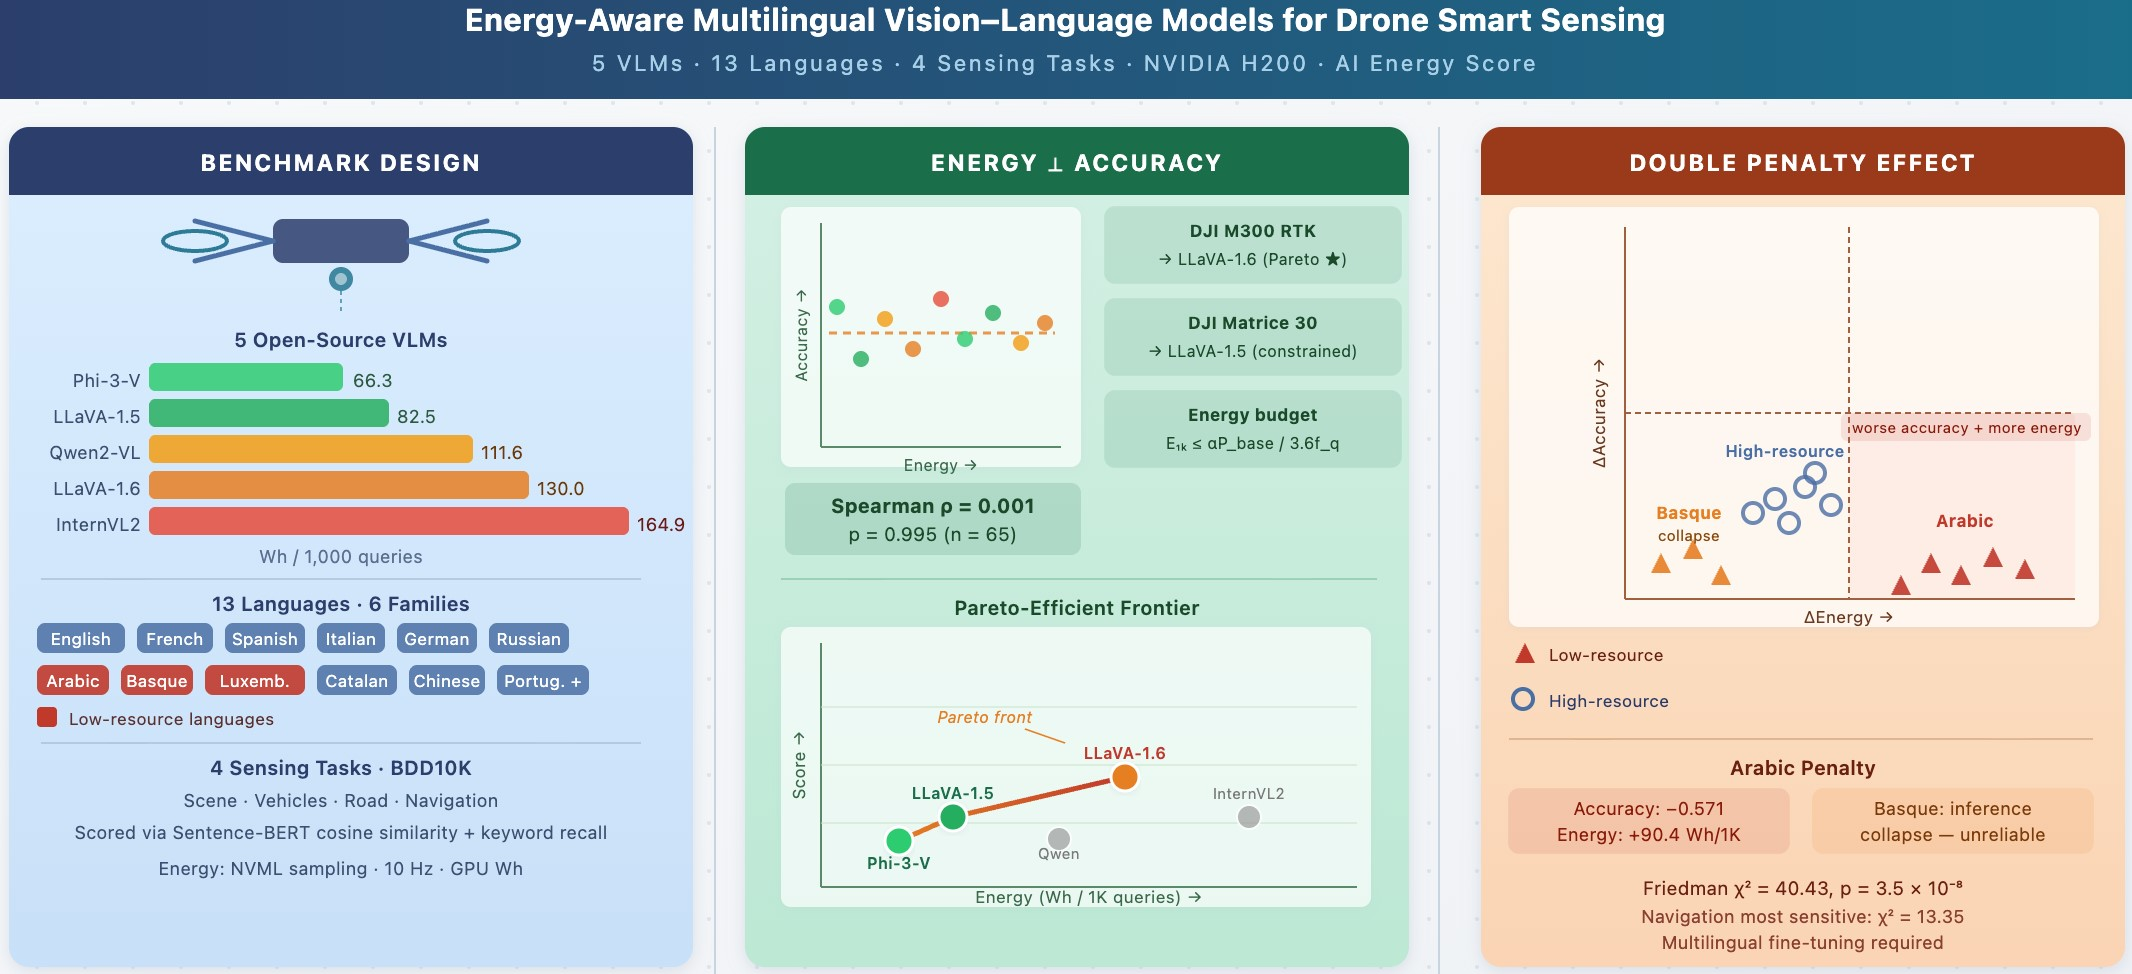
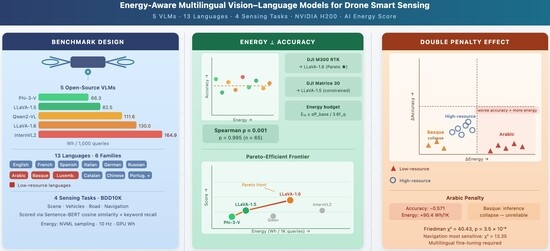
Graphical Abstract

1. Introduction

Unmanned aerial vehicles (UAVs) have rapidly matured from niche military platforms into versatile tools for civil and industrial smart sensing. Applications now span precision agriculture, infrastructure inspection, search-and-rescue, border surveillance, urban air mobility, and disaster response, contexts in which a drone must not merely capture imagery, but also understand it in real time and act upon that understanding autonomously [1,2]. This semantic gap between raw pixel data and actionable situational awareness has motivated the integration of Vision–Language Models (VLMs), multimodal neural architectures that jointly process visual inputs and natural-language queries, into the onboard perception stack of autonomous UAV systems [3,4]. By enabling a drone to answer questions such as “are there obstacles ahead?” or “describe the terrain below” in natural language, VLMs unlock richer human–machine interaction and support higher-level navigation reasoning that purely vision-based detectors cannot provide [2,5,6,7].
Despite this promise, deploying large VLMs on battery-powered UAV platforms raises a fundamental tension between perceptual capability and energy efficiency. The energy footprint of deep learning inference is substantial and growing: Strubell et al. [8] first quantified the carbon cost of large-model training, while Schwartz et al. [9] called for a Green AI paradigm that weighs efficiency alongside accuracy. More recent surveys confirm that inference, not merely training, now constitutes a dominant and fast-expanding fraction of AI energy consumption in production systems [10,11,12]. For UAVs specifically, energy is a first-class resource constraint: every watt drawn by an inference accelerator directly curtails flight endurance, so the choice of onboard model carries operational as well as environmental consequences [13,14].
Commercial smart-sensing platforms such as the DJI Matrice 300 RTK (DJI Technology Co., Ltd., Shenzhen, China) [15] and Matrice 30 [16], with total battery capacities of 548 Wh (two TB60 batteries) and 131.6 Wh, and baseline power draws of 598 W and 193 W yielding maximum endurance of 55 min and 41 min respectively (DJI official specifications; no-payload condition), illustrate this constraint: a VLM inference accelerator drawing even 10% of available energy directly reduces hover endurance by several minutes, a non-trivial operational penalty in time-critical missions such as search-and-rescue or border surveillance. The DJI Mavic 3 Enterprise ( B = 77  Wh; T 0 = 45  min) and Matrice 350 RTK ( B = 322.8  Wh; T 0 = 55  min) further span the enterprise performance spectrum from portable reconnaissance to heavy-lift inspection [17,18].
Standardised measurement frameworks such as the AI Energy Score [19], which reports energy in Wh per 1000 queries through continuous NVIDIA Management Library (NVML)-based Graphics Processing Unit (GPU) power sampling [20,21], now make it possible to compare inference efficiency across heterogeneous model families on a common footing, yet this methodology has not previously been applied to VLMs in a UAV sensing context.
A second, often overlooked, dimension of real-world UAV deployment is linguistic diversity. Drone operators, ground-control personnel, and autonomous flight-management systems increasingly operate across national and linguistic boundaries: border patrol missions may require Arabic or Luxembourgish interfaces, search-and-rescue operations in the Basque Country or Catalonia demand regional-language support, and multinational peacekeeping or disaster response missions may involve a dozen languages simultaneously. Multilingual evaluation of Large Language Models (LLMs) has advanced considerably in the text-only domain, from cross-lingual generalisation benchmarks such as Cross-lingual TRansfer Evaluation of Multilingual Encoders (XTREME) [22] and XGLUE [23], to unsupervised multilingual representations [24] and comprehensive generative AI evaluations such as Massively Multilingual Evaluation of Generative AI (MEGA) [25] and the ChatGPT (gpt-3.5-turbo) multilingual study by Lai et al. [26], but equivalent studies for multimodal models in safety-critical perception tasks remain scarce. Critically, tokeniser inequity between languages introduces a structural disadvantage for low-resource languages [27,28]: models trained predominantly on English-centric corpora may produce shorter, noisier, or semantically weaker outputs when prompted in Arabic, Basque, or Luxembourgish, degrading perception reliability precisely in deployments where linguistic coverage matters most.
Against this backdrop, a joint evaluation of VLM performance and energy efficiency across a broad typological range of languages would provide UAV system designers with the evidence base needed to select appropriate models for energy-constrained, multilingual deployments. To the best of our knowledge, no prior study addresses this intersection: existing VLM benchmarks focus either on accuracy in a single language or on energy in isolation, and no work has yet examined whether the well-documented double penalty experienced by low-resource languages in text-only models, and the simultaneously lower accuracy and higher inference cost per output token, extends to VLMs performing visual reasoning tasks [10,28]. The present work fills this gap. It builds on a previous benchmarking suite on foundation model evaluation [29].
In this paper we present a systematic benchmarking framework that jointly evaluates perception performance and inference energy for five state-of-the-art open-source VLMs (InternVL2-8B, Qwen2-VL-7B-Instruct, LLaVA-1.5-7B, LLaVA-1.6-Mistral-7B, and Phi-3-Vision-128k) across thirteen languages spanning six linguistic families. Each model is evaluated on four sensing tasks of increasing cognitive difficulty (scene understanding, vehicle and obstacle detection, terrain condition analysis, and autonomous navigation reasoning) using imagery from the Berkeley DeepDrive 10K (BDD10K) dataset [30], which we employ as a proxy for the visual complexity and scene diversity characteristic of low-altitude UAV sensing. Responses are scored via cosine similarity against reference embeddings produced by a sentence-transformer backbone [31], and energy is measured following the AI Energy Score methodology [19]. Statistical analysis employs Friedman non-parametric tests across language blocks [32], pairwise Wilcoxon tests with Holm–Bonferroni correction [33], Spearman rank correlations between energy and accuracy [34], and effect sizes following Cohen [35].
The contributions of this work are fourfold and span both methodological tools and empirical findings. We are explicit about which is which because the paper does not introduce a new VLM architecture or a new training method; its contribution lies in the formal and empirical analysis that the existing components do not, individually, support.
  • Methodological: Formal UAV Inference Energy Budget. We derive a closed-form constraint (Equations (1)–(5)) that maps a per-query inference energy figure to a platform-conditioned admissibility set, and reduces VLM model selection to a constrained optimisation over the AI Energy Score. We instantiate the constraint for four commercial DJI platforms (Section 4.6), producing platform-specific Pareto-optimal model recommendations that are not directly derivable from accuracy benchmarks alone.
  • Methodological: Per-Language Energy Decomposition and Multi-Metric Ranking Framework. We extend the AI Energy Score protocol with a language-block decomposition (Equation (12)) that attributes per-language inference energy within a single contiguous measurement window, addressing a gap in the specification, which is monolingual by design. We additionally introduce a multi-metric composite ranking framework (Section 4.5) that combines accuracy, energy, efficiency, four task-type rankings, and consistency into a single ranking lattice, motivated by the absence of pairwise statistical separation in the raw accuracy comparison.
  • Empirical: Joint Energy–Accuracy Benchmark and Orthogonality Finding. We provide one of the first joint energy–accuracy benchmarks of five leading open-source VLMs across thirteen languages on drone-relevant visual sensing tasks, establishing a reproducible baseline for energy-aware VLM selection in UAV deployments, and demonstrating that inference energy and task accuracy are statistically uncorrelated (Spearman ρ = 0.001 , p = 0.995 ).
  • Empirical: Multimodal Extension of the Double-Penalty Effect. We document and quantify the double-penalty effect in VLMs, previously theorised for text-only LLMs on tokeniser fertility grounds [28] but not, to our knowledge, established in the multimodal setting: Arabic, Basque, and Luxembourgish simultaneously incur higher inference energy costs and lower task accuracy relative to high-resource languages, with direct implications for equitable multinational UAV deployments under the EU AI Act [36]. We further decompose the effect into Arabic over-generation and Basque collapse, two structurally distinct failure modes with different operational implications.
The remainder of the paper is organised as follows. Section 2 reviews related work on VLM architectures, multilingual evaluation, and AI energy measurement. Section 3 describes the experimental framework, dataset, task design, scoring protocol, and energy monitoring methodology. Section 4 presents the empirical results across models, languages, tasks, and difficulty levels. Section 5 interprets the findings, discusses the double-penalty effect, and provides practical deployment guidelines. Section 6 presents mitigation strategies, deployment guidance, and implications for VLM design. Section 7 summarises conclusions and directions for future work.

2. Related Work

We organise the literature across five threads that converge in the present study: Vision–Language Model architectures (Section 2.1); UAV smart sensing and aerial scene understanding (Section 2.2); multilingual evaluation of foundation models (Section 2.3); AI energy efficiency measurement (Section 2.4); and benchmarking datasets for autonomous perception (Section 2.5).

2.1. Vision–Language Model Architectures

The transformer architecture of Vaswani et al. [1] underpins virtually every contemporary large language and multimodal model, enabling scalable self-attention over arbitrarily long token sequences. Extending this paradigm to vision–language tasks required bridging a frozen (or fine-tuned) visual encoder with a language backbone: early contrastive approaches such as CLIP [37] aligned image and text representations in a shared embedding space via self-supervised pretraining on web-scale paired data, establishing the representational foundation on which later generative VLMs are built. BLIP-2 [38] introduced the Querying Transformer (Q-Former) as a lightweight bridge between a frozen image encoder and a frozen large language model, demonstrating that strong visual question-answering performance could be achieved with relatively modest fine-tuning cost.
The LLaVA family [39,40] popularised a simpler but highly effective recipe: a CLIP vision encoder coupled to a Vicuna or Mistral language backbone via a single linear projection, trained end-to-end on instruction-following data generated with GPT-4. LLaVA-1.5 [39] demonstrated that a carefully curated instruction set and an MLP connector suffice to reach state-of-the-art results across a wide range of VQA benchmarks. LLaVA-1.6 (LLaVA-NeXT) [40] extended this by adopting dynamic high-resolution tiling, greatly improving fine-grained object and text recognition at the cost of moderately higher inference latency. InternVL2 [41] builds on a large-scale InternViT-6B visual backbone interleaved with InternLM language modules, achieving competitive performance across multilingual benchmarks by virtue of its natively multilingual pretraining corpus. Qwen2-VL [42] introduces Naive Dynamic Resolution processing, adapting the number of visual tokens to the actual information density of each image, alongside Multimodal Rotary Position Embedding (M-RoPE) to encode temporal and spatial structure jointly, yielding particularly strong performance on document understanding and video tasks. Phi-3-Vision [43] follows the small-but-capable philosophy of the Phi model series: a 4.2B parameter model that combines an Azure AI CLIP encoder with the Phi-3 language model and a 128k-token context window, offering competitive accuracy at substantially lower computational cost than 7–8B peers.
Across all five architectures, inference efficiency varies considerably: model size alone is a poor proxy for energy cost, as architectural choices such as grouped-query attention [44], speculative decoding, and token compression interact non-linearly with GPU utilisation and power draw. Neural architecture search and once-for-all training strategies [45,46,47] have been proposed to jointly optimise accuracy and efficiency, but have not yet been systematically applied to the VLM family. The present study instead takes a black box, post hoc measurement approach, treating each model as a fixed inference endpoint and quantifying its energy consumption empirically.

2.2. UAV Smart Sensing and Aerial Scene Understanding

The integration of machine learning into UAV perception pipelines has evolved from classical feature-based object detection toward end-to-end deep learning systems capable of semantic scene understanding. Convolutional neural networks first demonstrated compelling results on aerial object detection and semantic segmentation, but their architecture constrained the spatial context available to each prediction. Vision transformers subsequently enabled global context aggregation from the first layer, improving performance on cluttered scenes typical of low-altitude UAV footage.
Language-grounded perception, where a drone can respond to free-form natural-language queries about its visual field, represents a qualitative leap beyond classification and detection. Early work coupled recurrent language decoders to convolutional visual encoders for aerial image captioning; more recent efforts exploit the instruction-following capabilities of large VLMs [48,49] to support open-ended Visual Question Answering (VQA) in drone applications, including crop stress detection in precision agriculture [50], building damage assessment in disaster response [51], and real-time hazard narration for search-and-rescue [52].
A persistent challenge in airborne perception is the energy budget of the onboard compute stack. Unlike ground vehicles, UAVs cannot indefinitely extend their compute payload; every additional watt consumed by an inference accelerator reduces hover time or range. This has motivated research into edge inference optimisation, model quantisation, and knowledge distillation for drone-specific deployment [46,47], but the comprehensive energy profiling of generative VLMs under realistic multilingual querying loads has not previously been reported for UAV contexts.

2.3. Multilingual Evaluation of Foundation Models

The evaluation of large language models across typologically diverse languages has a rich but predominantly text-centric history. The XTREME benchmark [22] established a massively multilingual protocol covering 40 languages and nine tasks, exposing substantial cross-lingual performance gaps even in state-of-the-art models. XGLUE [23] extended this to include generation tasks, while XLM-R [24] demonstrated that unsupervised cross-lingual pretraining at scale could substantially narrow the gap between English and other languages, though not eliminate it. The MEGA evaluation [25] applied this lens specifically to generative AI, benchmarking GPT-4 and other instruction-tuned models across 16 datasets and 70 languages, finding persistent performance disparities that correlate with training corpus size per language. Lai et al. [26] similarly found that ChatGPT’s multilingual performance degrades measurably for low-resource and morphologically complex languages.
A structural source of cross-lingual inequity is the tokeniser. Rust et al. [27] showed that multilingual BERT’s subword vocabulary allocates tokens unevenly across languages, causing morphologically rich languages to require more tokens to represent the same semantic content, directly inflating inference latency and cost. Petrov et al. [28] systematised this observation into the concept of tokeniser fertility disparity, demonstrating that low-resource and non-Latin-script languages consistently receive fewer vocabulary entries and thus higher token-per-character ratios, disadvantaging them on time- and cost-constrained inference budgets. This tokeniser-induced energy overhead compounds the accuracy gap, producing the double-penalty effect that we investigate in the VLM setting.
For multimodal models specifically, multilingual evaluation is substantially less developed. Most VLM benchmark papers report results in English only, with occasional Chinese or bilingual evaluation. The cross-lingual visual question-answering literature largely focuses on translation-based approaches, where a translated prompt is fed to a monolingual model, rather than natively multilingual inference. The EU AI Act’s non-discrimination and accessibility requirements [36] provide a regulatory impetus for broader multilingual VLM evaluation, particularly in safety-critical domains such as UAV autonomy. Consistency and reliability across prompt variations is also a known concern in LLM evaluation [53,54], and cross-language consistency is an underexplored instance of this broader robustness challenge [29].

2.4. AI Energy Efficiency Measurement

Awareness of the environmental cost of AI computation has grown rapidly following the influential analysis of Strubell et al. [8], who estimated that training a large transformer from scratch could produce emissions comparable to the lifetime carbon footprint of an automobile. Schwartz et al. [9] responded with a call for Green Artificial Intelligence (AI), a research agenda that treats computational efficiency as a first-class publication criterion alongside accuracy. Patterson et al. [13] refined these estimates by accounting for hardware generation, data centre efficiency (PUE), and grid carbon intensity, noting that inference at scale can exceed training emissions over a model’s operational lifetime. Henderson et al. [14] proposed a systematic reporting framework for energy and carbon footprints in machine learning experiments, and Lacoste et al. [55] released the Machine Learning Emissions Calculator to operationalise it. Software tools such as CodeCarbon [56] and survey-based inventories [57] have further lowered the barrier to routine energy reporting.
The focus then shifted from training to inference. Luccioni et al. [10] provided the first systematic comparison of inference energy across a diverse set of NLP tasks and model architectures, finding that energy per query varies by up to two orders of magnitude across tasks and that generative models are substantially more expensive than discriminative ones. De Vries [11] placed these figures in the context of global AI electricity demand, projecting rapid growth driven by large-model deployment. IEA [12] confirmed AI as an emerging contributor to data-centre electricity consumption in its 2024 forecast. Dodge et al. [21] examined cloud-instance-level carbon intensity, highlighting that the same computation can differ dramatically in emissions depending on the grid serving the data centre.
The AI Energy Score [19] addresses the need for a standardised, hardware-agnostic inference efficiency metric. It reports energy in Wh per 1000 queries, measured via the NVIDIA Management Library (NVML) at 10 Hz sampling, integrating instantaneous GPU power over the evaluation duration. This approach is consistent with the GPU-centric measurement methodology advocated by García-Martín et al. [20] and complements system-level approaches that also capture CPU and memory power [14]. In prior work [58], they employed this metric to profile eight LLMs and found consistent correlation between model scale and energy per query, a pattern we re-examine here for VLMs under multilingual loading.
Energy-efficient architecture design has been explored through neural architecture search [45,59], efficient scaling [47], and once-for-all networks [46], but these approaches optimise with training time. The present study takes a complementary inference-time perspective, evaluating fixed released checkpoints under realistic multilingual querying conditions and reporting energy consumption as an empirical property of each model–language combination.

2.5. Benchmarking Datasets for Autonomous Perception

Large-scale driving and aerial datasets have been instrumental in advancing autonomous perception research. The BDD100K dataset [30] provides 100,000 videos with diverse annotations covering object detection, instance segmentation, lane detection, and drivability estimation, collected across a range of weather conditions, times of day, and geographical settings. Its diversity makes it well suited as a perceptual stress test for VLMs: images span simple daytime urban scenes through challenging nighttime and adverse weather conditions, spanning the spectrum of difficulty levels from trivially recognisable to genuinely ambiguous. The BDD10K subset used in the present study samples 10,000 images from this collection, preserving the distributional diversity of the full corpus. Although BDD100K was collected from a forward-facing automotive camera rather than an aerial platform, its visual characteristics, cluttered scenes, moving objects, varied illumination, and ambiguous depth cues, are broadly representative of the challenges encountered in low-altitude UAV perception, making it a pragmatically sound proxy for evaluating drone-relevant VLM capabilities.
Using a standardised benchmark also enables fair comparisons with future work. The key limitations, the absence of nadir perspectives, motion blur from rapid altitude changes, and the wider field of view characteristic of true drone footage, are acknowledged in Section 5 and motivate the aerial imagery extension proposed for future research directions.
The automatic evaluation of open-ended VLM responses is non-trivial. N-gram overlap metrics such as BLEU [60] and Recall-Oriented Understudy for Gisting Evaluation (ROUGE) [61] are insensitive to paraphrase and semantic equivalence, penalising correct but differently worded answers. Neural similarity metrics based on contextual embeddings offer a more robust alternative: Sentence-BERT [31] produces dense sentence embeddings via a siamese fine-tuned BERT network, and SimCSE [62] further improves embedding isotropy through contrastive training. Cosine similarity in the Sentence-BERT embedding space has been shown to correlate well with human judgements of semantic equivalence across multiple languages, making it appropriate for multilingual evaluation where exact lexical overlap is meaningless across language boundaries [31]. Holistic evaluation frameworks such as Holistic Evaluation of Language Models (HELM) [63] and BIG-Bench [64] have advocated for multi-metric, multi-task evaluation suites that capture reliability and consistency alongside raw accuracy, a philosophy we adopt by reporting per-task and per-difficulty breakdowns alongside aggregate scores [65].

2.6. Summary and Positioning

Table 1 positions the present work against the most directly related prior studies. Existing work addresses at most two of the three axes: accuracy, energy, and linguistic coverage, that we treat jointly. Energy-focused studies that use VLMs (image + text input) consider only English; multilingual evaluations of language models process text only and report no energy metrics; and UAV-specific perception benchmarks consider neither multilingual inference nor energy profiling. Our study is, to the best of our knowledge, the first to evaluate VLMs along all three axes simultaneously in a UAV-relevant perception context.

3. Materials and Methods

The experimental framework is designed to jointly measure perception performance and inference energy for five open-source VLMs across thirteen languages on four visual sensing tasks of increasing cognitive difficulty. The pipeline comprises five stages (Figure 1): (1) dataset preparation and multilingual prompt instantiation using 210 BDD10K images across 13 languages spanning six typological families, with three low-resource varieties (Arabic, Basque, and Luxembourgish) explicitly flagged as double-penalty candidates; (2) inference via a vLLM (v0.5+) server on an NVIDIA H200 SXM GPU (NVIDIA Corporation, Santa Clara, CA, USA), serving five architecturally diverse 7–8B VLMs under a uniform configuration( τ = 0.2 , max_tokens = 300, and r = 3 runs); (3) task-specific scoring across four sensing tasks of increasing difficulty using Sentence-BERT cosine similarity, keyword recall, and a hybrid spatial keyword scorer; (4) continuous NVML-based GPU power sampling following the AI Energy Score methodology to derive E 1 K (Wh per 1000 queries); and (5) statistical analysis combining Friedman tests, Holm-corrected Wilcoxon pairwise comparisons, and Spearman rank correlations to characterise cross-language variability, pairwise model differences, and the energy–accuracy relationship. The following subsections describe each stage in detail; all code is openly available to support reproducibility (https://github.com/drdezarza/vlm_energy_multilingual, accessed on 7 April 2026).

3.1. UAV Inference Energy Budget

To motivate the AI Energy Score metric as the primary evaluation criterion, we formalise the relationship between VLM inference energy and UAV operational endurance. Let B (Wh) denote usable battery capacity, P base (W) the baseline power draw of motors and avionics, and P inf (W) the instantaneous power drawn by the onboard inference accelerator. Hover endurance with and without inference are, respectively,
T = B P base + P inf , T 0 = B P base ,
giving an inference-induced endurance loss
Δ T = T 0 T = B P inf P base P base + P inf .
If the UAV issues VLM queries at frequency f q (queries s−1), the mean inference power draw is
P inf = f q · E 1 K 1000 · 3600 [ W ] ,
where E 1 K is the AI Energy Score ( Wh per 1000 queries) and the factor 3600 converts Wh to joules. Requiring that inference does not consume more than a fraction α of the total battery energy over a mission of duration T 0 , the query budget constraint is
f q · B · 3600 P base · E 1 K 1000 α · B E 1 K α · P base f q · 3.6 ,
and model selection reduces to the constrained optimisation
max m M S ¯ m s . t . E 1 K ( m ) α · P base f q · 3.6 ,
where M is the set of candidate VLMs. Section 4.6 instantiates Equations (4) and (5) for four commercial UAV platforms using the empirical E 1 K values reported in Section 4.4.

3.2. Models Under Evaluation

Five state-of-the-art open-source VLMs were selected to span a range of architectural families, parameter counts, and design philosophies, while remaining within the 7–8B parameter regime that is practically deployable on a single consumer GPU (Table 2):
Each model was loaded and served via vLLM [66] with a context window limited to 4096 tokens, a setting that accommodates the image token budget together with the multilingual prompts and a 300-token response budget. The vLLM OpenAI-compatible REST API (/v1/chat/completions) was used as the inference endpoint, enabling a uniform evaluation harness across all five architectures without requiring architecture-specific integration code.
The selection of the five Vision–Language Models evaluated in this study was governed by three explicit criteria designed to balance scientific rigour against UAV-relevant deployability. First, a parameter-count constraint bounds the model space to the 4.2–8B regime, the practical upper end for single-GPU inference and a credible target for next-generation edge accelerators such as the NVIDIA Jetson AGX Orin [46]; this excludes frontier multimodal models in the 30B+ range whose deployment on UAV-class hardware is not foreseeable in the short term. Second, an architectural diversity criterion ensures coverage of the principal design paradigms currently competing in the open-source VLM landscape: a simple CLIP–MLP–Vicuna baseline (LLaVA-1.5), dynamic high-resolution tiling with a Mistral backbone (LLaVA-1.6), a large InternViT-6B vision encoder coupled to a natively multilingual InternLM language module (InternVL2), Naive Dynamic Resolution combined with Multimodal Rotary Position Embedding (Qwen2-VL), and a compact small-but-capable design with extended context (Phi-3-Vision). Third, a reproducibility criterion requires that all checkpoints be openly licensed, natively supported by vLLM through its OpenAI-compatible REST API at the time of experimental design, and stable across released revisions, so that the energy-measurement campaign could be conducted on a single, homogeneous serving stack.

3.3. Dataset and Image Pre-Processing

Imagery was drawn from the BDD10K dataset [30], a 10,000-image subset of the BDD100K autonomous-driving benchmark [30], covering urban and suburban roads, varied weather (clear, overcast, rainy, snowy, and foggy), lighting levels (daytime, dusk, and nighttime), and multiple geographical settings. This diversity makes BDD10K a practical proxy for the perceptual complexity encountered in low-altitude UAV sensing, providing the variety of scene types, cluttered intersections, open motorways, adverse weather, and nighttime scenarios needed to stress test VLM scene understanding and navigation reasoning at multiple difficulty levels.
The choice of BDD10K as a benchmark for drone-relevant VLM evaluation warrants explicit justification. At low altitudes (below approximately 25 m), forward-facing drone cameras capture scenes with visual characteristics substantially overlapping those of automotive cameras: cluttered urban intersections, road-level obstacles, pedestrians, signage, and varied illumination and weather conditions. The semantic content of the four evaluation tasks, scene description, obstacle identification, terrain condition assessment, and spatial hazard reasoning, is determined by the query, not the camera platform; a VLM that fails to identify a pedestrian or parse road conditions when prompted in Arabic will fail in the same way whether the image originates from a vehicle or a low-altitude UAV. Furthermore, the primary experimental variable in this study is the interaction between the language and model architecture, not the specific imaging geometry. BDD10K’s exceptional diversity in weather, lighting, and scene complexity provides a well-controlled and reproducible stress test for multilingual VLM robustness that purpose-built aerial datasets such as VisDrone [67] or AU-AIR [68] cannot yet match in scale, annotation breadth, or community adoption. We nevertheless acknowledge that BDD10K does not capture four characteristics specific to true drone footage: (1) nadir (top-down) viewpoints typical of mapping and surveillance missions; (2) high-altitude perspectives where ground-level objects subtend substantially fewer pixels than in automotive imagery; (3) motion blur induced by high-speed forward flight or rapid altitude changes; and (4) large attitude variations (roll, pitch, and yaw) absent from gravity-stabilised vehicle cameras. The findings reported in this paper should therefore be read as scoped primarily to forward-facing low-altitude UAV operation (typically below 25–50 m Above Ground Level (AGL)) in which the visual statistics, cluttered scenes, ground-level obstacles, varied weather and illumination, and ego-motion at moderate ground speeds, overlap substantially with automotive imagery. This regime covers a non-trivial fraction of practical UAV applications, including infrastructure inspection at building level, last-mile delivery, perimeter patrol, urban search and rescue, and forward-flight obstacle avoidance, but explicitly excludes high-altitude survey, oblique aerial photogrammetry, and high-speed nadir mapping. We do not claim that the inter-model energy and accuracy rankings reported here transfer unchanged to those regimes; validation on purpose-built aerial datasets is identified as a primary follow-up (Section 5).
The 210 images sampled from BDD10K for this study were selected via a deterministic frozen subset (seed  = 42 ) spanning all three corpus splits (train, validation, and test), preserving the full distributional diversity of the collection and ensuring identical image exposure across all five models under evaluation.
Each image was pre-processed before submission to the VLM: (1) converted to RGB if not already in that mode; (2) down-scaled to a maximum side length of 1024 pixels while preserving aspect ratio using Lanczos resampling; and (3) encoded as a JPEG with quality factor 85 and serialised to a Base64 string for embedding in the JSON API payload. This pre-processing pipeline balances visual fidelity against network transfer overhead and is identical for all models and languages.
Evaluation samples were drawn without replacement from the BDD100K image corpus (train, validation, and test splits combined) using a deterministic frozen subset file generated with a fixed random seed (seed  = 42 ), yielding N img = 210 images per experimental run shared identically across all five models. This frozen subset protocol ensures that cross-model comparisons are performed on exactly the same image sample, eliminating sampling variance as a confounding factor. Each image was paired with all 13 × 4 = 52 language–task combinations, giving a total task count of N tasks = N img × 52 . Each task was evaluated with r = 3 independent inference runs, so the total number of API queries per model was N queries = N tasks × 3 .

3.4. Multilingual Task Design

Four sensing tasks were defined to span the difficulty spectrum relevant to UAV autonomy, from basic scene description (easy) to obstacle-aware navigation reasoning (hard). Each task was instantiated in thirteen languages by native or expert-translated prompts (Table 3). The languages were selected to represent six typologically distinct families and to include three low-resource varieties, Arabic (ar), Basque (eu), and Luxembourgish (lb), that are under-represented in standard VLM pretraining corpora.
The thirteen languages and their linguistic families are Arabic (Semitic), Basque (language isolate), Catalan, French, Italian, Portuguese, Spanish (Romance), German, English, Luxembourgish (Germanic), Russian (Slavic), and Chinese, Simplified and Traditional (Sinitic). The complete set of translated prompts is available in the project repository.

3.5. Inference Configuration

All inference calls used a temperature of τ = 0.2 and a maximum response length of 300 tokens. The low but non-zero temperature was chosen to produce near-deterministic outputs while preserving minor variability that allows the three-run consistency metric to be informative [69]. Each task was evaluated r = 3 times independently; the reported task score is the mean of the three run scores, and the within-task standard deviation provides the consistency metric [70].
Before energy measurement began, a single warmup query was submitted to the vLLM server and a two-second pause was observed. This warmup ensures that GPU frequency has stabilised and that model weights are resident in VRAM before power sampling commences, following best-practice guidance from the AI Energy Score methodology [19].

3.6. Scoring Protocol

Four task-specific scoring functions were implemented to reflect the qualitative differences between the tasks. All scores are normalised to [ 0 , 1 ] .

3.6.1. Scene Understanding—Semantic Similarity

Scene understanding responses were scored by computing the cosine similarity between the dense vector embedding of the model’s response and the embedding of a fixed English reference description (“A driving scene showing road, vehicles, surroundings, and traffic conditions”):
s scene ( r , r ^ ) = e ( r ) · e ( r ^ ) e ( r ) e ( r ^ )
where e ( · ) denotes the embedding produced by all-MiniLM-L6-v2, a 22.7M-parameter sentence-transformer model trained primarily on English semantic textual similarity data [31]. The model exposes some degree of cross-lingual representational alignment for high-resource Latin-script languages through shared subword tokens and multilingual co-occurrence in the underlying corpus, which permits non-trivial cross-language similarity scores without translation, but it is not a fully language-agnostic encoder. Cross-lingual cosine similarity in this embedding space is known to degrade with script distance and lexical overlap from English, an asymmetry that introduces a measurement bias against non-English responses which we characterise explicitly in Section 5 (Limitations).

3.6.2. Vehicle Detection—Keyword Recall

Vehicle detection responses were scored by computing the recall of a fixed lexicon of seven English-language category terms: {car, vehicle, road, lane, traffic, sign, pedestrian}:
s vehicle ( r ) = | { k K : k lower ( r ) } | | K |
where K is the keyword set. This metric assesses whether the model correctly identifies the primary object categories present in an autonomous driving scene, acknowledging that in many non-English responses these English loanwords are still used or semantically close equivalents appear in transliterated form.

3.6.3. Road Condition—Feature Recall

Road condition responses were scored analogously to vehicle detection, using a seven-element feature lexicon, {paved, asphalt, lane, clear, day, straight, urban}, which captures the most frequent surface, lighting, and geometry attributes in the BDD10K urban driving distribution [30]:
s road ( r ) = | { f F : f lower ( r ) } | | F |

3.6.4. Navigation Reasoning—Hybrid Score

Navigation reasoning is the most demanding task, requiring the model to localise hazards and obstacles relative to the ego-vehicle. A hybrid scoring function was adopted that combines keyword matching for multilingual spatial terms with semantic similarity against a reference answer:
s nav ( r , r ^ ) = 1 2 | { t T r ^ : t lower ( r ) } | | T r ^ | + s scene ( r , r ^ )
where T r ^ is the subset of a multilingual spatial lexicon that appears in the reference answer r ^ . The spatial lexicon covers English terms (left, right, ahead, behind, lane, straight, intersection, near, and far), Spanish (izquierda, derecha, and adelante), French (gauche, droite, and devant), German (links, rechts, and vorne), Italian (sinistra, destra, and davanti), and Chinese. If no spatial terms are found in the reference, the score falls back to pure semantic similarity (Equation (6)).

3.6.5. Aggregation

For each image–language–task triplet, the score is the mean of the three run scores. The per-language average score S ¯ l for model m is the mean across all four task types and all sampled images. The model-level overall score S ¯ m is the mean across all languages and tasks. Consistency σ m is defined as the mean within-task standard deviation across all runs, language, and image combinations; lower values indicate more reproducible outputs.
Scoring-Function Design Rationale
The four scoring functions are not the only reasonable choices, and the design space includes (a) per-response human annotation, (b) automatic scoring via a separate multilingual natural-language-inference or question-answering model, and (c) the synthetic reference scoring approach we adopt here. We chose (c) for three reasons. First, the campaign size— 32 , 760 queries per model × 5 models = 163 , 800 responses—places per-response human annotation outside the feasible cost envelope of a single benchmarking study, particularly across thirteen languages including two requiring scarce native-speaker annotator pools (Basque and Luxembourgish). Second, the failure modes we wished to characterise, Arabic over-generation, Basque null-response collapse, and intermediate resource degradation in Luxembourgish, are best diagnosed by scorers that decompose into named lexical and semantic components, so that we can attribute a low score to specific causes; the hybrid navigation scorer in particular, with its independently reported kw _ score and sem _ score components, would lose its diagnostic value if collapsed to a single NLI verdict. Third, synthetic reference scoring has well-understood failure modes (addressed in Section 5) and a substantial body of comparable literature (MEGA [25], FLORES [71], and Lai et al. [26]) using the same approach, providing a baseline for interpretation. The trade-off is precisely the multilingual–fairness concern: synthetic reference scoring places the calibration burden on the per-language references and lexicons, which must give equivalent signal strength across languages for the comparison to be fair.
Edge-Case Interpretation
The four scorers have different bounded domains and different conventional interpretations at their extremes, which we document for transparency. The scene-understanding cosine similarity (Equation (6)) is mathematically bounded in [ 1 , 1 ] , with 1 indicating perfect anti-alignment, 0 indicating orthogonality, and + 1 indicating identical embeddings. In practice on driving scene content with the all-MiniLM-L6-v2 encoder, observed values fall almost entirely in [ 0 , 1 ] ; negative values occur only when the model produces a refusal or a generic off-topic response, and are particularly concentrated in Basque, where several models default to a meta-statement of inability rather than a scene description. The vehicle detection and road condition recall scorers (Equations (7) and (8)) are bounded in [ 0 , 1 ] by construction: the denominator is the lexicon size, the numerator is the count of lexicon entries appearing in the response, 0 indicates that no expected vocabulary was found, and 1 indicates full lexicon coverage, with the caveat, discussed in Section 5, that full coverage can be achieved by hallucination as well as by accurate identification. The navigation reasoning hybrid scorer (Equation (9)) averages a [ 0 , 1 ] keyword recall component with a cosine component bounded in [ 1 , 1 ] , so its theoretical range is [ 0.5 , 1 ] ; in our data, the observed minimum was 0.04 (Basque; LLaVA-1.5), confirming that negative cosine pull-down does not materialise in practice. Empty or null responses, a particular failure mode in Basque, where some models return only whitespace or a language-detection error message, yield cosine 0 (the encoder’s bias-vector embedding) and keyword recall = 0 , so they appear in the data as score = 0 rather than as missing entries. This preserves the symmetry of the cross-language comparison and avoids the selection bias that would arise from dropping languages where one model refused. The score = 0 floor is therefore not a degenerate measurement but an empirically meaningful endpoint of the Basque collapse failure mode reported in Section 4.

3.7. Energy Measurement

GPU energy consumption was measured following the AI Energy Score methodology [19] using the GPUEnergySampler class implemented on top of the NVIDIA Management Library (NVML) via the pynvml (v11.5+) binding for Python (v3.10).
A background daemon thread polled nvmlDeviceGetPowerUsage() at a sampling interval of Δ t = 0.1  s (10 Hz), storing instantaneous power readings { P k } k = 1 K in watts. The total GPU energy consumed over an evaluation run of duration T seconds was computed by integrating the mean valid power:
E total = P ¯ · T 3600 [ Wh ]
where P ¯ = 1 K k P k over K finite (non-NaN) samples. The primary AI Energy Score metric, energy per 1000 queries, was then derived as
E 1 K = E total N queries × 10 3 Wh 10 3 queries
where N queries = N tasks × 3 is the total number of inference calls during the measurement window.
Per-language energy was estimated proportionally, distributing the total measured energy according to the fraction of wall-clock time attributable to each language’s evaluation segment:
E 1 K ( l ) = E total · ( T ( l ) / T ) N queries ( l ) × 10 3
where T ( l ) is the wall time elapsed while the language-l task block was being evaluated and N queries ( l ) is the corresponding query count. This proportional decomposition assumes that GPU utilisation is statistically homogeneous across language blocks within a single model evaluation run, which is a reasonable approximation given that all prompts and images share the same format, length cap, and inference configuration [20].
The NVML sampler was active from the first non-warmup query to the last, encompassing only inference time and excluding model loading. Measurements were performed on a NVIDIA H200 GPU; multi-GPU configurations were not used in this study. The reported power statistics include the average, maximum, and minimum GPU draw over the measurement window, enabling the assessment of thermal throttling effects [21].

3.8. Statistical Analysis

All statistical analyses were implemented in Python using SciPy (v1.10+) [72] and executed in a Jupyter notebook available in the project code repository (see Data Availability Statement). Four complementary analyses were performed.
Friedman test.
To test whether models differ significantly across languages on each metric, a Friedman non-parametric repeated-measures test [32] was applied, with models as treatments and languages as blocks. A pivot table of shape ( n lang × n model ) was constructed for each of the six metrics (avg_score, wh_per_1000, scene_score, vehicle_score, road_score, and nav_score), and rows containing any missing values were discarded before testing. The test was conducted only for pivot tables with at least five language blocks and three model columns.
Pairwise Wilcoxon tests with Holm–Bonferroni correction.
For the primary accuracy metric (avg_score), all 5 2 = 10 model pairs were compared using two-sided Wilcoxon signed-rank tests [73] on their per-language score vectors. p-values were adjusted for multiple comparisons using the Holm sequential rejection procedure [33]. Effect sizes were reported as standardised mean differences (Cohen’s d) computed on the paired difference vector [35].
Spearman rank correlation.
The association between energy consumption and task accuracy was assessed using Spearman’s ρ [34] computed over the full set of n = 65 (model and language) observation pairs. Both energy metrics (wh_per_1000 and wh_total) were correlated against all five performance metrics, yielding ten correlation coefficients in total.
Cross-model rankings.
A composite ranking was constructed by assigning each model an integer rank (1 = best) on each of eight dimensions: overall accuracy, energy efficiency (Wh/1K), an efficiency score defined as S ¯ m / E 1 K , four task-type averages, and consistency. The mean rank across all eight dimensions provides a single scalar for holistic model comparison.
Double-penalty analysis.
Low-resource languages were defined as the subset L low = { ar , eu , lb } following standard corpus size criteria [28]. The double-penalty effect was operationalised as the simultaneous occurrence of (1) a lower mean accuracy and (2) higher mean energy per 1000 queries for L low relative to high-resource languages, evaluated at the level of individual (model and language) pairs using descriptive statistics and the visual inspection of the scatter plot.

3.9. Reproducibility and Software Stack

Table 4 lists the principal software components and versions used in this study.
Each model evaluation was run sequentially on a NVIDIA H200 with a ten-second inter-model pause to allow the GPU to return to idle power before the next measurement window opened. All random sampling used a fixed NumPy seed for reproducibility.

4. Results

All experiments were executed on an NVIDIA H200 SXM GPU hosted on the Boston University Shared Computing Cluster. The H200’s mean GPU draw during active inference ranged from 323.2  W (Phi-3-V) to 358.2  W (InternVL2), occupying approximately 46– 51 % of the H200 peak TDP (700 W), consistent with near-saturated high-bandwidth memory utilisation at the 7–8B parameter scale. The results span 32,760 total inference queries per model (210 images × 13 languages × 4 tasks × 3 runs), yielding 65 (model, language) observation pairs and 210 image-level data points per model.

4.1. Overall Model Performance

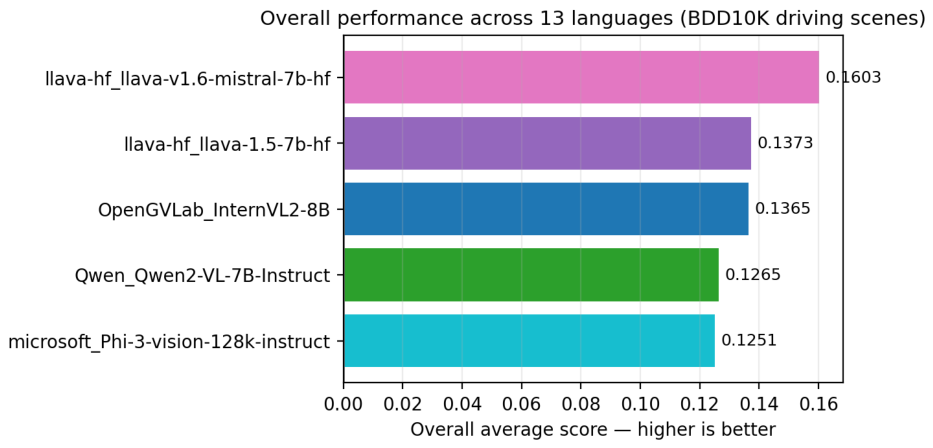
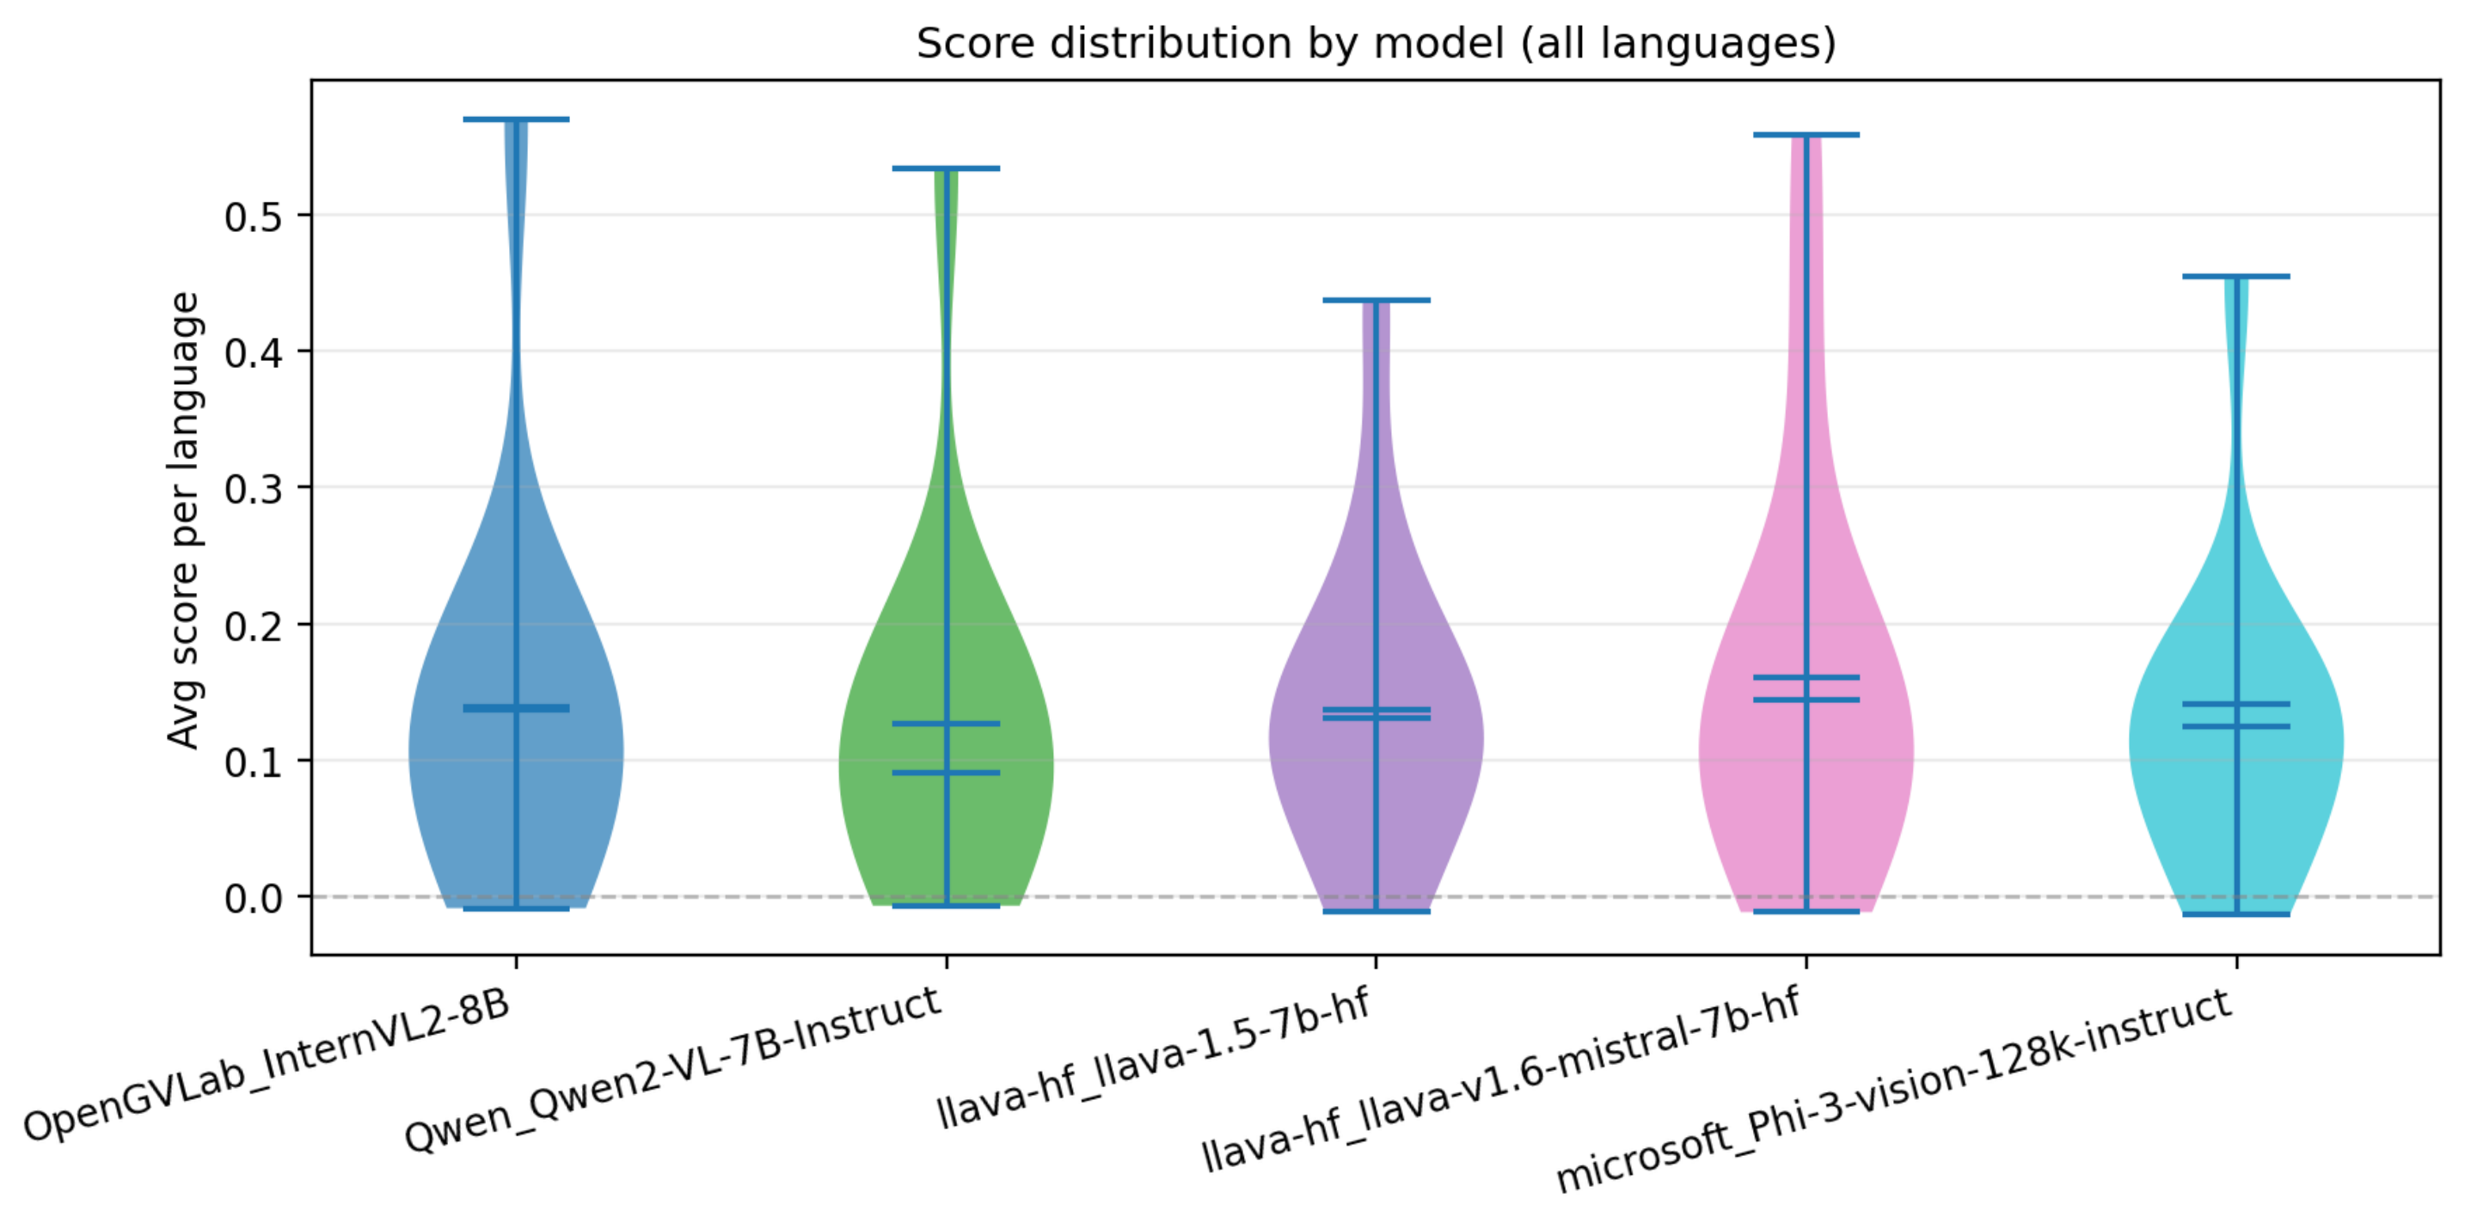
Table 5 consolidates the model-level summary statistics. Figure 2 plots the overall average score S ¯ m across all thirteen languages and four task types, while Figure 3 displays the score distribution over the 13 per-language observations per model, revealing not only the central tendency but the spread and skewness induced by multilingual heterogeneity.
LLaVA-1.6 attains the highest multilingual mean ( S ¯ = 0.160 ), followed by LLaVA-1.5 and InternVL2 (both 0.137 ), Qwen2-VL ( 0.126 ), and Phi-3-V ( 0.125 ). The inter-model range is narrow ( Δ S ¯ = 0.035 ), a compression driven by near-zero scores on low-resource languages that affect all models similarly.
The violin plot reveals that LLaVA-1.6 has the widest overall spread (upper whisker near 0.55 ; lower boundary is negative), while InternVL2 reaches the highest single upper whisker (≈0.57), reflecting its strong English score. Both are driven by extreme English peaks rather than uniform multilingual coverage. Qwen2-VL shows the narrowest violin ( σ = 0.005 ), indicating the most consistent but plateau-limited multilingual behaviour.
The Friedman test on avg_score ( χ 2 = 4.68 , p = 0.322 , and n = 13 language blocks) is not significant. Among the 5 2 = 10 pairwise Wilcoxon comparisons, no pair survives Holm–Bonferroni correction at α = 0.05 ; the closest comparison is LLaVA-1.6 vs. Phi-3-V ( W = 18 , p raw = 0.057 , p Holm = 0.574 , and Cohen’s d = 0.487 ). All ten pairs are non-significant after correction ( p Holm 0.574 ), indicating that no model pair can be definitively ranked by overall accuracy alone. The multi-metric ranking framework introduced in Section 4.5 is therefore the primary basis for model comparison.

4.2. Task-Type Performance Profiles

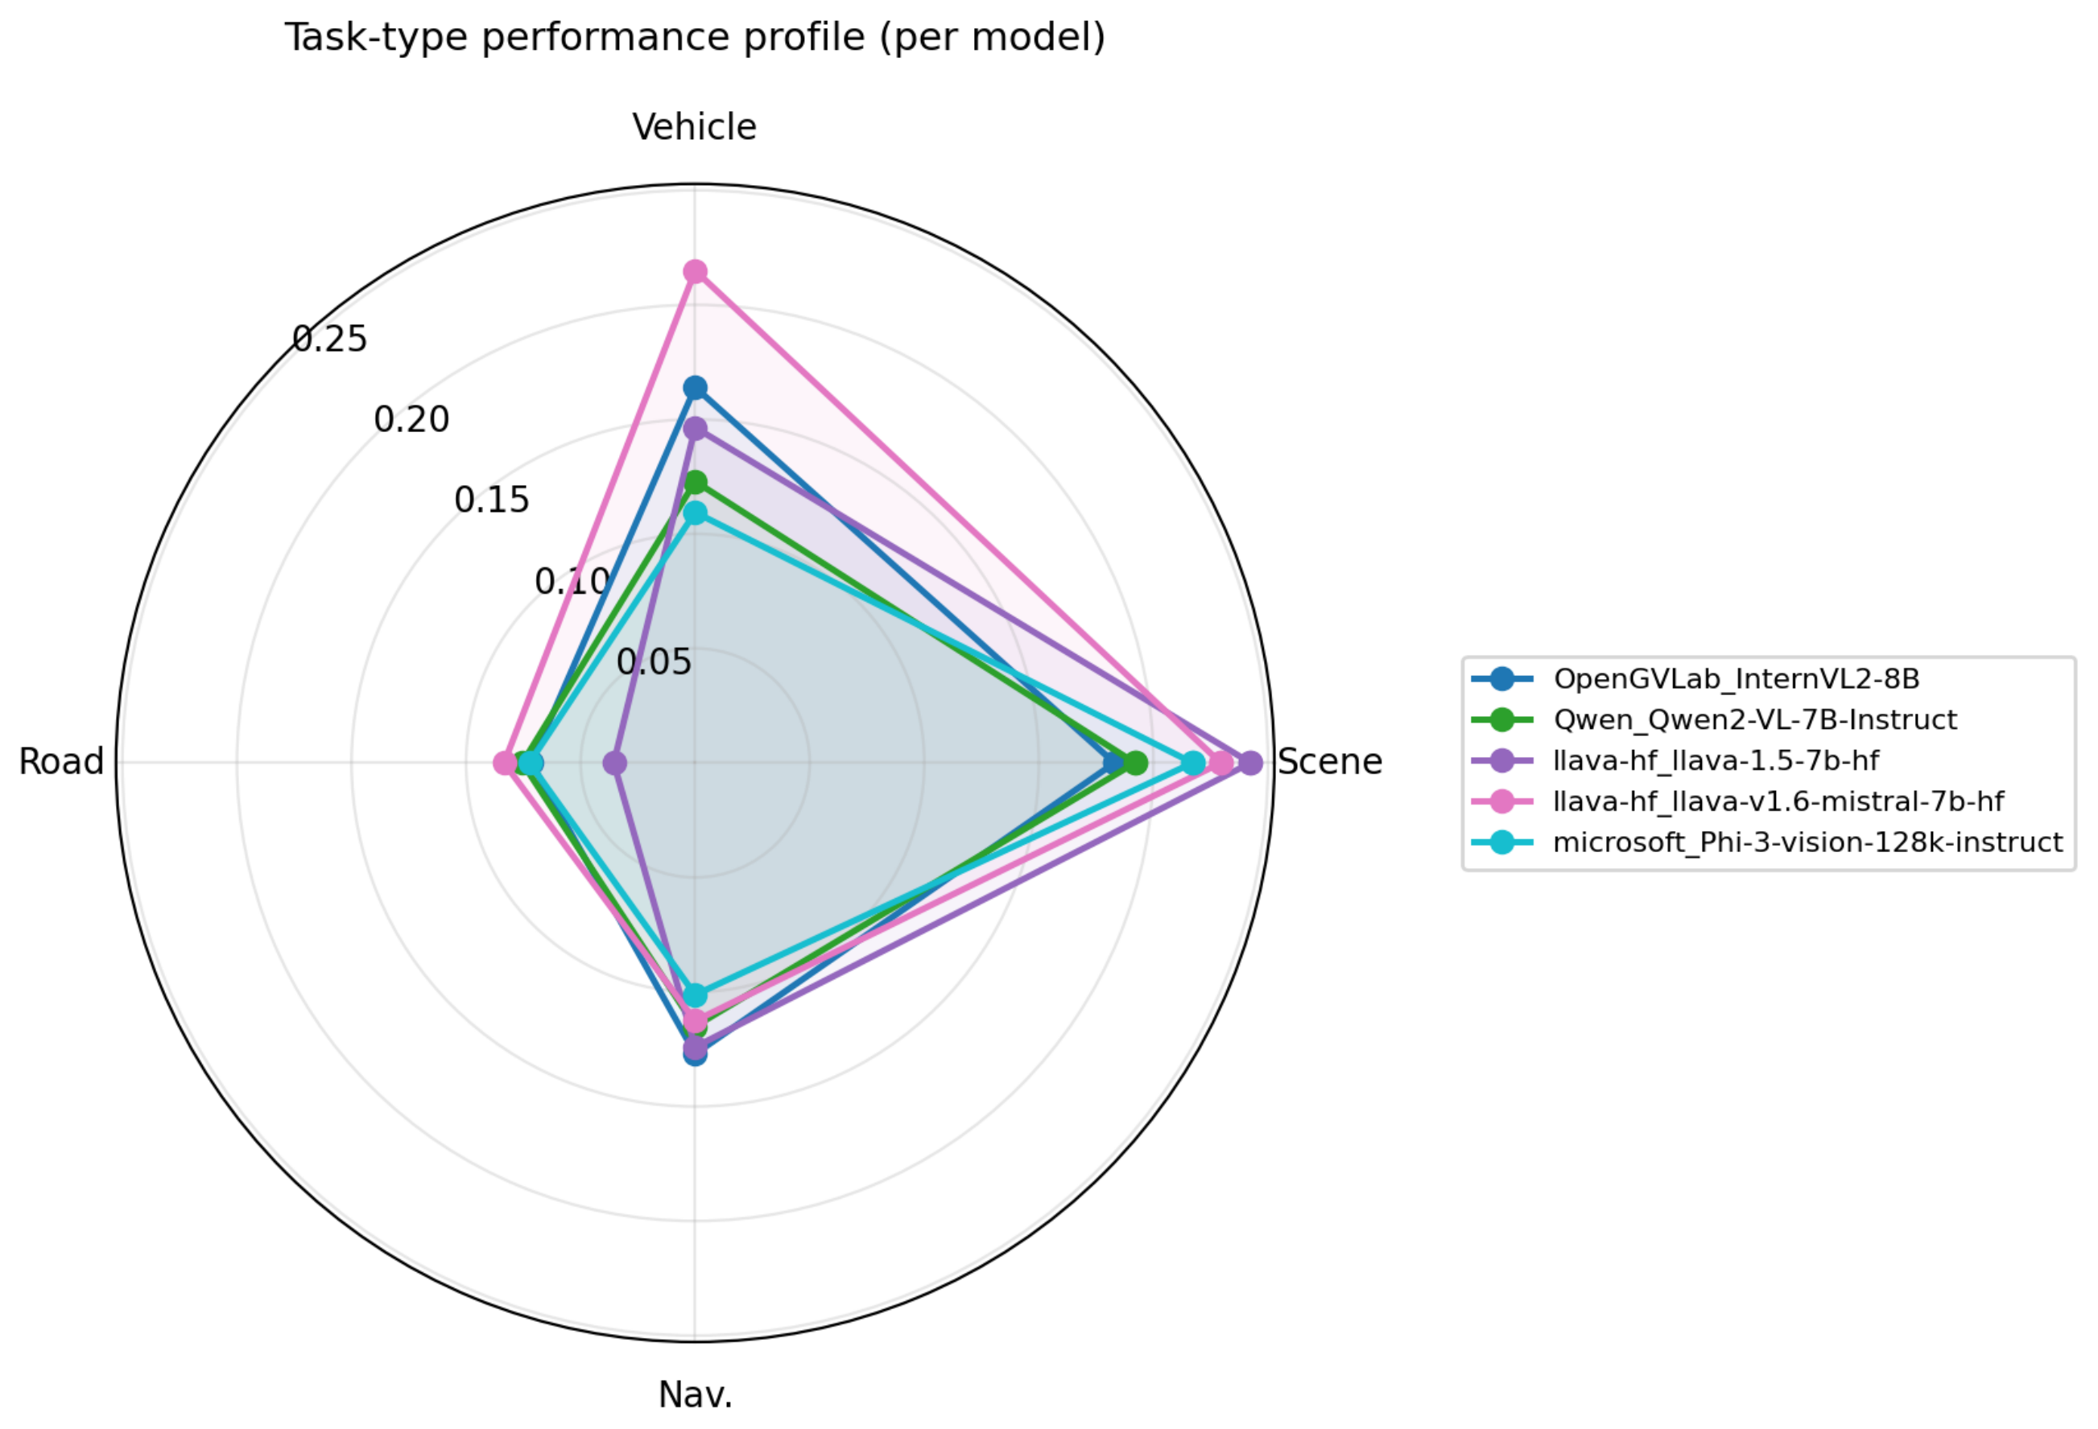
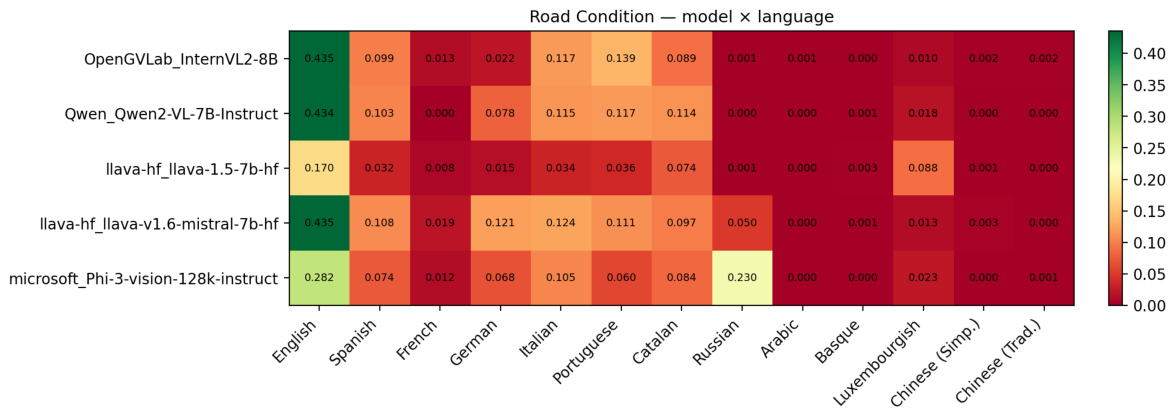
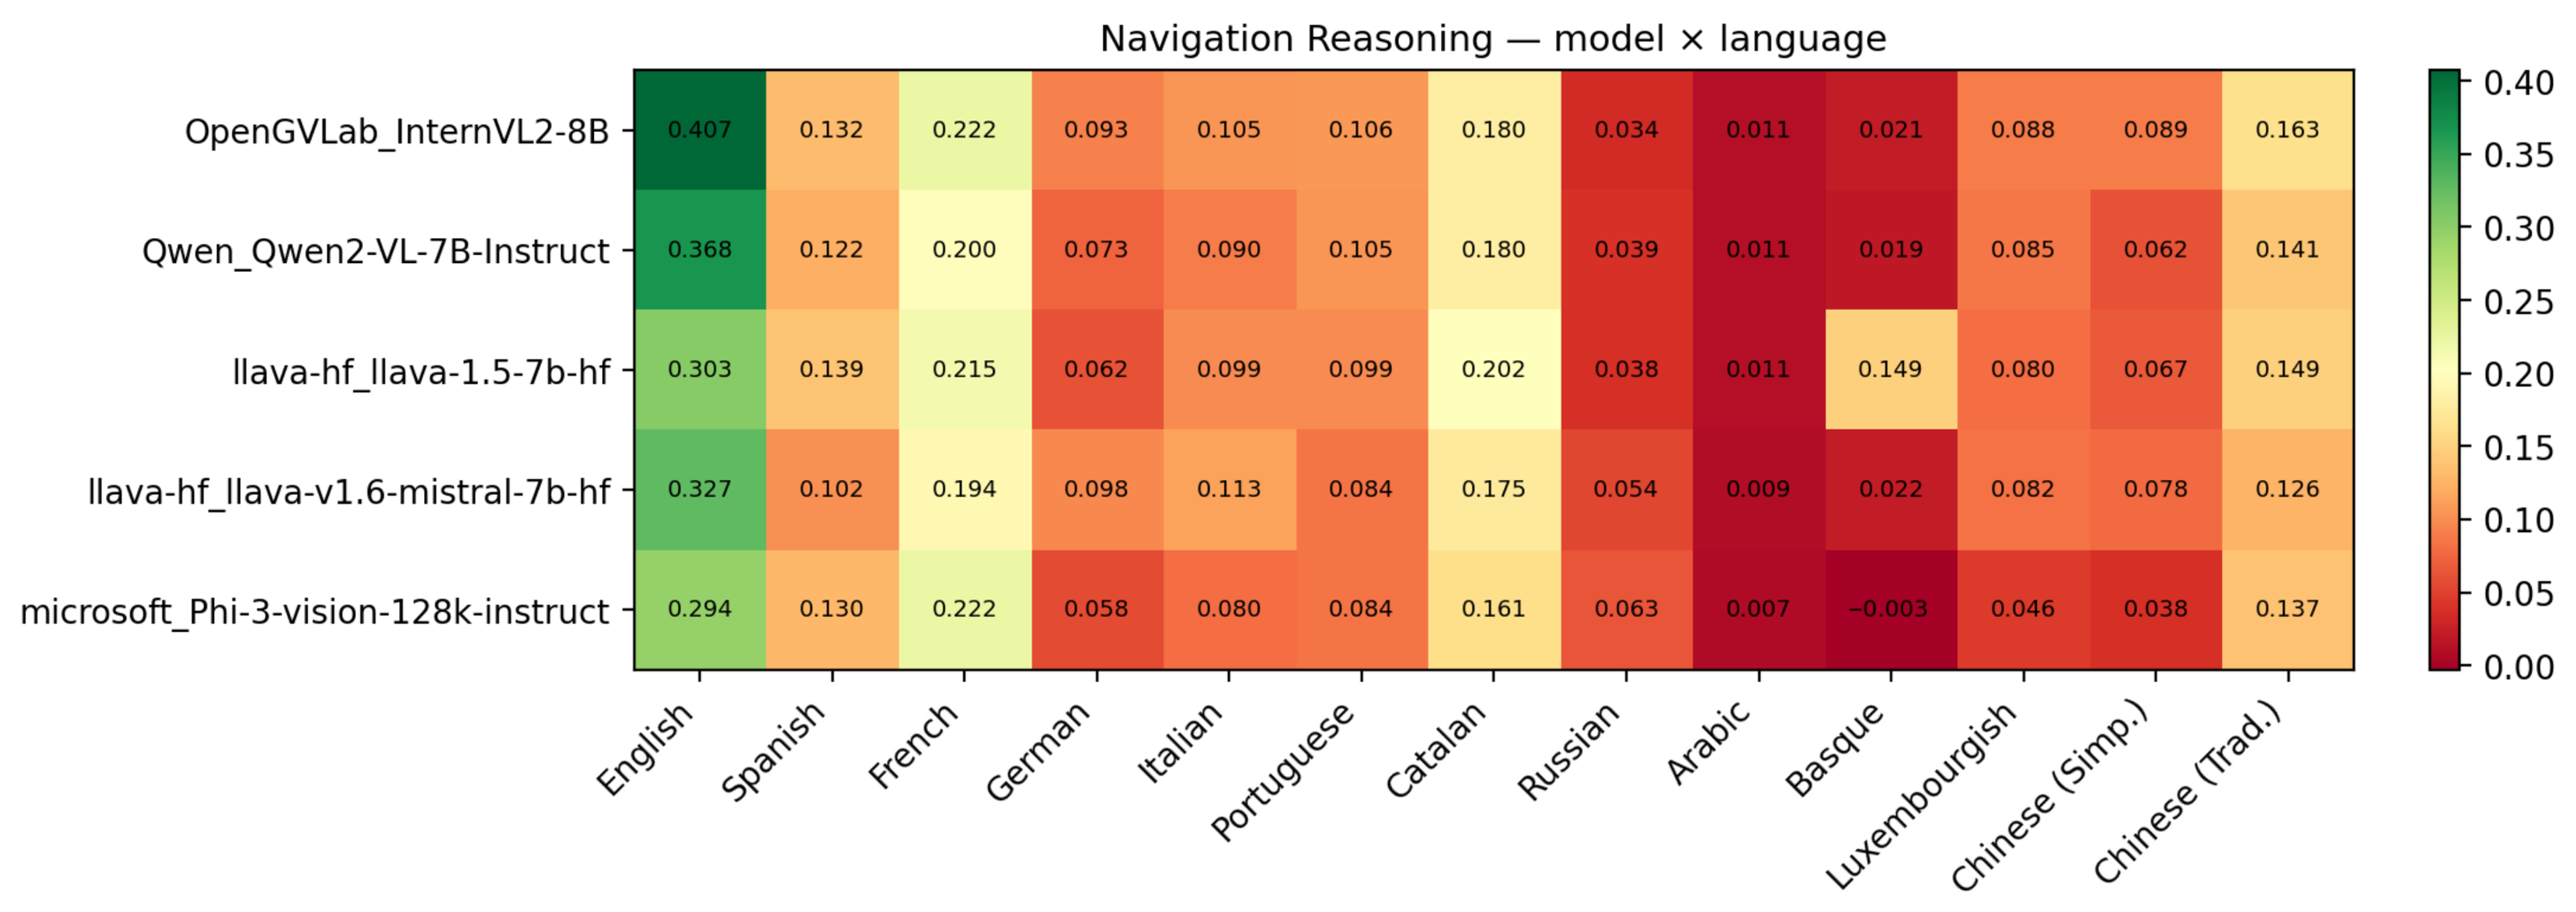
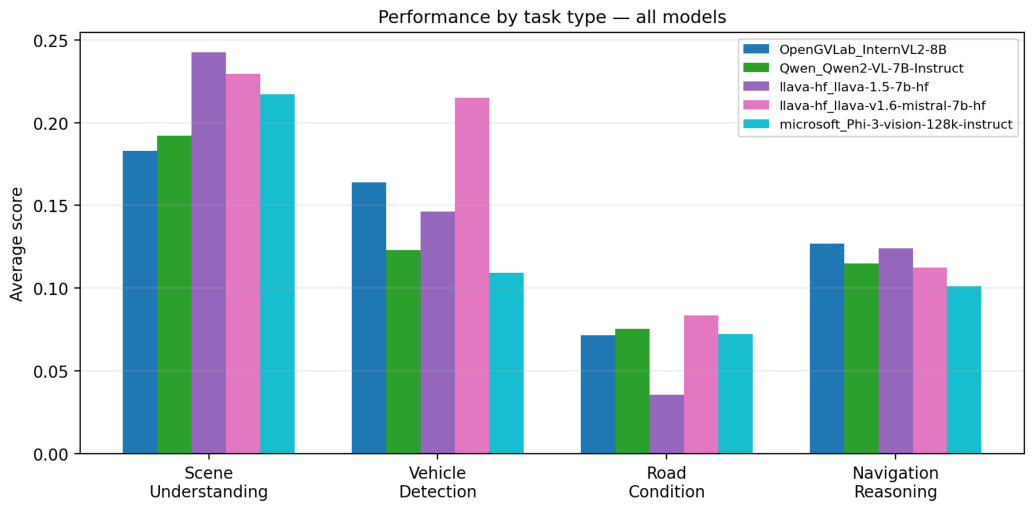
Figure 4 decomposes model performance by the four task types averaged over all 13 languages. Figure 5 visualises the same data as a radar chart, directly exposing each model’s capability profile across the four perception axes. Figure 6, Figure 7, Figure 8 and Figure 9 provide the full model × language resolution for each task individually.
Scene understanding (easy).
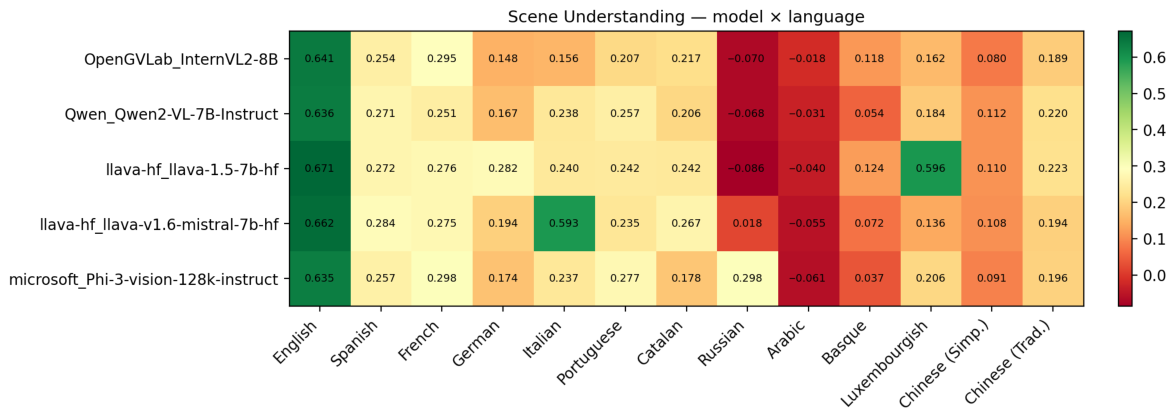
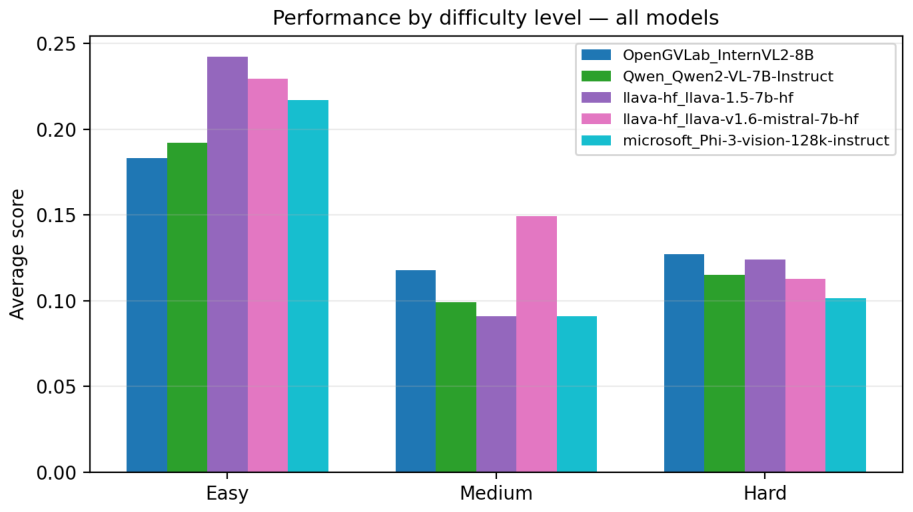
LLaVA-1.5 leads ( S ¯ scene = 0.242 ), closely followed by LLaVA-1.6 ( 0.229 ), while InternVL2 ranks last ( 0.183 ). The Friedman test is not significant ( χ 2 = 8.31 ; p = 0.081 ). Figure 6 reveals the two highest non-English values: LLaVA-1.5 on Luxembourgish ( 0.596 ) and LLaVA-1.6 on Italian ( 0.593 ), both driven by vocabulary overlap between model-generated responses and the English-anchored sentence-BERT reference embedding. English scores cluster in the 0.635 0.671 range across all five models. Russian scores are negative for InternVL2 ( 0.070 ), LLaVA-1.5 ( 0.086 ), and Qwen2-VL ( 0.068 ); Arabic scores are negative for all five models, reflecting the script distance effects on cosine similarity.
Vehicle detection (medium).
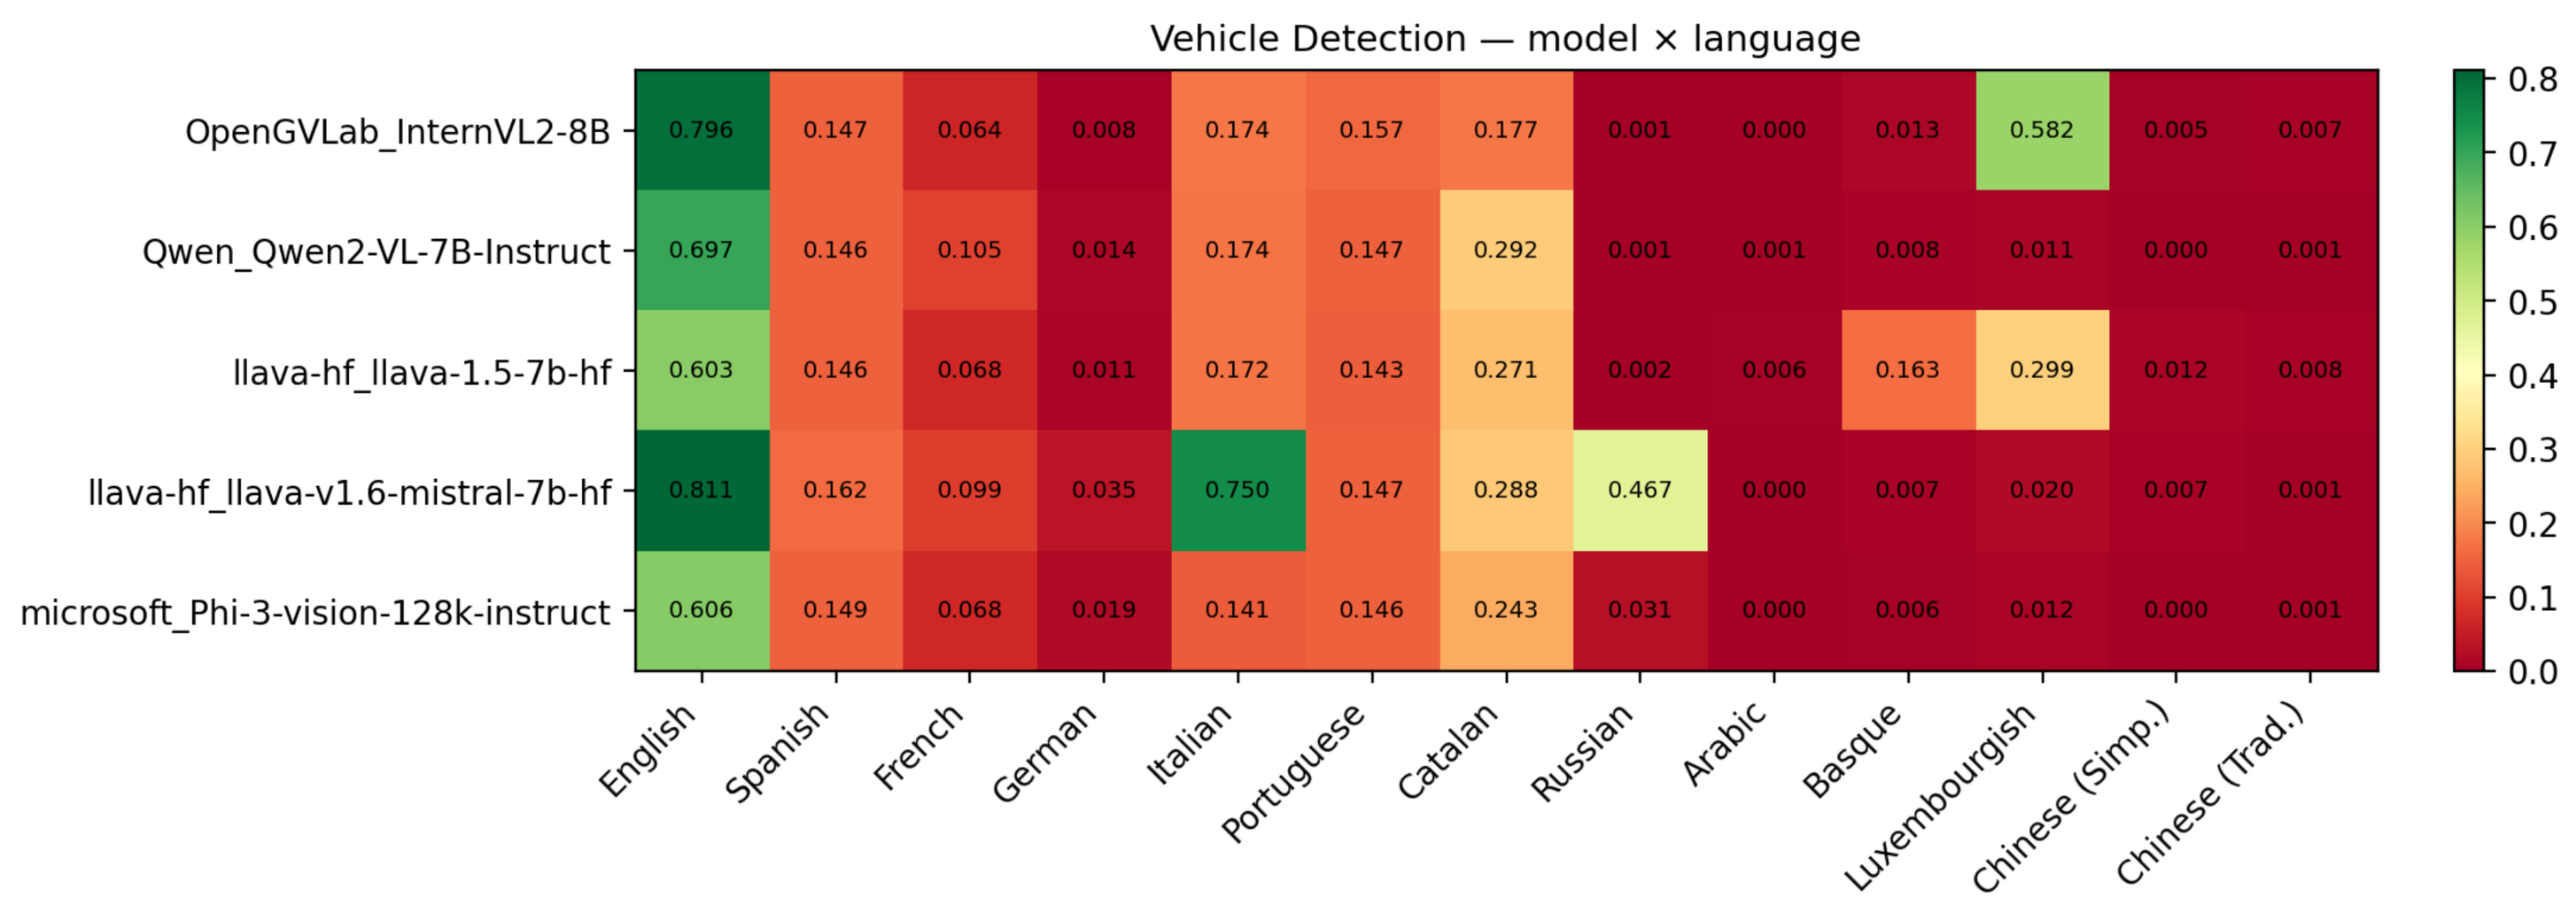
LLaVA-1.6 leads convincingly ( S ¯ vehicle = 0.215 ), and achieves the highest single-cell value in the entire experiment on English ( 0.811 ). Its Italian ( 0.750 ) and Russian ( 0.467 ) values are exceptional: the Mistral-7B language backbone generates structured responses in these languages containing English loanword traffic vocabulary (auto, bus, and avtobus) that matches the English keyword lexicon. Phi-3-V ranks last ( 0.109 ). The Friedman test is not significant ( χ 2 = 5.76 ; p = 0.218 ). InternVL2 achieves a notable 0.582 on Luxembourgish, driven by German-proximity keyword recall.
Figure 7 shows the full model × language summary.
Road condition (medium).
This is the most linguistically sensitive medium-difficulty task in the battery. The Friedman test is significant ( χ 2 = 11.02 ; p = 0.026 ). LLaVA-1.6 leads ( S ¯ road = 0.083 ); LLaVA-1.5 ranks last ( 0.036 ) despite its second-place standing overall. Figure 8 shows that the vast majority of non-English cells are exactly 0.000 across all models: Arabic, Basque, both Chinese variants, and most other non-Romance languages contain none of the English feature keywords (paved, asphalt, lane, clear, day, straight, and urban). The sole substantial non-English outlier is Phi-3-V on Russian ( 0.230 ), consistent with the Phi-3 model family’s documented Cyrillic handling [43].
Navigation reasoning (hard).
InternVL2 ranks first on this task ( S ¯ nav = 0.127 ), followed by LLaVA-1.5 ( 0.124 ), both overtaking LLaVA-1.6 ( 0.113 ), a ranking reversal relative to overall accuracy. The Friedman test is significant ( χ 2 = 13.35 ; p = 0.010 ), the strongest performance-based statistical result in the study. InternVL2 achieves the highest English navigation score ( 0.407 ), followed by Qwen2-VL ( 0.368 ) and LLaVA-1.6 ( 0.327 ). The relative drop of LLaVA-1.6 on this task suggests that the verbose Mistral-backbone outputs dilute the spatial keyword signal in the hybrid scorer. French consistently ranks second across all five models ( 0.194 0.222 ), attributable to the proximity of French spatial vocabulary (gauche, droite, and tout droit) to the English navigation keyword lexicon. Arabic and Basque collapse near zero, with the exception of LLaVA-1.5 on Basque ( 0.149 ).
The full model × language summary is shown in Figure 9.

4.3. Per-Language Performance Patterns

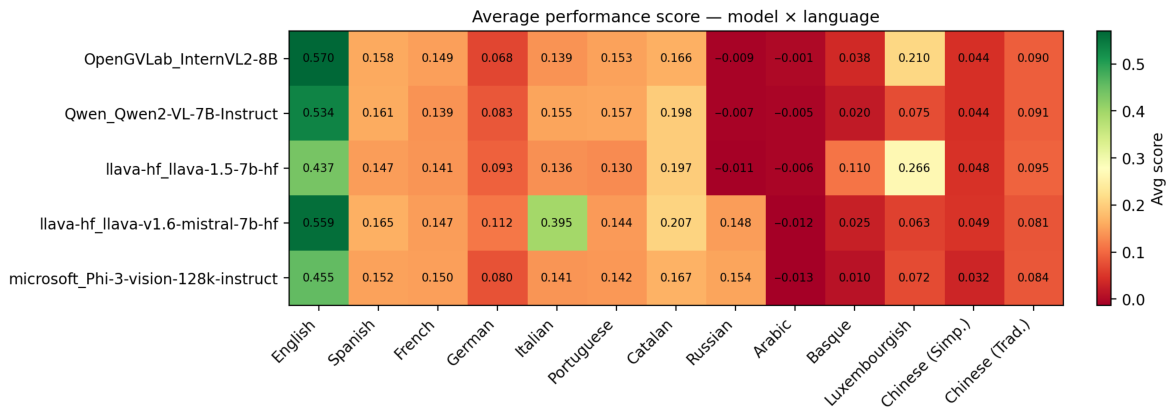
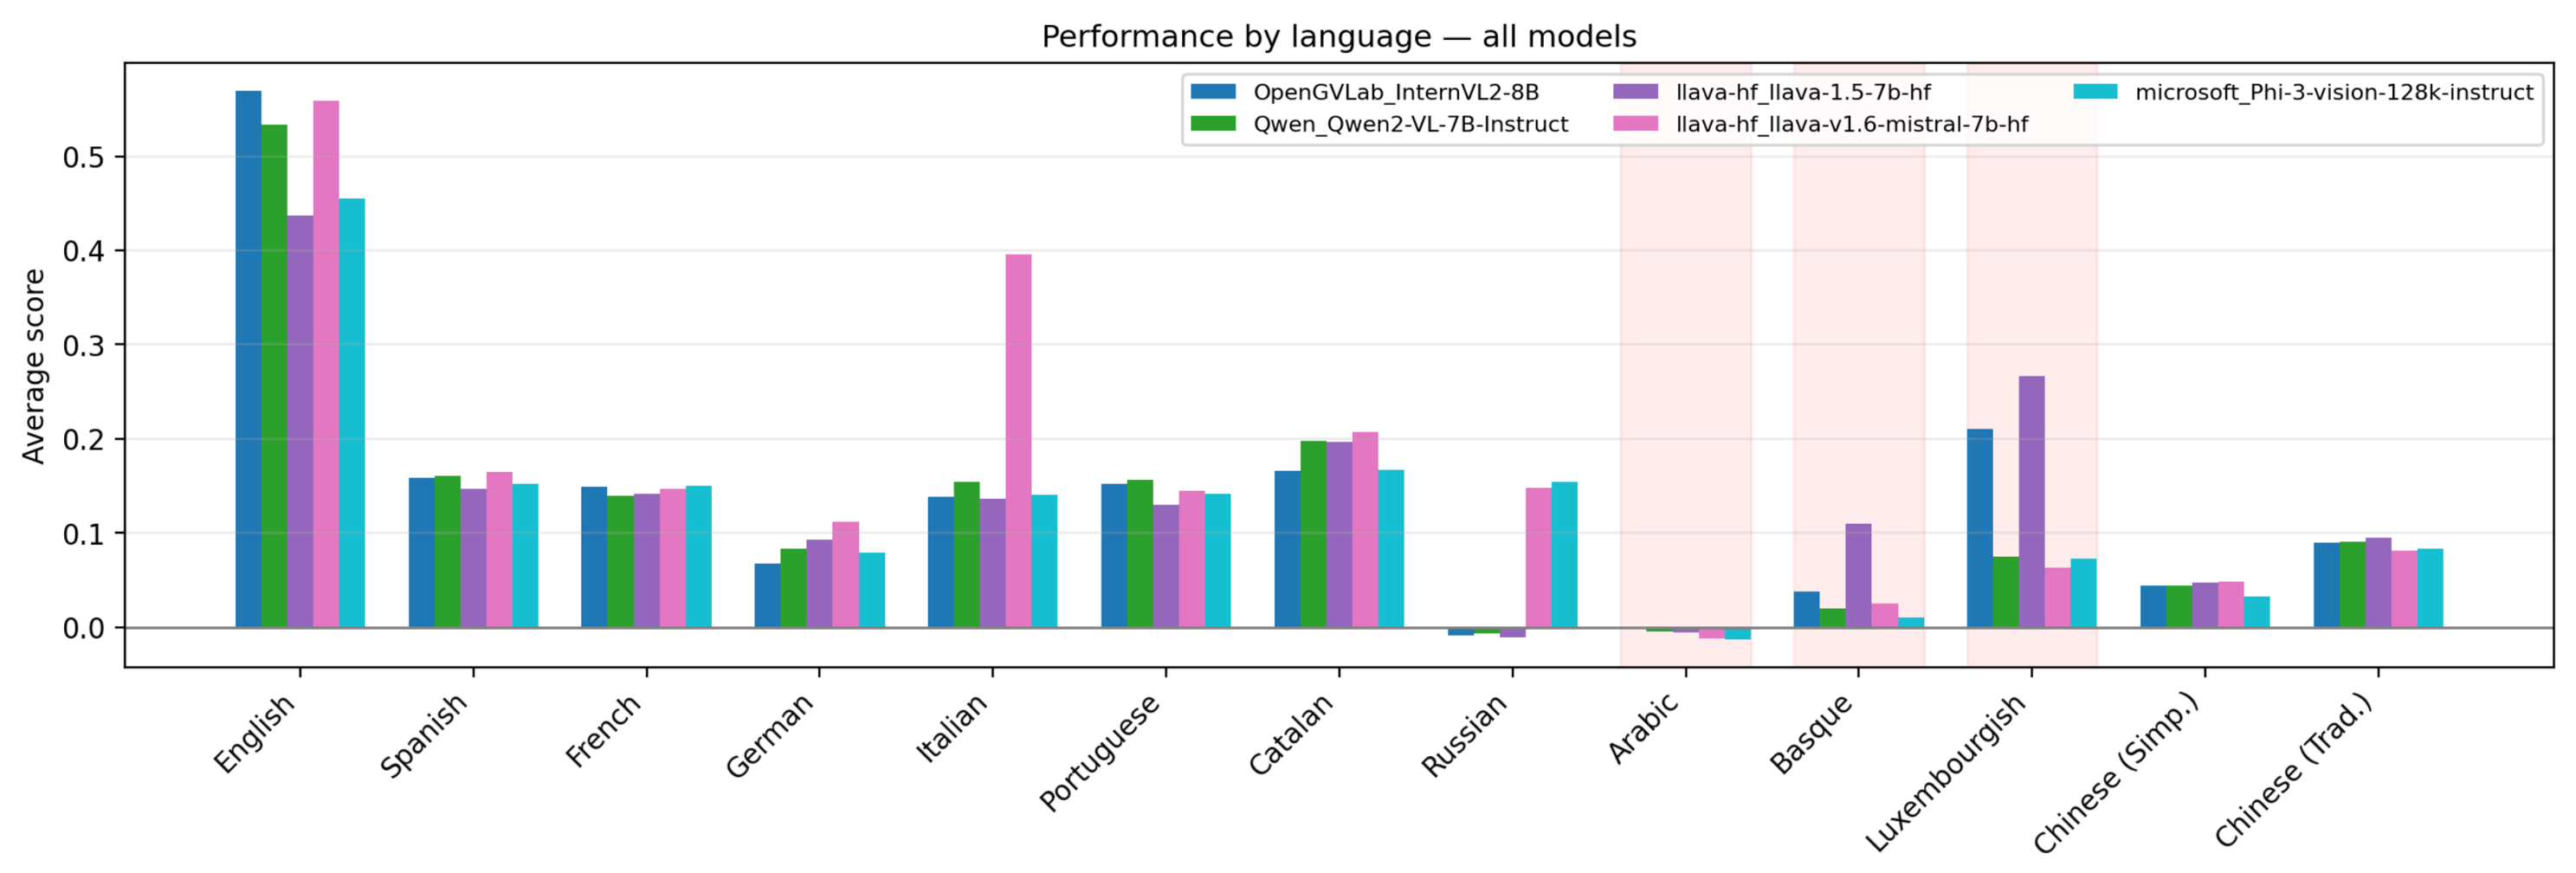
Figure 10 presents the full model × language matrix for the average score over all four tasks. Figure 11 compares all models side-by-side per language with the low-resource varieties highlighted. Figure 12 summarises performance across difficulty levels for all 13 languages. The energy counterparts of this analysis are presented in Section 4.4: total and normalised energy consumption per model in Figure 13, per-language energy intensity for every (model, language) pair in Figure 14, and the joint performance–energy deviation relative to English in Figure 15.
Negative values for Arabic and Russian reflect cosine similarity anti-correlation with the English-anchored reference embedding.
English dominance.
All five models peak on English: InternVL2 ( 0.570 ), LLaVA-1.6 ( 0.559 ), Qwen2-VL ( 0.534 ), Phi-3-V ( 0.455 ), and LLaVA-1.5 ( 0.437 ). These values are 3.2 4.2 × higher than the corresponding multilingual averages, quantifying the English pretraining bias embedded in all five architectures.
High-resource Romance and Germanic languages.
Spanish, French, Italian, Portuguese, and Catalan occupy an intermediate tier ( 0.08 0.22 ). German scores ( 0.068 0.112 ) consistently lower than the Romance tier, likely due to German compound noun formation fragmenting keyword matches. The outstanding non-English value is LLaVA-1.6 on Italian ( 0.395 ), driven primarily by vehicle detection ( 0.750 ).
Russian.
Near-zero or negative averages for InternVL2 ( 0.009 ), LLaVA-1.5 ( 0.011 ), and Qwen2-VL ( 0.007 ) reflect the absence of Cyrillic in the English keyword lexicons and the cosine-similarity penalty from script distance. Phi-3-V ( 0.154 ) and LLaVA-1.6 ( 0.148 ) partially recover via their language models’ stronger Cyrillic generation capacity.
Arabic.
Arabic displays uniformly near-zero or negative across all five models ( 0.001 to 0.014 ). Arabic produces the deepest per-cell penalties in the Δ -score heatmap, reaching 0.571 for InternVL2. Right-to-left script, distinct tokenisation, and the complete absence of Arabic-language entries in the English keyword lexicons collectively drive this collapse.
Basque and Luxembourgish.
Basque falls below 0.040 for four of five models; LLaVA-1.5 ( 0.110 ) is the sole exception attributable partly to scene-understanding and navigation outliers. The low Basque energy figures are an artefact of inference collapse rather than genuine efficiency. Luxembourgish benefits from lexical proximity to German and French, yielding LLaVA-1.5 ( 0.266 ) and InternVL2 ( 0.210 ) as the highest Luxembourgish values in the study.
Chinese.
Both Chinese variants cluster in the 0.03 0.10 band, with Chinese Traditional ( 0.081 0.095 ) consistently above Simplified ( 0.032 0.049 ). The cross-lingual Sentence-BERT embedding partially recovers semantic signal for Chinese scene descriptions, yielding non-zero but depressed scores.

4.4. Energy Consumption on the NVIDIA H200 GPU

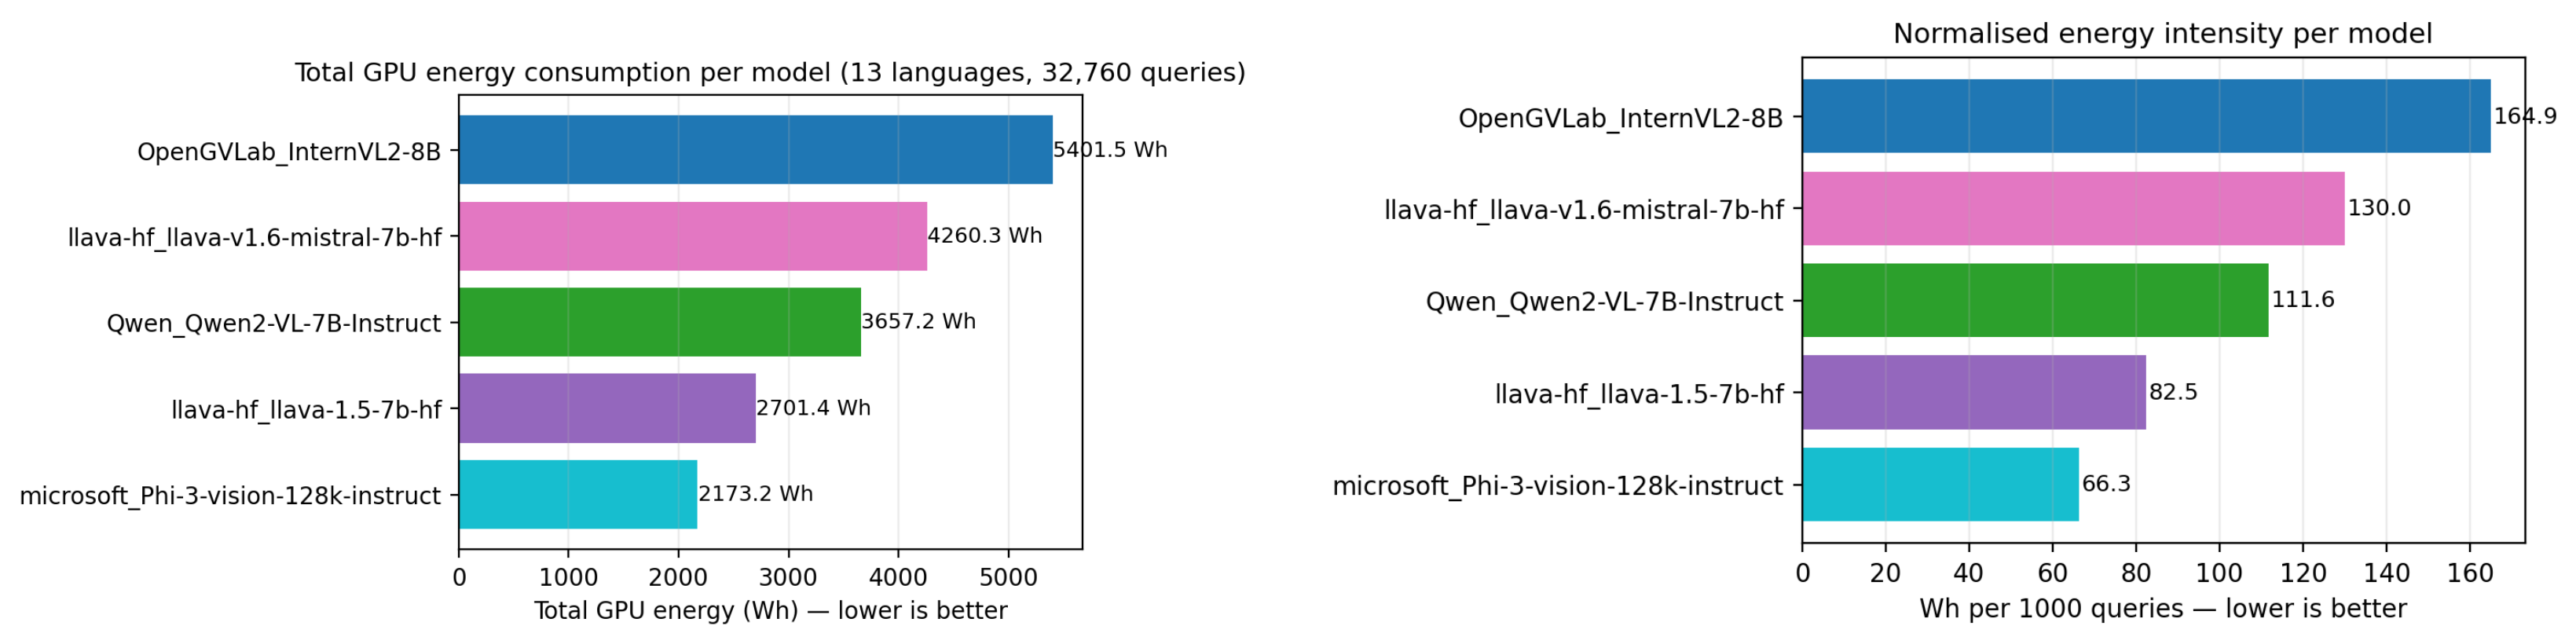
Figure 13 reports total GPU energy and the normalised E 1 K ( Wh per 1000 queries) for each model over the full 32,760-query evaluation.
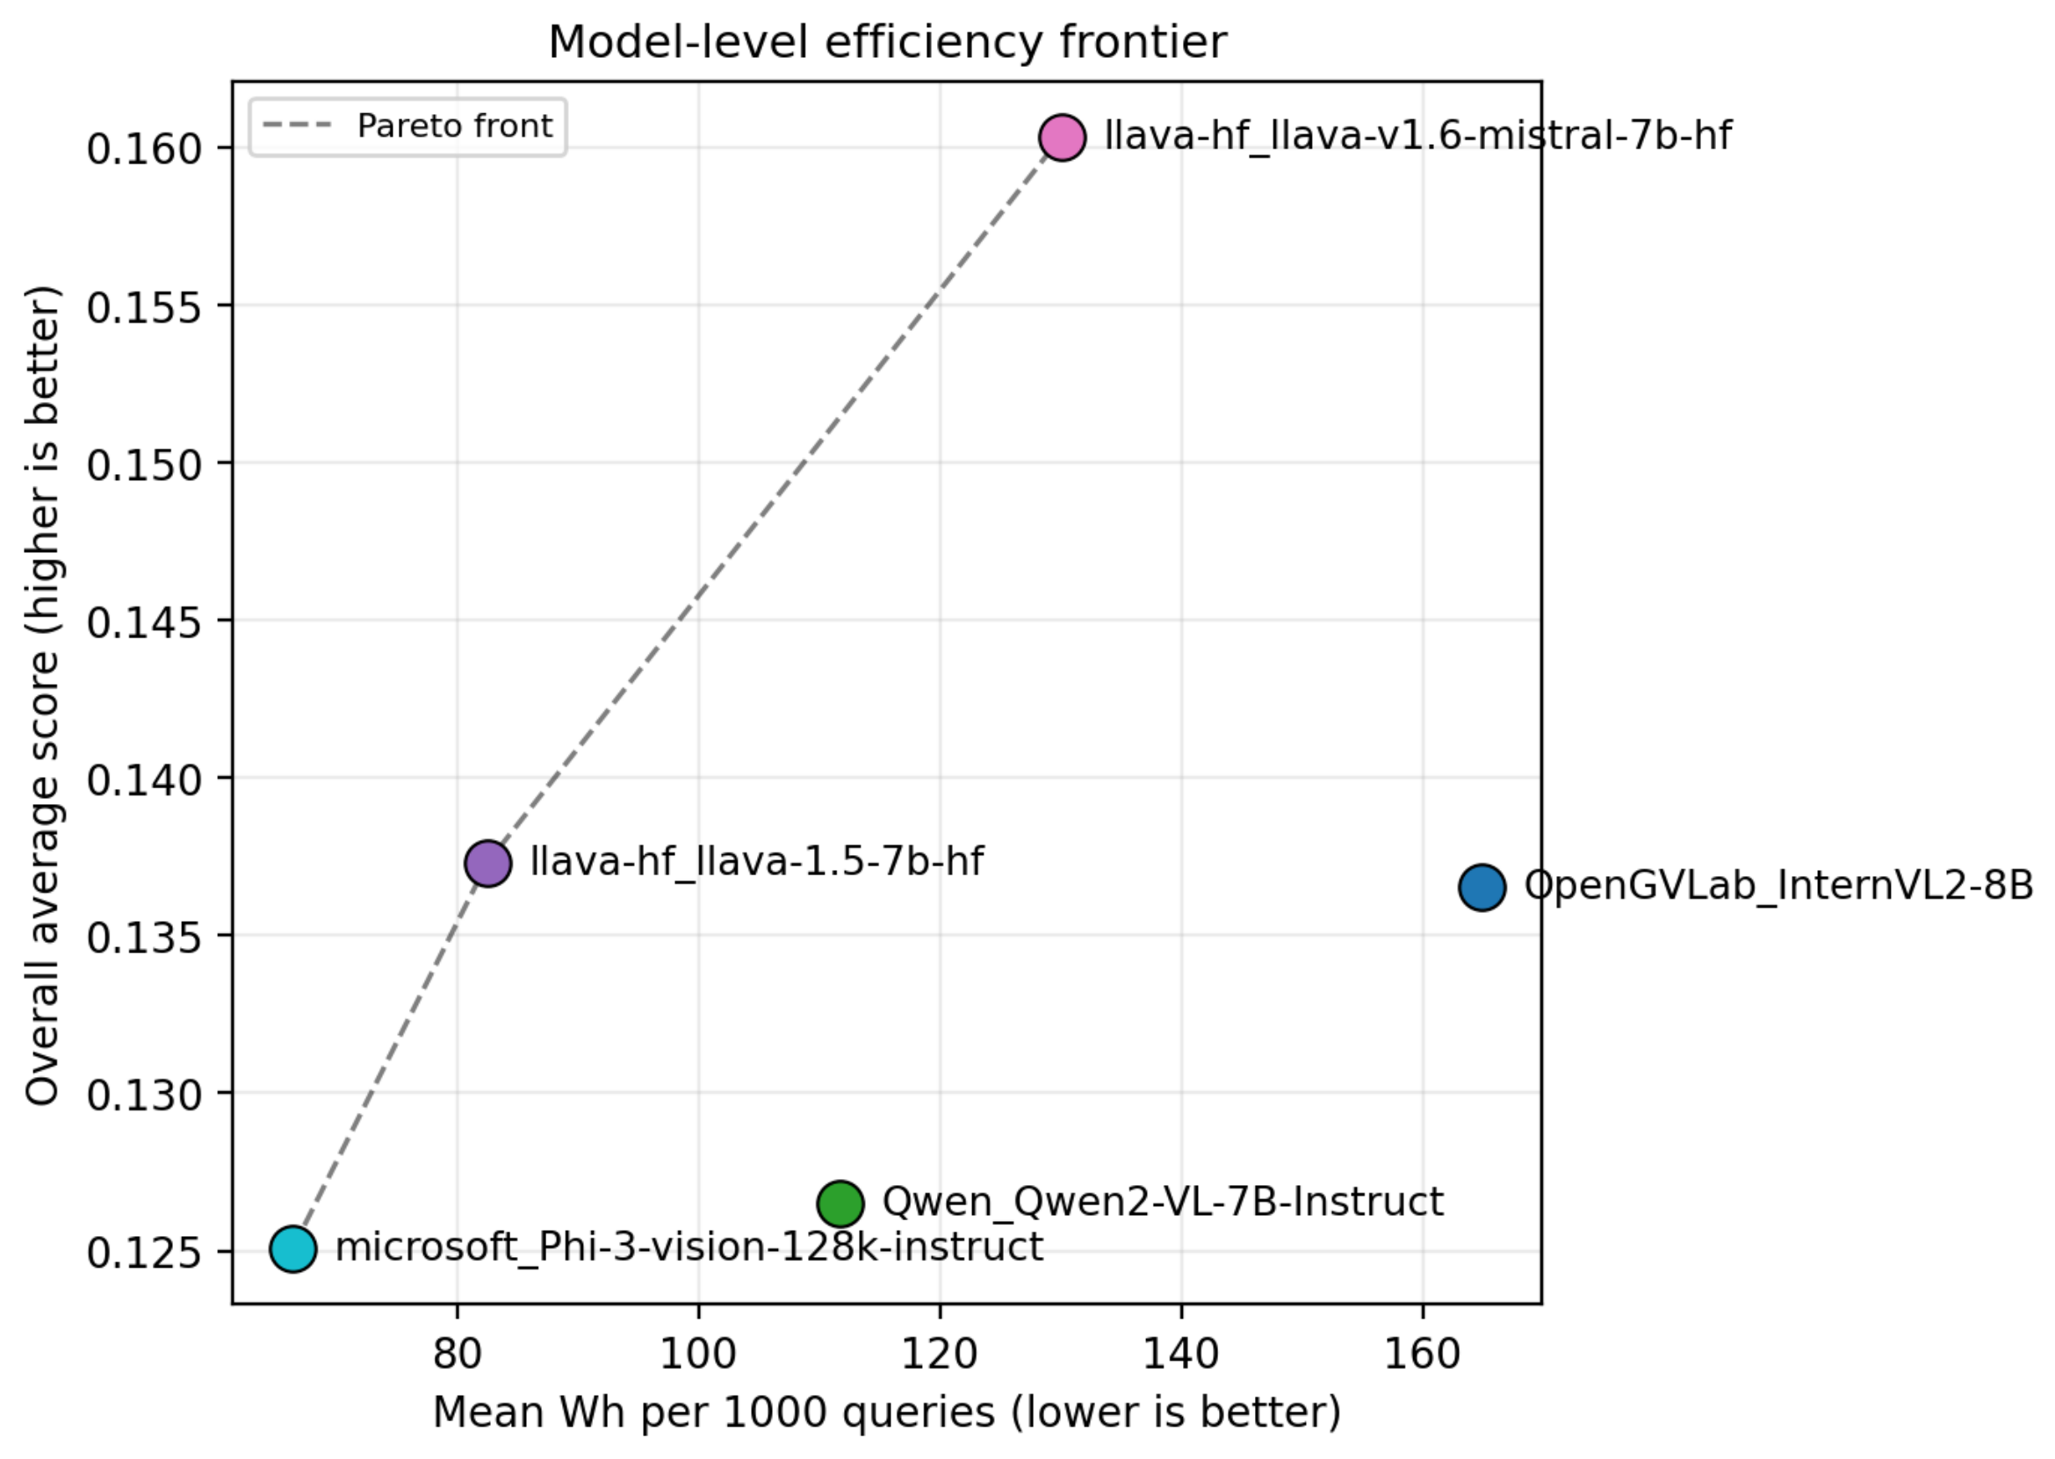
InternVL2 is the most energy-intensive model ( E 1 K = 164.9   Wh /1K; E total = 5401.5   Wh ), reflecting the sequential overhead of its 6B-parameter InternViT encoder forward pass prior to the language decoder. LLaVA-1.6 ranks second ( 130.0   Wh /1K; 4260.3   Wh ) because its 4 × resolution tiling scheme multiplies the effective visual token count per image. Phi-3-V achieves the lowest energy intensity ( 66.3   Wh /1K; 2173.2   Wh ) owing to its compact Azure-AI CLIP projection and streamlined single-image pipeline. LLaVA-1.5 is the second most efficient ( 82.5   Wh /1K), benefiting from the absence of the tiling overhead introduced in its 1.6 successor.
The Friedman test on wh_per_1000 ( χ 2 = 40.43 ; p = 3.5 × 10 8 ) is by far the most significant statistical result in the study, confirming that energy rankings are fully systematic across all 13 language blocks.
All ten Spearman correlations between energy and performance metrics are non-significant (all p 0.116 ; overall accuracy: ρ = 0.001 , p = 0.995 , and n = 65 ). Energy expenditure on the H200 is statistically independent of perception quality, granting UAV system designers genuine latitude to select models on energy grounds without accuracy penalty.

Language-Dependent Energy Variation

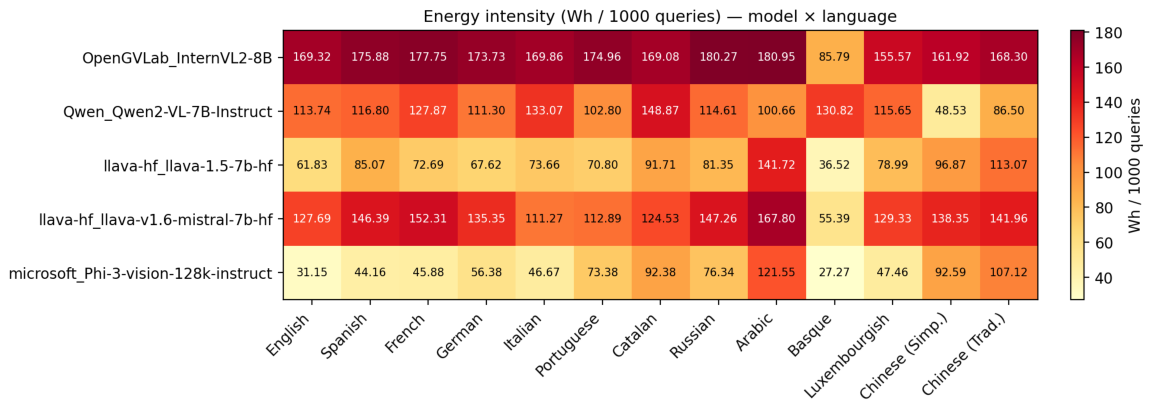
Figure 14 reveals substantial within-model energy variation across languages. InternVL2 ranges from 85.8   Wh /1K (Basque) to 181.0   Wh /1K (Arabic), a 2.1 × within-model spread. Phi-3-V exhibits the most extreme range: 27.3   Wh /1K (Basque) to 121.6   Wh /1K (Arabic), a 4.5 × ratio. The anomalously low Basque values across models reflect very short or null model responses that terminate inference early.
Figure 15 places performance and energy deviations relative to English side by side. The performance delta panel (left) is uniformly red: not a single non-English language exceeds English for any model.
The energy delta panel (right) shows Arabic as the most expensive language relative to English for four of the five models (Phi-3-V: + 90.4   Wh /1K; LLaVA-1.5: + 79.9 ; LLaVA-1.6: + 40.1 ; and InternVL2: + 11.6 ), while Qwen2-VL’s Arabic delta is negative ( 13.1   Wh /1K), reflecting stronger Arabic tokenisation from its broader multilingual pretraining [42]. Note that Phi-3-V’s large Arabic energy premium reflects not only the cost of Arabic inference but also its exceptionally efficient English performance ( 31.2   Wh /1K, the lowest English energy in the study).
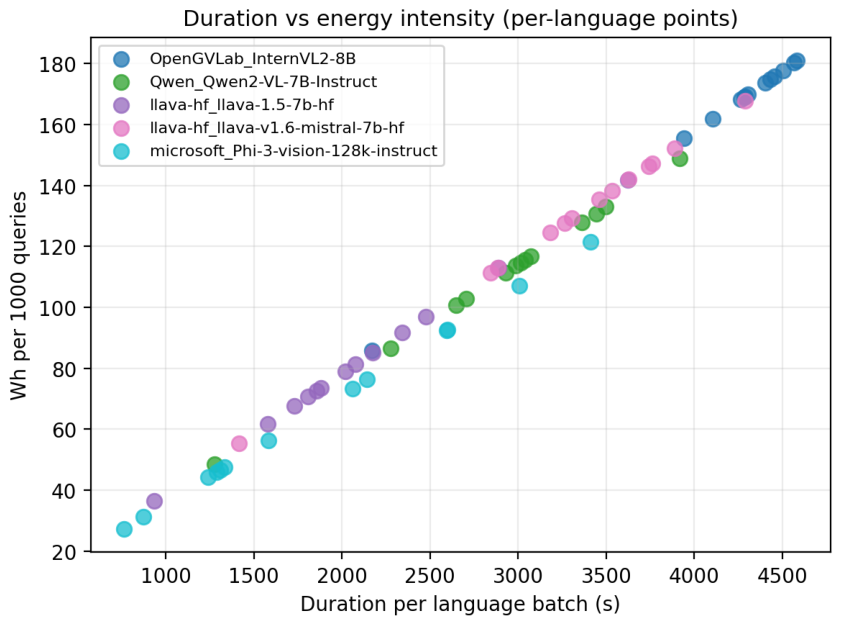
The duration–energy scatter (Figure 16) shows that E 1 K is effectively a linear function of per-language inference wall time ( R 2 > 0.99 ), with each model following a near-perfect linear trend per model. On the H200 the GPU power draw is essentially constant within each architecture during inference; the small vertical offsets between model lines reflect their differing mean power draws (323–358 W) rather than any language-induced compute pattern. Language-induced energy differences within a model arise entirely from inference latency (output sequence length).

4.5. Efficiency Frontier and Composite Ranking

Figure 17 plots the model-level Pareto frontier in the accuracy–energy space. The Pareto front connects Phi-3-V, LLaVA-1.5, and LLaVA-1.6: these three models are non-dominated. InternVL2 (high energy; not highest accuracy) and Qwen2-VL (intermediate energy; below-frontier accuracy) are both dominated.
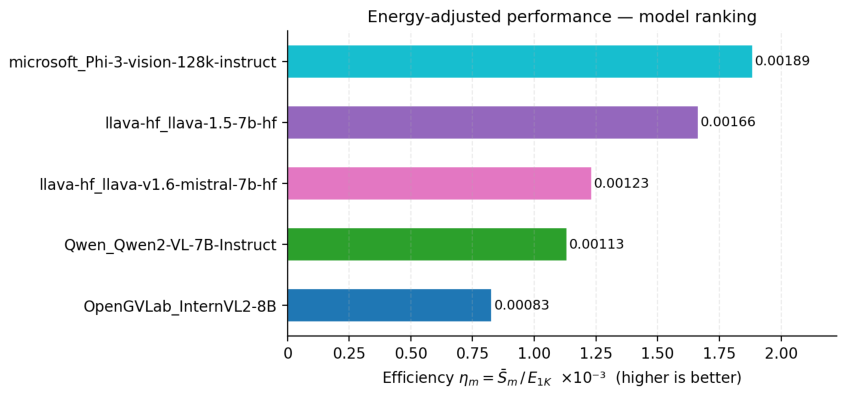
The energy-adjusted efficiency ratio η m = S ¯ m / E 1 K , m (Figure 18) consolidates both dimensions for mission-oriented model selection.
Phi-3-V leads ( η = 1.89 × 10 3 ), followed by LLaVA-1.5 ( 1.66 × 10 3 ), LLaVA-1.6 ( 1.23 × 10 3 ), Qwen2-VL ( 1.13 × 10 3 ), and InternVL2 ( 8.3 × 10 4 ). Phi-3-V’s 2.28 × advantage over InternVL2 combines a 59.8 % energy reduction with only an 8.8 % relative accuracy loss.
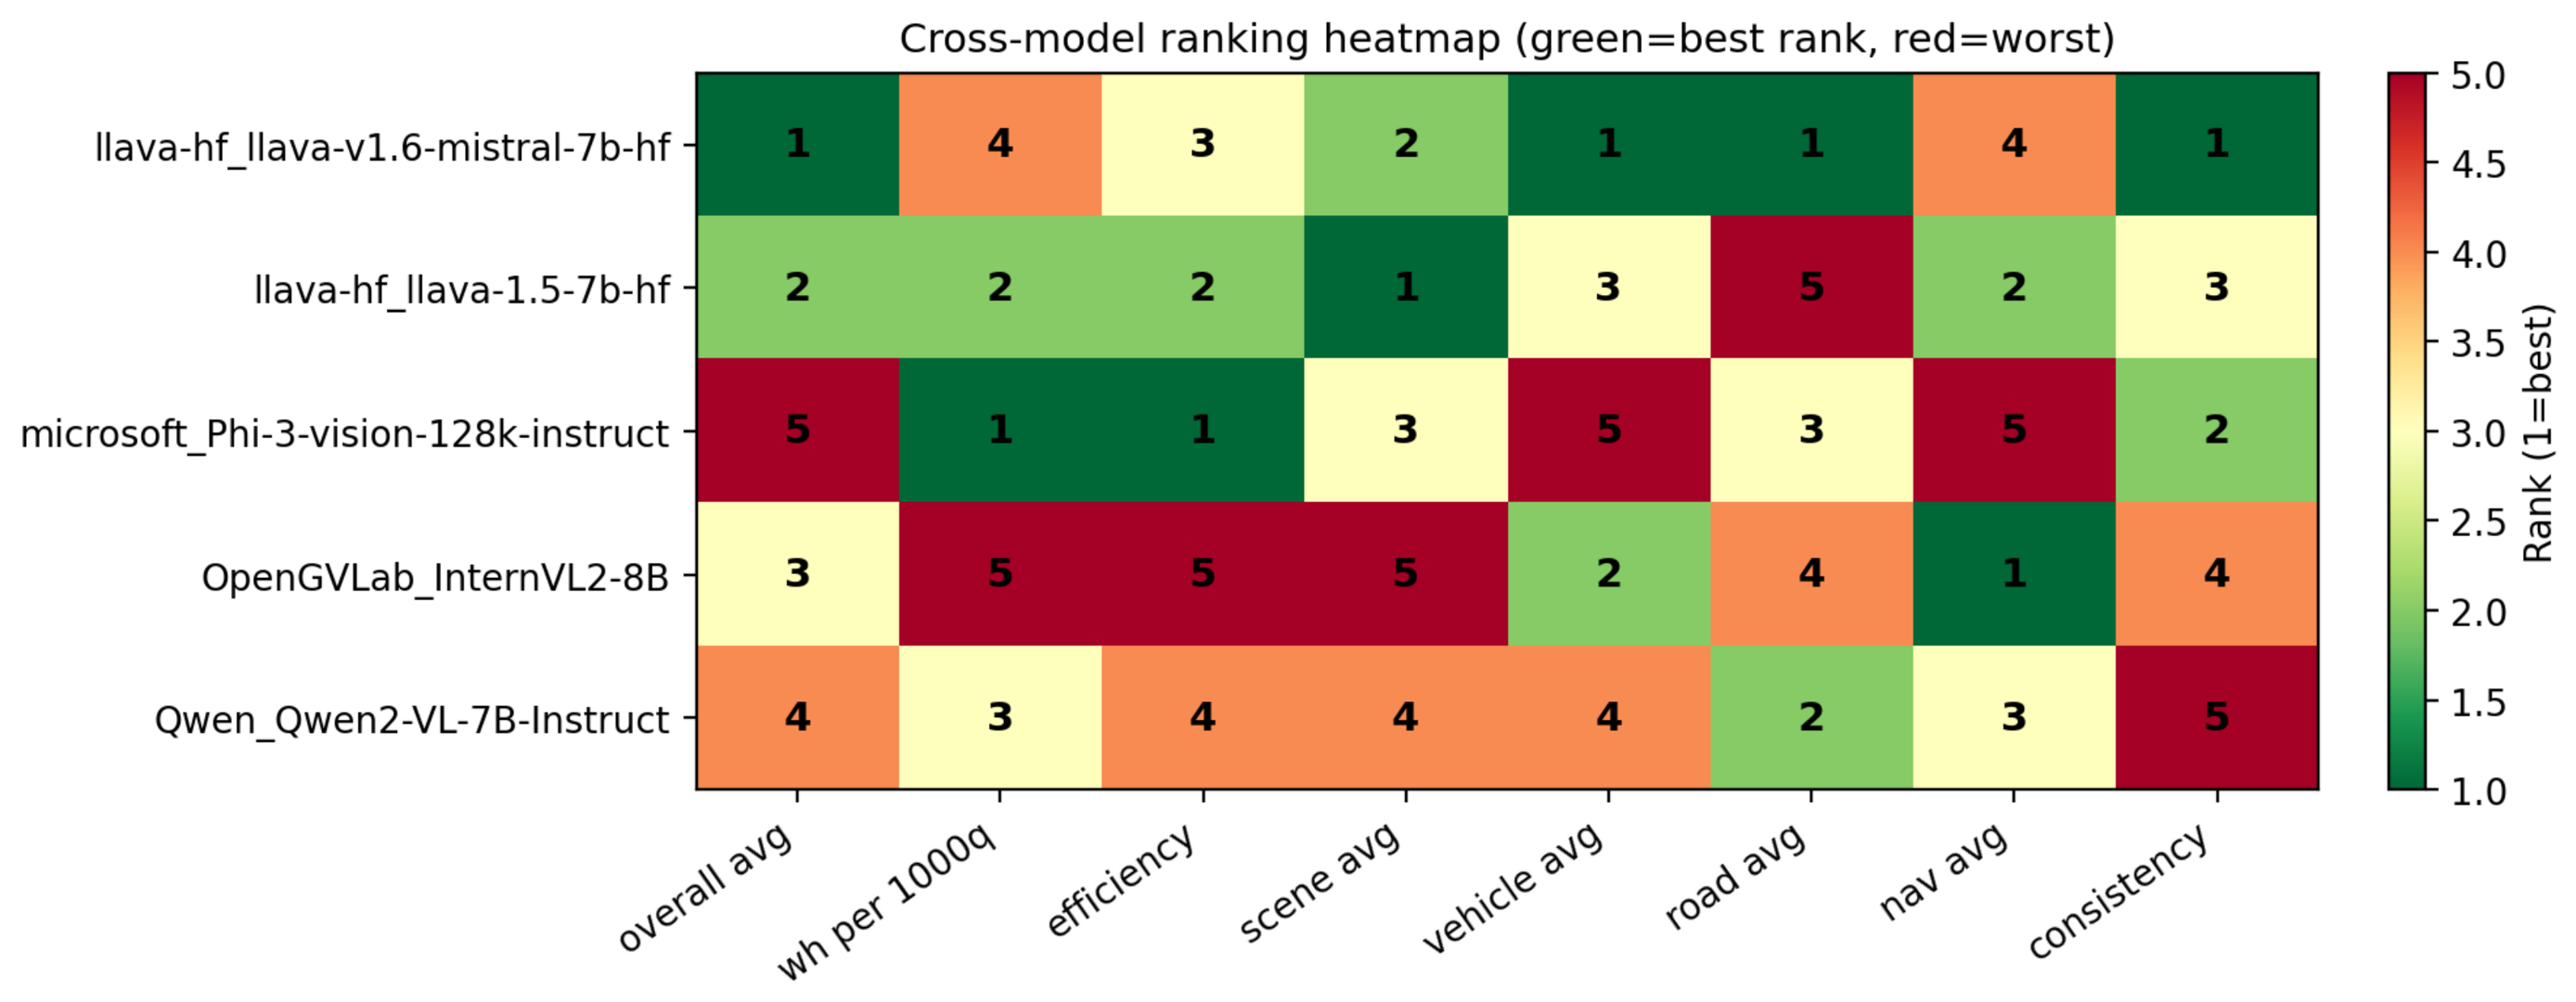
Figure 19 provides a holistic multi-metric view through the cross-model ranking heatmap. LLaVA-1.6 achieves the best mean rank ( r ¯ = 2.12 ), placing first in overall accuracy, vehicle detection, road condition, and second in scene understanding, but ranked fourth in energy and navigation. LLaVA-1.5 is second overall ( r ¯ = 2.50 ), ranked first in scene understanding and second in navigation, accuracy, energy, and efficiency. Phi-3-V places third ( r ¯ = 3.12 ), ranked first in energy and efficiency but fifth in overall accuracy and vehicle detection. InternVL2 ( r ¯ = 3.62 ) ranks first in navigation and second in vehicle detection but last in energy and efficiency. Qwen2-VL ( r ¯ = 3.62 ) shares fourth place, with consistency as its sole first-place ranking.

4.6. Mission-Level Query Budget on Commercial UAV Platforms

Equations (4) and (5) are instantiated with the empirical E 1 K values from Table 5 for four commercial UAV platforms spanning the enterprise performance spectrum (Table 6 and Table 7). Platform parameters are taken from DJI official specifications under no-payload, sea-level, windless conditions; the actual endurance with a sensor payload would be lower. We set α = 0.10 (at most, 10% of battery energy reserved for inference) throughout, and examine three query rates: f q { 1 / 20 , 1 / 10 , 1 / 5 }  Hz, corresponding respectively to one query every 20 s (infrastructure inspection), 10 s (search-and-rescue), and 5 s (real-time obstacle avoidance).
Platforms.
The four platforms are as follows:
  • DJI Matrice 300 RTK [15]: Heavy-lift inspection platform; two TB60 batteries ( B = 548   Wh ); P base = 598  W; and T 0 = 55  min.
  • DJI Matrice 350 RTK [17]: Next-generation heavy-lift successor; two TB65 batteries ( B = 322.8   Wh ; 161.4   Wh each); P base = 352  W; and T 0 = 55  min.
  • DJI Matrice 30 [16]: Compact enterprise UAV; TB30 battery ( B = 131.6   Wh ); P base = 193  W; and T 0 = 41  min.
  • DJI Mavic 3 Enterprise [18]: Portable reconnaissance UAV; B = 77   Wh ; P base = 103  W; and T 0 = 45  min.
Heavy-lift platforms (Matrice 300 and 350 RTK).
Both heavy platforms admit all five models at f q = 1 / 20  Hz, with endurance losses ranging from 1.1  min (Phi-3-V on the M300 RTK) to 4.3  min (InternVL2 on the M350 RTK), representing 2.0–7.8% of T 0 . These losses are operationally acceptable for infrastructure inspection and border surveillance missions. Equation (5) selects LLaVA-1.6 as Pareto-optimal on both platforms ( E 1 K = 130.0 < 196 and 332; S ¯ = 0.160 ). At the higher rate, f q = 1 / 10  Hz, the M300 RTK retains all five models ( E 1 K max = 166 ; InternVL2 marginally within budget at 164.9 ), while the M350 RTK tightens to Phi-3-V and LLaVA-1.5 only ( E 1 K max = 98 ). At f q = 1 / 5  Hz (real-time avoidance cadence), the M300 RTK admits only Phi-3-V and LLaVA-1.5 ( E 1 K max = 83 ), and no model satisfies the M350 RTK budget.
Compact enterprise platform (Matrice 30).
At f q = 1 / 20  Hz only Phi-3-V ( 66.3   Wh /1K) and LLaVA-1.5 ( 82.5   Wh /1K) are admitted ( E 1 K max = 107 ); the optimiser selects LLaVA-1.5, recovering 9.6% relative accuracy over Phi-3-V at only a 24% higher energy cost and a modest 2.9  min endurance penalty (7.1% of T 0 = 41  min). InternVL2 and LLaVA-1.6 are excluded: their endurance penalties of 5.5 and 4.4 min (13.3% and 10.8% of T 0 ) exceed the 10% operational threshold. At f q = 1 / 10  Hz, no model satisfies the budget ( E 1 K max = 54 ), confirming that the Matrice 30 is unsuitable for frequent onboard VLM querying without model compression.
Portable reconnaissance platform (Mavic 3 Enterprise).
The Mavic 3 Enterprise represents the most energy-constrained deployment scenario studied. At f q = 1 / 20  Hz, E 1 K max = 57   Wh /1K, which no evaluated model satisfies; even Phi-3-V at 66.3  Wh /1K would incur a 4.7 min (10.4%) loss and violate the α = 0.10 budget. At f q = 1 / 10  Hz, the threshold falls further to 29  Wh /1K. These results establish a hard architectural boundary: standard 7–8B VLMs are not deployable on ultra-compact UAVs at operationally meaningful query rates without either hardware-specific quantisation (reducing E 1 K by a factor κ 0.86 ) or relaxing the inference budget fraction α .
Sensitivity and co-design implications.
Table 7 reveals that endurance loss scales quasi-linearly with E 1 K , confirming that f q and model selection are the dominant co-design parameters. Across all platforms, the difference between the most and least efficient model corresponds to 1.5–5.4 min of additional hover time per mission, a non-trivial operational factor in time-critical deployments such as search-and-rescue. The statistical independence of S ¯ and E 1 K ( ρ = 0.001 ; p = 0.995 ) guarantees that reducing E 1 K through model selection does not impose a perception quality penalty beyond what is inherent in the feasible set.
A final caveat concerns hardware transferability. All E 1 K values feeding Equations (4) and (5) are measured on an NVIDIA H200 SXM server GPU. Edge deployment on accelerators such as the NVIDIA Jetson AGX Orin (∼275 sparse TOPS; ≤60 W TDP), Jetson Orin NX (≤25 W TDP), or DRIVE Thor (∼130 W TDP) would either simply scale all E 1 K values by a uniform factor κ < 1 or otherwise alter them: differences in memory bandwidth, tiling overhead, and quantisation support across architectures may alter the inter-model ranking itself, potentially shifting the admitted set { m : E 1 K ( m ) E 1 K max } and hence the Pareto-optimal choice. The platform-level recommendations in Table 6 and Table 7 should therefore be read as server-side reference selections that establish the relative position of each VLM under controlled conditions; their direct operational use on a specific drone–accelerator combination requires re-measurement on the target edge platform under the same AI Energy Score protocol, a step we strongly recommend prior to field deployment.

4.7. Double-Penalty Effect for Low-Resource Languages

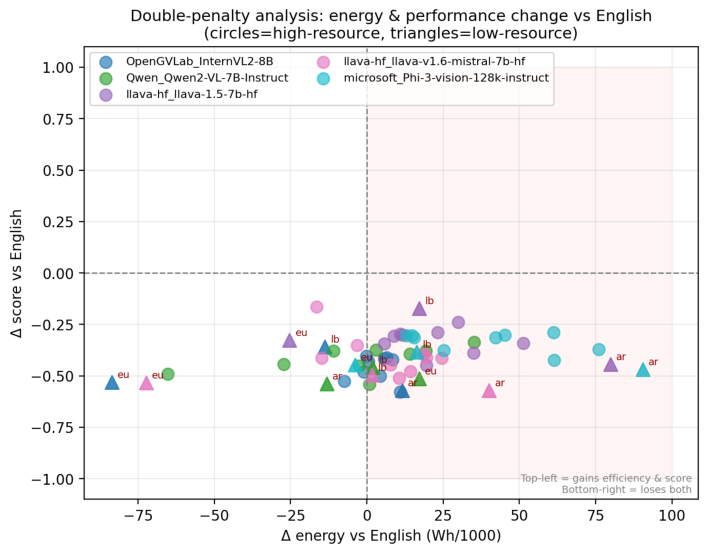
Figure 20 visualises the joint accuracy–energy displacement of each (model and language) pair relative to English, distinguishing low-resource language triangles (ar, eu, lb) from high-resource circles.
The scatter confirms the double-penalty hypothesis for three language categories:
  • Arabic (ar) is the clearest and most severe manifestation: its accuracy drops by 0.469 to 0.571 across all five models, combined with an energy premia of + 11.6 to + 90.4   Wh /1K in four of the five models. Arabic triangles cluster firmly in the lower-right quadrant. Qwen2-VL is the sole exception ( Δ E = 13.1   Wh /1K), reflecting more efficient Arabic tokenisation from its broader multilingual pretraining [42].
  • Basque (eu) incurs steep accuracy penalties ( Δ S ¯ from 0.327 to 0.533 ) and shows a predominantly negative energy signature. Four of the five models exhibit negative Basque energy deltas: InternVL2 ( Δ E = 83.5   Wh /1K), LLaVA-1.6 ( 72.3   Wh /1K), LLaVA-1.5 ( 25.3   Wh /1K), and Phi-3-V ( 3.9   Wh /1K). These models return very short or null responses to Basque prompts, terminating inference early. The corresponding Basque triangles appear in the lower-left quadrant of Figure 20 and represent a collapse penalty, inference latency reduced through model failure, rather than a genuine efficiency gain. Qwen2-VL is the exception, showing a positive delta ( + 17.1   Wh /1K), suggesting that it generates more substantive Basque responses at the cost of higher energy.
  • Luxembourgish (lb) shows milder accuracy penalties due to lexical proximity to German and French. LLaVA-1.5 achieves Δ S ¯ ( lb ) = 0.171 , the shallowest accuracy gap among all low-resource languages in the study, though its energy premium reaches + 17.2   Wh /1K relative to English.
High-resource language circles scatter in the lower-centre region with systematic accuracy drops but no compounded energy premium, confirming that well-represented languages pay an accuracy cost without the additional inference-cost burden documented for low-resource varieties. The structural separation between low- and high-resource language clusters in the accuracy–energy plane constitutes the central empirical contribution of the paper, with direct operational implications for multilingual UAV deployment in non-English-dominant field environments.

5. Discussion

The results establish three interconnected findings with direct implications for multilingual UAV deployment.

5.1. Energy and Accuracy Are Orthogonal Design Axes

The Spearman correlation between E 1 K and S ¯ is ρ = 0.001 ( p = 0.995 ; n = 65 ), and this independence holds across all four individual task types. On the H200 SXM, GPU power draw is essentially constant during inference (323–358 W), so energy cost is determined purely by inference latency, itself a function of architecture and tokenisation efficiency rather than of perceptual quality. This finding liberates UAV designers from a presumed accuracy–energy trade-off: the Pareto front (Phi-3-V, LLaVA-1.5, and LLaVA-1.6) provides three distinct operating points that can be selected on energy budget grounds alone without sacrificing proportional accuracy. Phi-3-V is the recommended choice for energy-constrained platforms (e.g., fixed-wing UAVs with limited onboard power), LLaVA-1.5 for mid-range deployments, and LLaVA-1.6, where accuracy is paramount and energy is unconstrained. The formal query budget constraint (Equation (4)) makes this operational: for a given platform battery capacity B, baseline power P base , energy fraction α , and query rate f q , the admissible model set is determined analytically, and the statistical independence of S ¯ and E 1 K guarantees that the highest-accuracy admitted model is also Pareto-optimal.

5.2. The Double Penalty Is Real and Language-Family Structured

Every non-English language degrades accuracy relative to English without exception. For high-resource languages, the penalty is moderate and energy-neutral. For Arabic, the double penalty is severe: up to 0.571 in accuracy and + 90.4   Wh /1K in energy cost across four of five models. The large energy premia reflect not only the cost of Arabic inference but also the exceptionally efficient English baselines of some models: Phi-3-V’s English costs only 31.2   Wh /1K, so even a moderate absolute Arabic overhead translates to a large relative delta. Basque represents an edge case of collapse rather than degradation: four of the five models produce null or very short responses to Basque prompts, which incidentally reduces attributed energy but at the cost of complete task failure. Only Qwen2-VL generates substantive Basque responses at the cost of a positive energy delta ( + 17.1   Wh /1K), confirming that genuine multilingual engagement is more expensive than inference collapse. The practical implication is clear: deploying any of the five evaluated VLMs in Arabic-, Basque-, or Chinese-speaking operational regions without targeted multilingual fine-tuning will produce unreliable UAV perception outputs. Qwen2-VL is the partial exception for Arabic, owing to its broader pretraining corpus, and represents the preferable choice for Middle Eastern or North African deployments.

5.3. Task Architecture Matters More than Model Size

All five models are in the 7–8B parameter range yet show systematic task-type specialisation: LLaVA-1.5 leads on scene understanding despite ranking second overall, while LLaVA-1.6 dominates vehicle detection and road condition (road: Friedman χ 2 = 11.02 ; p = 0.026 ). InternVL2 and LLaVA-1.5 lead on navigation reasoning (Friedman χ 2 = 13.35 ; p = 0.010 —the strongest performance-based result in the study), reversing the overall ranking. The inversion on the hardest task suggests that verbose Mistral-backbone responses dilute the spatial keyword signal, favouring more concise architectures for direction-critical UAV commands. The absence of any statistically significant pairwise ranking after Holm correction ( p Holm 0.574 for all ten model pairs) underscores that no single model dominates across all sensing dimensions, reinforcing the value of the multi-metric composite ranking framework introduced here.

5.4. Limitations

The present study has four limitations that bound the generalisability of its findings and identify the most consequential extensions for future work.
Imaging-modality scope.
The evaluation uses BDD10K forward-facing automotive imagery as a proxy for UAV visual complexity. While BDD10K offers unmatched scene diversity, weather and lighting variation, and annotation density at 10,000 images, it lacks four characteristics specific to true drone footage that may interact non-trivially with the language–architecture effects studied here: (1) nadir and oblique viewpoints typical of mapping, surveillance, and roof-level inspection missions, in which object aspect ratios, occlusion patterns, and shadow geometry differ qualitatively from ground-level driving imagery; (2) high-altitude perspectives (typically above 50–100 m AGL) at which ground-level objects subtend few pixels and small-object recognition becomes the dominant failure mode, a regime in which compact encoder models such as Phi-3-V may degrade disproportionately relative to high-resolution-tiling architectures such as LLaVA-1.6; (3) motion blur induced by high-speed forward flight (≥15 m s−1) or rapid altitude changes, which introduces low-frequency artefacts absent from gravity-stabilised vehicle cameras and may differentially impact transformer architectures depending on positional encoding and patch-tokenisation strategy; and (4) large attitude variations during aggressive manoeuvres, producing non-canonical scene orientations to which vision encoders trained predominantly on upright imagery may respond with degraded feature extraction. Each of these factors could plausibly modulate the inter-model energy–accuracy rankings established here, particularly for the navigation reasoning task whose hard difficulty status (Friedman χ 2 = 13.35 ; p = 0.010 ) suggests sensitivity to visual difficulty rather than only to language coverage. The double-penalty effect for low-resource languages, by contrast, is a function of tokeniser fertility and pretraining corpus imbalance [28], and is therefore expected to transfer to aerial imagery, since it is driven by text-side rather than vision-side mechanisms. The findings reported in this paper should therefore be read as scoped primarily to forward-facing low-altitude UAV operation (typically below 25–50 m AGL), in which the visual statistics overlap substantially with automotive imagery, and validating both the architectural rankings and the scope of the double-penalty effect on purpose-built aerial datasets is the natural next step.
Evaluation metric bias.
A more pervasive limitation than dataset composition concerns the scoring metrics themselves. All four task-specific scoring functions are anchored to English, which structurally underestimates non-English VLM capability. Specifically, (1) the vehicle detection (Equation (7)) and road condition (Equation (8)) scorers compute recall over English-only keyword sets ( K = { car , vehicle , road , lane , traffic , sign , pedestrian } and F = { paved , asphalt , lane , clear , day , straight , urban } ), so a model that correctly identifies a car in Arabic (sayyara) or Basque (autoa) without including the English loanword car receives zero credit despite producing a semantically correct response. This assumes that the VLM’s internal reasoning is performed in English regardless of the input language, which is consistent with the established cross-lingual transfer behaviour of predominantly English-pretrained models [28,76]; under that assumption, an Arabic-language input typically elicits English internal token sequences that are surface-translated to Arabic at the output stage, so the absence of the English loanword car in the response reflects a translation choice rather than a perceptual failure. (2) The scene-understanding scorer (Equation (6)) computes cosine similarity against an English reference description in the all-MiniLM-L6-v2 embedding space, which is trained primarily on English semantic–textual–similarity data and is known to degrade systematically with script and lexical distance from English, and which disproportionately penalises Arabic, Russian, and both Chinese variants and is the immediate cause of the negative cosine values reported in Section 4.3. (3) The navigation reasoning hybrid scorer (Equation (9)) combines the same English-anchored cosine similarity with a spatial keyword component whose reference set T r ^ is itself derived from an English reference sentence, so the non-English entries in the multilingual spatial lexicon (Spanish, French, German, Italian, and Chinese) cannot in practice be selected and the keyword recall component reduces to detection of a single English token in the model response. For non-English languages this halves the hybrid score relative to a linguistically matched response, an artefact that is the dominant contributor to the apparent navigation reasoning gap reported in Section 4.2. (4) All four scorers measure lexical coverage of expected scene vocabulary rather than per-image perceptual correctness: they impose no precision penalty on responses that hallucinate expected categories absent from the image, and they anchor the scene-understanding cosine to a single reference description rather than a paraphrase ensemble. Specifically, the keyword recall scorers (Equations (7) and (8)) compute | K lower ( r ) | / | K | without a corresponding precision term | K lower ( r ) | / | categories in r | , so a model that emits the canonical urban-driving vocabulary (car, vehicle, road, lane, traffic, sign, pedestrian) regardless of which categories are actually depicted in a given BDD10K frame receives credit for emission rather than for correct identification. The 210 evaluation images were sampled deterministically from the BDD100K corpus without enforcing the presence of all seven keyword categories, and the BDD100K object-detection ground truth annotations were not used to construct per-image expected object sets. Similarly, the scene-understanding scorer (Equation (6)) is anchored to a single reference description, which provides a thinner cosine signal than a paraphrase ensemble would. These design choices were inherited from a vocabulary coverage interpretation of multilingual VLM evaluation, in which the goal is to measure whether a model can produce a substantive, topically appropriate response in each of the thirteen target languages, rather than whether it can localise specific objects in specific images. The combined effect of these four biases is that the absolute multilingual scores reported in Section 4 should be read as conservative lower bounds on the underlying VLM multilingual capability, not as direct measurements of it, and the magnitude of the apparent “English dominance” is inflated by the measurement framework. This bias is shared with most existing multilingual VLM benchmarks, including MEGA [25] and the multilingual evaluations of Lai et al. [26], but is acknowledged here more explicitly than is customary in order to support correct interpretation of the cross-language results.
Three properties of the analysis nevertheless remain robust to this scoring bias. First, the energy measurements (Section 4.4) are obtained via NVML-based GPU power sampling and are entirely independent of the scoring metric; the energy-side of the double-penalty finding for Arabic ( + 11.6 to + 90.4   Wh /1K relative to English across four of five models) and the cross-language energy variability (Friedman χ 2 = 40.43 ; p = 3.5 × 10 8 ) are therefore unaffected. Second, the within-language cross-model comparisons that underpin the Pareto-frontier analysis (Section 4.5) and the platform-level model recommendations (Section 4.6) compare all five models against identical reference texts within each language, so any English anchoring affects every model symmetrically and cancels out in the relative ranking. Third, the energy component of the cross-language Friedman test is similarly independent of scoring. By contrast, the absolute multilingual accuracy gap, the accuracy side of the double-penalty effect, and any direct interpretation of the “English dominance” magnitude as a measure of true model bias should be read with the scoring artefact in mind: the genuine multilingual capability gap is almost certainly smaller than the raw scores suggest, although its direction is unambiguous and consistent with the independent tokeniser fertility evidence of Petrov et al. [28]. Constructing native-language keyword and spatial lexicons for all 13 languages and re-scoring with a fully multilingual encoder such as paraphrase-multilingual-MiniLM-L12-v2 or LaBSE [77] have been identified as primary follow-ups that would partially decouple the multilingual scoring penalties from the English-anchored reference structure. The recall-only design has an additional self-cancelling property under within-image comparison. For any single image, the set of categories actually present is fixed, and the same image is evaluated under all five models and all thirteen languages by construction (Section 3.3); any hallucination tendency for a given keyword therefore biases every (model and language) cell on that image symmetrically, and the bias cancels out in relative cross-model and cross-language rankings. The absolute scores reported in Section 4 should nevertheless be read as upper bounds of perceptual accuracy in the strict object-detection sense, not as direct measurements of it. Constructing per-image expected object sets from the BDD100K ground truth annotations and re-scoring with a precision/recall/F1 triple, alongside replacing the single scene-understanding reference with a multi-paraphrase ensemble, are the natural next-step refinements identified in the future directions section.
Measurement hardware.
A more substantive limitation concerns the measurement hardware itself. All E 1 K values reported in this study were obtained on an NVIDIA H200 SXM server GPU (700 W TDP, HBM3 memory, and mean inference draw 323–358 W), which is not representative of the edge accelerators that would host onboard VLM inference in production UAV deployments. Edge platforms typical of current drone autonomy stacks, such as the NVIDIA Jetson AGX Orin (≤60 W TDP, ∼275 sparse TOPS, and LPDDR5 memory), the Jetson Orin NX (≤25 W TDP), and the forthcoming NVIDIA DRIVE Thor (∼1000–2000 TFLOPS; ∼130 W TDP), differ from the H200 in terms of TDP envelope, memory hierarchy, and native low-precision execution paths. In the most likely scenario, transferring the present results to an edge platform would rescale all E 1 K values by an approximately uniform hardware-dependent factor κ < 1 while preserving the inter-model ranking and, consequently, the Pareto-optimal model choices reported in Section 4.6. We nevertheless identify three architectural dimensions along which deviations from this uniform-rescaling assumption are plausible and would warrant edge-side verification: (1) memory bandwidth, where the H200’s HBM3 delivers ∼4.8 TB/s versus ∼200 GB/s LPDDR5 on Jetson Orin, which could disproportionately penalise vision encoders with large weight footprints (e.g., InternVL2’s 6B InternViT) on bandwidth-limited platforms; (2) tiling and high-resolution inference overhead, whose per-tile latency cost may be amplified on edge hardware and could shift LLaVA-1.6’s relative position; and (3) native low-precision execution paths (INT8, INT4, and FP8), which are exposed asymmetrically across model architectures depending on operator coverage in the relevant TensorRT or ONNX runtime, potentially breaking the implicit assumption that all five evaluated models would benefit equally from quantisation. The H200 results therefore establish a server-side reference baseline for relative cross-model and cross-language comparison under uniform conditions; quantitative confirmation of both the absolute E 1 K values and the ranking structure on Jetson- and Thor-class hardware remains the most consequential follow-up to the present study.
Inference-only scope.
Finally, the study evaluates inference-time energy only; training and fine-tuning costs, which dominate the lifecycle energy budget for newly developed or domain-adapted models, are outside of the study’s scope. The energy figures reported here therefore characterise the deployment cost rather than the total environmental footprint, and should be interpreted accordingly when used to inform model selection decisions.

5.5. Future Directions

Extending the benchmark to true UAV imagery (e.g., VisDrone, AU-AIR) and constructing multilingual keyword lexicons for the non-English languages evaluated here are the most immediate priorities. Investigating parameter-efficient multilingual fine-tuning (e.g., LoRA adapters trained on Arabic and Basque UAV captions) could close the double-penalty gap at minimal energy overhead, and quantifying energy on edge-class GPUs would bridge the gap between server-side benchmarking and real-world UAV deployment constraints. An additional scoring design refinement is to leverage the BDD100K object-detection ground truth annotations to construct per-image expected object sets, replacing the single fixed keyword list with image-conditional category targets and reporting precision, recall, and F1 separately so that hallucinated categories incur an explicit precision penalty. The scene-understanding cosine signal can be made more robust in the same release by replacing the single English reference with a k-paraphrase ensemble (e.g., k = 5 machine-generated paraphrases per language verified by native speakers) and reporting the mean cosine across the ensemble. Together these refinements would convert the present vocabulary coverage scorers into per-image perceptual correctness scorers and would permit a quantitative test of whether the relative cross-model rankings reported here transfer to the more demanding metric, as the within-image symmetry argument predicts.

6. Mitigation Strategies, Deployment Guidance, and Implications for VLM Design

The empirical findings of Section 4 and Section 5 establish that inference energy and task accuracy are statistically uncorrelated, that low-resource languages incur a double penalty in both dimensions, and that no single VLM dominates the eight-dimensional ranking lattice. These diagnoses are useful only insofar as they translate into prescriptions for system designers and for the next generation of multilingual VLMs. We therefore close the analysis with four prescriptive components: prompt-level mitigations that require no model modification, model-level mitigations that require lightweight fine-tuning, implications for the architectural design of future VLMs, and a concrete deployment decision rule parameterised by platform, language, and accuracy budget. We are explicit throughout this section about which prescriptions are empirically validated within the present work and which are candidate strategies grounded in the published literature.
Prompt-level mitigation for low-resource languages.
The cheapest class of mitigations modifies the prompt without altering the model. Three strategies are particularly relevant to the failure modes we identified. Translate-then-prompt converts the target-language query to English at runtime, queries the VLM in English, and translates the response back; this trades a small amount of additional inference energy for the machine translation step against the substantially larger cost of low-resource VLM inference (recall the +90.4 Wh /1K Arabic energy penalty for Phi-3-V) and is most attractive when the target language is on the steep side of the tokeniser fertility curve documented by Petrov et al. [28]. Code-switched prompting retains the target-language query but anchors key visual-semantic vocabulary (vehicle category names; spatial relations) in English within the same prompt, exploiting the cross-lingual transfer that multilingual VLMs partially achieve during pretraining. Few-shot native exemplars prepend one or two correctly answered target-language examples to the prompt, which has been shown in the cross-lingual NLP literature to reduce model collapse on isolate or under-represented languages such as Basque. None of these strategies are evaluated within the present submission; their relative effectiveness on the specific failure modes we observe (Arabic over-generation, Basque null-response collapse, and Luxembourgish intermediate degradation) is identified as the most direct experimental follow-up to this work.
Model-level mitigation: parameter-efficient fine-tuning and tokeniser adjustment.
Where prompt-level strategies are insufficient, and, in particular, where Basque collapse is the dominant failure mode, model parameters must be modified. Two classes of intervention are relevant. Low-rank adaptation (LoRA) [78] on the language–model component of the VLM (rather than the vision encoder, which is language-independent at the level of input representation) inserts a small number of trainable parameters (∼1–10 M, an adapter footprint of a few megabytes) and permits per-language fine-tuning at a cost of single-GPU-hours rather than the full-pretraining budget. The vision–language literature has demonstrated LoRA-style adapters as effective for domain transfer; their application to language-specific recovery in multilingual VLMs is, to our knowledge, an open direction. Tokeniser-aware retraining is a complementary intervention motivated directly by the energy side of the double penalty: the higher per-query energy cost on Arabic and Basque is mechanistically attributable to higher tokeniser fertility (more tokens per word; hence, more sequential decoder operations), and a partial retraining of the tokeniser on a language-balanced corpus, or the use of byte-level fallback tokenisers, would compress per-query token counts and bring energy parity. The energy budget framework in Section 3.1 can be extended directly to evaluate whether the marginal energy savings of a retrained tokeniser justify the up-front retraining cost amortised over the deployment lifetime; we frame this as a structured optimisation question rather than as a finding.
Implications for future VLM design.
The findings of this work suggest three architectural priorities for the next generation of multilingual VLMs intended for UAV deployment. First, training corpus balance: the Basque collapse failure mode is a direct consequence of corpus under-representation during pretraining, and any deployment-grade multilingual VLM should treat per-language minimum-token-count thresholds as a hyperparameter of equal status to model size. Second, tokeniser design: an English-centric BPE tokeniser is the dominant source of the per-language energy variance we observe ( χ 2 = 40.43 ; p = 3.5 × 10 8 ), and a multilingual VLM trained from scratch with a language-balanced or byte-level tokeniser should, on the basis of the tokeniser fertility evidence, exhibit a substantially flatter per-language energy profile. The third is energy-aware architecture search: the orthogonality of energy and accuracy ( ρ = 0.001 ) implies that energy is a genuinely free dimension during architecture selection, and neural architecture search procedures targeting the energy–accuracy Pareto frontier (rather than accuracy alone) should yield models that strictly dominate the current open-source frontier on at least one of the two axes. None of these three priorities are novel as research directions in isolation; their joint articulation as a multilingual UAV deployment requirement is a contribution of the present analysis.
Practical deployment guidance.
Combining the energy budget analysis of Section 4.6 with the language resource classification of Section 3.3 and the multi-metric ranking of Section 4.5 yields a concrete decision rule, summarised in Table 8. For high-endurance platforms (M300/M350 RTK; energy budget ≥ 322 Wh per mission), all five evaluated VLMs are admissible at the per-query level for high-resource languages; the dominant criterion is the accuracy per task, and the ranking lattice analysis identifies LLaVA-1.6-Mistral-7B as the within-platform optimum for vehicle and road tasks and LLaVA-1.5/InternVL2 for navigation reasoning. For mid-range platforms (Matrice 30; energy budget ∼132 Wh), the admissibility set contracts to Phi-3-V and LLaVA-1.5, and LLaVA-1.5 is the platform-conditioned Pareto-optimal choice (highest accuracy within the feasible set), with Phi-3-V as the energy-efficiency-prioritised alternative. For consumer platforms (Mavic 3 Enterprise; energy budget ∼77 Wh ), no evaluated model satisfies the α = 0.10 budget at f q = 1 / 20 Hz; Phi-3-V is the closest-to-feasible candidate (10.4% endurance penalty, marginally above the threshold), and would become admissible under either a slightly relaxed budget ( α 0.11 ) or a reduced query rate. Cutting across this platform stratification, for low-resource target languages (Arabic, Basque, and Luxembourgish), we recommend translate-then-prompt as the default operational mode regardless of platform, as this strategy converts the double penalty into a single penalty (the translation overhead) and brings the per-query energy back into the high-resource range, at the cost of dependence on a separate translation component whose latency must be added to the mission time budget. The combination of platform admissibility and language resource handling produces a six-cell decision table whose entries are derivable from the energy–accuracy data already presented; we provide the explicit table as a deployment artefact rather than as a result.

7. Conclusions

This paper presented one of the first cross-lingual energy-aware benchmarking studies, covering five open Vision–Language Models across thirteen languages on drone-relevant visual perception tasks, evaluated on an NVIDIA H200 GPU using the AI Energy Score methodology. Three conclusions can be highlighted.
First, energy consumption and perception accuracy are statistically independent ( ρ = 0.001 ; p = 0.995 ): a more power-hungry model does not produce better multilingual scene understanding. The Pareto-efficient trio of Phi-3-V, LLaVA-1.5, and LLaVA-1.6 provides UAV designers with principled, mission-specific model choices spanning a 2.5 × energy range ( 66.3 130.0   Wh /1K) without proportional accuracy loss. The formal query budget model (Section 3.1 and Section 4.6) operationalises this result: on heavy-lift platforms (DJI Matrice 300/350 RTK), LLaVA-1.6 is the Pareto-optimal choice at α = 0.10 and f q = 1 / 20 Hz; on the energy-constrained Matrice 30, LLaVA-1.5 is preferred; and on the Mavic 3 Enterprise no evaluated 7–8B VLM fits the inference budget, establishing a hard deployment boundary for ultra-compact platforms.
Second, the double penalty for low-resource languages is confirmed: Arabic, Basque, and Luxembourgish simultaneously incur lower accuracy and, for Arabic, substantially higher energy costs relative to English. This structural disadvantage, up to 0.571 in accuracy and + 90.4   Wh /1K in energy for Arabic, has direct regulatory relevance under the European Union (EU) AI Act’s non-discrimination requirements and underscores the need for targeted multilingual fine-tuning before deploying VLM-based UAV perception systems in non-English-dominant regions.
Third, task-type specialisation matters independently of model size: LLaVA-1.5 leads in terms of scene understanding, and LLaVA-1.6 in vehicle detection and road condition, while InternVL2 and LLaVA-1.5 lead in navigation reasoning, the task most critical for autonomous UAV path planning. No single model dominates all dimensions, reinforcing the value of the multi-metric ranking framework introduced here.
Collectively, these findings provide actionable energy–accuracy guidelines for multilingual drone smart sensing and establish a reproducible benchmark, grounded in the BDD10K dataset and the AI Energy Score protocol, that the community can extend to true UAV imagery and additional low-resource languages.
Hardware generalisability.
The energy figures reported here were obtained on an NVIDIA H200 SXM (NVIDIA Corporation, Santa Clara, CA, USA) server GPU and should not be interpreted as direct predictions of onboard inference cost on real drone edge platforms. Edge accelerators such as the NVIDIA Jetson AGX Orin, Jetson Orin NX, and DRIVE Thor differ from the H200 in terms of their TDP envelope, memory hierarchy, and native low-precision execution paths, and while the inter-model rankings and Pareto-optimal recommendations of Section 4.6 may transfer largely unchanged to other platforms, quantitative confirmation on edge hardware under the same AI Energy Score protocol is a prerequisite for operational deployment and is identified as the most consequential follow-up to this work.

Author Contributions

Author contributions: conceptualization, J.d.C. and M.L.; data curation, I.d.Z.; formal analysis, J.d.C., I.d.Z. and M.L.; funding acquisition, J.d.C. and I.d.Z.; investigation, I.d.Z., M.L. and J.d.C.; methodology, J.d.C., I.d.Z. and M.L.; software, J.d.C., I.d.Z. and M.L.; supervision, J.d.C. and I.d.Z.; validation, J.d.C., I.d.Z. and C.T.C.; visualization, J.d.C. and I.d.Z.; and writing—original draft, J.d.C. and I.d.Z.; writing—review and editing, J.d.C., I.d.Z. and C.T.C. All authors have read and agreed to the published version of the manuscript.

Funding

This research was supported by the Luxembourg Institute of Science and Technology through the projects “ADIALab-MAST” and “LLMs4EU” (Grant Agreement No. 101198470) and the Barcelona Supercomputing Center through the project “TIFON” (File number MIG-20232039).

Data Availability Statement

All data presented in the study are contained within the manuscript. The complete implementation required to reproduce the experimental analysis and compute the AI Energy Score metrics presented in this paper is publicly available at: https://github.com/drdezarza/vlm_energy_multilingual, accessed on 7 April 2026. The repository contains all code for multilingual prompt handling, vLLM-based inference, GPU energy measurement via NVML, per-language energy decomposition, and figure generation. Detailed instructions are provided to enable full replication of the results reported in this study and to support further energy–performance evaluation of Vision–Language Models across diverse languages and hardware platforms.

Acknowledgments

Mauro Liz would also like to thank Universidad Pontificia Comillas for the opportunity to participate in the international exchange program with the Department of Electrical and Computer Engineering at Boston University.

Conflicts of Interest

The authors declare that they have no conflicts of interest. The funders had no role in the design of the study; in the collection, analyses, or interpretation of data; in the writing of the manuscript; or in the decision to publish the results.

Abbreviations

The following abbreviations are used in this manuscript:
AIArtificial Intelligence
AGLAbove Ground Level
APIApplication Programming Interface
BDDBerkeley DeepDrive (dataset)
BLEUBilingual Evaluation Understudy
CLIPContrastive Language–Image Pretraining
EUEuropean Union
GQAGrouped-Query Attention
GPUGraphics Processing Unit
HBM3High Bandwidth Memory (3rd generation)
HELMHolistic Evaluation of Language Models
LLMLarge Language Model
LoRALow-Rank Adaptation
MEGAMassively Multilingual Evaluation of Generative AI
M-RoPEMultimodal Rotary Position Embedding
NLPNatural Language Processing
NVMLNVIDIA Management Library
PUEPower Usage Effectiveness
ROUGERecall-Oriented Understudy for Gisting Evaluation
TDPThermal Design Power
UAVUnmanned Aerial Vehicle
VLMVision–Language Model
vLLMHigh-Throughput LLM Inference Engine
VQAVisual Question Answering
VRAMVideo Random Access Memory
WhWatt-hour
XTREMECross-lingual TRansfer Evaluation of Multilingual Encoders

References

  1. Vaswani, A.; Shazeer, N.; Parmar, N.; Uszkoreit, J.; Jones, L.; Gomez, A.N.; Kaiser, Ł.; Polosukhin, I. Attention Is All You Need. Adv. Neural Inf. Process. Syst. 2017, 30, 1–11. [Google Scholar]
  2. de Curtò, J.; de Zarzà, I.; Calafate, C.T. Semantic Scene Understanding with Large Language Models on Unmanned Aerial Vehicles. Drones 2023, 7, 114. [Google Scholar] [CrossRef] [Scilit]
  3. OpenAI. GPT-4 Technical Report. arXiv 2023, arXiv:2303.08774. [Google Scholar] [CrossRef] [Scilit]
  4. Touvron, H.; Martin, L.; Stone, K.; Albert, P.; Almahairi, A.; Babaei, Y.; Bashlykov, N.; Batra, S.; Bhargava, P.; Bhosale, S.; et al. Llama 2: Open Foundation and Fine-Tuned Chat Models. arXiv 2023, arXiv:2307.09288. [Google Scholar] [CrossRef] [Scilit]
  5. Zhang, L.; Hao, X.; Xu, Q.; Zhang, Q.; Zhang, X.; Wang, P.; Zhang, J.; Wang, Z.; Zhang, S.; Xu, R. Mapnav: A novel memory representation via annotated semantic maps for vlm-based vision-and-language navigation. In Proceedings of the 63rd Annual Meeting of the Association for Computational Linguistics (Volume 1: Long Papers); Association for Computational Linguistics: Vienna, Austria, 2025; pp. 13032–13056. [Google Scholar]
  6. Song, D.; Liang, J.; Payandeh, A.; Raj, A.H.; Xiao, X.; Manocha, D. Vlm-social-nav: Socially aware robot navigation through scoring using vision-language models. IEEE Robot. Autom. Lett. 2024, 10, 508–515. [Google Scholar] [CrossRef] [Scilit]
  7. Elnoor, M.; Weerakoon, K.; Seneviratne, G.; Xian, R.; Guan, T.; Jaffar, M.K.M.; Rajagopal, V.; Manocha, D. VLM-GroNav: Robot Navigation Using Physically Grounded Vision-Language Models in Outdoor Environments. In Proceedings of the 2025 IEEE International Conference on Robotics and Automation (ICRA); IEEE: New York, NY, USA, 2025; pp. 2391–2398. [Google Scholar]
  8. Strubell, E.; Ganesh, A.; McCallum, A. Energy and Policy Considerations for Deep Learning in NLP. In Proceedings of the 57th Annual Meeting of the Association for Computational Linguistics, Florence, Italy, 28 July–2 August 2019; pp. 3645–3650. [Google Scholar]
  9. Schwartz, R.; Dodge, J.; Smith, N.A.; Etzioni, O. Green AI. Commun. ACM 2020, 63, 54–63. [Google Scholar] [CrossRef] [Scilit]
  10. Luccioni, A.S.; Viguier, S.; Ligozat, A.L. Power Hungry Processing: Watts Driving the Cost of AI Deployment? In Proceedings of the 2024 ACM Conference on Fairness, Accountability, and Transparency, Rio de Janeiro, Brazil, 3–6 June 2024; pp. 85–99. [Google Scholar]
  11. de Vries, A. The Growing Energy Footprint of Artificial Intelligence. Joule 2023, 7, 2191–2194. [Google Scholar] [CrossRef] [Scilit]
  12. International Energy Agency. Electricity 2024: Analysis and Forecast to 2026, 2024. Available online: https://www.iea.org/reports/electricity-2024 (accessed on 7 April 2026).
  13. Patterson, D.; Gonzalez, J.; Le, Q.; Liang, C.; Munguia, L.M.; Rothchild, D.; So, D.; Texier, M.; Dean, J. Carbon Emissions and Large Neural Network Training. arXiv 2021, arXiv:2104.10350. [Google Scholar] [CrossRef] [Scilit]
  14. Henderson, P.; Hu, J.; Romoff, J.; Brunskill, E.; Jurafsky, D.; Pineau, J. Towards the Systematic Reporting of the Energy and Carbon Footprints of Machine Learning. J. Mach. Learn. Res. 2020, 21, 1–43. [Google Scholar]
  15. DJI. Matrice 300 RTK Specs, 2023. Available online: https://enterprise.dji.com/matrice-300/specs (accessed on 7 April 2026).
  16. DJI. Matrice 30 Series Specs, 2023. Available online: https://enterprise.dji.com/matrice-30/specs (accessed on 7 April 2026).
  17. DJI. DJI Matrice 350 RTK—Specifications. 2023. Available online: https://enterprise.dji.com/matrice-350-rtk/specs (accessed on 7 April 2026).
  18. DJI. DJI Mavic 3 Enterprise—Specifications. 2022. Available online: https://enterprise.dji.com/mavic-3-enterprise/specs (accessed on 7 April 2026).
  19. Hugging Face; Luccioni, S.; Jernite, Y.; Pierrard, R.; Moutawwakil, I.; Mitchell, M.; Gamazaychikov, B.; Chamberlin, S.; Hooker, S.; Wu, C.J.; et al. AI Energy Score: Standardized Energy Efficiency Ratings for AI Models, 2025. Available online: https://huggingface.co/AIEnergyScore (accessed on 7 April 2026).
  20. García-Martín, E.; Rodrigues, C.F.; Riley, G.; Grahn, H. Estimation of Energy Consumption in Machine Learning. J. Parallel Distrib. Comput. 2019, 134, 75–88. [Google Scholar] [CrossRef] [Scilit]
  21. Dodge, J.; Prewitt, T.; des Combes, R.T.; Odber, E.; Schwartz, R.; Strubell, E.; Luccioni, A.S.; Smith, N.A.; DeCario, N.; Buchanan, W. Measuring the Carbon Intensity of AI in Cloud Instances. In Proceedings of the 2022 ACM Conference on Fairness, Accountability, and Transparency, Seoul, Republic of Korea, 21–24 June 2022; pp. 1877–1894. [Google Scholar]
  22. Hu, J.; Ruder, S.; Siddhant, A.; Neubig, G.; Firat, O.; Johnson, M. XTREME: A Massively Multilingual Multi-task Benchmark for Evaluating Cross-lingual Generalisation. In Proceedings of the 37th International Conference on Machine Learning; PMLR: Cambridge, MA, USA, 2020; pp. 4411–4421. [Google Scholar]
  23. Liang, Y.; Duan, N.; Gong, Y.; Wu, N.; Guo, F.; Qi, W.; Gong, M.; Shou, L.; Jiang, D.; Cao, G.; et al. XGLUE: A New Benchmark Dataset for Cross-lingual Pre-training, Understanding and Generation. In Proceedings of the 2020 Conference on Empirical Methods in Natural Language Processing, Online, 16–20 November 2020; pp. 6008–6018. [Google Scholar]
  24. Conneau, A.; Khandelwal, K.; Goyal, N.; Chaudhary, V.; Wenzek, G.; Guzmán, F.; Grave, E.; Ott, M.; Zettlemoyer, L.; Stoyanov, V. Unsupervised Cross-lingual Representation Learning at Scale. In Proceedings of the 58th Annual Meeting of the Association for Computational Linguistics, Online, 5–10 July 2020; pp. 8440–8451. [Google Scholar]
  25. Ahuja, K.; Diddee, H.; Hada, R.; Ochieng, M.; Ramesh, K.; Jain, P.; Nambi, A.; Ganu, T.; Segal, S.; Ahmed, M.; et al. MEGA: Multilingual Evaluation of Generative AI. In Proceedings of the 2023 Conference on Empirical Methods in Natural Language Processing, Singapore, 6–10 December 2023; pp. 4232–4267. [Google Scholar]
  26. Lai, V.D.; Ngo, N.T.; Veyseh, A.P.B.; Man, H.; Dernoncourt, F.; Bui, T.; Nguyen, T.H. ChatGPT Beyond English: Towards a Comprehensive Evaluation of Large Language Models in Multilingual Learning. In Findings of the Association for Computational Linguistics: EMNLP 2023; Association for Computational Linguistics: Singapore, 2023; pp. 13171–13189. [Google Scholar]
  27. Rust, P.; Pfeiffer, J.; Vulić, I.; Ruder, S.; Gurevych, I. How Good is Your Tokenizer? On the Monolingual Performance of Multilingual Language Models. In Proceedings of the 59th Annual Meeting of the Association for Computational Linguistics, Virtual Event, 1–6 August 2021; pp. 3118–3135. [Google Scholar]
  28. Petrov, A.; La Malfa, E.; Torr, P.; Biber, A. Language Model Tokenizers Introduce Unfairness Between Languages. Adv. Neural Inf. Process. Syst. 2024, 36, 1608. [Google Scholar]
  29. de Curtò, J.; de Zarzà, I. Metamorphic Testing for Semantic Invariance in Large Language Models. IEEE Access 2025, 13, 214772–214791. [Google Scholar] [CrossRef] [Scilit]
  30. Yu, F.; Chen, H.; Wang, X.; Xian, W.; Chen, Y.; Liu, F.; Madhavan, V.; Darrell, T. BDD100K: A Diverse Driving Dataset for Heterogeneous Multitask Learning. In Proceedings of the IEEE/CVF Conference on Computer Vision and Pattern Recognition; IEEE: New York, NY, USA, 2020; pp. 2636–2645. [Google Scholar]
  31. Reimers, N.; Gurevych, I. Sentence-BERT: Sentence Embeddings Using Siamese BERT-Networks. In Proceedings of the 2019 Conference on Empirical Methods in Natural Language Processing, Hong Kong, China, 3–7 November 2019; pp. 3982–3992. [Google Scholar]
  32. Friedman, M. The Use of Ranks to Avoid the Assumption of Normality Implicit in the Analysis of Variance. J. Am. Stat. Assoc. 1937, 32, 675–701. [Google Scholar] [CrossRef]
  33. Holm, S. A Simple Sequentially Rejective Multiple Test Procedure. Scand. J. Stat. 1979, 6, 65–70. [Google Scholar]
  34. Spearman, C. The Proof and Measurement of Association between Two Things. Am. J. Psychol. 1904, 15, 72–101. [Google Scholar] [CrossRef] [Scilit]
  35. Cohen, J. Statistical Power Analysis for the Behavioral Sciences, 2nd ed.; Lawrence Erlbaum Associates: Mahwah, NJ, USA, 1988. [Google Scholar]
  36. European Parliament and Council of the European Union. Regulation (EU) 2024/1689 of the European Parliament and of the Council of 13 June 2024 Laying Down Harmonised Rules on Artificial Intelligence (AI Act). Off. J. Eur. Union 2024, L 2024/1689, 1–144. Available online: http://data.europa.eu/eli/reg/2024/1689/oj (accessed on 7 April 2026).
  37. Radford, A.; Kim, J.W.; Hallacy, C.; Ramesh, A.; Goh, G.; Agarwal, S.; Sastry, G.; Askell, A.; Mishkin, P.; Clark, J.; et al. Learning Transferable Visual Models From Natural Language Supervision. In Proceedings of the 38th International Conference on Machine Learning; Proceedings of Machine Learning Research; PMLR: Cambridge, MA, USA, 2021; Volume 139, pp. 8748–8763. [Google Scholar]
  38. Li, J.; Li, D.; Savarese, S.; Hoi, S. BLIP-2: Bootstrapping Language-Image Pre-training with Frozen Image Encoders and Large Language Models. In Proceedings of the 40th International Conference on Machine Learning; Proceedings of Machine Learning Research; PMLR: Cambridge, MA, USA, 2023; Volume 202, pp. 19730–19742. [Google Scholar]
  39. Liu, H.; Li, C.; Li, Y.; Lee, Y.J. Improved Baselines with Visual Instruction Tuning. arXiv 2023, arXiv:2310.03744. [Google Scholar] [CrossRef] [Scilit]
  40. Liu, H.; Li, C.; Li, Y.; Li, B.; Zhang, Y.; Shen, S.; Lee, Y.J. LLaVA-NeXT: Improved Reasoning, OCR, and World Knowledge, 2024. Available online: https://llava-vl.github.io/blog/2024-01-30-llava-next/ (accessed on 7 April 2026).
  41. Chen, Z.; Wang, W.; Tian, H.; Ye, S.; Gao, Z.; Cui, E.; Tong, W.; Hu, K.; Luo, J.; Ma, Z.; et al. How Far Are We to GPT-4V? Closing the Gap to Commercial Multimodal Models with Open-Source Suites. arXiv 2024, arXiv:2404.16821. [Google Scholar] [CrossRef] [Scilit]
  42. Wang, P.; Bai, S.; Tan, S.; Wang, S.; Fan, Z.; Bai, J.; Chen, K.; Liu, X.; Wang, J.; Ge, W.; et al. Qwen2-VL: Enhancing Vision-Language Model’s Perception of the World at Any Resolution. arXiv 2024, arXiv:2409.12191. [Google Scholar]
  43. Abdin, M.; Aneja, J.; Awadalla, H.; Awasthi, A.; Awan, A.A.; Bach, N.; Bahree, A.; Bakhtiari, A.; Bao, J.; Behl, H.; et al. Phi-3 Technical Report: A Highly Capable Language Model Locally on Your Phone. arXiv 2024, arXiv:2404.14219. [Google Scholar] [CrossRef] [Scilit]
  44. Ainslie, J.; Lee-Thorp, J.; de Jong, M.; Zemlyanskiy, Y.; Lebrón, F.; Sanghai, S. GQA: Training Generalized Multi-Query Transformer Models from Multi-Head Checkpoints. In Proceedings of the 2023 Conference on Empirical Methods in Natural Language Processing, Singapore, 6–10 December 2023; pp. 4895–4901. [Google Scholar]
  45. Elsken, T.; Metzen, J.H.; Hutter, F. Neural Architecture Search: A Survey. J. Mach. Learn. Res. 2019, 20, 1–21. [Google Scholar]
  46. Cai, H.; Gan, C.; Wang, T.; Zhang, Z.; Han, S. Once-for-All: Train One Network and Specialize It for Efficient Deployment. In Proceedings of the International Conference on Learning Representations, Addis Ababa, Ethiopia, 30 April 2020. [Google Scholar]
  47. Tan, M.; Le, Q. EfficientNet: Rethinking Model Scaling for Convolutional Neural Networks. In Proceedings of the 36th International Conference on Machine Learning; PMLR: Cambridge, MA, USA, 2019; pp. 6105–6114. [Google Scholar]
  48. Shi, J.; Huang, K.; Pan, H.; Xu, J.; Cheng, C.; Zhang, H. Autonomous Subtask Generation for Indoor Search and Rescue Mission via Large-Language-Model and Behavior-Tree Integration. In Proceedings of the 2025 IEEE/RSJ International Conference on Intelligent Robots and Systems (IROS); IEEE: New York, NY, USA, 2025; pp. 16710–16716. [Google Scholar]
  49. Zhou, G.; Hong, Y.; Wu, Q. Navgpt: Explicit reasoning in vision-and-language navigation with large language models. In Proceedings of the AAAI Conference on Artificial Intelligence; AAAI: Washington, DC, USA, 2024; Volume 38, pp. 7641–7649. [Google Scholar]
  50. Shinoda, R.; Inoue, N.; Kataoka, H.; Onishi, M.; Ushiku, Y. Agrobench: Vision-language model benchmark in agriculture. In Proceedings of the IEEE/CVF International Conference on Computer Vision, Honolulu, HI, USA, 19–23 October 2025; pp. 7634–7644. [Google Scholar]
  51. Wang, Y.; Cui, J.; Zhai, C.; Tao, X.; Li, Y. Integrating segmentation and vision-language model for automated and interpretable building damage assessment from satellite imagery. Adv. Eng. Inform. 2026, 71, 104320. [Google Scholar] [CrossRef] [Scilit]
  52. Xiao, D.; Dianati, M.; Jennings, P.; Woodman, R. Hazardvlm: A video language model for real-time hazard description in automated driving systems. IEEE Trans. Intell. Veh. 2024, 10, 3331–3343. [Google Scholar] [CrossRef] [Scilit]
  53. Wang, J.; Hu, X.; Hou, W.; Chen, H.; Zheng, R.; Wang, Y.; Yang, L.; Huang, H.; Ye, W.; Geng, X.; et al. On the Robustness of ChatGPT: An Adversarial and Out-of-distribution Perspective. arXiv 2023, arXiv:2302.12095. [Google Scholar]
  54. Lu, Y.; Bartolo, M.; Moore, A.; Riedel, S.; Stenetorp, P. Fantastically Ordered Prompts and Where to Find Them: Overcoming Few-Shot Prompt Order Sensitivity. arXiv 2022, arXiv:2104.08786. [Google Scholar] [CrossRef] [Scilit]
  55. Lacoste, A.; Luccioni, A.; Schmidt, V.; Dandres, T. Quantifying the Carbon Emissions of Machine Learning. arXiv 2019, arXiv:1910.09700. [Google Scholar] [CrossRef] [Scilit]
  56. Courty, B.; Schmidt, V.; Luccioni, S.; Goyal-Kamal; MarionCoutarel; Feld, B.; Lecourt, J.; LiamConnell; Saboni, A.; Inimaz; et al. CodeCarbon: Track and Reduce CO2 Emissions from Compute, 2020. Available online: https://github.com/mlco2/codecarbon (accessed on 7 April 2026).
  57. Bannour, N.; Ghannay, S.; Nevéol, A.; Ligozat, A.L. Evaluating the Carbon Footprint of NLP Methods: A Survey and Analysis of Existing Tools. In Proceedings of the Second Workshop on Simple and Efficient Natural Language Processing, Virtual, 10 November 2021; pp. 11–21. [Google Scholar]
  58. de Zarzà, I.; Liz, M.; de Curtò, J.; Calafate, C.T. Energy-Aware Multilingual Evaluation of Large Language Models. Electronics 2026, 15, 1395. [Google Scholar] [CrossRef] [Scilit]
  59. Chitty-Venkata, K.T.; Emani, M.; Vishwanath, V.; Somani, A.K. Neural Architecture Search for Transformers: A Survey. IEEE Access 2023, 11, 108374–108412. [Google Scholar] [CrossRef] [Scilit]
  60. Papineni, K.; Roukos, S.; Ward, T.; Zhu, W.J. BLEU: A Method for Automatic Evaluation of Machine Translation. In Proceedings of the 40th Annual Meeting of the Association for Computational Linguistics, Philadelphia, PA, USA, 7–12 July 2002; pp. 311–318. [Google Scholar]
  61. Lin, C.Y. ROUGE: A Package for Automatic Evaluation of Summaries. In Proceedings of the Text Summarization Branches Out, Barcelona, Spain, 25–26 July 2004; pp. 74–81. [Google Scholar]
  62. Gao, T.; Yao, X.; Chen, D. SimCSE: Simple Contrastive Learning of Sentence Embeddings. arXiv 2021, arXiv:2104.08821. [Google Scholar]
  63. Liang, P.; Bommasani, R.; Lee, T.; Tsipras, D.; Soylu, D.; Yasunaga, M.; Zhang, Y.; Narayanan, D.; Wu, Y.; Kumar, A.; et al. Holistic Evaluation of Language Models. arXiv 2022, arXiv:2211.09110. [Google Scholar] [CrossRef] [Scilit]
  64. Srivastava, A.; Rastogi, A.; Rao, A.; Shoeb, A.A.M.; Abid, A.; Fisch, A.; Brown, A.R.; Santoro, A.; Gupta, A.; Garriga-Alonso, A.; et al. Beyond the Imitation Game: Quantifying and Extrapolating the Capabilities of Language Models. Trans. Mach. Learn. Res. 2023, 2023, 1–95. Available online: https://openreview.net/forum?id=uyTL5Bvosj (accessed on 7 April 2026).
  65. de Curtò, J.; de Zarzà, I. Comparative Analysis of Reasoning Capabilities in Foundation Models. In Proceedings of the 2024 2nd International Conference on Foundation and Large Language Models (FLLM), Dubai, United Arab Emirates, 26–29 November 2024; pp. 141–149. [Google Scholar] [CrossRef] [Scilit]
  66. Kwon, W.; Li, Z.; Zhuang, S.; Sheng, Y.; Zheng, L.; Yu, C.H.; Gonzalez, J.E.; Zhang, H.; Stoica, I. Efficient Memory Management for Large Language Model Serving with PagedAttention. In Proceedings of the 29th Symposium on Operating Systems Principles (SOSP); ACM: New York, NY, USA, 2023; pp. 611–626. [Google Scholar] [CrossRef] [Scilit]
  67. Zhu, P.; Wen, L.; Du, D.; Bian, X.; Fan, H.; Hu, Q.; Ling, H. Detection and Tracking Meet Drones Challenge. IEEE Trans. Pattern Anal. Mach. Intell. 2022, 44, 7380–7399. [Google Scholar] [CrossRef] [Scilit] [PubMed]
  68. Bozcan, I.; Kayacan, E. AU-AIR: A Multi-modal Unmanned Aerial Vehicle Dataset for Low Altitude Traffic Surveillance. In Proceedings of the 2020 IEEE International Conference on Robotics and Automation (ICRA), Paris, France, 31 May–4 June 2020; pp. 8504–8510. [Google Scholar] [CrossRef] [Scilit]
  69. Wang, X.; Wei, J.; Schuurmans, D.; Le, Q.; Chi, E.; Narang, S.; Chowdhery, A.; Zhou, D. Self-Consistency Improves Chain of Thought Reasoning in Language Models. arXiv 2023, arXiv:2203.11171. [Google Scholar] [CrossRef] [Scilit]
  70. Elazar, Y.; Kassner, N.; Ravfogel, S.; Ravichander, A.; Hovy, E.; Schütze, H.; Goldberg, Y. Measuring and Improving Consistency in Pretrained Language Models. Trans. Assoc. Comput. Linguist. 2021, 9, 1012–1031. [Google Scholar] [CrossRef] [Scilit]
  71. NLLB Team; Costa-jussà, M.R.; Cross, J.; Çelebi, O.; Elbayad, M.; Heafield, K.; Heffernan, K.; Kalbassi, E.; Lam, J.; Licht, D.; et al. No Language Left Behind: Scaling Human-Centered Machine Translation. arXiv 2022, arXiv:2207.04672. [Google Scholar] [CrossRef] [Scilit]
  72. Virtanen, P.; Gommers, R.; Oliphant, T.E.; Haberland, M.; Reddy, T.; Cournapeau, D.; Burovski, E.; Peterson, P.; Weckesser, W.; Bright, J.; et al. SciPy 1.0: Fundamental Algorithms for Scientific Computing in Python. Nat. Methods 2020, 17, 261–272. [Google Scholar] [CrossRef] [Scilit]
  73. Mann, H.B.; Whitney, D.R. On a Test of Whether One of Two Random Variables Is Stochastically Larger than the Other. Ann. Math. Stat. 1947, 18, 50–60. [Google Scholar] [CrossRef] [Scilit]
  74. Paszke, A.; Gross, S.; Massa, F.; Lerer, A.; Bradbury, J.; Chanan, G.; Killeen, T.; Lin, Z.; Gimelshein, N.; Antiga, L.; et al. PyTorch: An Imperative Style, High-Performance Deep Learning Library. In Proceedings of the Advances in Neural Information Processing Systems; Curran Associates, Inc.: Red Hook, NY, USA, 2019; Volume 32. [Google Scholar]
  75. Wolf, T.; Debut, L.; Sanh, V.; Chaumond, J.; Delangue, C.; Moi, A.; Cistac, P.; Rault, T.; Louf, R.; Funtowicz, M.; et al. Transformers: State-of-the-Art Natural Language Processing. In Proceedings of the 2020 Conference on Empirical Methods in Natural Language Processing: System Demonstrations, Online, 16–20 November 2020; pp. 38–45. [Google Scholar]
  76. Wendler, C.; Veselovsky, V.; Monea, G.; West, R. Do Llamas Work in English? On the Latent Language of Multilingual Transformers. In Proceedings of the 62nd Annual Meeting of the Association for Computational Linguistics, Bangkok, Thailand, 11–16 August 2024; pp. 15366–15394. [Google Scholar]
  77. Feng, F.; Yang, Y.; Cer, D.; Arivazhagan, N.; Wang, W. Language-agnostic BERT sentence embedding. In Proceedings of the 60th Annual Meeting of the Association for Computational Linguistics (Volume 1: Long Papers); Association for Computational Linguistics: Dublin, Ireland, 2022; pp. 878–891. [Google Scholar]
  78. Hu, E.J.; Shen, Y.; Wallis, P.; Allen-Zhu, Z.; Li, Y.; Wang, S.; Wang, L.; Chen, W. LoRA: Low-Rank Adaptation of Large Language Models. In Proceedings of the International Conference on Learning Representations, Online, 25–29 April 2022. [Google Scholar]
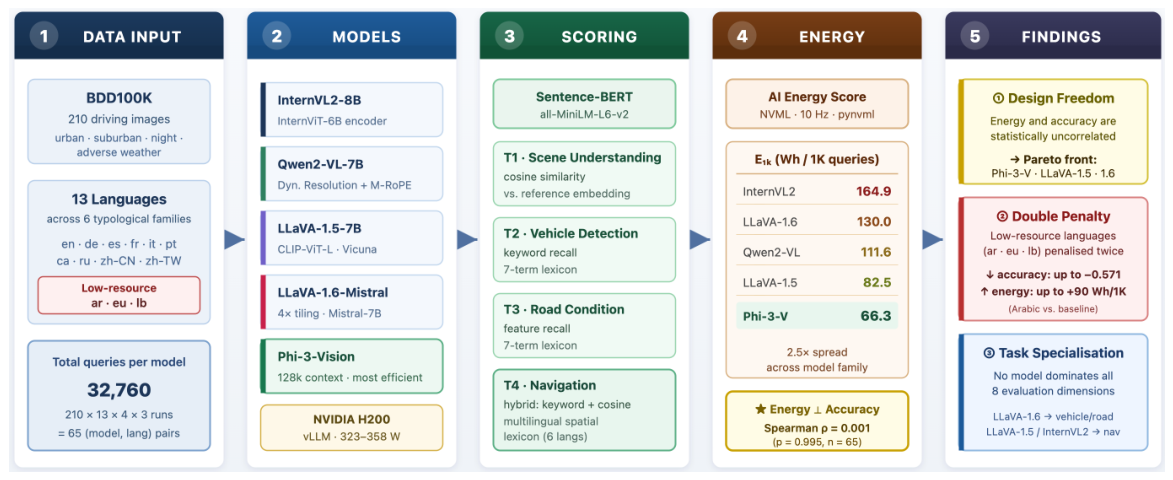
Figure 1. Overview of the evaluation pipeline. The star (★) denotes the headline empirical finding.
Drones 10 00361 g001
Figure 2. Overall average perception score across all 13 languages and four task types. Scores are the mean of r = 3 independent inference runs per task. Higher is better.
Drones 10 00361 g002
Figure 3. Score distribution over the 13 per-language observations per model.
Drones 10 00361 g003
Figure 4. Average score by task type for all five models, averaged over all 13 languages.
Drones 10 00361 g004
Figure 5. Radar chart of task-type performance profiles.
Drones 10 00361 g005
Figure 6. Scene understanding scores (model × language).
Drones 10 00361 g006
Figure 7. Vehicle detection scores (model × language).
Drones 10 00361 g007
Figure 8. Road condition scores (model × language).
Drones 10 00361 g008
Figure 9. Navigation reasoning scores (model × language).
Drones 10 00361 g009
Figure 10. Average performance score (model × language; all four tasks combined).
Drones 10 00361 g010
Figure 11. Per-language average score for all five models. Red shading marks the three low-resource languages.
Drones 10 00361 g011
Figure 12. Average score by difficulty level across all 13 languages.
Drones 10 00361 g012
Figure 13. (Left) Total GPU energy ( Wh ) per model across all 13 languages and 32,760 queries. (Right) Normalised AI Energy Score ( Wh per 1000 queries).
Drones 10 00361 g013
Figure 14. Energy intensity ( Wh per 1000 queries) for all 65 model–language combinations.
Drones 10 00361 g014
Figure 15. (Left) Performance delta vs. English ( Δ S ¯ ( l ) ; blue = better than EN and red = worse). The entire matrix is red. (Right) Energy delta vs. English ( Δ E 1 K ( l )   Wh /1K; red = more expensive).
Drones 10 00361 g015
Figure 16. Per-language batch duration (s) vs. Wh per 1000 queries for all 65 (model and language) points.
Drones 10 00361 g016
Figure 17. Model-level efficiency frontier. The Pareto front (dashed) connects Phi-3-V ( 66.3   Wh /1K; S ¯ = 0.125 ), LLaVA-1.5 ( 82.5   Wh /1K; S ¯ = 0.137 ), and LLaVA-1.6 ( 130.0   Wh /1K; S ¯ = 0.160 ), providing UAV designers with a principled basis for energy–accuracy trade-off.
Drones 10 00361 g017
Figure 18. Energy-adjusted performance ( η m = S ¯ m / E 1 K , m ; higher is better).
Drones 10 00361 g018
Figure 19. Cross-model ranking heatmap (green = rank 1 = best; red = rank 5 = worst) across eight evaluation dimensions.
Drones 10 00361 g019
Figure 20. Double-penalty analysis. x-axis: Δ E 1 K ( l ) ( Wh /1K relative to English); y-axis: Δ S ¯ ( l ) (score relative to English).
Drones 10 00361 g020
Table 1. Positioning of the present study relative to closely related work. ✔ = addressed; – = not addressed. Multimodal: jointly processes image and text inputs (Vision–Language Model); works marked–process text only.
StudyMultimodalMultilingualEnergyUAV Context
Hu et al. (2020) [22]
Ahuja et al. (2023) [25]
Lai et al. (2023) [26]
Luccioni et al. (2024) [10]
AI Energy Score (2025) [19]
Petrov et al. (2024) [28]
de Zarzà et al. (2026) [58]
This work
Table 2. Vision–Language Models evaluated in this study, all checkpoints hosted on Hugging Face (Hugging Face Inc., New York, NY, USA). All models were served via vLLM with –max-model-len 4096and –trust-remote-code on a single NVIDIA GPU.
Short NameHuggingFace IdentifierParamsKey Design Feature
InternVL2OpenGVLab/InternVL2-8B8BInternViT-6B encoder; multilingual pretraining
Qwen2-VLQwen/Qwen2-VL-7B-Instruct7BNaive Dynamic Resolution; M-RoPE
LLaVA-1.5llava-hf/llava-1.5-7b-hf7BCLIP-ViT-L + MLP connector; Vicuna backbone
LLaVA-1.6llava-hf/llava-v1.6-mistral-7b-hf7B4× resolution tiling; Mistral backbone
Phi-3-Vmicrosoft/Phi-3-vision-128k-instruct4.2BAzure AI CLIP encoder; 128k context window
Table 3. Evaluation tasks in order of increasing cognitive difficulty. Each task is instantiated in all thirteen languages; reference answers and scoring functions differ by task type (see Section 3.6).
TaskType KeyDifficultyPrompt Summary (English)
Scene understandingscene_understandingEasyDescribe the driving scene; what can you see on the road and around it?
Vehicle detectionvehicle_detectionMediumIdentify vehicles, pedestrians, and important objects in this driving scene.
Road conditionroad_conditionMediumDescribe road conditions and environment: road type, weather, and lighting.
Navigation reasoningnavigation_reasoningHardFrom an autonomous driving perspective, identify obstacles or hazards and their positions relative to the vehicle.
Table 4. Software stack and key dependencies.
ComponentVersion/Reference
Python3.10
PyTorch≥2.3 [74]
transformers≥4.44 [75]
vLLM≥0.5
sentence-transformers≥2.6.1 [31]
pynvml≥11.5
SciPy≥1.10 [72]
datasets (HF)≥2.18
pandas/seaborn/matplotlibstandard scientific stack
Table 5. Model-level summary statistics. S ¯ : overall average score (higher is better). σ : mean within-task consistency (lower is better). E total : total GPU energy over 32,760 queries. E 1 K : Wh per 1000 queries (AI Energy Score metric). P ¯ : mean GPU power draw on the H200 SXM. Task columns are multilingual means over all 13 languages. Bold indicates best value per column.
Model S ¯ σ E total E 1 K P ¯ SceneVeh.RoadNav.
(Wh) (Wh/1K) (W)
LLaVA-1.60.1600.0324260.3130.0355.10.2290.2150.0830.113
LLaVA-1.50.1370.0282701.482.5355.00.2420.1460.0360.124
InternVL20.1370.0265401.5164.9358.20.1830.1640.0720.127
Qwen2-VL0.1260.0053657.2111.6344.90.1920.1230.0750.115
Phi-3-V0.1250.0302173.266.3323.20.2170.1090.0720.101
Table 6. Query budget constraint (Equation (4)) for four commercial UAV platforms at α = 0.10 . E 1 K max : maximum admissible AI Energy Score. Admitted models satisfy E 1 K ( m ) E 1 K max ; the Pareto-optimal choice maximises S ¯ within the feasible set (Equation (5)). Platform parameters from DJI official specifications (no-payload condition).
PlatformB P base T 0 E 1 K max AdmittedPareto E 1 K max
(Wh) (W) (min) f q = 1 / 20 Hz Choice f q = 1 / 10 Hz
DJI Matrice 300 RTK548.059855332All fiveLLaVA-1.6166
DJI Matrice 350 RTK322.835255196All fiveLLaVA-1.6  98
DJI Matrice 30131.619341107Phi-3-V, LLaVA-1.5LLaVA-1.5  54
DJI Mavic 3 Ent.77.01034557None  29
Table 7. Inference-induced hover endurance loss Δ T (min) for each VLM × platform combination at f q = 1 / 20  Hz, computed via Equation (2) using empirical E 1 K values. Percentages indicate loss relative to T 0 . Values 10 % are highlighted in bold as operationally significant.
PlatformPhi-3-VLLaVA-1.5Qwen2-VLLLaVA-1.6InternVL2
DJI Matrice 300 RTK1.1 min (2.0%)1.3 min (2.4%)1.8 min (3.2%)2.1 min (3.8%)2.6 min (4.7%)
DJI Matrice 350 RTK1.8 min (3.3%)2.2 min (4.0%)3.0 min (5.4%)3.4 min (6.2%)4.3 min (7.8%)
DJI Matrice 302.4 min (5.8%)2.9 min (7.1%)3.9 min (9.4%)4.4 min (10.8%)5.5 min (13.3%)
DJI Mavic 3 Ent.4.7 min (10.4%)5.7 min (12.6%)7.4 min (16.4%)8.4 min (18.6%)10.1 min (22.4%)
Table 8. Deployment guidance decision table. Cells give recommended VLM as a function of platform energy budget (rows) and target-language resource class (columns). Bracketed entries are alternatives within the platform admissibility set. “+T2P” indicates that translate-then-prompt is recommended in addition to the model selection.
Platform (Budget)High-Resource Lang.Low-Resource Lang.
M300/M350 RTK (≥322 Wh )LLaVA-1.6-Mistral-7B [LLaVA-1.5, InternVL2]LLaVA-1.6-Mistral-7B + T2P
Matrice 30 (∼132 Wh )LLaVA-1.5 [Phi-3-V]LLaVA-1.5 + T2P
Mavic 3 Ent. (∼77 Wh )Phi-3-V (relaxed α ) [no model strictly admissible]Phi-3-V + T2P (relaxed α )
Disclaimer/Publisher’s Note: The statements, opinions and data contained in all publications are solely those of the individual author(s) and contributor(s) and not of MDPI and/or the editor(s). MDPI and/or the editor(s) disclaim responsibility for any injury to people or property resulting from any ideas, methods, instructions or products referred to in the content.