Article

Toward Large-Scale Operation of Fixed-Wing UAVs: Complex Network-Driven Conflict Detection and Resolution


1
Engineering Technology Training Center, Civil Aviation Flight University of China, Guanghan 618307, China
2
CAAC Academy of Flight Technology and Safety, Civil Aviation Flight University of China, Guanghan 618307, China
3
School of Transportation and Logistics, Southwest Jiaotong University, Chengdu 610031, China
*
Author to whom correspondence should be addressed.
Drones 2026, 10(5), 335; https://doi.org/10.3390/drones10050335
Submission received: 18 March 2026 / Revised: 23 April 2026 / Accepted: 28 April 2026 / Published: 30 April 2026

Highlights

What are the main findings?
  • Flight conflict detection and resolution model for fixed-wing UAVs in 3D airspace.
  • A conflict resolution method for multi-fixed-wing UAVs based on a complex network.
What are the implications of the main findings?
  • Realizes a quantitative description of multi-UAV conflict relationships and dynamic allocation of resolution priorities, solving the core problem of ambiguous priorities in complex scenarios.
  • Adapted to the maneuver characteristics of fixed-wing UAVs, it reduces trajectory deviation in practical operations, improving the safety and efficiency of multi-UAV airspace operation.

Abstract

The large-scale operation of multiple fixed-wing unmanned aerial vehicles (UAVs) in shared airspace requires efficient flight conflict detection and resolution to ensure aviation safety. However, existing research predominantly lacks collaborative optimization of multi-dimensional maneuver recommendations and struggles with dynamic priority allocation in complex multi-UAV scenarios, leaving a critical gap in the field. To bridge this gap, this paper proposes a Complex Network-Based Multi-UAV Conflict Resolution (NCR) method, which first constructs a three-dimensional (3D) flight conflict detection and resolution model for fixed-wing UAVs. The core innovation lies in mapping dynamic multi-UAV conflict scenarios into a flight conflict network, where UAVs serve as nodes and conflict urgencies act as edge weights. By calculating network and node robustness, the method accurately identifies key UAVs requiring immediate maneuver. Subsequently, taking the minimum variation in the velocity vector as the core objective, NCR iteratively searches for optimal resolution recommendations for these key UAVs using an improved fitness function until the conflict network collapses. Simulation and comparative experiments in 3D airspace, including evaluations against serial-based resolution, random-recommendation resolution, and a classical reactive baseline, demonstrate that NCR efficiently resolves multi-UAV conflicts with minimal trajectory deviations and fewer maneuvering UAVs. Furthermore, a macro-micro bi-level validation architecture based on a six-degree-of-freedom (6-DOF) aerodynamic platform is introduced to verify the physical executability of the proposed strategies. Results demonstrate that by incorporating a dynamic aerodynamic compensation margin, the inevitable trajectory tracking deviations caused by system inertia are enveloped within the safety threshold, ensuring absolute flight safety in engineering practice. Notably, as conflict complexity increases, NCR exhibits prominent advantages in reducing velocity variation costs, minimizing the number of maneuvering UAVs, and avoiding unnecessary trajectory deviations.

1. Introduction

Driven by rapid advancement in unmanned aerial vehicle (UAV) technologies, fixed-wing UAVs are increasingly deployed in civilian domains, such as logistics delivery, geographic surveying, and agricultural operations, owing to their extended endurance and high flight efficiency. Consequently, the operational density and traffic flow of UAVs in the airspace have surged significantly [1]. In such dense environments, complex trajectory interactions and highly dynamic positional changes inevitably lead to flight conflicts characterized by overlapping safety protection zones. These conflicts not only pose direct threats to aviation safety but also severely constrain airspace capacity. Therefore, efficient flight conflict detection and resolution have emerged as a fundamental prerequisite for multi-UAV operations. The primary challenge lies in accurately identifying complex conflict scenarios and generating resolution strategies that strike an optimal balance between UAV maneuverability constraints and trajectory stability.
As low-altitude UAV traffic continues to expand, regulatory bodies and research communities worldwide have been actively developing Unmanned Aircraft System Traffic Management (UTM) frameworks to safely integrate large-scale UAV operations into shared airspace [2]. Within these frameworks, conflict detection and resolution is recognized as one of the core enabling technologies. In recent years, considerable research efforts have been dedicated to multi-UAV flight conflict detection and resolution from various technical perspectives, as systematically categorized in recent surveys that distinguish classical rule-based approaches from emerging machine learning techniques for decentralized autonomy in UTM and U-Space contexts [3,4,5]. In terms of algorithmic design, cooperative game theory has been combined with artificial potential fields and ant colony optimization to address maneuver cost allocation [6], while complex network frameworks have been employed to mitigate swarm collisions by removing critical nodes [7]. Building upon flight conflict networks, Wu et al. identified critical conflict points [8], developed optimal dominating set-based allocation strategies [9], and integrated genetic algorithms for efficient resolution [10]. In trajectory planning, hierarchical frameworks separating global coordination from local smooth trajectory generation have proven effective [11], with further advances utilizing Dubins curves for initial planning alongside 3D velocity obstacle methods for real-time adjustment [12]. Additional strategies include airspace stratification to reduce vertical collision risks [13] and flatness-based finite-horizon optimal control for formation conflict avoidance [14]. Recent developments have extended these foundations to cluster-based three-dimensional (3D) protected zone models combined with improved velocity obstacle methods for urban low-altitude operations [15], and edge AI-driven decentralized swarm architectures for intelligent conflict management under high-density conditions [16], while reviews of the velocity obstacle paradigm continue to affirm its broad applicability in real-time obstacle avoidance [17].
Alongside these algorithmic developments, complex network theory has emerged as a powerful analytical tool for air traffic systems, providing rigorous metrics to characterize network topology, identify critical nodes, and assess system resilience [9,18]. In the UAV domain, recent studies have applied complex network modeling to swarm command and control structures, communication topology analysis, and vulnerability assessment [18]. However, the application of complex network theory to the dynamic prioritization of conflict resolution maneuvers—where the conflict network topology evolves in real time and key nodes must be adaptively identified for immediate intervention—remains notably underexplored. This gap is particularly critical given the maneuverability constraints inherent to fixed-wing UAVs, which must be explicitly incorporated into planning frameworks for agile operations [19], and the demonstrated effectiveness of particle swarm optimization for collision-free trajectory generation in multi-UAV systems [20,21].
Despite these significant advancements, existing methodologies exhibit several critical limitations. Most current approaches predominantly focus on single-dimensional maneuvers, such as heading adjustments in the horizontal plane or altitude changes in the vertical direction, lacking a collaborative optimization of multi-dimensional maneuver recommendations encompassing speed, heading, and altitude. Furthermore, while existing algorithms can ensure solution optimality, their computational complexity often increases exponentially with the number of UAVs, rendering them inadequate for highly dense and complex multi-UAV scenarios. More importantly, the current literature pays insufficient attention to the dynamic prioritization of maneuvering UAVs; priority mechanisms, when present, are typically static and predefined, failing to adapt to rapidly evolving conflict topologies.
To bridge these critical gaps and enhance the operational safety of fixed-wing UAVs in complex 3D airspaces, this paper proposes a Complex Network-Based Multi-UAV Conflict Resolution (NCR) method. Unlike traditional approaches, NCR systematically transforms dynamic multi-UAV conflict scenarios into a topological network, providing a unified framework for both dynamic priority allocation and multidimensional trajectory adjustment. The main contributions of this paper are summarized as follows.
(1)
A 3D flight conflict model suitable for fixed-wing UAVs is established. Based on the 3D velocity obstacle method and the cylindrical flight protection zone, the model can effectively analyze the conflict situation between two UAVs, and provide velocity change recommendations with the minimum velocity variation and the least trajectory deviation for UAVs based on the particle swarm optimization (PSO) algorithm.
(2)
A multi-UAV flight conflict network model is established. By mathematically mapping UAVs as nodes and their respective conflict urgencies as edge weights, the model utilizes network and node robustness metrics to accurately identify key UAVs, effectively solving the core problem of ambiguous resolution priorities in dense airspaces.
(3)
NCR is proposed and developed to execute optimal conflict resolution. Driven by an improved fitness function aimed at minimizing multidimensional velocity vector variations, NCR continuously optimizes and executes maneuver strategies for key nodes until the entire conflict network collapses, ensuring strict compliance with fixed-wing UAV maneuverability constraints.
(4)
Extensive experiments are conducted to validate the superiority of NCR. Comparative evaluations against serial-based resolution, random-recommendation resolution, and a classical artificial potential field baseline demonstrate that NCR significantly reduces velocity variation costs, minimizes the number of maneuvering UAVs, and avoids unnecessary trajectory deviations, with advantages becoming particularly pronounced in highly complex conflict scenarios. Furthermore, an underlying six-degree-of-freedom (6-DOF) aerodynamic simulation confirms that the generated strategies strictly comply with the dynamic tracking constraints and physical maneuver limits of actual fixed-wing UAVs.
The remainder of this paper is organized as follows. Section 2 details the dynamic multi-UAV flight conflict network model and elaborates on the proposed NCR method. Section 3 presents extensive simulation experiments, including aerodynamic tracking validations and comparative analyses, to evaluate the performance and effectiveness of NCR. Finally, Section 4 summarizes the main conclusions of this study and outlines potential directions for future research.

2. Method and Model

2.1. 3D Conflict Detection and Resolution Model Between Two UAVs

The velocity obstacle method is widely employed in real-time obstacle avoidance research for UAVs due to its succinct mathematical foundation and efficient dynamic planning capabilities [17]. To achieve conflict detection and resolution between two UAVs in three-dimensional (3D) space, a deterministic 3D flight conflict detection and resolution model based on the velocity obstacle method is utilized. The model has been implemented and verified in the literature [22]; thus, only a brief introduction will be provided here.

2.1.1. Flight Protection Zone

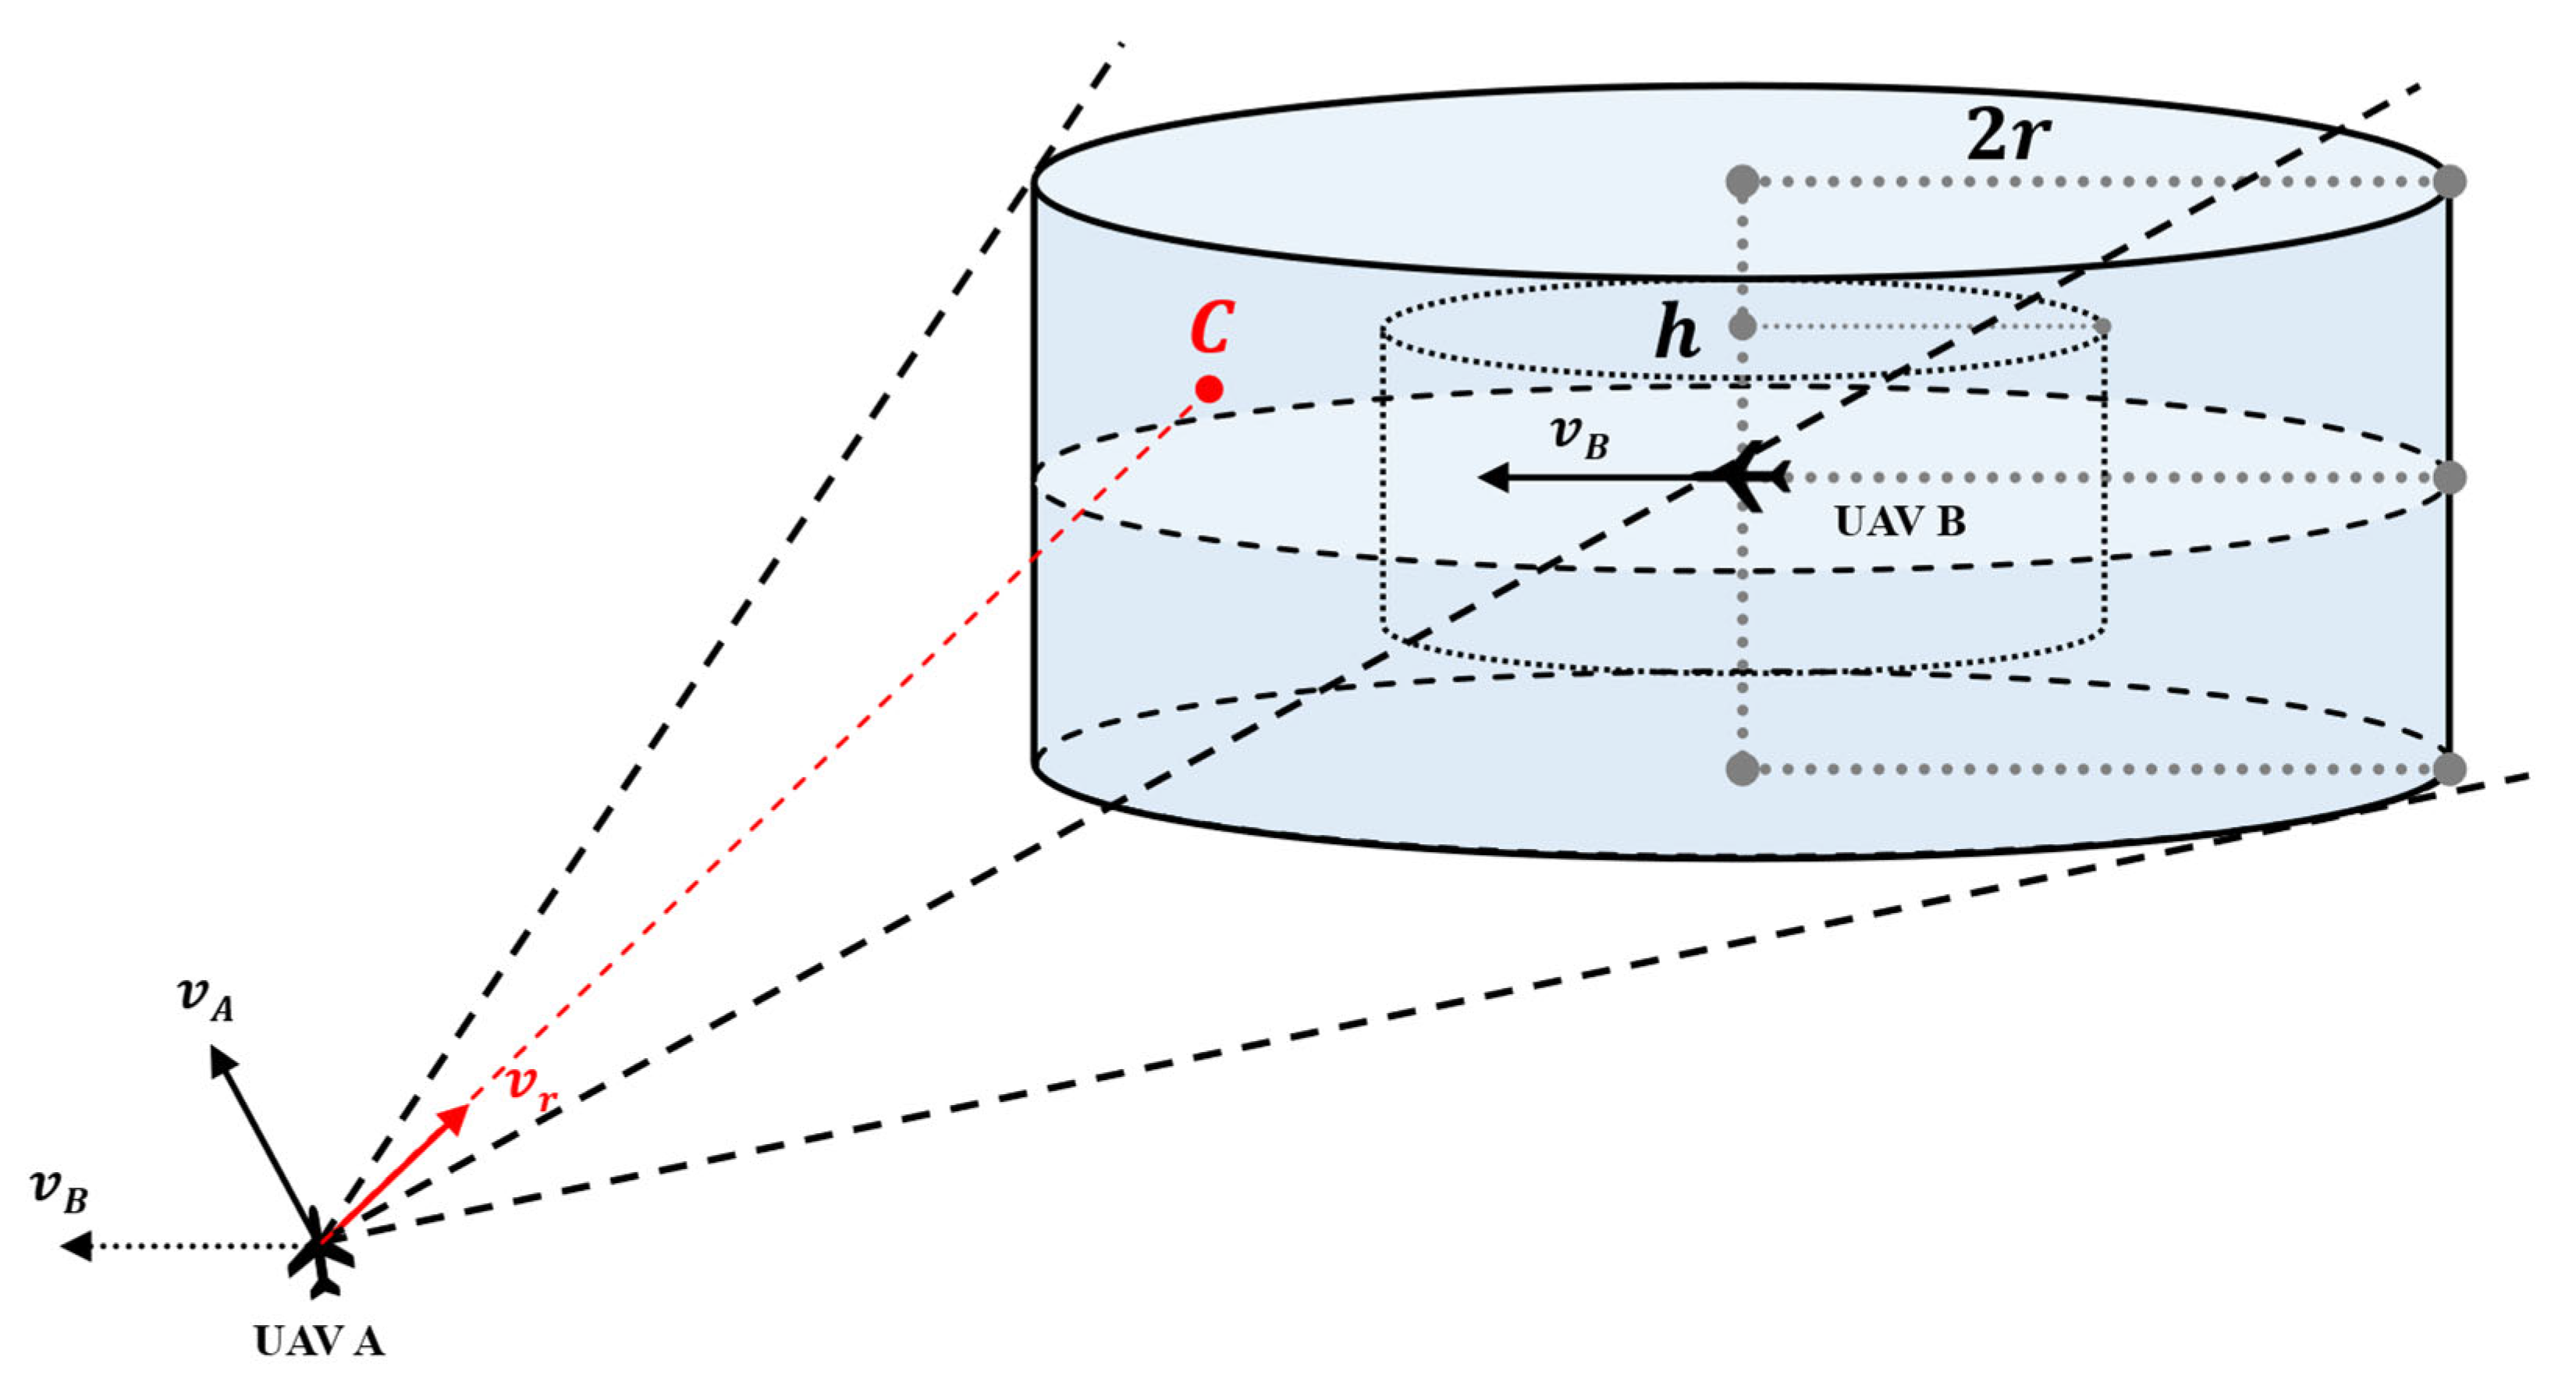
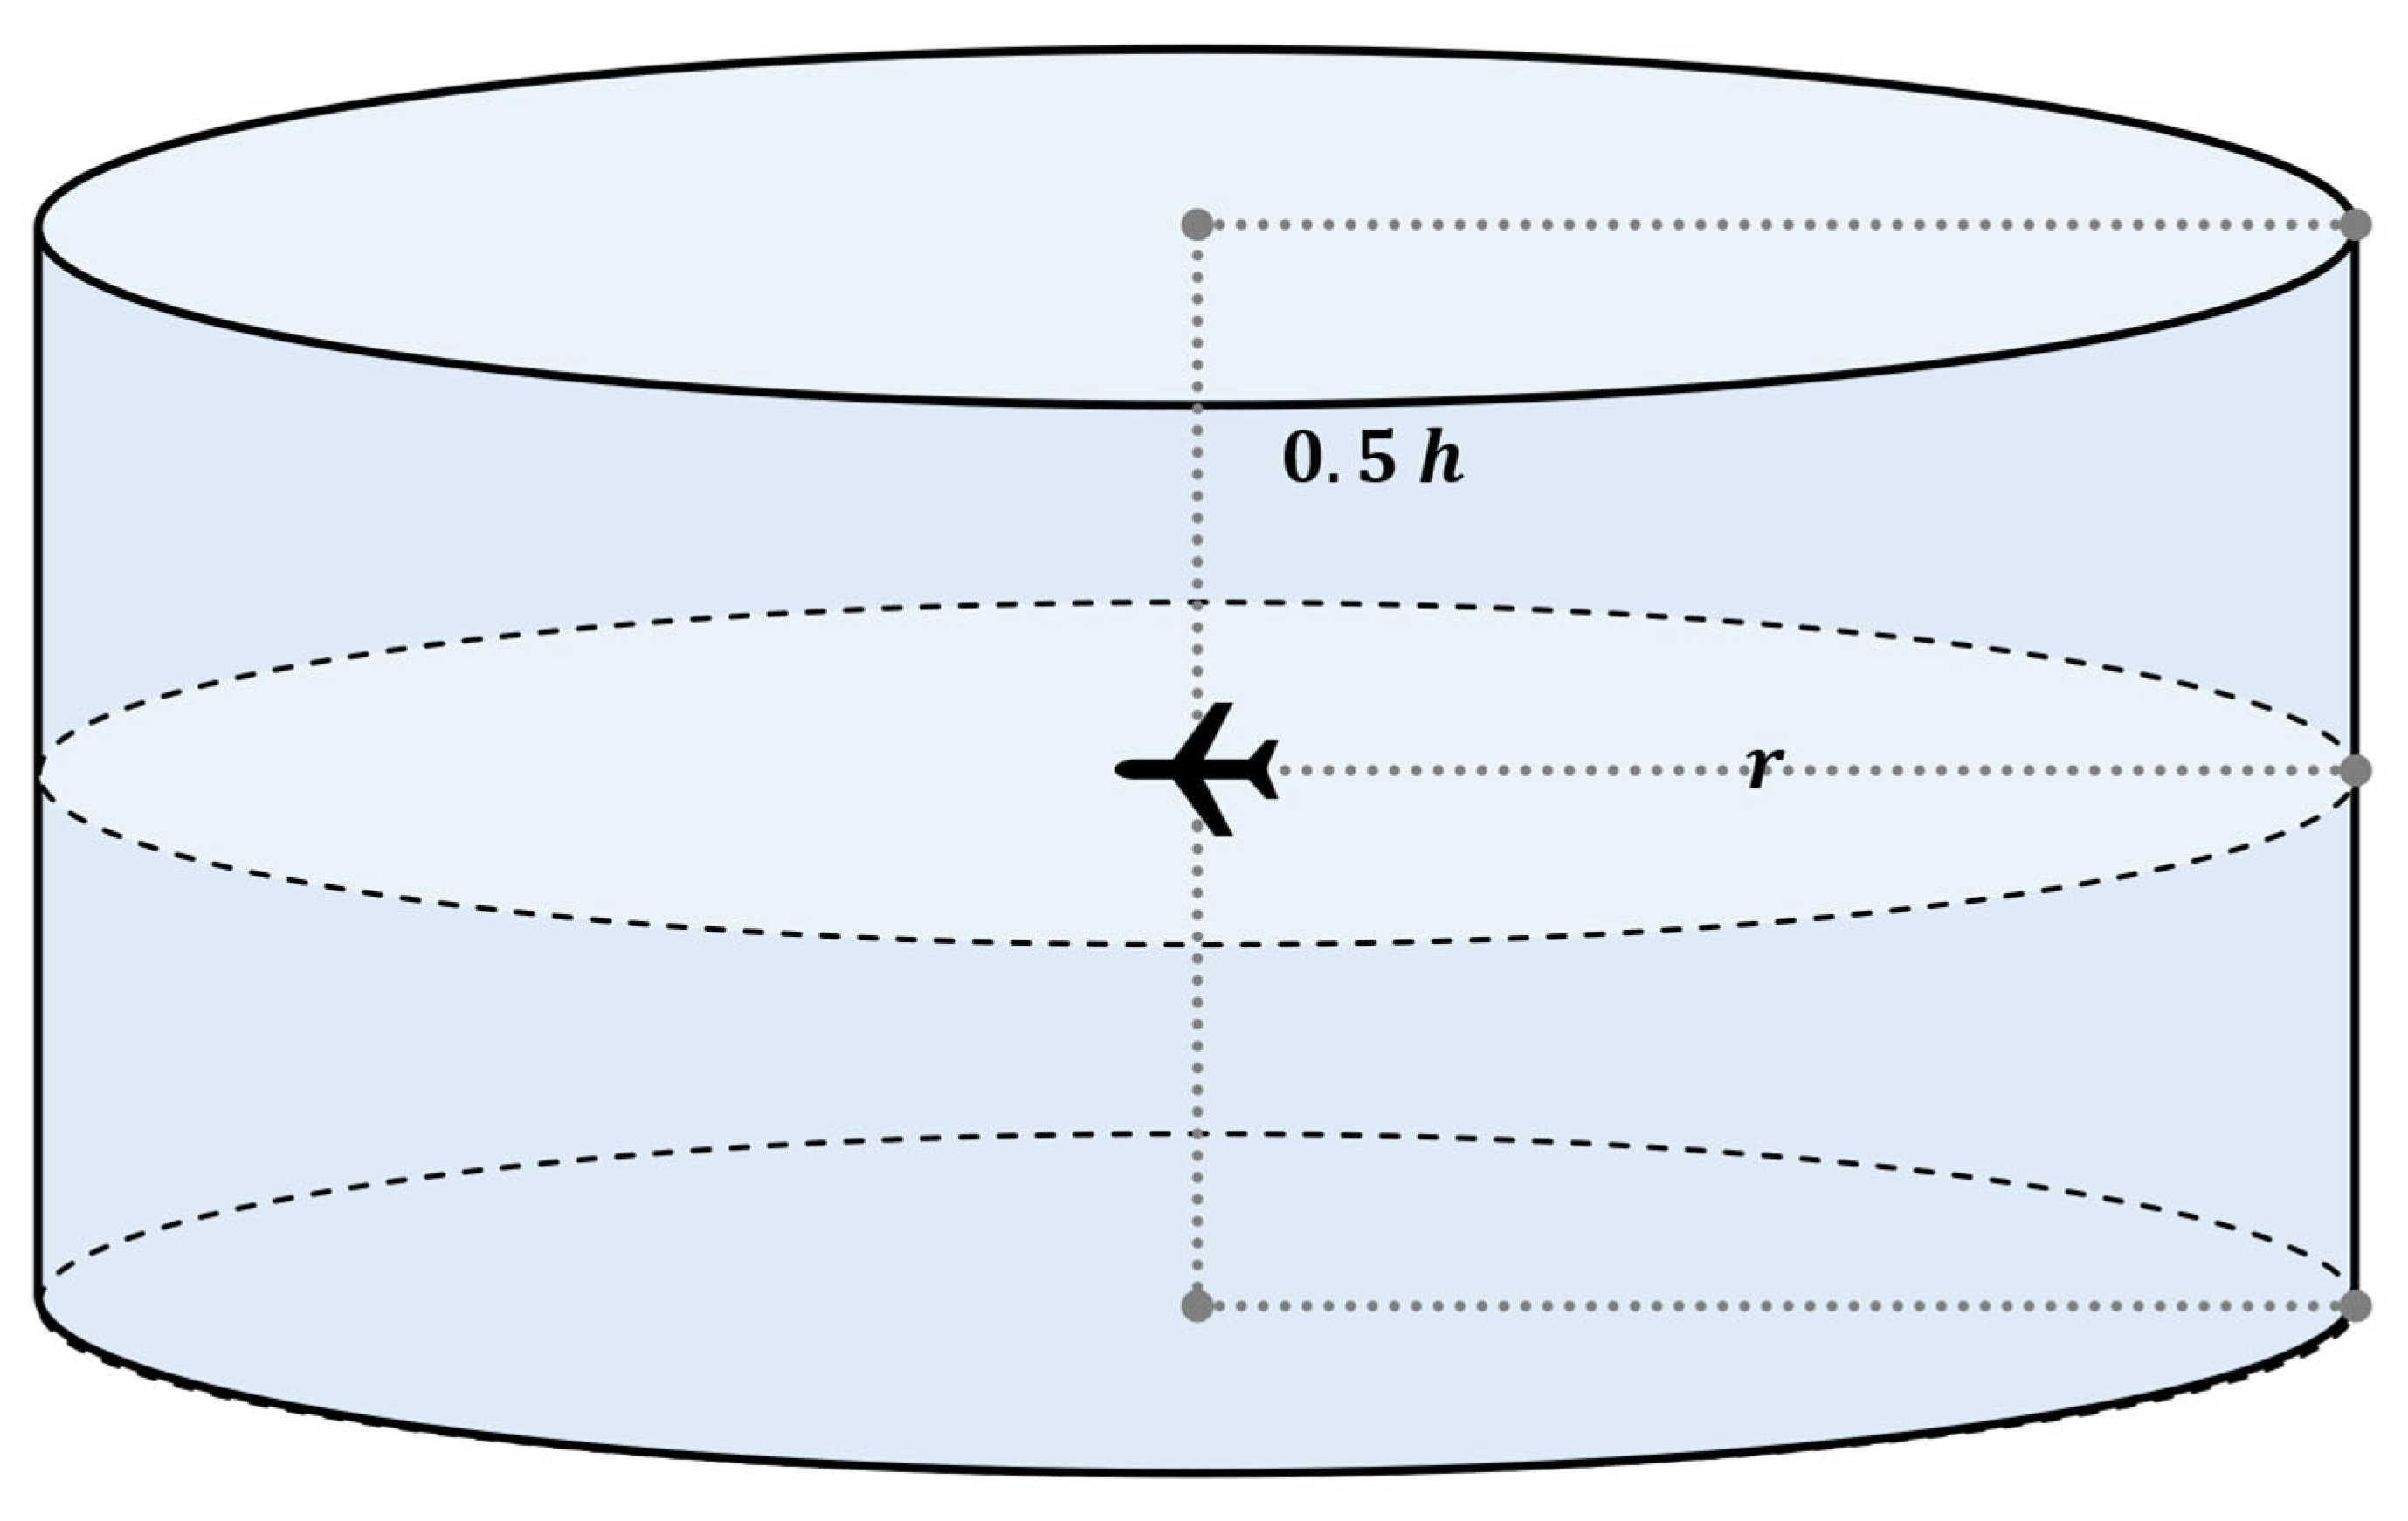
The conflict detection range for each UAV is defined as a 3D cylindrical space centered on itself in the model, referred to as the flight protection zone, as illustrated in Figure 1, where r represents the radius of the protection zone, and h denotes its height. When the flight protection zones of two UAVs overlap, a conflict between them is considered to exist. For simplicity of expression, the situation where a flight conflict will occur within a certain future time frame is directly referred to as a conflict between two UAVs in the following.

2.1.2. 3D Flight Conflict Detection Model

The 3D conflict detection model is illustrated in Figure 2. UAV A travels at velocity v A , UAV B travels at velocity v B , and v r represents the relative velocity between them. A is considered the host UAV, while B is the intruder UAV detected by the former. According to the principle of the velocity obstacle method, A can be simplified as a particle, and the cylinder G located with B represents the superposition of the two protection zones, with radius of 2 r and height of 2 h . Since the protection zones have been superimposed, B can be treated as a static point, while A is regarded as moving directly at the relative velocity v r . When the extension line of v r intersects with G , a conflict will occur between the two UAVs after a period of time, as shown in Figure 2. Assuming the intersection point is C , t c is the time required for A to reach point C ( x C , y C , z C ) at the relative velocity v r , indicating that the two UAVs will conflict over time t c , expressed as
t C = x C 2 + y C 2 + z C 2 v r
The velocity can be determined by the positions of UAVs at two moments separated by a unit time step, with their coordinates denoted as ( x t , y t , z t ) and ( x t + 1 , y t + 1 , z t + 1 ) respectively. The horizontal deviation angle θ and vertical deflection angle φ corresponding to UAVs are defined as follows:
θ = tan 1 y t + 1 y t x t + 1 x t
φ = tan 1 x t + 1 x t 2 + y t + 1 y t 2 z t + 1 z t
Mathematically, the relative velocity vector is expressed as v r = v A v B . As depicted in Figure 2, both the magnitude v r and the angular variables θ r and φ r can be derived from the expressions provided below:
θ 0 = tan 1 sin ( θ A θ B ) cos ( θ A θ B ) v B sin φ B v A sin φ A
θ r = θ 0 + θ B
φ r = tan 1 v A sin φ A sin θ A θ B sin θ 0 v A cos φ A v B cos φ B
where ( θ A ,   φ A , v A ) and ( θ B ,   φ B , v B ) represent the angular variables and velocity magnitudes of UAV A and UAV B , while θ 0 is an auxiliary variable introduced to simplify the expression. Taking into account the characteristics of the tangent function, the sine and cosine functions can be substituted for the tangent function via trigonometric transformation formulas when no solution is obtained in the calculation process.

2.1.3. 3D Flight Conflict Resolution Algorithm

For two UAVs that will encounter a flight conflict after a certain period, adjusting their flight velocities can ensure that the extension line of v r no longer intersects with G , thereby achieving conflict resolution. Since A is regarded as the host UAV in the 3D conflict detection model, only the velocity of A needs to be adjusted to achieve conflict resolution.
There are numerous feasible velocities for A that can resolve the conflict, all of which meet the position requirement of the extension line of v r and G .
A series of rays emitted from origin O are tangent to G, forming the Relative Collision Cone (RCC), and the tangent points P n ( x P n , y P n , z P n ) | P n G 0 , n = 1 ,   2 ,   3 . The surface normal vector at tangent points can be expressed as
g = G 0
= [ x , y , z ] T
The position relationship between the boundary of the RCC and the l r must satisfy the following condition:
l r g P n = 0
where l r ( k 1 , k 2 , k 3 ) can be regarded as the set of critical relative velocity vectors in collision scenarios, passing through both the origin O and a specific point N in the set P n .
To avoid conflicts, adjust the velocity vector of UAV A , and transform the relative velocity vector into v r . The critical condition for the two UAVs to avoid conflict is v r being parallel to l r , which can be expressed as follows:
v r = v 0 · ( k 1 , k 2 , k 3 )
Owing to the non-differentiability of the connection at the bottom of the cylinder, direct calculation of the set P n tends to be computationally complex. Consequently, an optimization algorithm is employed to search and approximate the optimal solution in 3D space, which is represented in the form of a point denoted as N , belonging to the set P n , indicating that no conflict will occur with this velocity vector.
While in practical scenarios, due to the inherent maneuverability limitations of the UAV, the velocity cannot be significantly changed. Furthermore, velocity adjustments may cause the UAV to deviate from its original planned trajectory. Excessive deviation could lead to increased fuel consumption or even fuel insufficiency issues. Therefore, it is necessary to minimize the deviation between the new velocity for A and the original one, which is required to remain within the constraints of the UAV’s maneuverability capabilities.
Based on the above analysis, the PSO algorithm is selected in this study to search for the maneuver recommendations. An optimal maneuver recommendation should yield minimal velocity variations, which means decreasing variations in velocity magnitude v , horizontal deviation angle θ , and vertical deviation angle φ . The effectiveness of the recommendation can be measured by establishing the fitness function Q :
Q = α θ + β φ + γ v
where θ , φ , and v represent the velocity increments for conflict resolution of A , respectively, all of which take positive values to avoid adverse effects caused by negative values. Considering the inconsistent units and significantly different value ranges of the variables, weight coefficients α , β , and γ are introduced to achieve normalization. Furthermore, by adjusting the values of these weight coefficients, the resolution recommendations generated by the algorithm can be designed to show different preferences [22]. It should be noted that the weight coefficients α, β, and γ introduced here are not absolute constants reflecting objective physical laws, nor are they required to satisfy any normalization condition. Rather, they should be understood as design parameters available to the airspace manager: by freely adjusting the relative magnitudes of these coefficients, the manager can dynamically tune the preference of the conflict resolution strategy according to different operational scenarios. The specific numerical combination adopted in the experiments of this paper serves only to demonstrate the baseline performance of the algorithm under a balanced preference, while the method itself allows these parameters to be customized in practice according to specific air traffic management requirements, free from normalization constraints.
In the 3D conflict detection and resolution model, it is assumed that the UAV can perform an instantaneous velocity vector jump at the conflict resolution moment, where its position is denoted as P 1 . However, constrained by airframe inertia and aerodynamic characteristics, fixed-wing UAVs cannot achieve such a step response in a real physical environment. To address this, a feedforward compensation mechanism termed “time-window pre-intervention” is introduced. Within the entire time window, starting from the theoretical calculation point P 1 , the actual maneuver starting point P 0 is derived by reverse-extrapolating 3 s based on the initial velocity V 1 . Simultaneously, the expected maneuver endpoint P 2 is determined by forwardly extrapolating 3 s from P 1 based on the resolved target velocity V 2 . In actual flight, the UAV will initiate the control law intervention in advance at moment P 0 . During this process, the actual trajectory will not pass through the theoretical calculation point P 1 ; rather, the UAV is required to smoothly transition from the starting point P 0 to point P 2 within 6 s, with its velocity vector converging to V 2 as closely as possible upon reaching P 2 .
It should be noted that the time window introduced here serves only as an interface parameter in this study, primarily to provide a unified temporal reference for the initiation and completion of maneuver commands across UAVs. The appropriateness of this parameter value, as well as the practical executability of the resulting velocity commands, will be further examined in the 6-DOF aerodynamic simulation presented in Section 3.

2.2. Complex Network-Based Multi-UAV Conflict Resolution Method

Based on the 3D flight conflict detection model, a flight conflict network is constructed by comprehensively considering UAV positions and conflict times. According to complex network theory, a multi-UAV conflict resolution method is proposed, abbreviated as NCR.
For different types of aerial vehicles, the flight conflict resolution process presents distinct characteristics. Consequently, when generating flight conflict resolution recommendations, it is essential to take the maneuverability characteristics and mission context of fixed-wing UAVs, which are the focus of this paper, into account.
Considering the conflicts occurring among fixed-wing UAVs, the flight conflict resolution recommendations have the following characteristics: a maneuver recommendation with minimal velocity variation is executed by a single UAV, including three types of recommendations—horizontal heading adjustment, vertical heading adjustment, and velocity magnitude adjustment—or a composite maneuver recommendation combining all above. Compared with commercial airliners, UAVs have no occupants onboard, so onboard comfort does not need to be considered. Within the allowable flight performance limits, the method will select the resolution recommendation that minimizes velocity variations. For UAVs with relatively short ranges, the minimal-deviation composite maneuver recommendation ensures safety while minimizing trajectory deviation as much as possible, avoiding insufficient fuel reserve situations.
Conflicts among multiple UAVs can be addressed by NCR. In the step of generating maneuver recommendations, the 3D conflict detection and resolution model is employed to search for maneuver recommendations. It should be noted that when addressing multi-UAV conflict detection and resolution problems, the fitness function in the 3D conflict detection and resolution model needs to be improved. For each searched velocity, it is necessary to simultaneously perform conflict detection with all other UAVs in the network. The solutions are screened with the objectives of the direction of the fastest robustness decrease and minimal velocity variations.
Information on position, velocity, and intended path of UAV is obtained to identify potential conflicts between UAVs and assess the urgency of them. The flight conflict network is established based on all the above [7]. The nodes of the network represent UAVs, containing both basic information and dynamic state information. Edges of the network are established between nodes with potential conflicts, and the edge weight reflects the urgency of the conflict. According to relevant references, the edge weight w can be expressed by the time to conflict t c as follows:
w = e t c
where w takes values in [0, 1] based on the characteristic that the conflict time is greater than zero. An adjacency matrix is adopted to represent the relationships between UAVs, namely, the weight matrix W . Network robustness is proportional to the sum of edge weights and is defined as:
R = 1 N I i = 1 N j = 1 N w i j 2
where N represents the number of nodes in the network, and w i j denotes the element in the row i and column j of W . I is the number of nodes removed from the network. Considering the UAVs remain in the airspace and subsequent velocity variations may trigger new conflicts after resolving conflicts, nodes remain after each step of computation. Furthermore, since UAVs newly joining the network at the current moment are not taken into account, the term ( N I ) in the network robustness calculation formula can be regarded as a constant coefficient, which has no decisive impact on the same scenario. Lower network robustness indicates fewer and milder conflicts between UAVs in a flight conflict network, making the conflicts easier to resolve [7]. The sum of a particular row or column in W serves as an important basis for determining whether the corresponding node is a key node. Specifically, the robustness r i of node i is defined as
r i = 1 N j = 1 N w i j
and the node with the largest r i is identified as the key node in the conflict network. Prioritizing conflict resolution maneuver recommendations for the UAV corresponding to the key node can accelerate the disintegration of the conflict network.
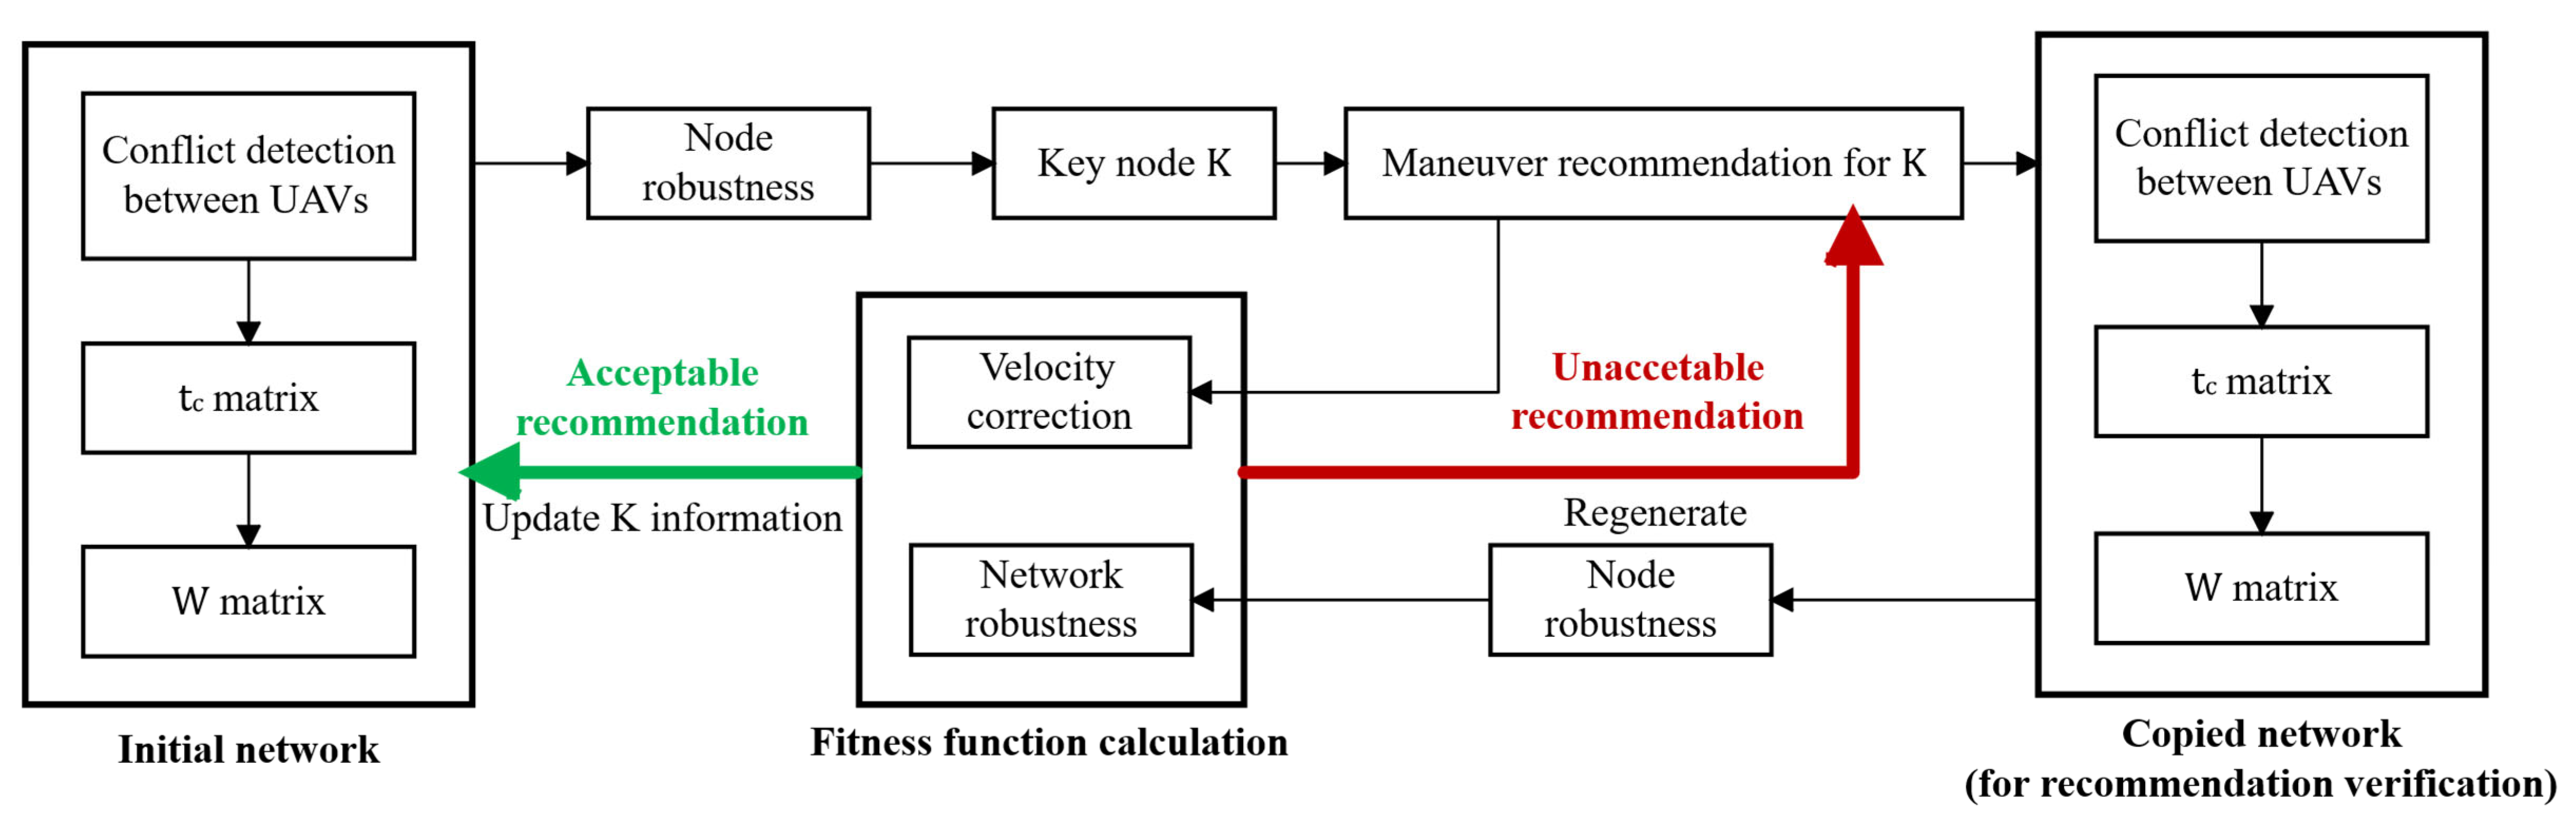
The proposed method, NCR, is presented as a flowchart, as illustrated in Figure 3.
The process can be summarized into the following steps:
Step 1: Identify conflict relationships between UAVs and calculate W based on t c .
Step 2: Calculate r i of each node in the network according to W , obtaining the initial network robustness R 0 ( R 0 = i = 1 N r i ) .
Under this definition, r i reflects the vulnerability contribution of node i to the overall stability of the conflict network via the conflict urgencies represented by its incident edges. A larger r i indicates that the node is simultaneously involved in multiple high-urgency conflicts and thus occupies a more critical position in the network topology. The global robustness is the network-wide sum of such vulnerabilities, and its reduction to zero corresponds to the disintegration of the conflict network and the complete resolution of all conflicts.
Step 3: Select the node with the largest r i as the key node K , and record the serial numbers of UAVs that have potential conflicts with K .
Step 4: Generate a conflict resolution recommendation for K , and update the parameters of the copied network based on this recommendation. Recalculate the network robustness R m (where m increments with each execution of Step 4) and the velocity variation cost Q m for K after implementing the recommendation.
Step 5: Update the relevant parameters of the initial network for node K according to the final resolution recommendation selected in Step 4 and obtain a new conflict network. Repeat the above steps until R m decreases to zero, which means the conflict network disintegrates. No further key nodes can be selected at this point, and all conflicts are completely resolved.
Regarding the steps described above, the following points require further clarification:
First, the conflict relationships between UAVs are identified using the 3D conflict detection model in Step 1. For the network with N UAVs, pairwise conflict detection requires N × ( N 1 ) / 2 calculations, resulting in a computational complexity of O ( N 2 ) . Second, in Step 4, the PSO algorithm is employed to search for the resolution recommendation in 3D space. The recommendation will resolve the conflict for at least one pair of UAVs. However, the recommendation that meets the requirements may trigger new conflicts within the network. Based on this premise, the recommendation should aim to minimize R m while keeping Q m relatively low. The recommendations are screened according to the fitness function, which reflects both the change in network robustness and the velocity variation cost caused by recommendations. The fitness function used in the subsequent numerical examples is given as follows:
Q N = Q R m · Q m
and the change in R m is defined as Q R m = e c R · R m , where R m greater than 0 indicates that conflicts are intensified, leading to a significantly large value of the exponentially growing fitness function. The constant coefficient c R is used to amplify the impact of R m on the cost. In the numerical examples of this paper, c R is set to 1000 due to the magnitude of R m is typically 10 3 to 10 2 . The velocity variation cost Q m is calculated by the fitness function Q in Equation (11).
Similarly, the resolution recommendations generated in Step 4 must satisfy the actual maneuverability constraints of the UAV. In general, excessively large velocity variations should not be adopted. When such unsatisfactory recommendations are encountered during the search, the method is guided away from this solution region by assigning a very large Q N . Due to the maneuverability limitations, it may be impossible to find an optimal solution, where the method will sequentially select the node with the second-largest r i as the key node, and so forth. Furthermore, the same UAV may be selected as the key node multiple times, implying that it could be required to perform multiple velocity adjustments. However, since all the steps are implemented at the same time step, the solution generated in the final iteration will be the ultimately executable resolution recommendation. In addition, each calculation of velocity variation is performed relative to the initial velocity; therefore, the velocity variation does not accumulate with the method’s iterations, and the complexity of the recommendation does not increase with the number of cycles.

3. Simulation Experiments

3.1. Aerodynamic Simulation Architecture

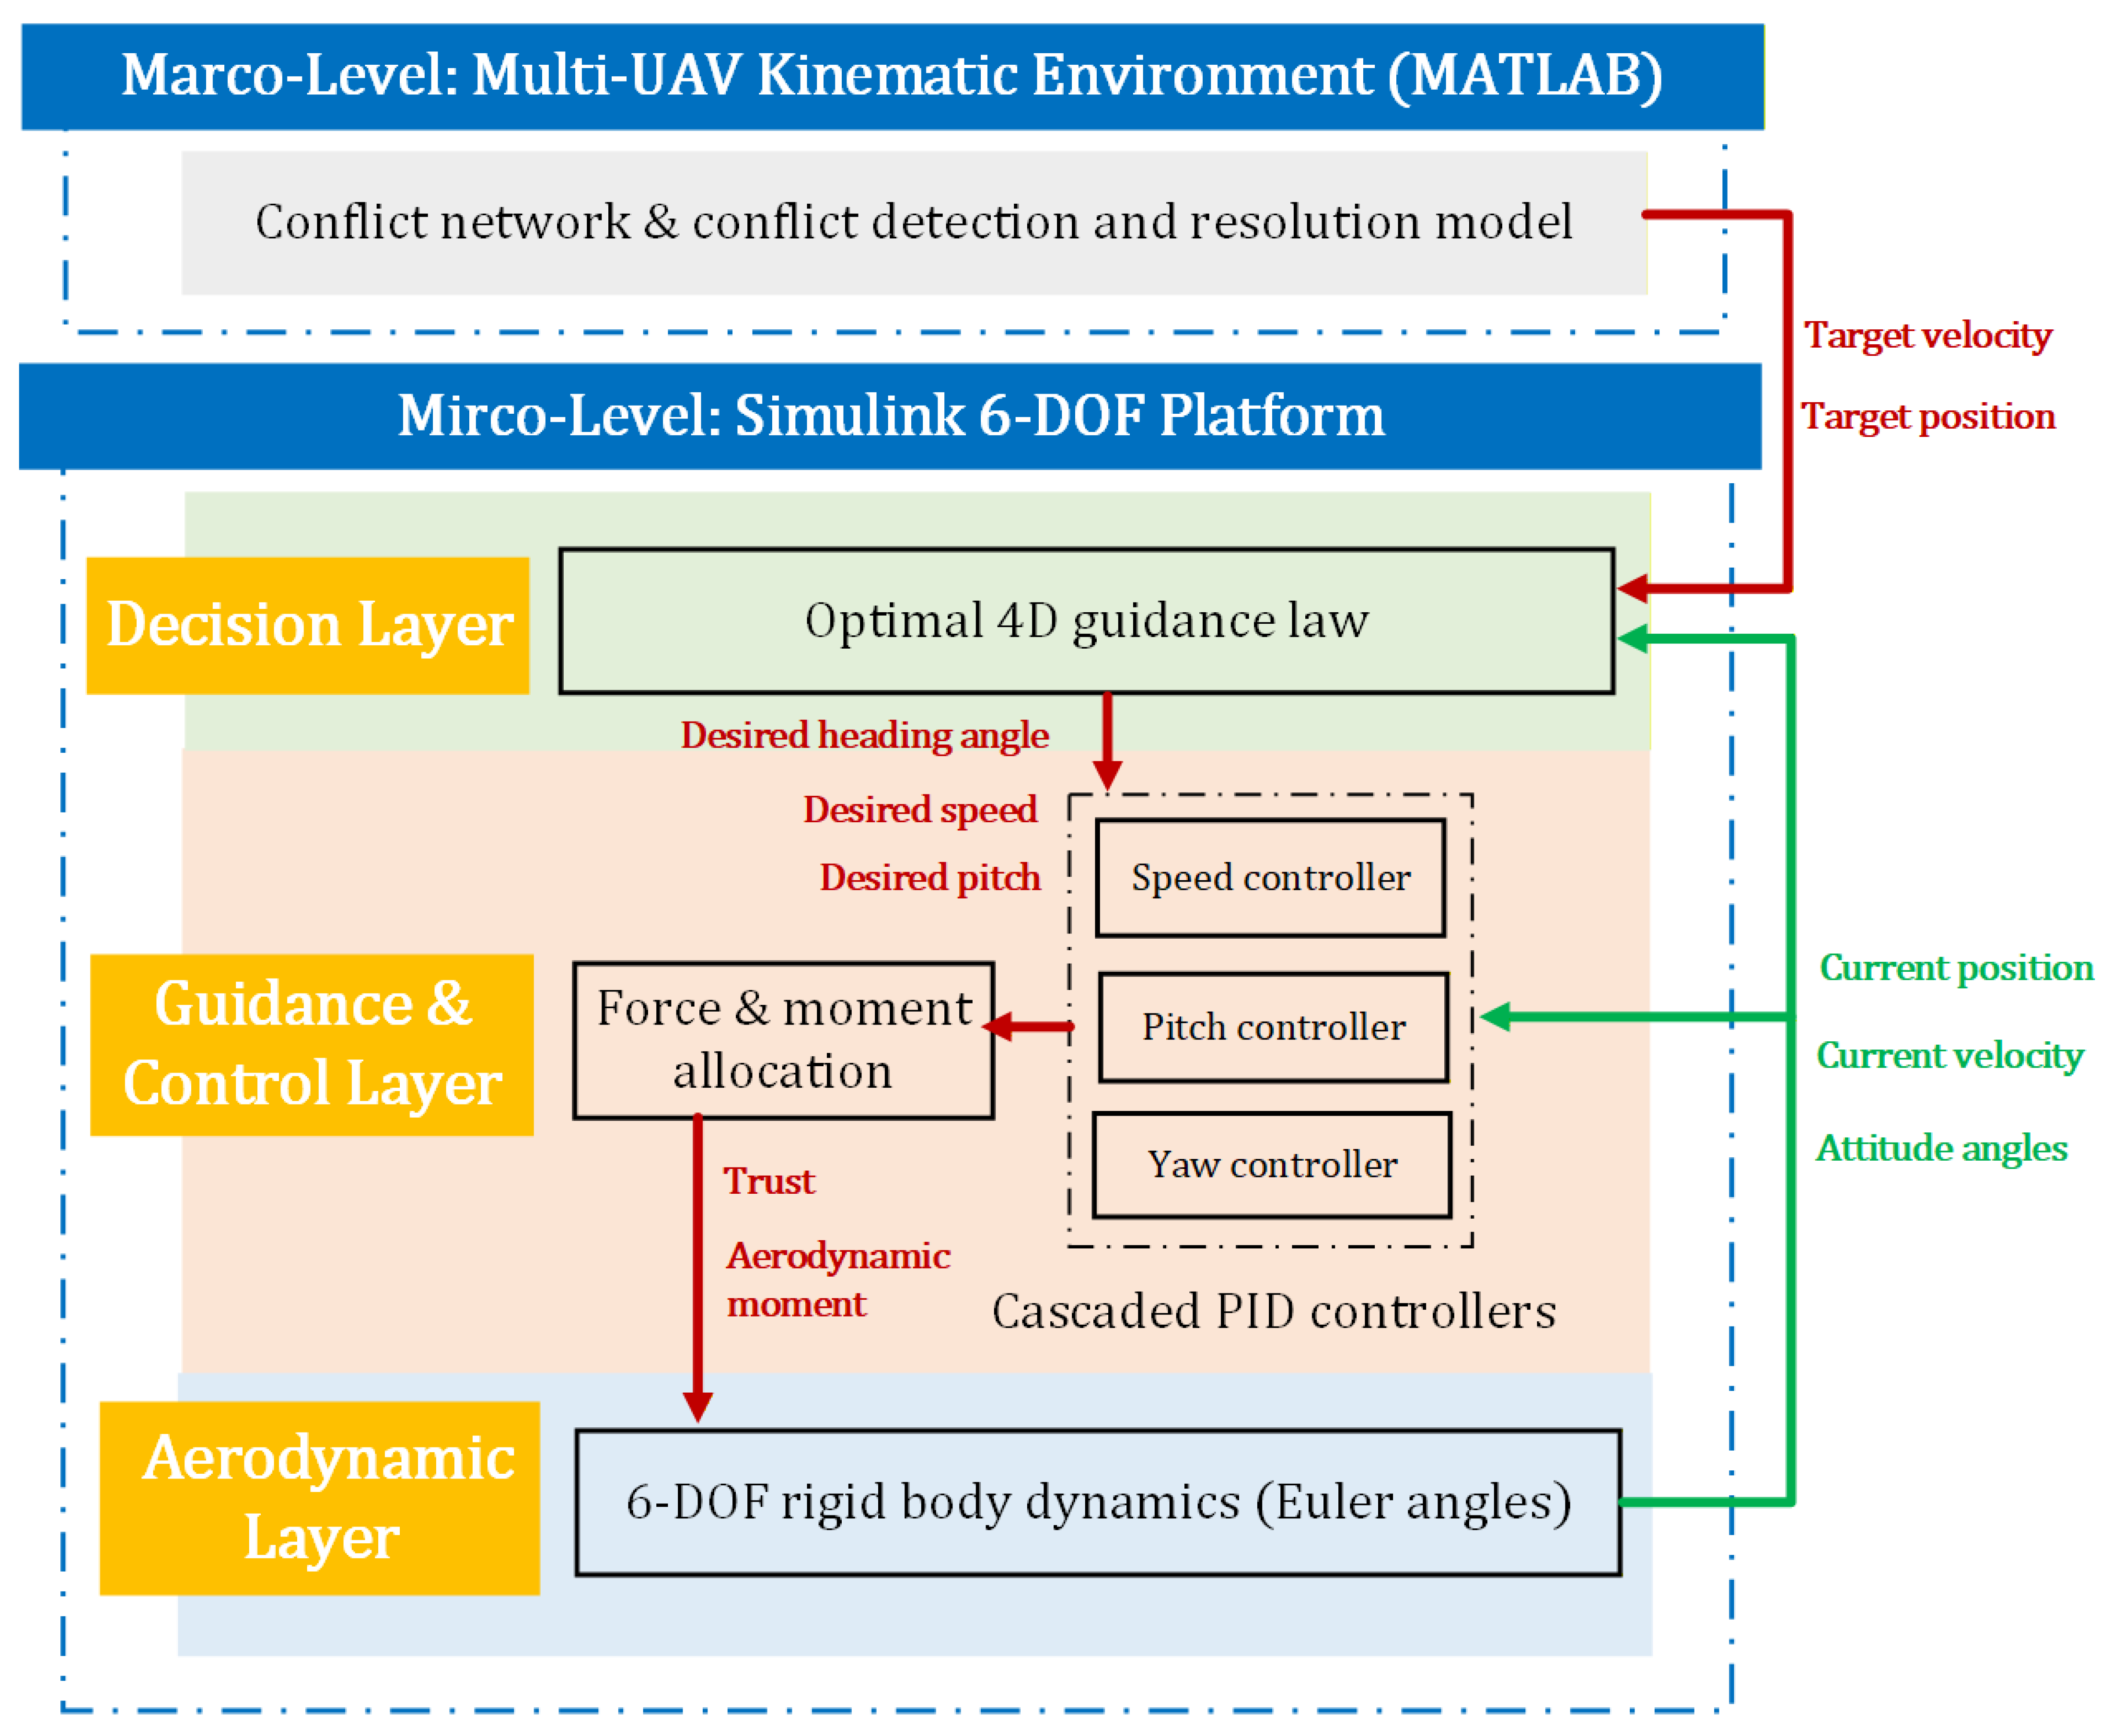
To verify the effectiveness of NCR under actual physical limitations and aerodynamic environments, a 6-DOF simulation platform is established based on MATLAB/Simulink (version R2025b), as illustrated in Figure 4.
The platform is organized into three core layers from top to bottom:
  • Decision layer (outer loop): Executes NCR to output the optimal target velocity based on the conflict situation of multi-UAVs.
  • Guidance and control layer (middle/inner loop): Converts the target velocity into desired attitude angle commands, and calculates the expected aerodynamic moments through a PID closed-loop controller.
  • Aerodynamic layer (bottom layer): Employs a full 6-DOF rigid body dynamics module, which, combined with the physical parameters of the fixed-wing UAV such as mass and moment of inertia tensor, calculates the real 3D position, velocity, and attitude under applied forces in real time to serve as closed-loop feedback signals. This simulation architecture ensures that all subsequently verified conflict resolution strategies strictly comply with aerodynamic constraints and the dynamic response characteristics of the underlying flight control system.
This hierarchical architecture is adopted primarily out of consideration for computational efficiency. Embedding the full 6-DOF dynamic models of multiple UAVs directly into the iterative process of PSO would require solving a set of nonlinear differential equations at each iteration, which would noticeably increase the overall computational burden. By handling kinematic planning and dynamic verification separately, the decision layer can rapidly generate velocity commands under purely kinematic constraints, while the physical feasibility of these commands is verified in a high-fidelity, a posteriori manner by the subsequent guidance, control, and aerodynamic layers.
Given the enormous computational overhead of the full 6-DOF dynamics model in the real-time simulation of multi-UAV swarms, this paper adopts a macro–micro bi-level validation architecture. The macroscopic conflict network topology, priority resolution, and target command generation are uniformly conducted within the MATLAB kinematics environment. At the microscopic level, the resolved optimal commands are output to the Simulink 6-DOF platform for single-UAV dynamic tracking verification.

3.2. Parameters of the Flight Protection Zone

The radius of the protection zone is comprehensively determined by the following factors: (1) GNSS positioning errors, which for standard GPS-based navigation are typically on the order of 1–3 m horizontally and 2–5 m vertically [23,24]; (2) communication and onboard computation latencies, which translate into additional position uncertainty proportional to the UAV cruise speed; and (3) the wake turbulence influence area of fixed-wing UAVs, which although significantly smaller than that of manned aircraft, still necessitates a conservative buffer [25,26,27]. Combining and rounding the above factors, the final radius of the cylindrical protection zone is set to 100 m, considering the UAV operating speeds. The height of the protection zone is set to 20 m, which provides about 20 m of vertical safety buffer for the UAV to perform emergency climb or descent maneuvers within one decision cycle, considering that the maximum vertical speed of the UAV is approximately 10 m/s.
It should be noted that the dimensions of the protection zone are not fixed physical limits, but adjustable parameters that represent the comprehensive performance of the UAV autonomous system’s perception–decision–control loop. When executing maneuver commands, fixed-wing UAVs are constrained by the airframe’s moments of inertia and aerodynamic hysteresis effects. Consequently, their underlying control loops inevitably generate position deviations when tracking ideal kinematic commands. Based on the test statistics from the 6-DOF simulation platform, the time window for the underlying aerodynamic simulation is set to 6 s. Within this time window, the UAV overcomes aerodynamic drag and inertia, smoothly transitioning its flight state from the initial conflicting route to the resolved safe route. After the maneuver window ends, the UAV enters steady-state flight, and its subsequent safety is provided with strict analytical guarantees by the upper-level 3D velocity obstacle model. During this transition process, horizontal and vertical position deviations arise between the actual aerodynamic flight trajectory and the ideal commands due to maneuver delays. To ensure absolute flight safety at the physical execution level, dynamic aerodynamic margins of 50 m horizontally and 30 m vertically are additionally introduced, thereby expanding the actual radius of the protection zone to 150 m and its height to 50 m.
The impact of these parameters on system performance is an independent topic worthy of in-depth investigation in future work.

3.3. Analysis of the Flight Performance

The target platform in this paper is a medium-sized fixed-wing transport UAV. Based on measured parameters of industrial-grade UAVs [28,29], the initial flight speed is approximately 100–300 km/h, and the velocity magnitude adjustment range is ± 30 km/h to ensure smooth maneuvering. For attitude angles, the allowable pitch variation for a single maneuver is ± 15 ° . The horizontal angle variation is controlled within ± 45 ° to ensure trajectory stability. To simplify calculations, each UAV is assumed to achieve a smooth velocity transition [30] and complete the maneuver within the same time t e , which means the scenario construction time can be regarded as advancing forward by t e .
The fitness function Q in the 3D conflict resolution model has strong flexibility, which enables its application to scenarios involving performance, priority, and mission characteristics of UAVs. By adjusting the weight coefficients in Q , resolution recommendations with different preferences can be obtained, all of which satisfy the safety constraint of resolving conflicts successfully. In the experiments of this paper, the weight coefficients α , β , and γ in Equation (11) that govern the variations in velocity components are set to 2, 20, and 0.1, considering the unit consistency of variables and the minimization of trajectory deviation.

3.4. Scenario Setup

Simulation scenarios that meet the specified conditions are constructed in this subsection. 20 points are randomly chosen as initial position coordinates for UAVs within a 3D airspace of 15   k m × 15   k m × 0.4   k m , and heading angles and velocity magnitudes are generated for each UAV. The randomly generated simulation scenarios are screened by the following criteria: (1) all UAV pairs in the scenario must meet the required minimum separations; (2) conflict assessment is required during screening, and the number of conflicting UAV pairs in a qualified scenario should be at least 5; and (3) new random scenarios are generated iteratively until a suitable one is obtained.
A simulation scenario is obtained following the screening steps, in which the velocity and position information of the UAVs are listed in Table 1.

3.4.1. Conflict Situation Analysis

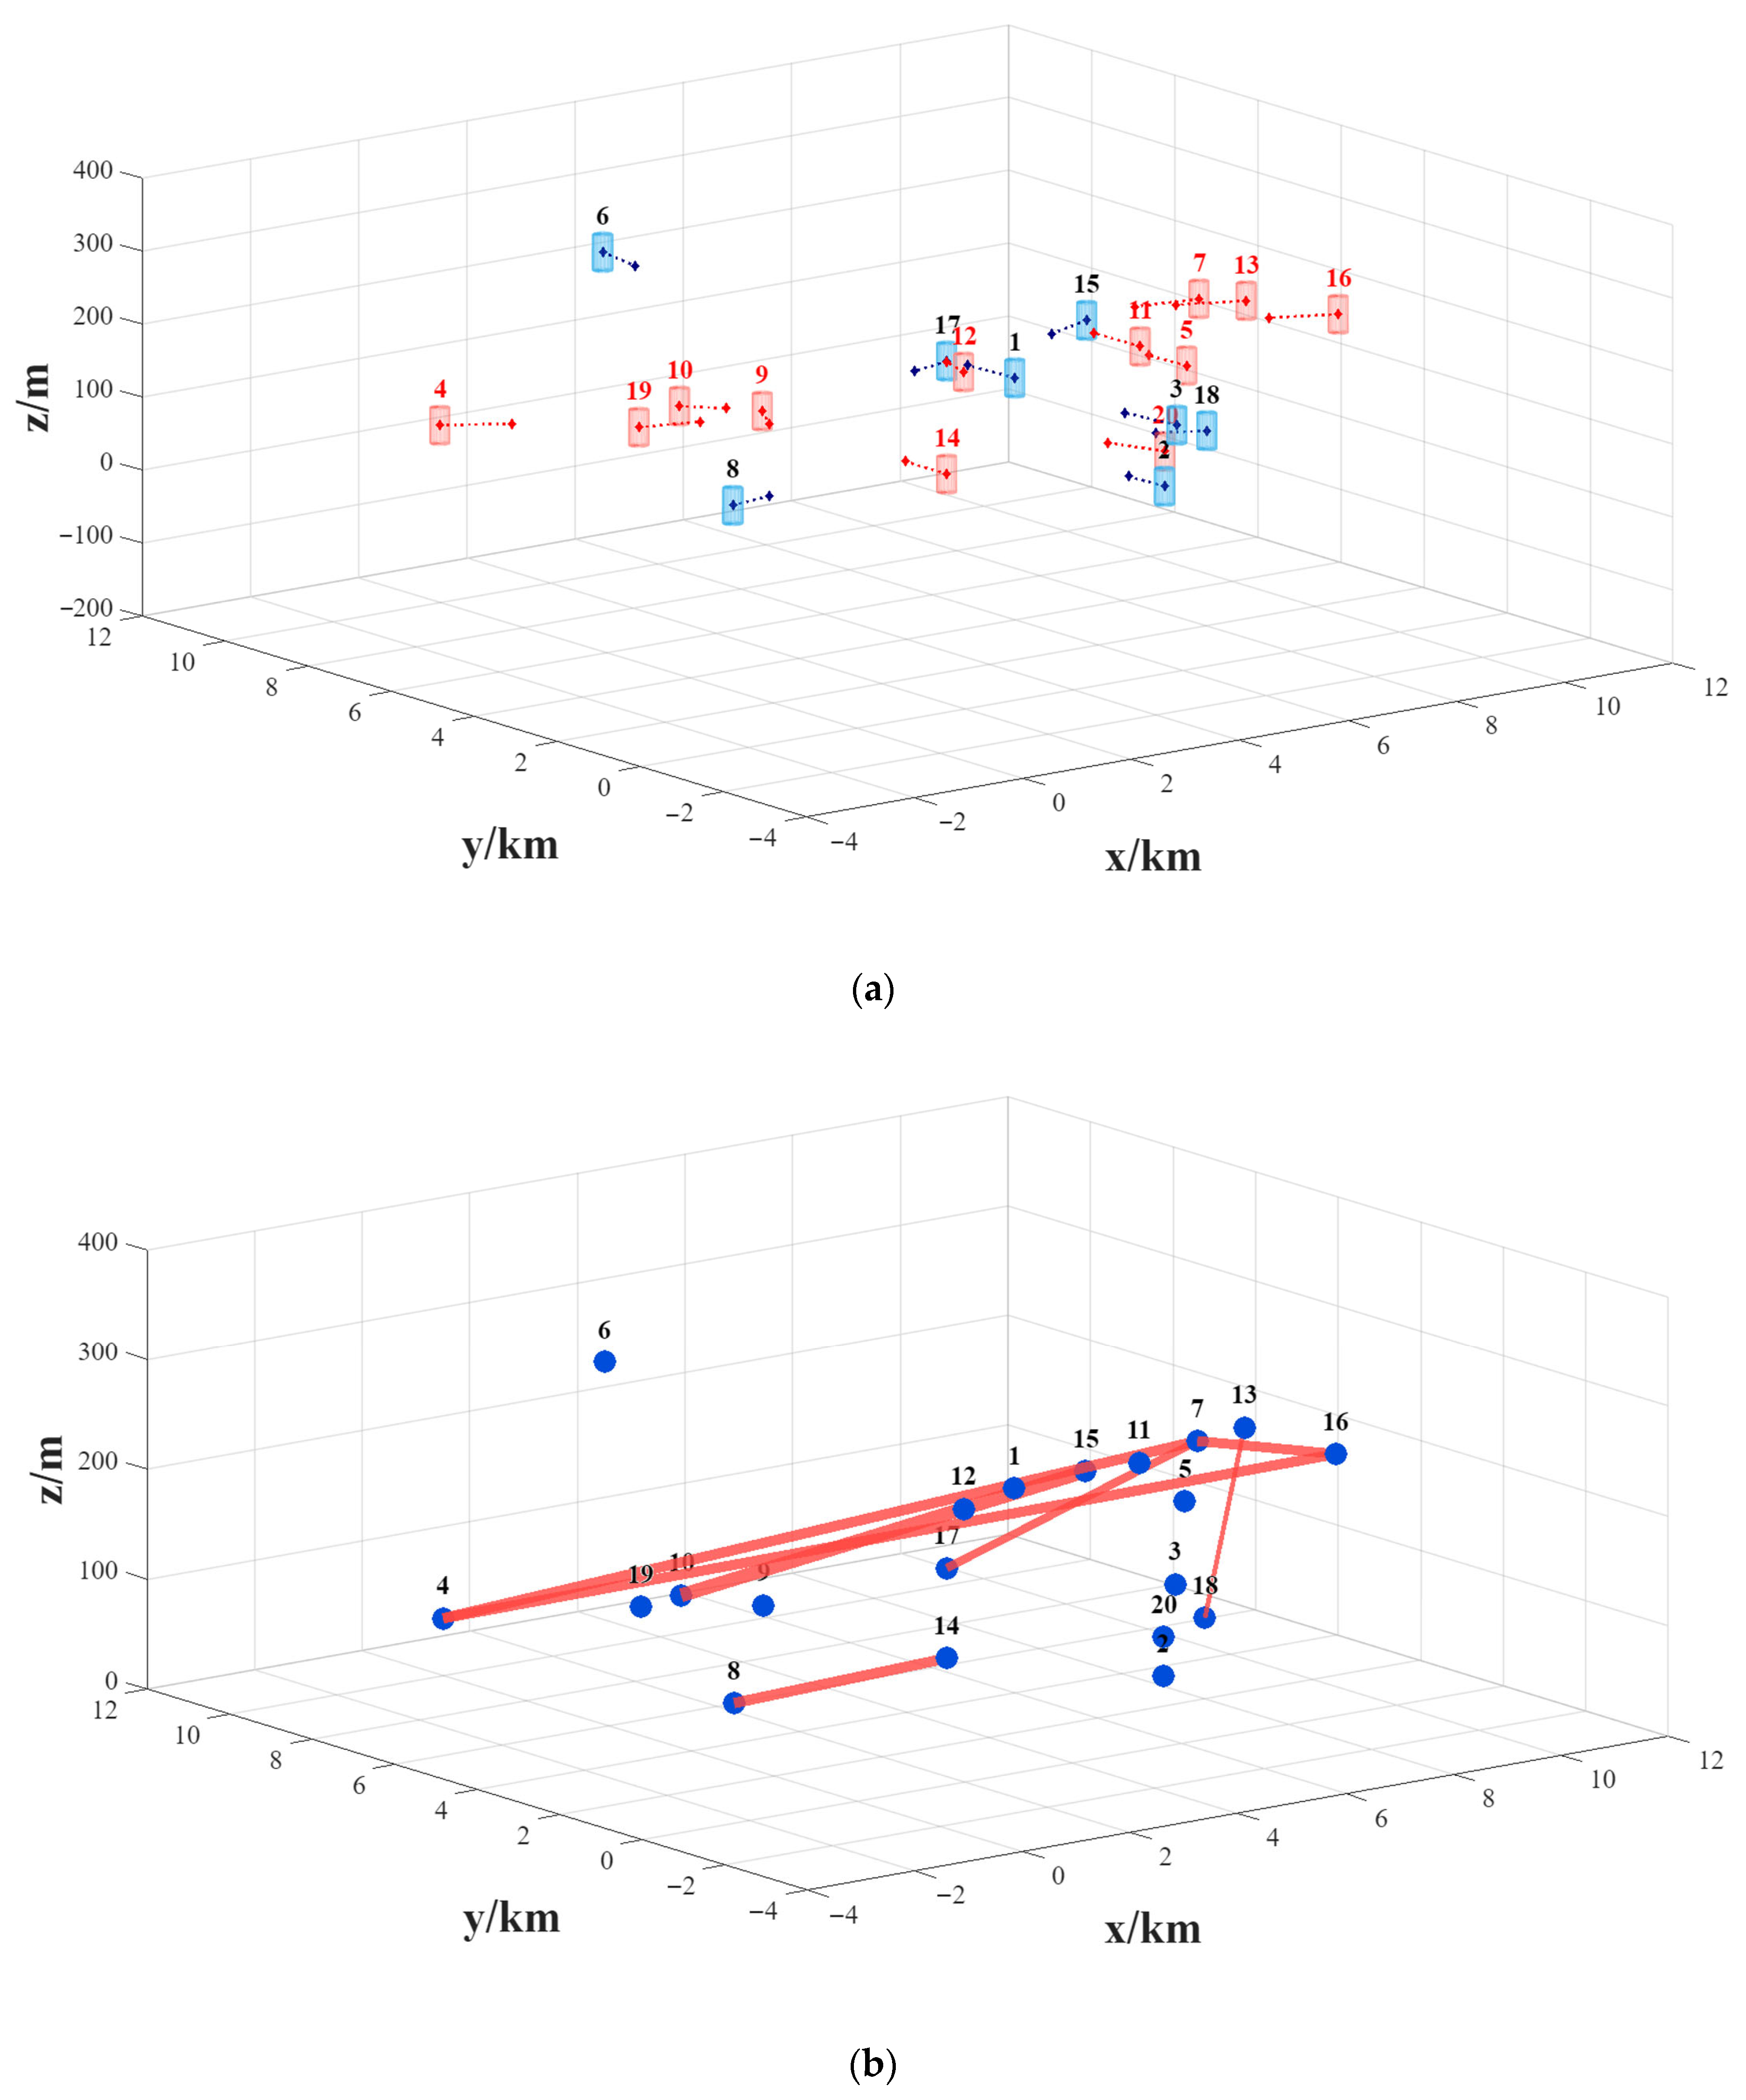
The conflict situation of the scenario is shown in Figure 5a, where the cylinders represent the flight protection zones of the UAVs, and the diamond-marked dashed lines indicate their 20 s flight trajectories along the current velocity directions. The blue cylinder indicates the UAV with no current conflicts, while the red one means the UAV is in conflict with others. The z-axis coordinates and cylinder dimensions in Figure 5 are appropriately enlarged for better visualization.
A conflict network is constructed as shown in Figure 5b based on the conflict situation. The edge weights are represented by the thickness of the red lines in this network, where the thicker lines indicate higher conflict urgency.
Table 2 lists t c of the UAVs. It can be observed that some UAVs in this scenario have complex conflict relationships with each other, while UAVs such as 1, 2, 3, 6, 8, 15, 17 and 18 do not conflict with others. However, the UAVs with no conflict must be retained in every conflict assessment, or newly generated recommendations may trigger more urgent conflicts with them. Such a complex airspace scenario can be characterized by a conflict network. According to the calculation method for w introduced earlier, the conflict values w i j between nodes can be obtained, forming the 20 × 20 weight matrix W .
Due to the large dimension of W , Table 2 lists the corresponding adjacency relations of the conflict network. The following two points should be noted in this table: (1) only non-zero connected pairs are listed; (2) due to the symmetry of the matrix, only connections with i < j are listed.

3.4.2. Conflict Resolution Results

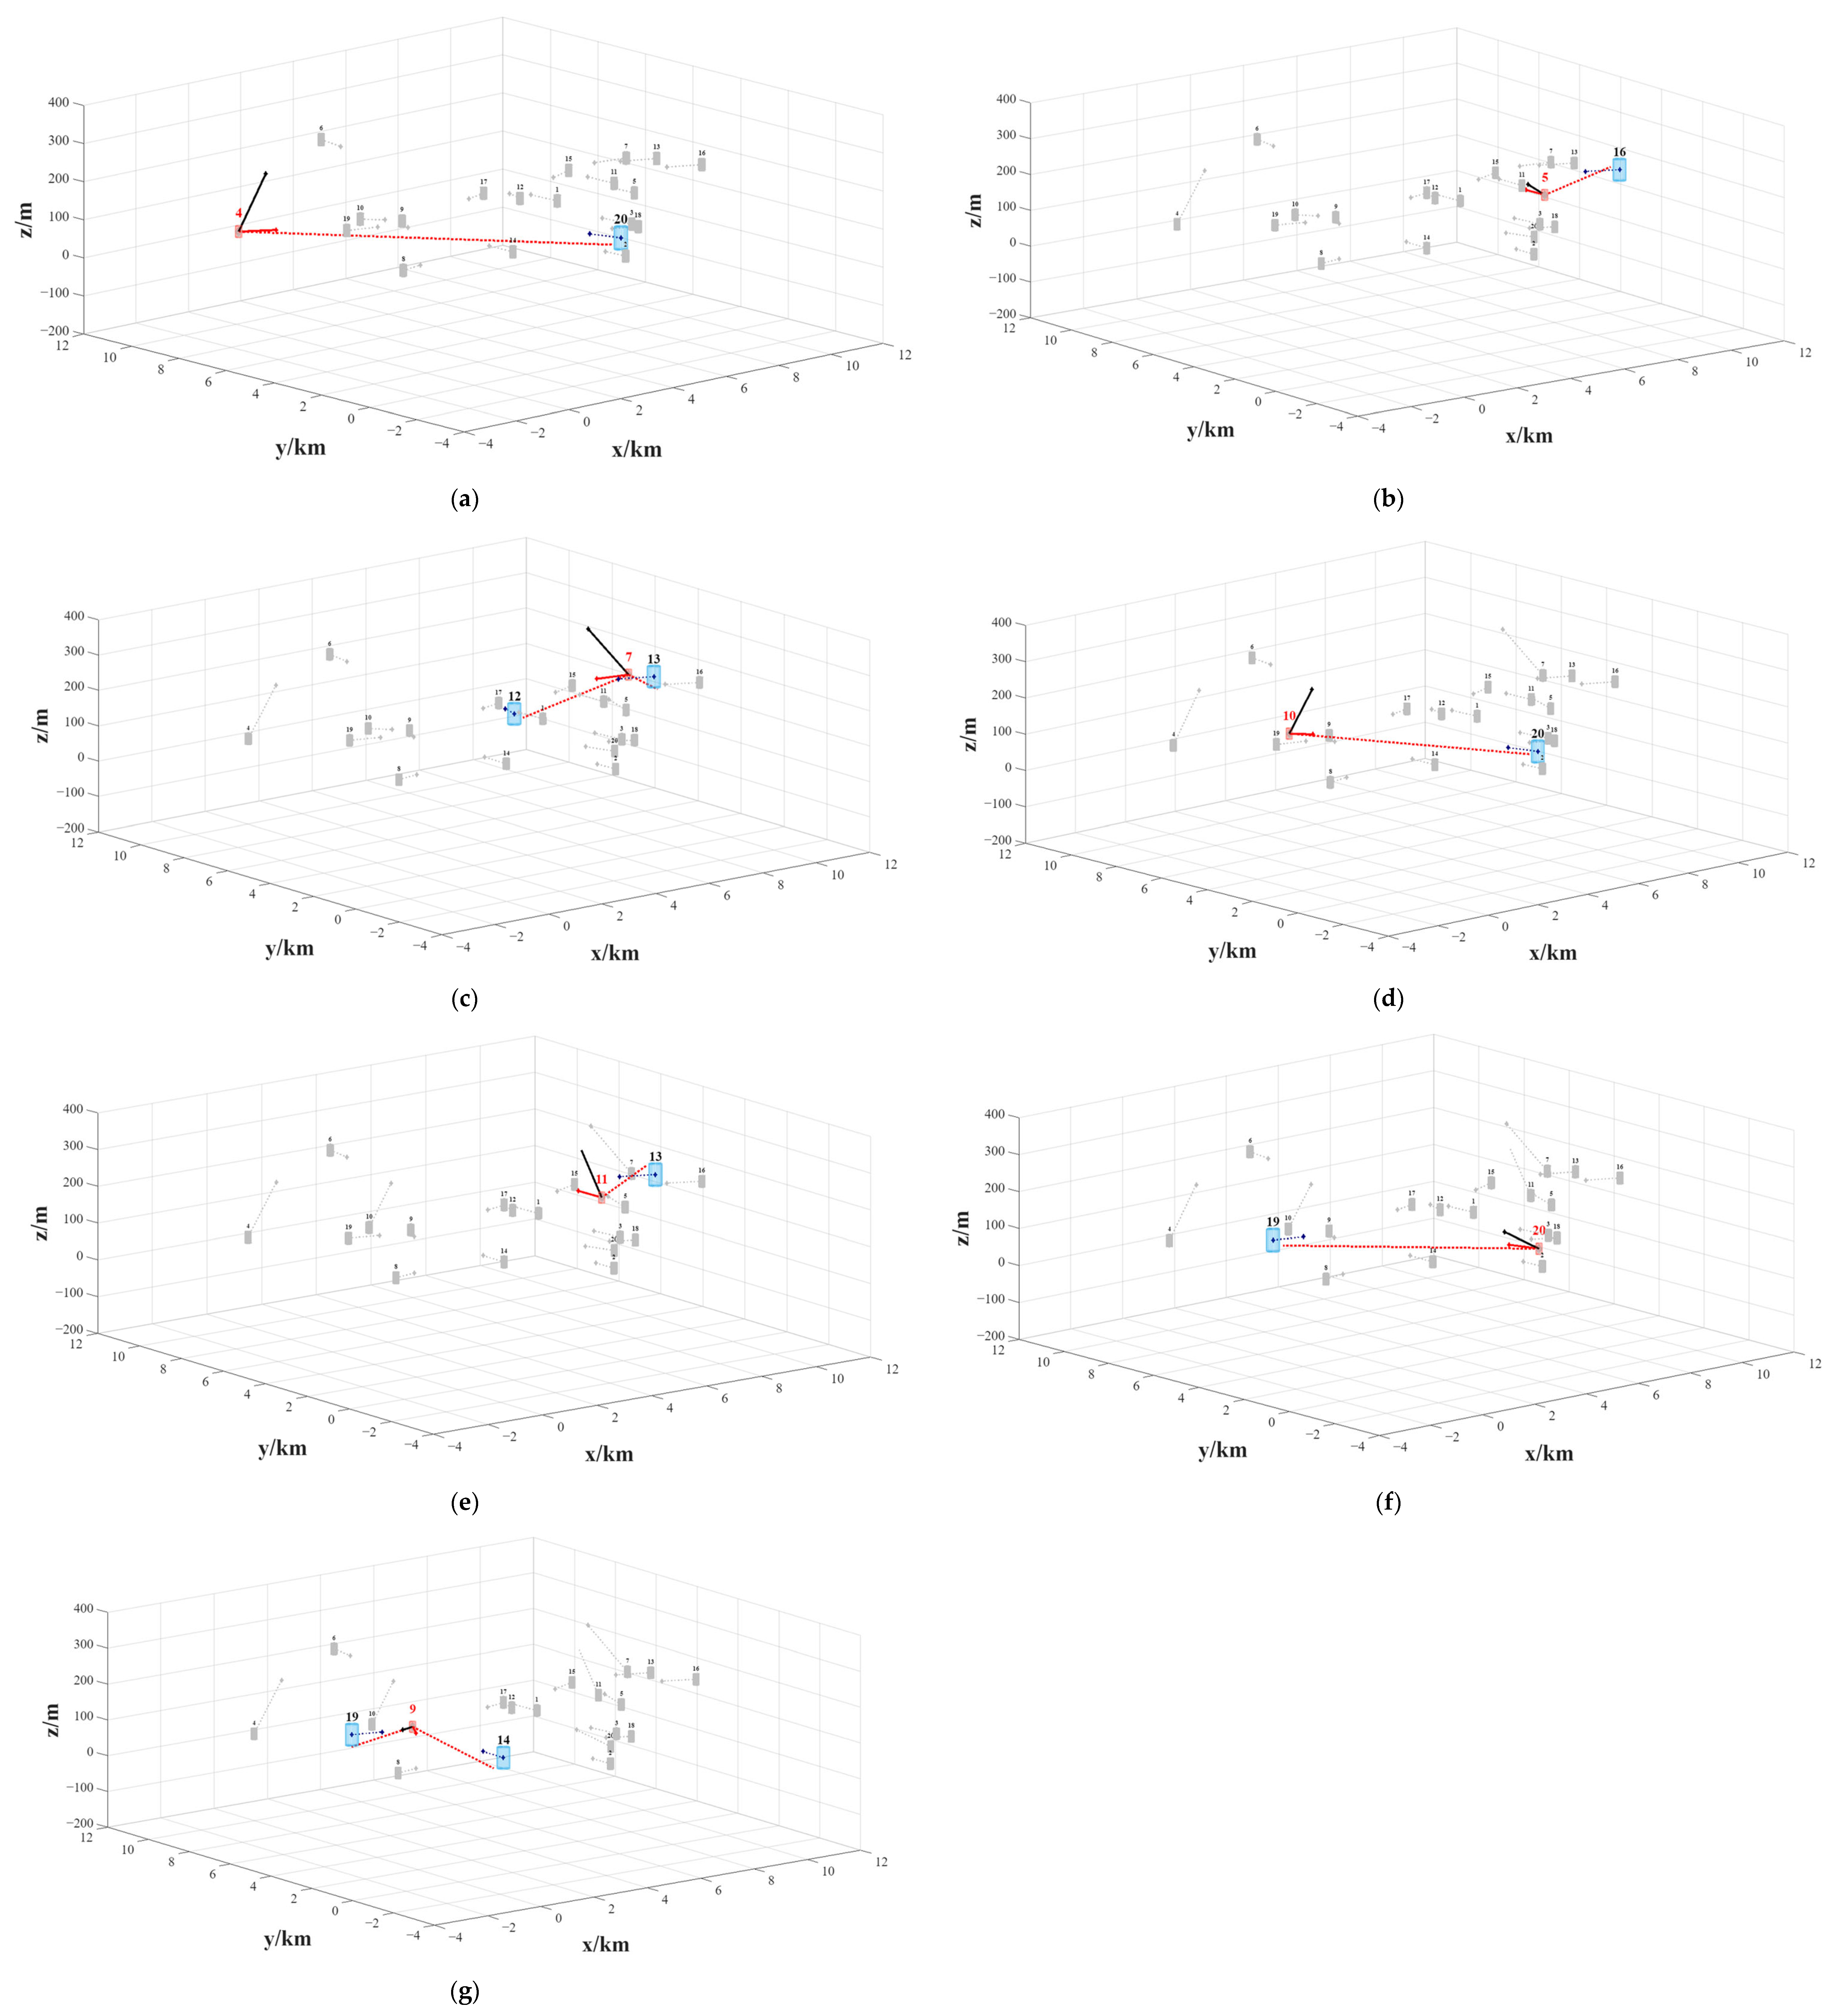
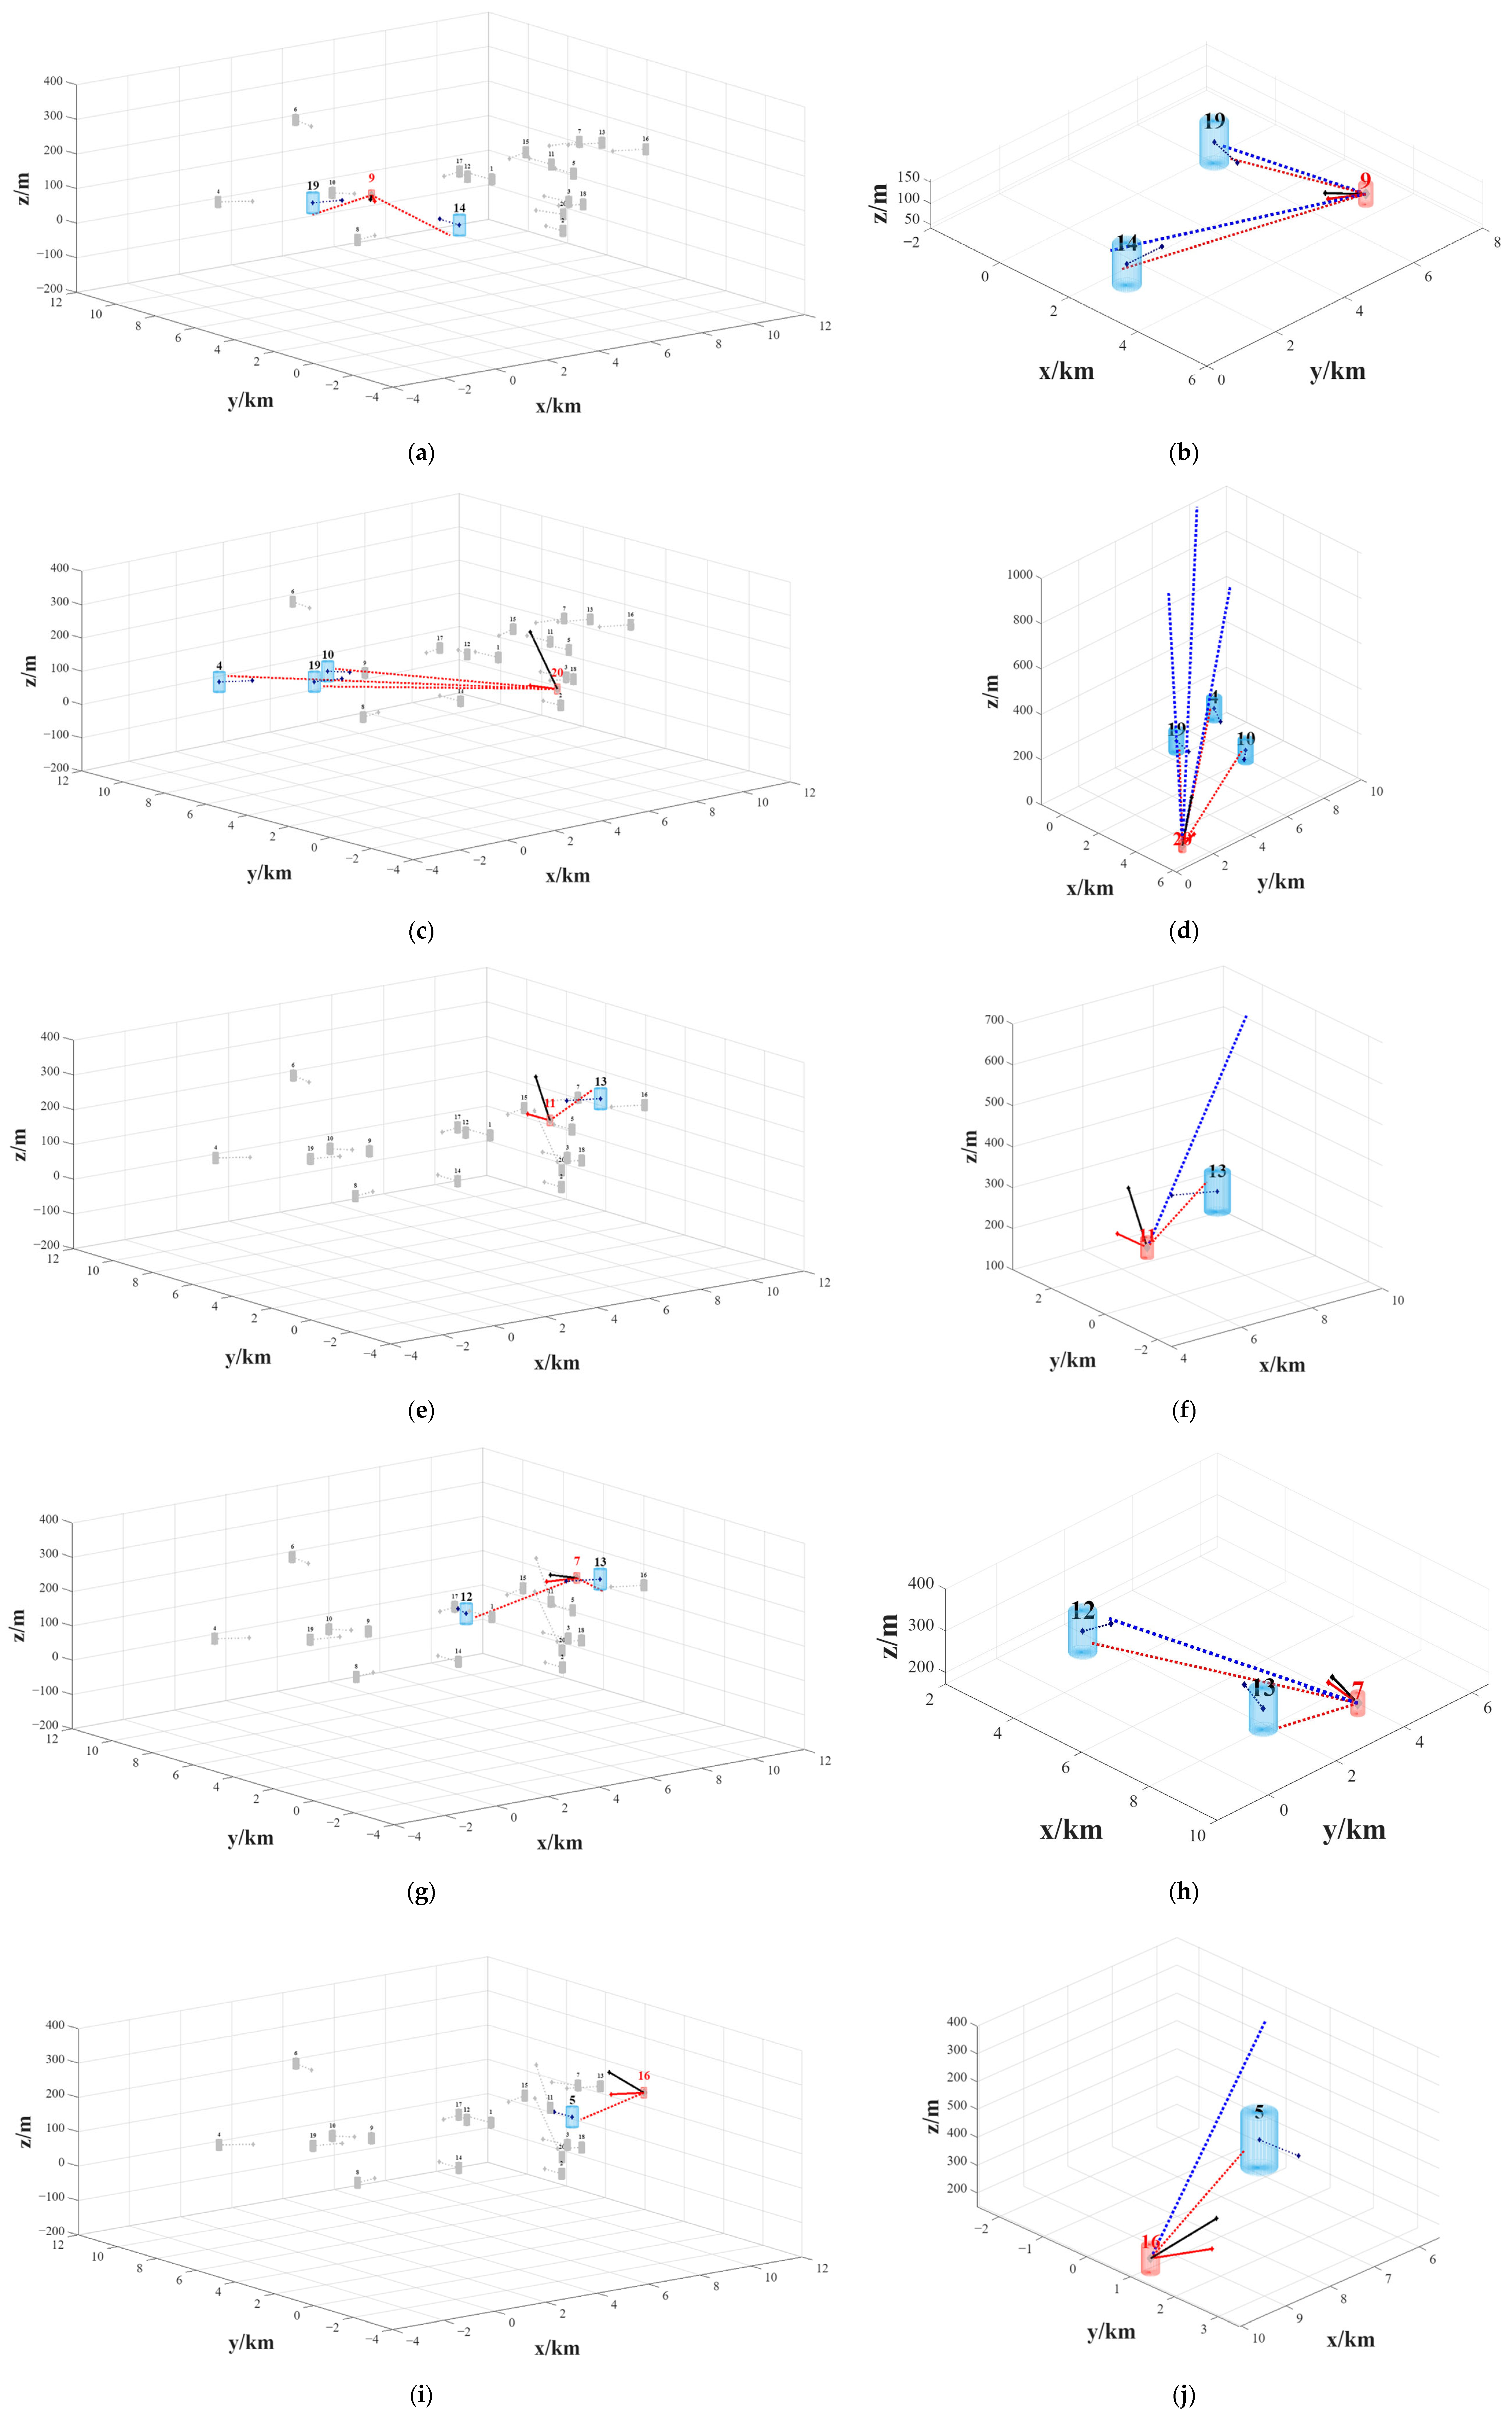
The conflict resolution recommendations are illustrated in Figure 6, where two subplots in each row show the maneuver recommendation at one step. The left subplot depicts the complete scenario, in which the red cylinder denotes the key UAV that executes the maneuver recommendation at each step, and the blue ones represent the relevant UAVs in conflict with the key UAV. The expanded protection zones, plotted according to the 3D velocity obstacle model, are exactly twice as large as the other cylinders. The gray cylinders represent other UAVs that have no conflict with the key UAV. The original velocity of the key UAV is indicated by the red solid line, and the relative velocity between the key UAV and the relevant UAVs is shown by the red dashed line. The new velocity of the key UAV is represented by the black solid line; if the key UAV travels at this velocity, it can avoid conflicts with the relevant UAVs, as demonstrated in the right subplots.
The right subplots in Figure 6 only retain the key UAV and the relevant UAVs, so that the conflict and resolution recommendations can be observed more clearly. In these subplots, it can be clearly seen that the red dashed line, representing the relative velocity, intersects the expanded protection zone, indicating that a conflict exists between them based on the 3D velocity obstacle model. The blue dashed line represents the new relative velocity, whose straight line does not intersect the blue cylinder. All other colors and line styles in the right subplots are consistent with those in the left subplots.
Table 3 shows the change in the network robustness R m after the maneuver recommendation is implemented at Step m . It should be noted that although the UAV maneuver recommendations are listed in step order, they are actually executed simultaneously at the same time instant.
After Step 5, the network robustness R 5 decreases to zero, indicating that the conflict network has disintegrated and all conflicts have been completely resolved in the scenario.

3.4.3. Aerodynamic Validation of Resolution Recommendations

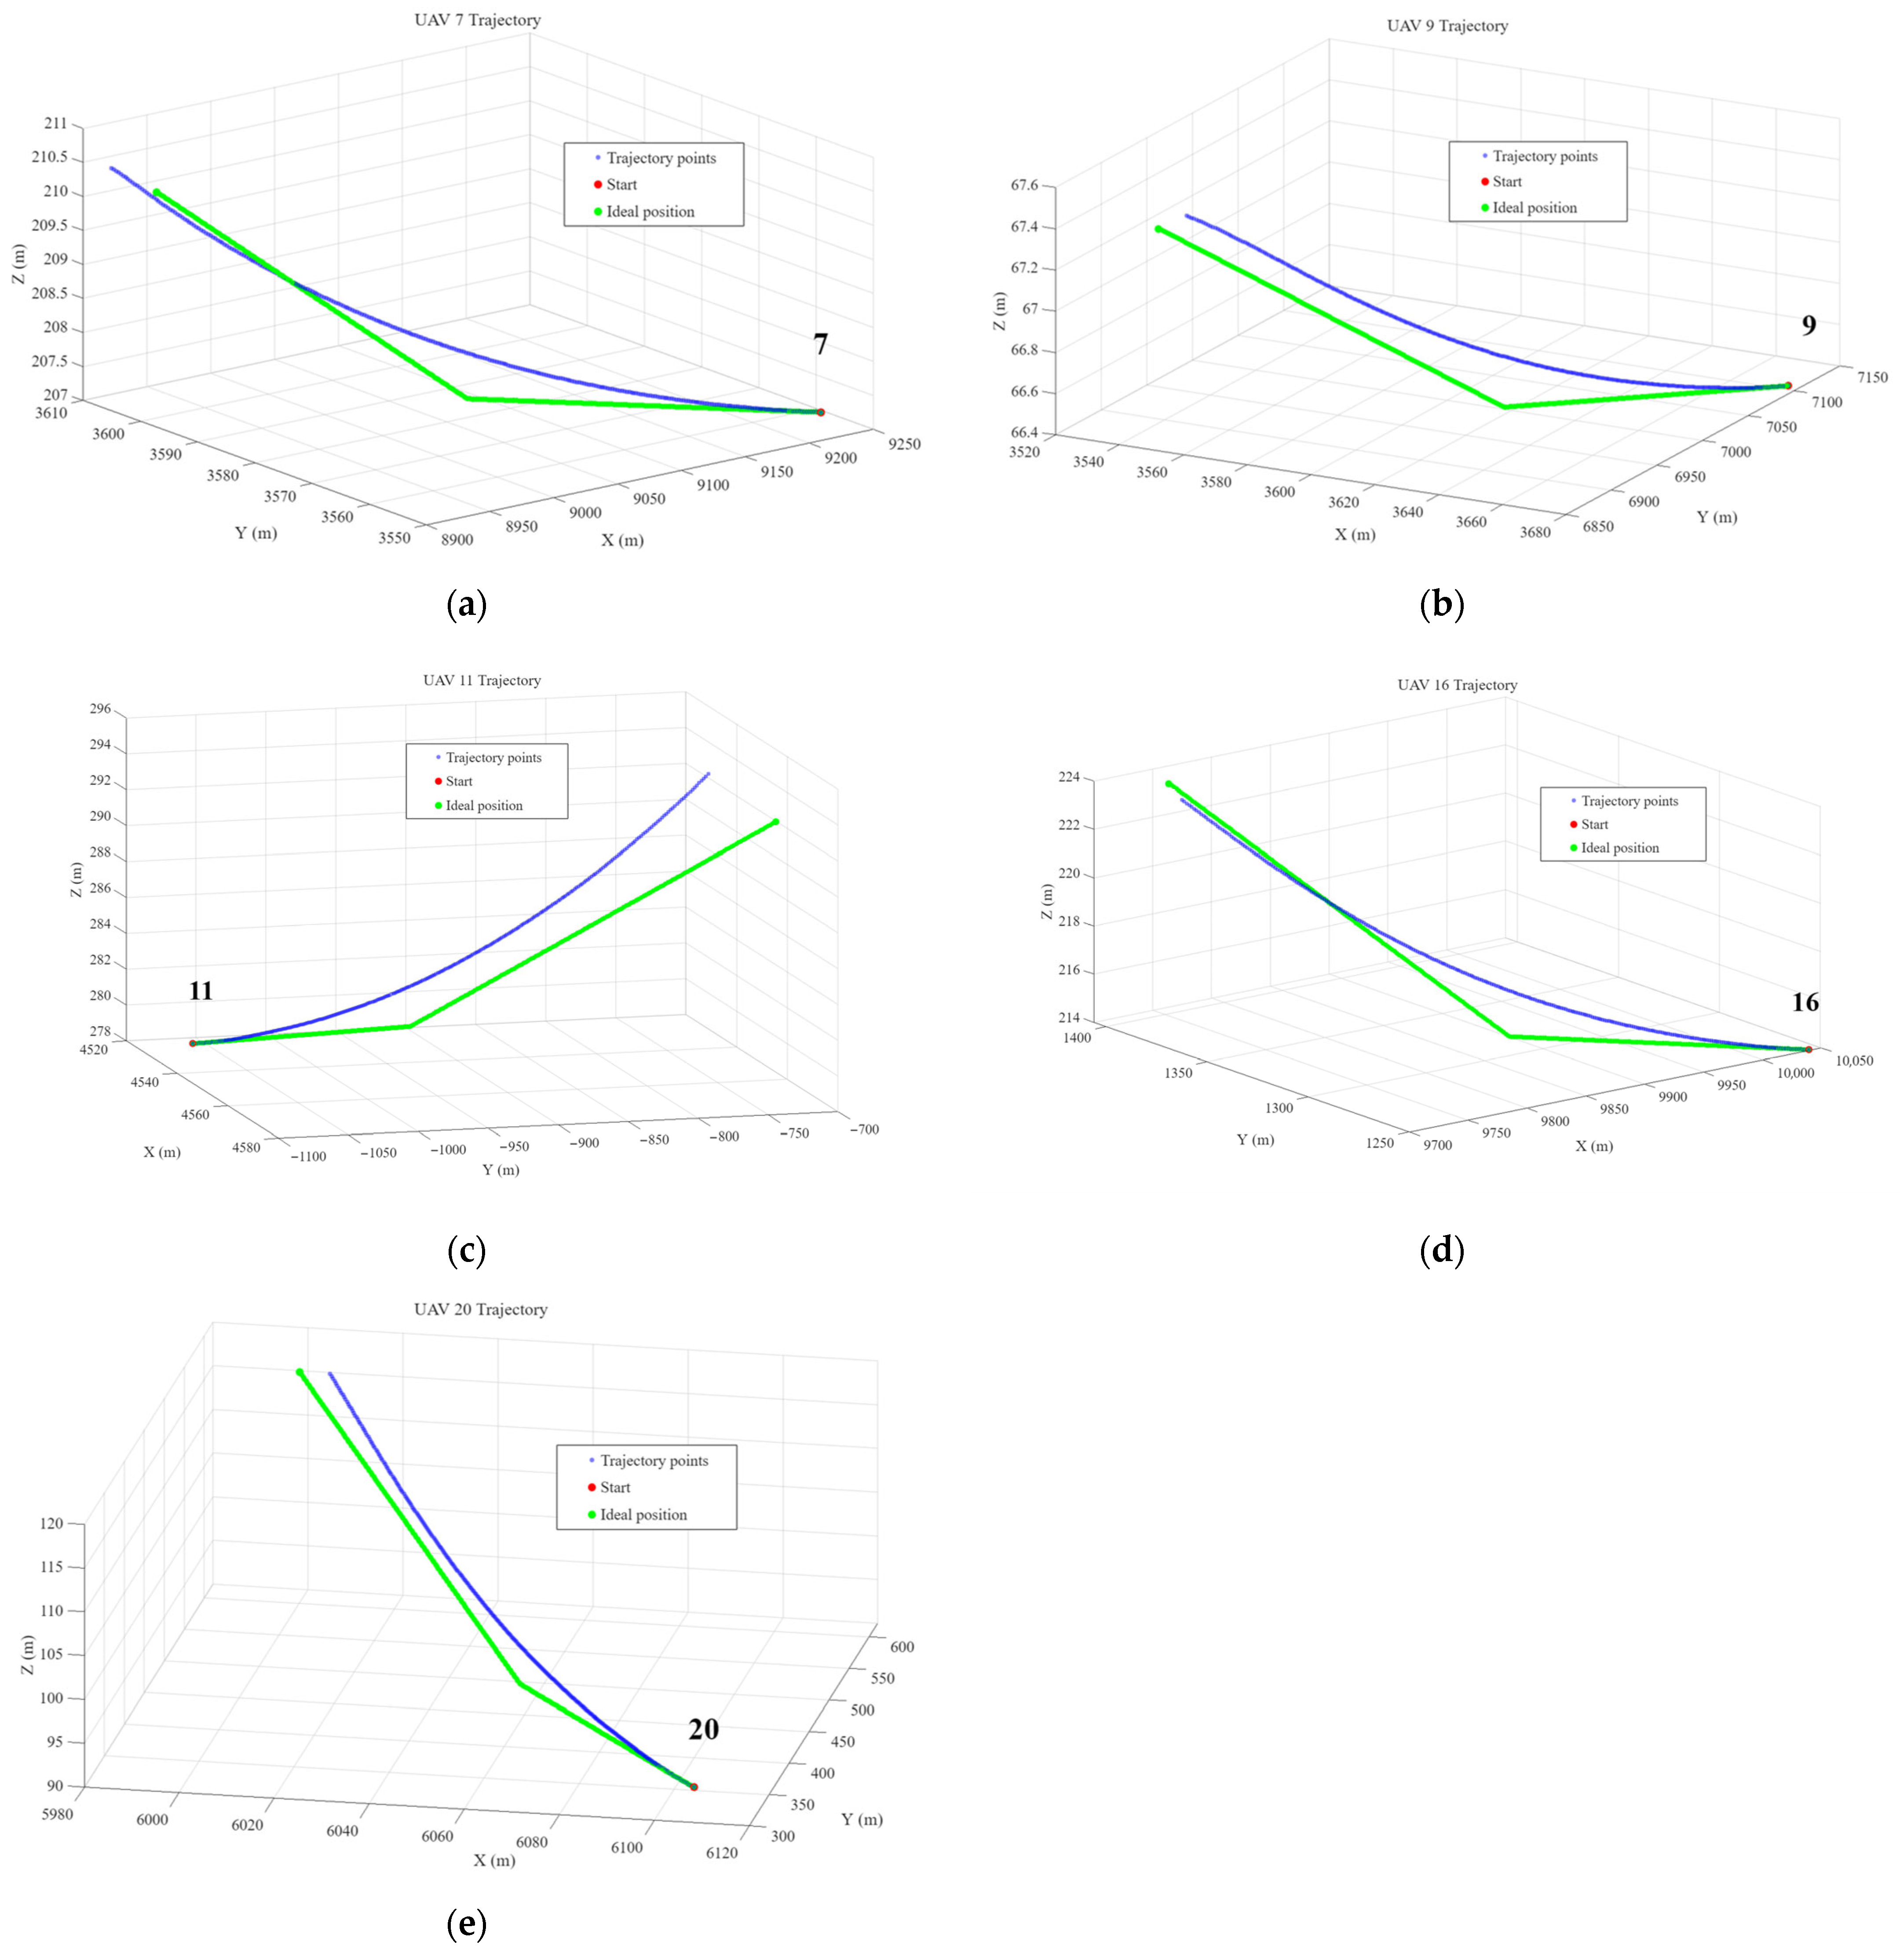
To further intuitively demonstrate the actual impact of underlying aerodynamic constraints on collision avoidance trajectories, Figure 7 illustrates the 3D aerodynamic simulation trajectory tracking performance of fixed-wing UAVs while executing NCR commands.
In Figure 7, the green solid line represents the target command trajectory issued by the decision layer, while the blue dotted sequence represents the actual aerodynamic trajectory resolved in the 6-DOF simulation platform after incorporating the UAV’s moments of inertia, aerodynamic moments, and PID response delays. The results demonstrate that, constrained by the underlying physical inertia, the actual trajectory exhibits certain position deviations from the ideal commands during the maneuver, but overall, it is capable of stably tracking the target commands.
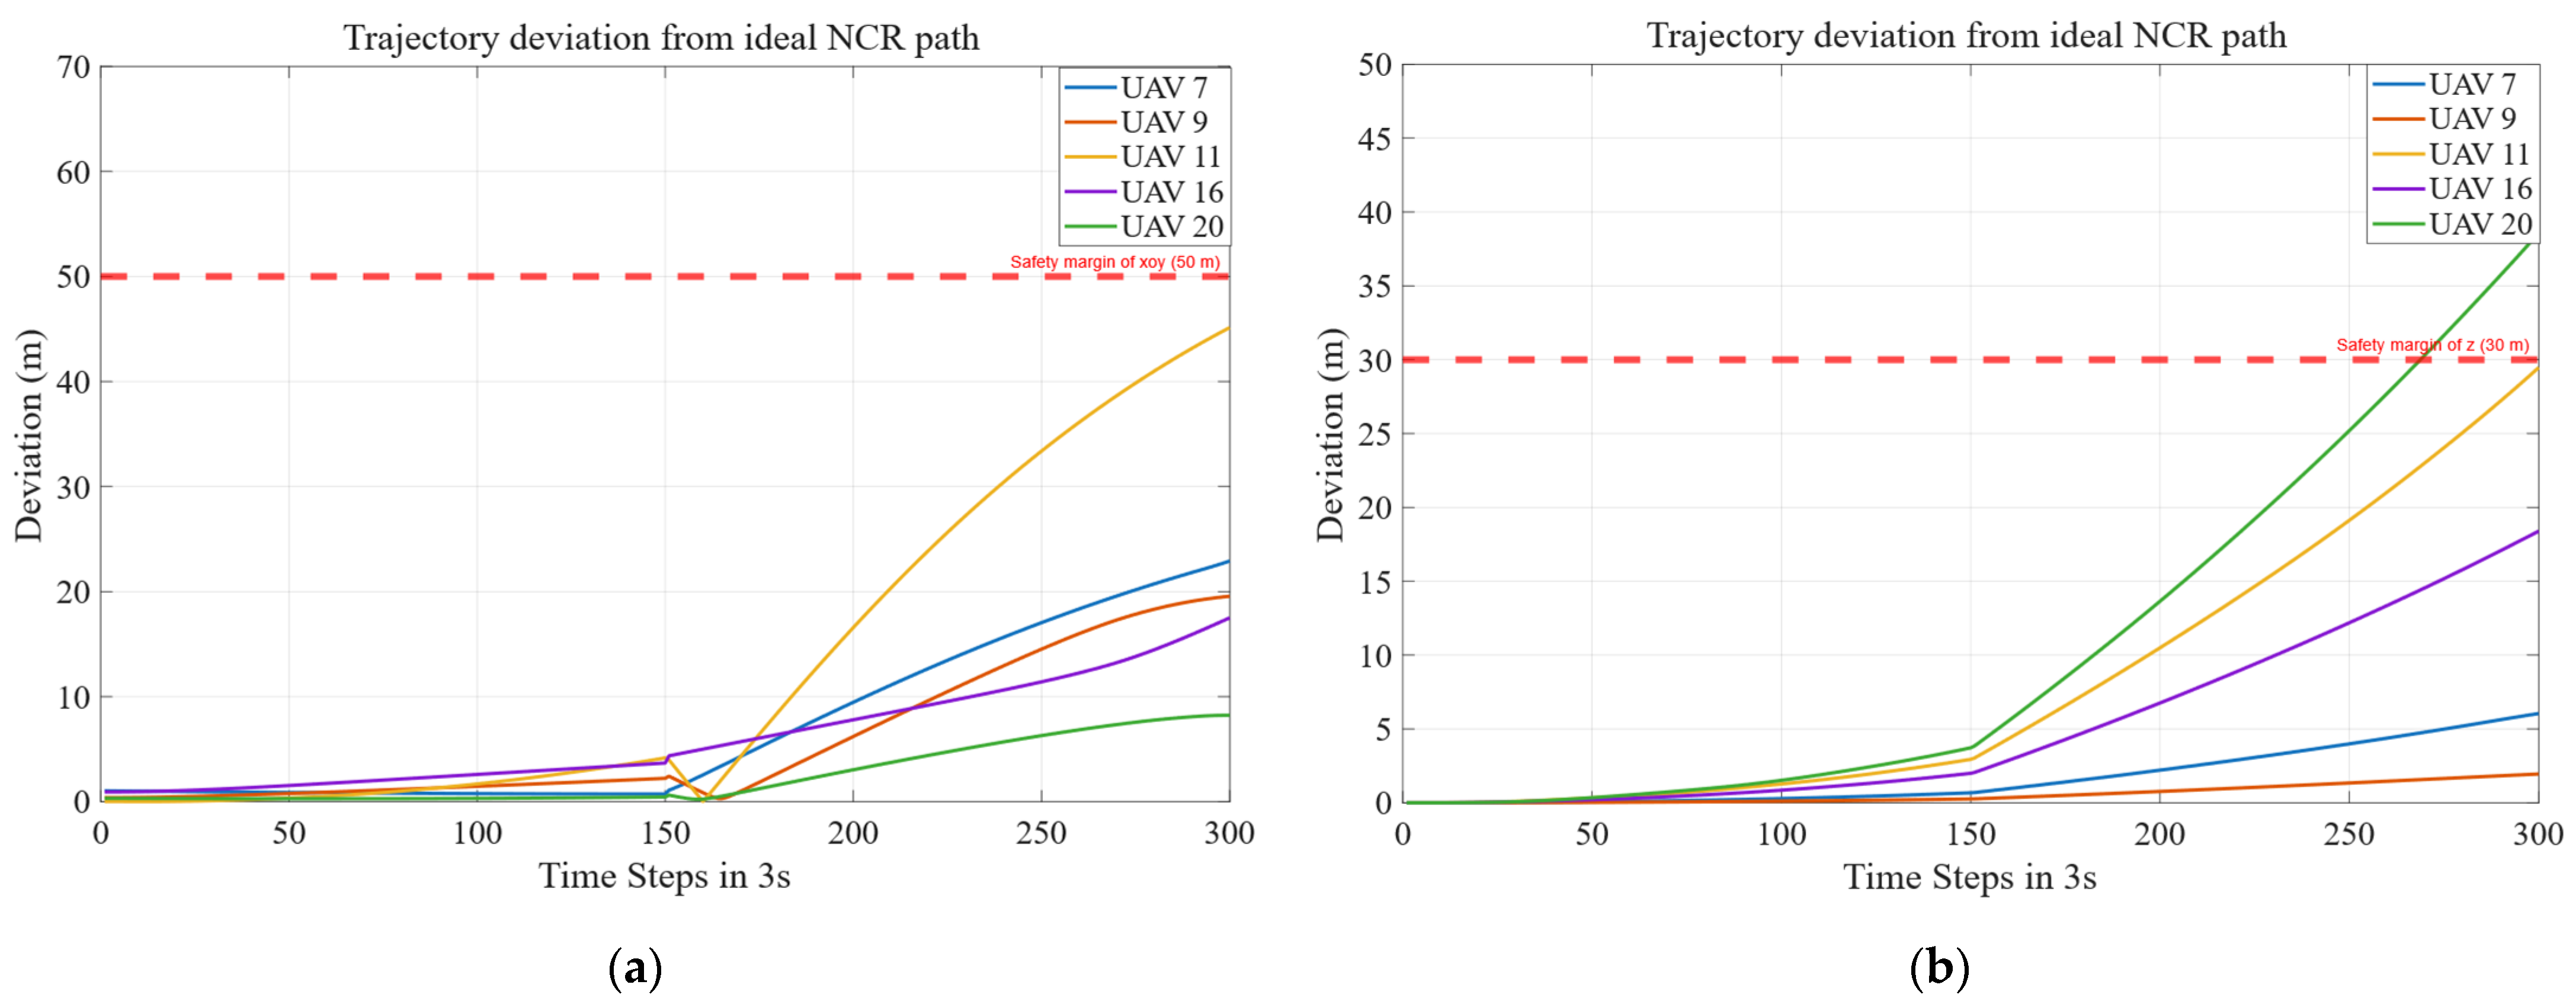
To comprehensively evaluate the actual tracking performance of UAVs in 3D space, the aerodynamic trajectory deviations are decoupled into horizontal and vertical dimensions for verification. Figure 8a and b illustrate the horizontal deviation and vertical deviation of each UAV during the maneuver, respectively.
The simulation results indicate that throughout the collision avoidance maneuver window, the horizontal and vertical tracking deviations of all UAVs are overall effectively enveloped within the pre-set 50 m horizontal safety margin and 30 m vertical safety margin. This result intuitively confirms the existence of objective physical deviations, while also verifying the scientific rationality of the safety redundancy settings in the proposed 3D conflict detection model, thereby demonstrating the absolute safety and physical feasibility of the strategies under actual aerodynamic constraints. In addition, this result provides a posteriori support for the conservatism of the empirical time window value: the fact that tracking deviations during the maneuver remain within the predefined safety margins suggests that the eventual conflict resolution outcome is not highly sensitive to the specific value of this interface parameter.

3.5. Comparative Experiment

The solution to NCR can be decomposed into two main steps: (1) constructing a conflict network to identify key nodes; (2) searching for the optimal solution based on the PSO algorithm. In this subsection, two comparative experiments are further designed under the same scenario, which can be regarded as methods that omit Step 1 and Step 2. The comparative experiments will verify the feasibility and necessity of NCR.

3.5.1. Serial-Based Multi-UAV Conflict Resolution Method

In scenarios involving multiple UAVs, it may be necessary for several UAVs to execute resolution recommendations simultaneously to resolve conflicts. Therefore, resolving conflicts among them requires first clarifying the priority rules. This paper proposes determining key nodes by calculating the conflict urgency of UAVs and prioritizing all UAVs based on these key nodes. The resolution results obtained by another method are presented here. The comparative method does not additionally consider priority, but only relies on the serial number of the UAV to determine the order in which resolution recommendations are formulated and executed. The rest of the method is consistent with NCR. For ease of description, the comparative method is referred to as the Serial-Based Multi-UAV Conflict Resolution (SCR) method. Based on general experience, it can be speculated that in scenarios where conflicts are successfully resolved, SCR may cause more UAVs to perform additional resolution maneuvers. The number of UAVs undergoing velocity variation will increase, and the total velocity variation across all UAVs in the scenario will be relatively large.
SCR is implemented for the same scenario. The previously defined UAV serial numbers from 1 to 20 are directly adopted. Conflict resolution recommendations are generated for conflicting UAVs in the scenario, starting from smaller serial numbers, with the UAVs performing maneuvers one by one.
The conflict resolution recommendations are illustrated in Figure 9, where the colors and line styles of the 11 subplots are consistent with those in Figure 6. It can be observed that SCR requires seven UAVs to perform maneuvers, since the maneuver sequence in this method is determined by the serial number of the UAV. As shown in Figure 9g, the maneuvers of UAV 9 are determined last, which is inconsistent with its position in the serial number order. Obviously, in the first round of sequencing, the maneuvers of other UAVs in the earlier steps resulted in a more complex conflict situation involving the UAV. At this point, their velocity changes are more likely to trigger new conflicts, leading to an increase in the conflict network robustness. Therefore, to ensure the limited range of velocity variation, the two UAVs cannot achieve conflict resolution immediately and have to defer their maneuver opportunities to other UAVs. After the other UAVs have performed maneuvers and resolved the conflicts, in the second round of sequencing, the conflict situation of UAV 9 has become relatively simple, and SCR can then provide maneuver recommendations for it.
The maneuver recommendations and resolution results are shown in Table 4.
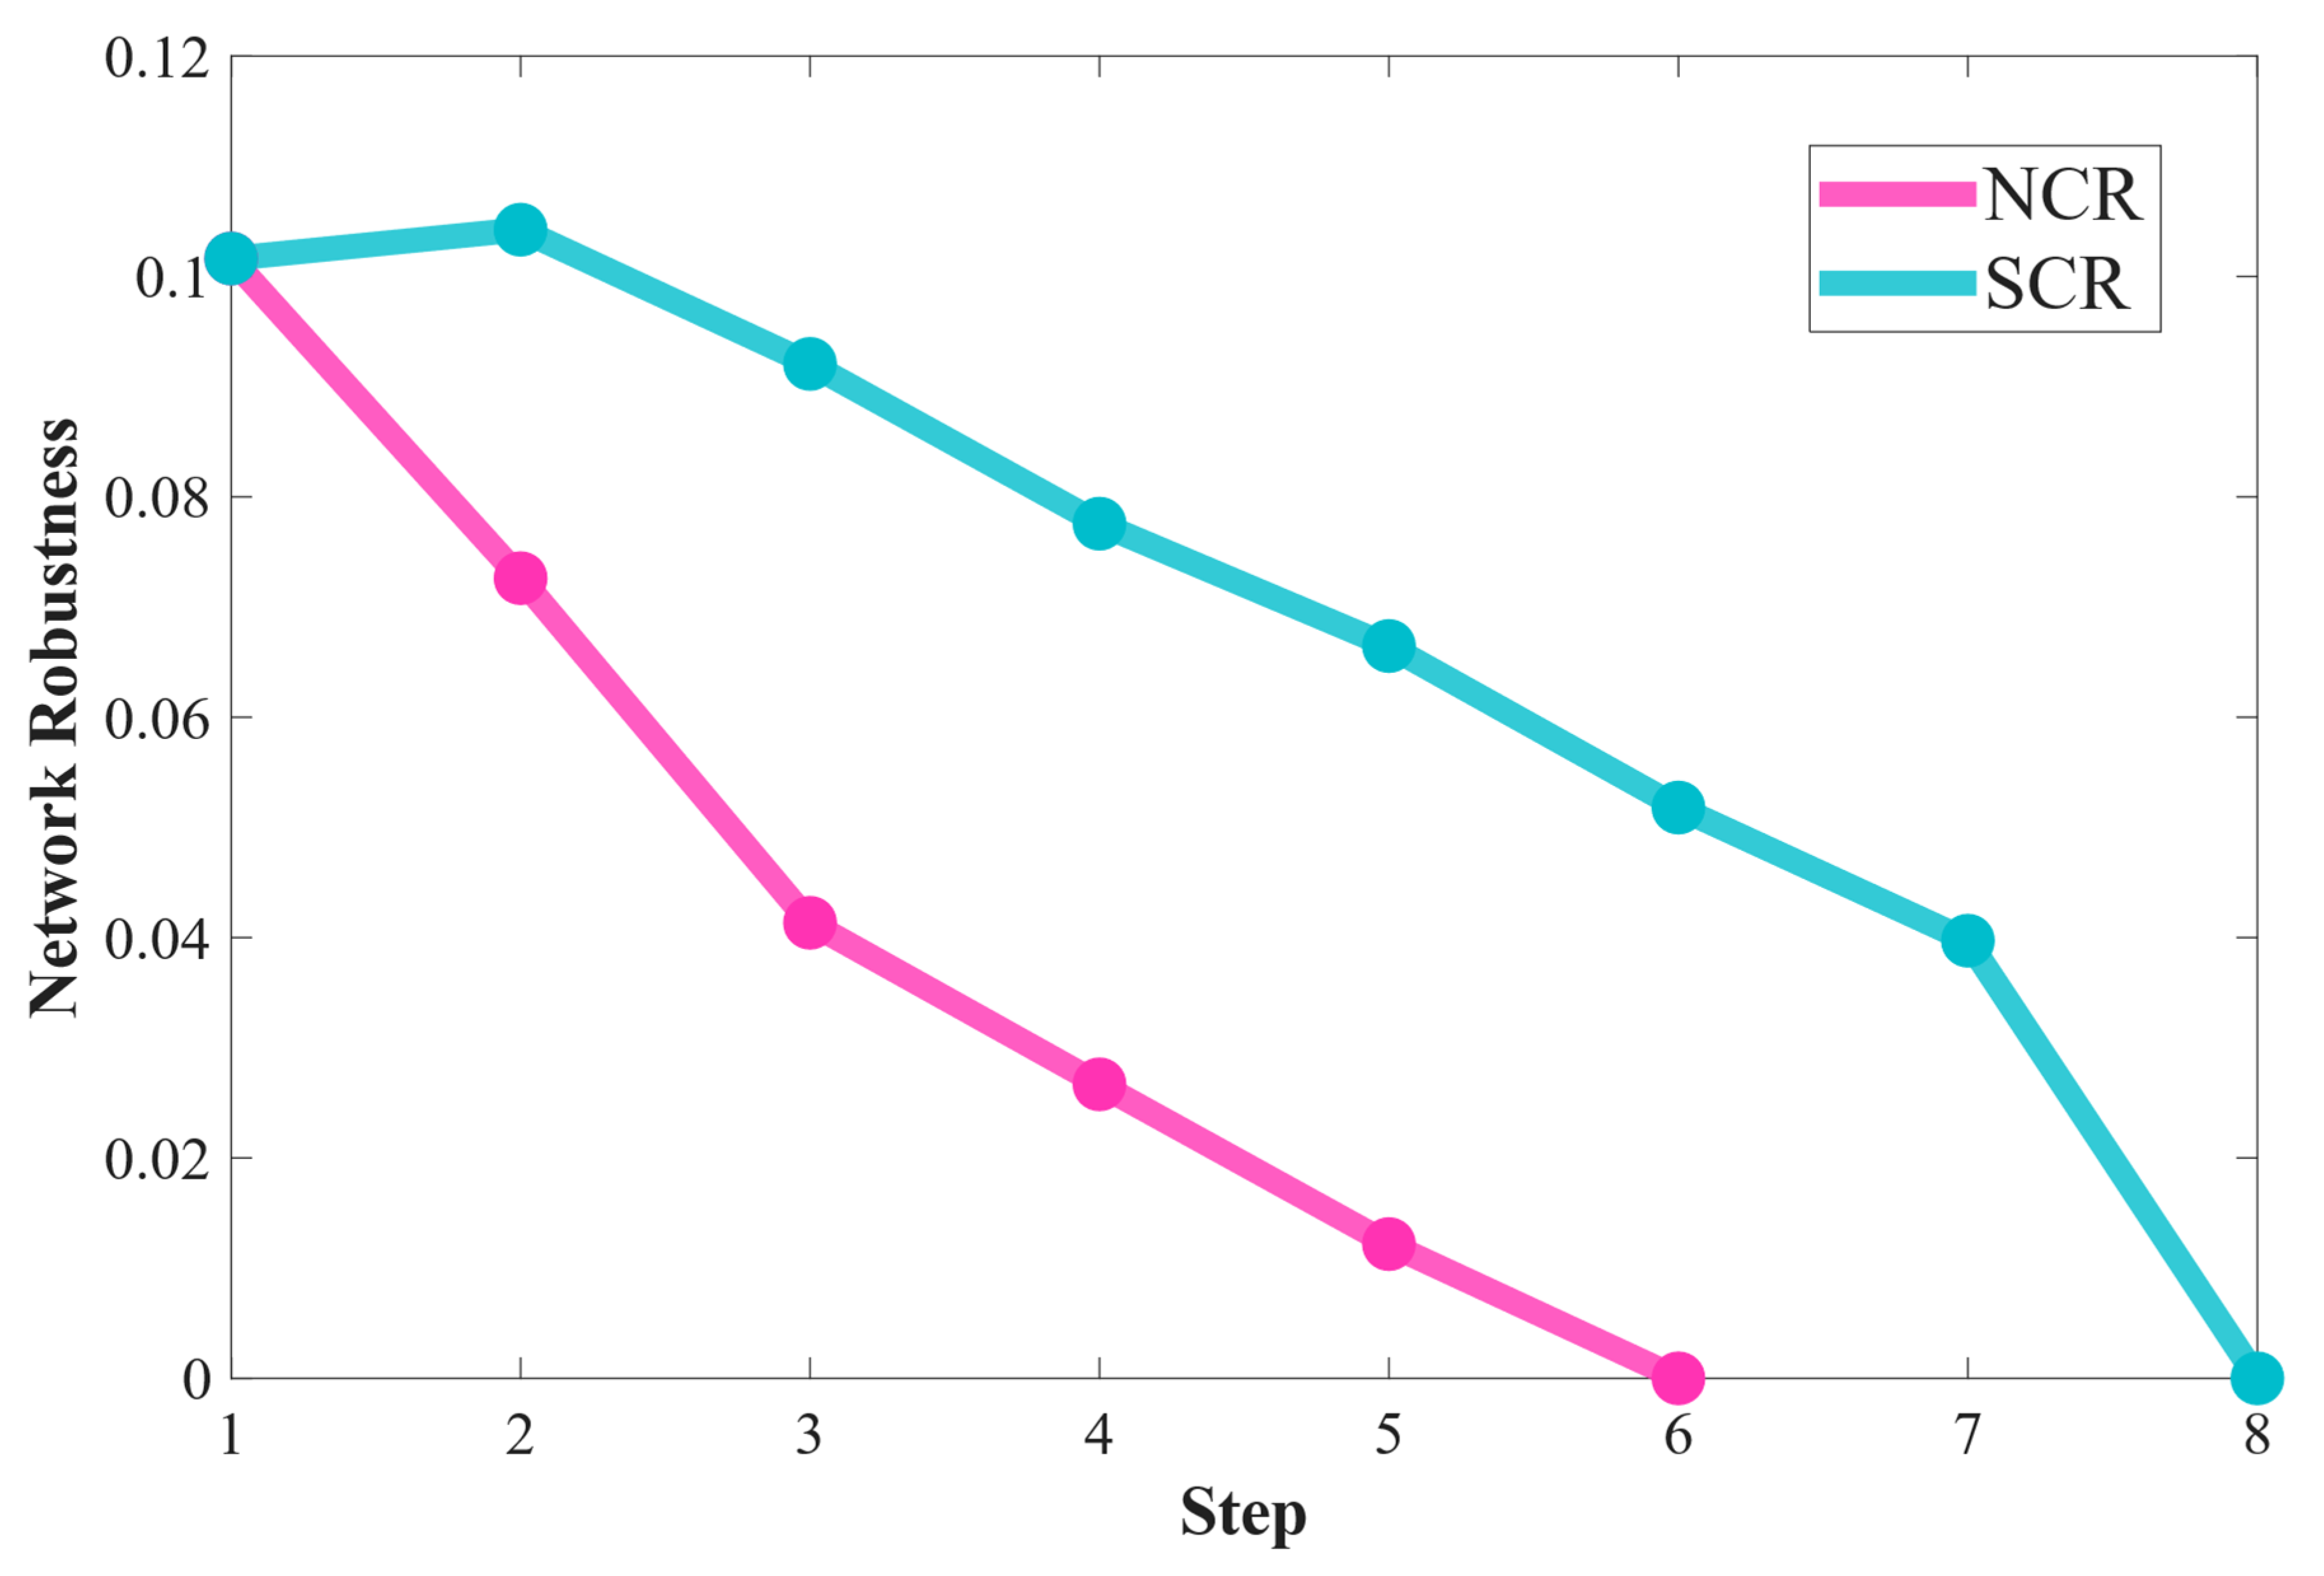
It can be observed from Table 4 that SCR achieves network conflict resolution after all steps are completed. However, SCR clearly shows the following significant disadvantages: (1) SCR involves more resolution steps compared with NCR; (2) the velocity variations caused by the maneuver recommendations reveals that SCR incurs a higher cost to achieve conflict resolution; and (3) not only are more UAVs selected to execute the maneuver recommendations, but the serial numbers also no longer match those identified by NCR, which collectively lead to a significantly slower disintegration speed of the conflict network, as illustrated in Figure 10.

3.5.2. Random Recommendation-Based Multi-UAV Conflict Resolution (RCR) Method

The following presents the resolution results obtained by the third method. Consistent with NCR, this method first prioritizes all UAVs based on key nodes to determine the order for generating conflict resolution recommendations and executing maneuvers. However, instead of searching for the optimal solution via PSO, a feasible solution is selected in a manner analogous to random traversal. That is, after verifying that a certain random solution can reduce the conflict urgency, it is directly adopted as the final solution without further iterative search for solutions with smaller deviations or higher efficiency. For ease of description, this method is referred to as the Random Recommendation-Based Multi-UAV Conflict Resolution (RCR) method. Evidently, due to the adoption of more reasonable priority rules, the conflict resolution success rate of RCR is higher than SCR, and the total number of UAVs performing maneuvers is also lower. However, the conflict resolution recommendations obtained by RCR exhibit greater uncertainty. In particular, RCR is highly likely to increase the total velocity variation in most scenarios compared with NCR, requiring UAVs to bear a larger trajectory deviation cost to achieve conflict resolution.
RCR is implemented for the same scenario. After determining the key node, a feasible solution is randomly generated for this node. It should be noted that the feasibility criterion for a solution here is as follows: after the UAV corresponding to the key node executes the maneuver, its key ranking in the conflict network decreases. Specifically, it is sufficient that this node is no longer the one with the highest conflict urgency ranking in the network. The random recommendations generated during this process still comply with the velocity variation constraints proposed earlier.
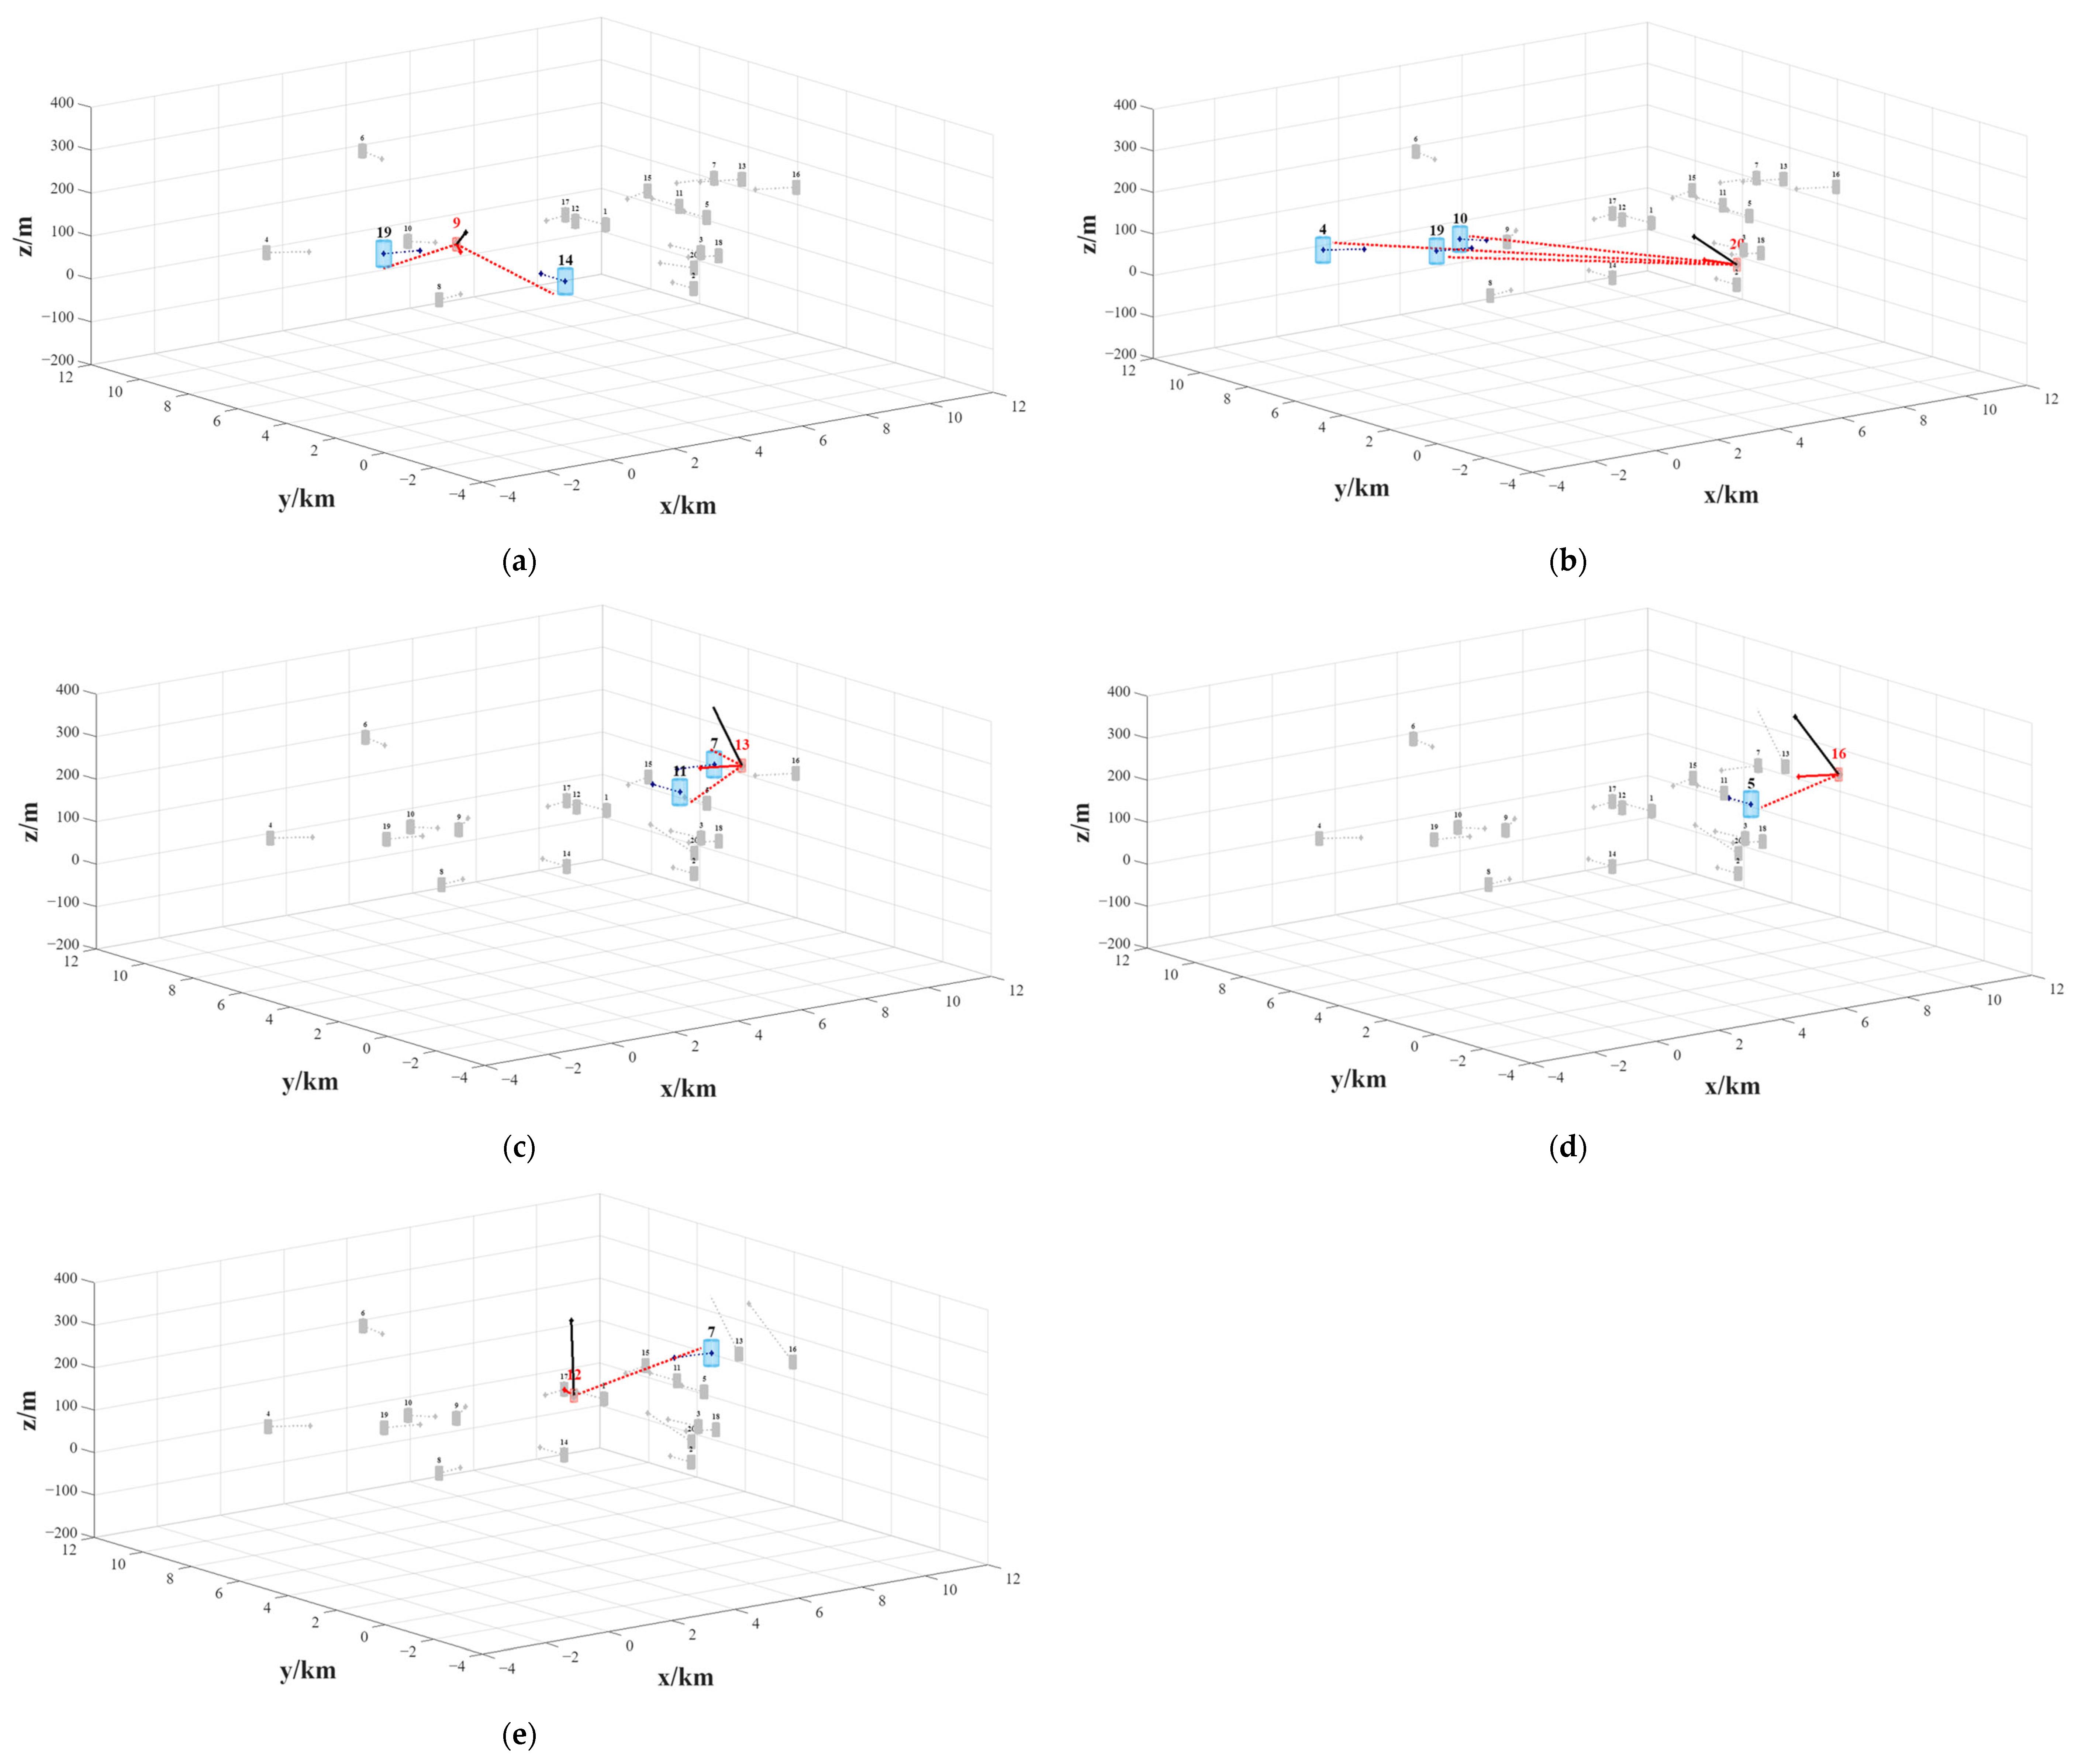
The conflict resolution recommendations of RCR are illustrated in Figure 11, where the colors and line styles of the subplots are consistent with those in Figure 6 and Figure 9. It can be clearly observed that in the subplots of Figure 11, the black lines representing the new velocity exhibit very large variations. Since RCR searches for feasible recommendations in a random manner, it can even alter the velocity with the maximum aviation as long as the conflict network robustness is decreasing. Therefore, although conflicts are ultimately resolved, it comes at the cost of a large velocity variation and significant trajectory deviation.
The maneuver recommendations and resolution results are shown in Table 5.
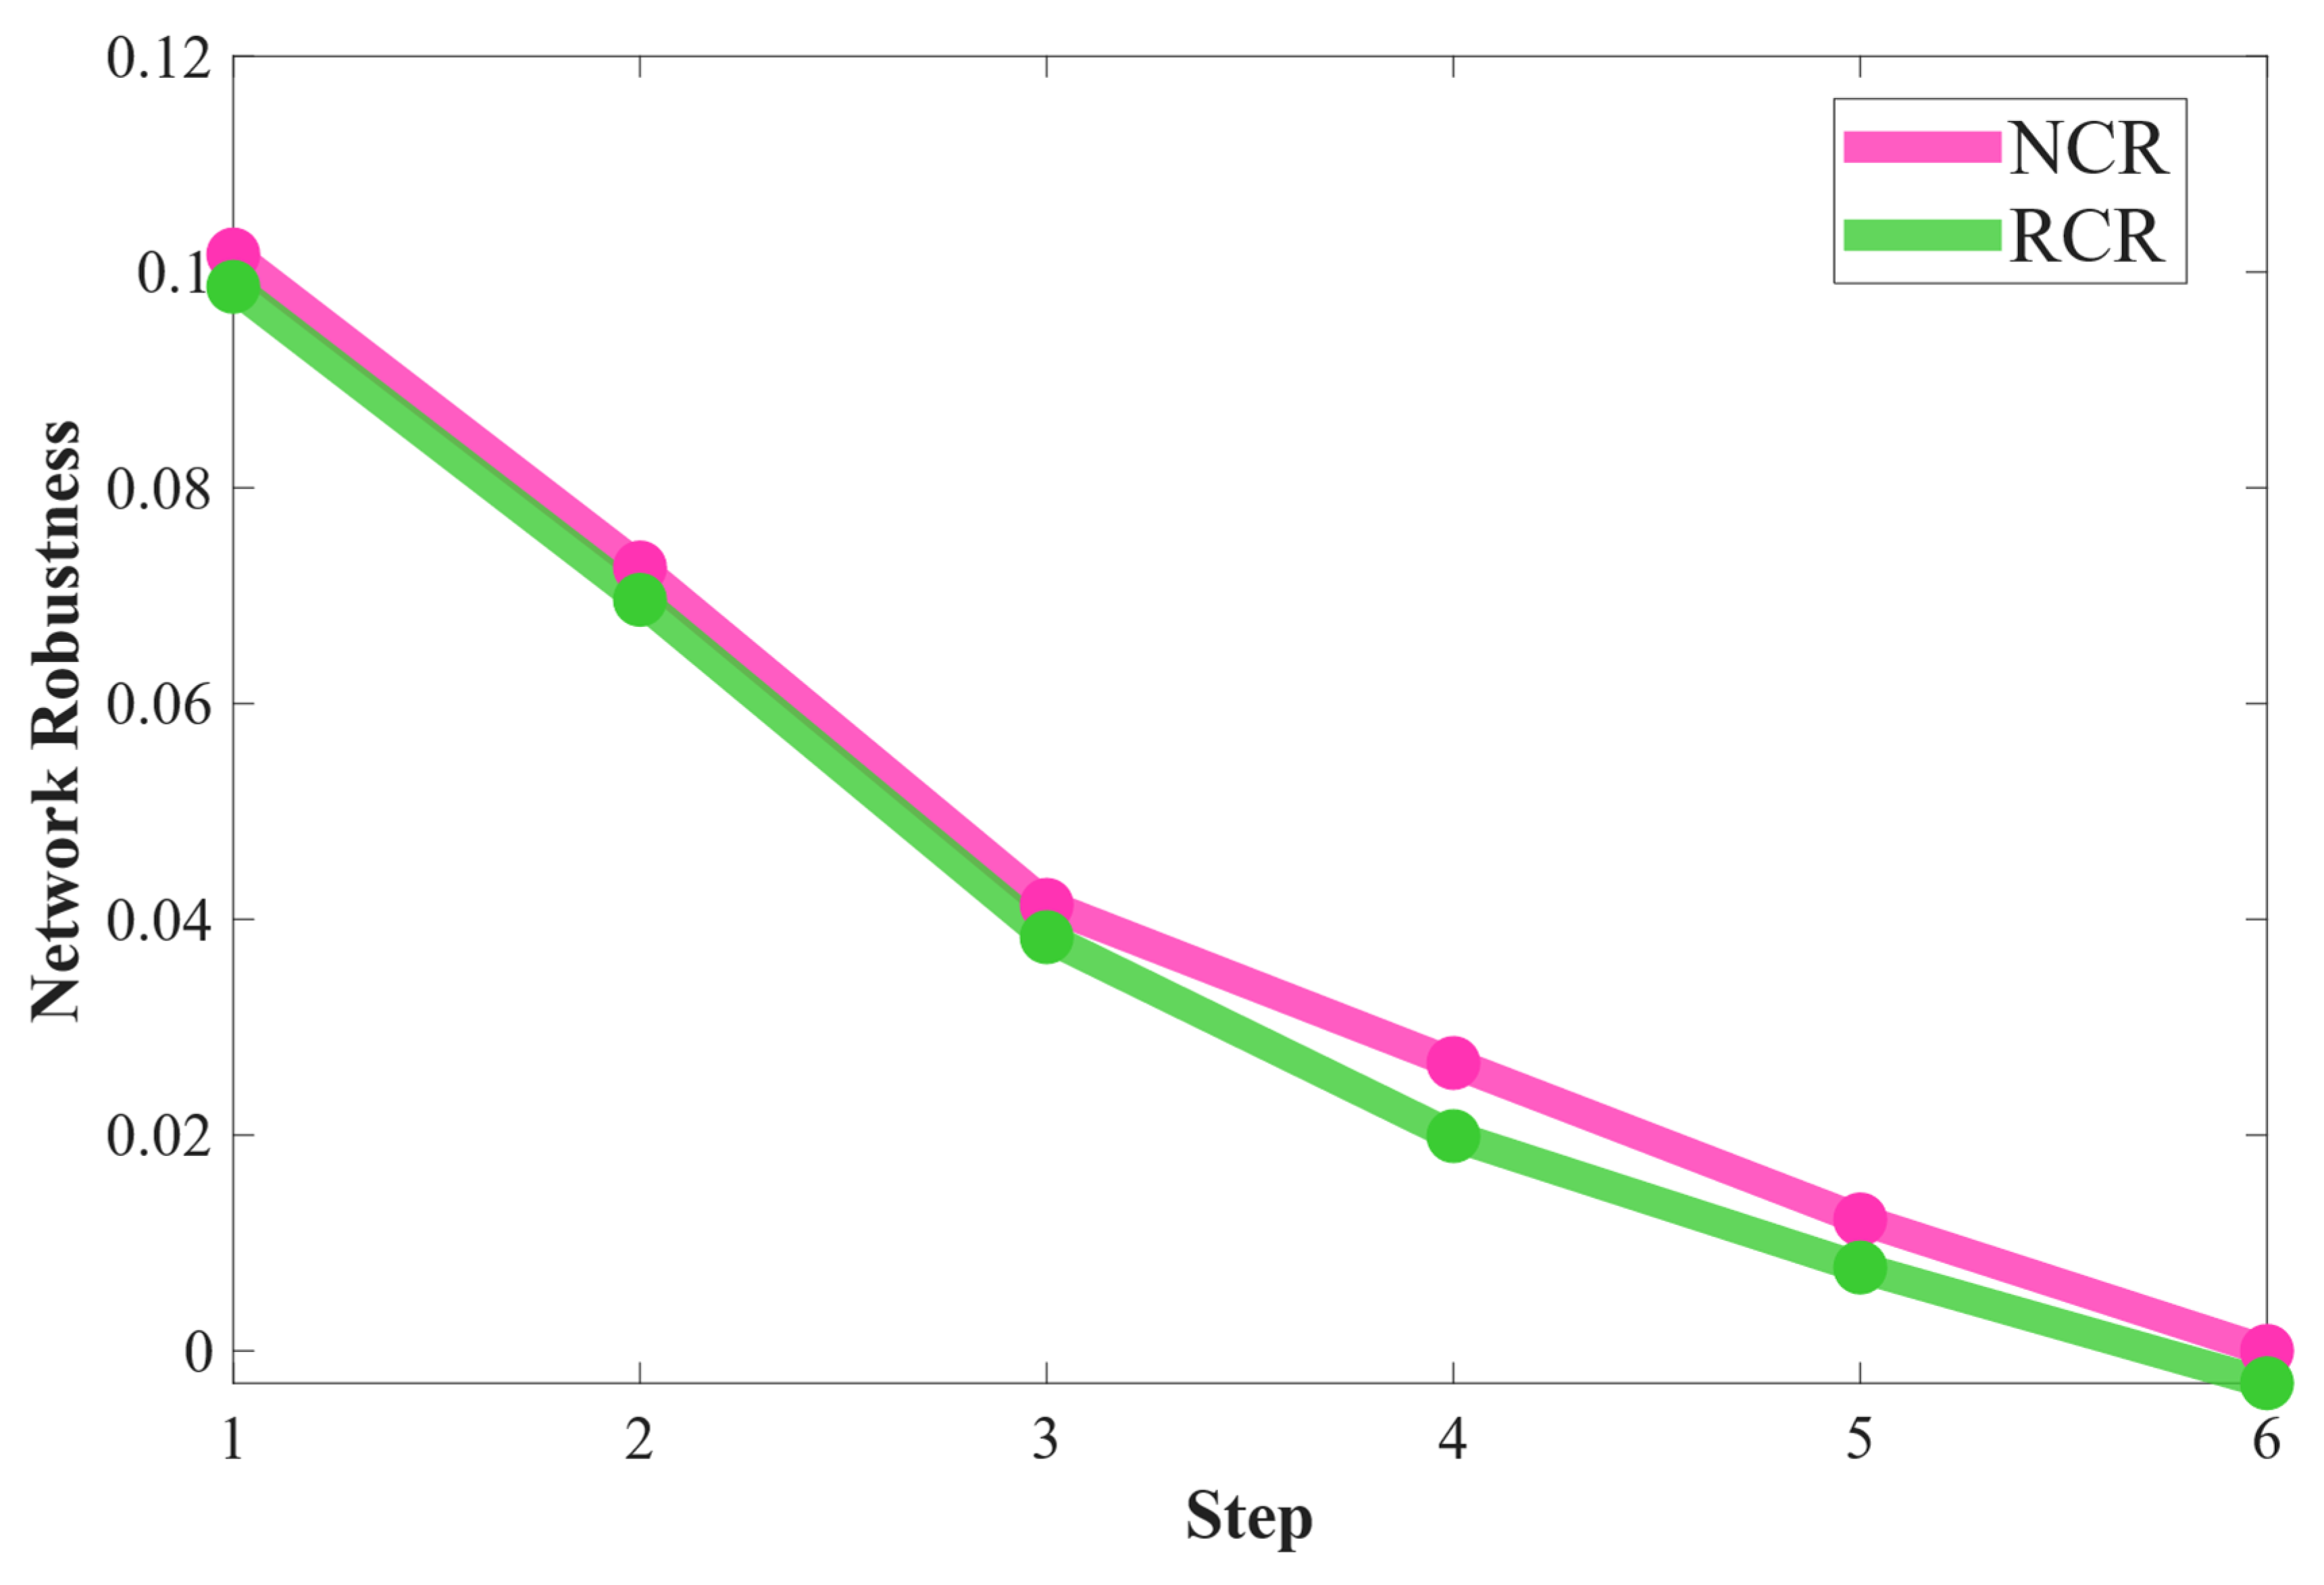
By setting reasonable priority rules for RCR, the number of UAVs executing maneuvers is consistent with that obtained by NCR. However, since the recommendation of RCR is generated randomly, the key UAV selected in the subsequent process is different from NCR, as reflected in Figure 12. It can be observed that at step 3, the conflict network robustness of RCR decreases even faster than NCR, because a different key UAV is chosen at this moment. Nevertheless, since all maneuvers are assumed to be executed simultaneously, the network collapse speeds of the two methods with the same number of maneuvering UAVs are actually identical.
It can be observed that although RCR can achieve conflict resolution, the velocity variation cost is considerable due to the lack of an optimization algorithm to solve the optimal maneuver recommendation.
The selection of the scenario involves a certain degree of contingency. In fact, the flight conflicts in this particular scenario are relatively simple, allowing conflicting UAVs to achieve conflict resolution with only minor maneuvers. However, if the number of UAVs were larger and conflicts more complex, the UAVs selected by RCR to execute maneuver recommendations would likely not match those identified by NCR. In scenarios with increased complexity, the execution of each step may potentially trigger new conflicts or other chain reactions, further worsening the conflict situation. As a result, the selection of key nodes may change, and the overall tendency would be toward lower efficiency.

3.5.3. Results of Comparative Experiments in Random Scenarios

To further eliminate result deviations caused by scenario contingency, 1000 groups of random scenarios that meet the requirements are generated, and multiple comparative methods are applied separately for conflict resolution. To compare and evaluate the detailed velocity variation performance among NCR, SCR, and RCR, the fitness function Q proposed earlier is uniformly adopted to assess the solution quality, with the weight coefficients unchanged. This ensures consistency in the comparison and intuitively reflects the effectiveness of different methods for solving the same problem.
The statistical characteristics of flight conflicts in these 1000 random scenarios are obtained as follows: (1) the average number of UAVs involved in conflicts in each scenario was 10.41; (2) the average number of edges in the conflict network was 5.93. The random scenarios generated in this study are intended to emulate unstructured point-to-point free-flight operations in future low-altitude airspace, where multiple fixed-wing UAVs navigate along independent missions without predefined route constraints. Under such conditions, UAV trajectories exhibit stochastic intersections and multidirectional convergence. The statistical feature of an average of 5.93 conflict edges per scenario realistically captures the underlying frictional dynamics typical of medium-density airspace in this operational paradigm, characterized by frequent but low-intensity pairwise interactions.
To establish a macroscopic baseline for systemic stability, the proposed NCR is first compared with the traditional artificial potential field (APF) method. The APF method is widely used in robot path planning and UAV collision avoidance due to its low computational cost and fast calculation ability [31]. As summarized in Table 6, while both methods achieve a 100% safety rate, APF triggers a significantly higher Average Systemic Response Rate. This indicates that the reactive mechanism lacks global coordination, often propagating local maneuvers into global chain reactions. In contrast, NCR minimizes unnecessary disruptions through precise node-level intervention.
However, under the premise of guaranteeing absolute safety, the two methods exhibit fundamental differences in airspace system stability. APF relies on localized repulsive forces, which easily propagate local conflict avoidance actions into global strongly coupled oscillations, resulting in an exceptionally high Average Systemic Response Rate (exhibiting a typical “global chain maneuver” characteristic). In contrast, leveraging the global pre-tactical topological evaluation capability of complex networks, NCR effectively decouples non-essential conflict edges through “local node scheduling”. As a result, NCR significantly suppresses the Average Systemic Response Rate, maximizing the preservation of original flight intents across the network while resolving high-density convergence crises.
Having demonstrated the inherent superiority of the complex network framework over reactive methods in terms of system stability, the subsequent analysis focuses on the optimization efficiency within the network-driven paradigm. Therefore, APF is excluded from the subsequent cost-sensitive evaluations, as its reactive nature does not align with the optimization objective of the proposed fitness function. In this stage, the average number of maneuvering UAVs is employed as a direct metric to quantify the specific cost of resolution, alongside detailed velocity and trajectory deviation variables. The three methods (NCR, SCR, and RCR) were separately adopted for conflict resolution, and the statistical analysis of the generated resolution solutions is conducted as follows:
  • Average number of maneuvering UAVs m a . m previously denoted the number of resolution steps, which in the vast majority of cases equals the number of UAVs performing maneuvers during the resolution process. Here, m a is used to represent the average number of UAVs required to execute conflict resolution maneuvers per scenario:
    m a = n = 1 1000 m n 1000
    where p is the scenario number, and m n ( n = 1 , 2 , 3 ) represents the number of UAVs implementing maneuver recommendations in each scenario.
  • Average velocity variation  d V a . d V a is calculated as the average value of the velocity variations d V n ( n = 1 ,   2 ,   3 ) induced by the maneuver recommendations in each scenario:
    d V a = n = 1 1000 d V n 1000
    where d v a consists of three components, with d t a representing the horizontal deviation angle change, d p a the vertical deviation angle change, and d v a the speed magnitude variation. Similarly, d V n ( d t n , d p n , d v n ) .
  • Average evaluation index value  F a . The evaluation index value Q n ( n = 1 ,   2 ,   3 ) of the maneuver recommendation for each scenario is calculated via the fitness function presented in Equation (11), and F a is the average value of all Q n :
    F a = n = 1 1000 Q n 1000
    where Q n is obtained by normalizing the three velocity variation components of d V n .
The statistical results are shown in Table 7.
In Table 7, it can be observed that the maneuver recommendations generated by NCR are globally optimal. As expected, SCR without priority rules yields a relatively large m a . Although the RCR achieves a relatively favorable performance in terms of m a , it results in an extremely high velocity variation, which far exceeds that of the other two methods, due to the lack of an optimization algorithm for solving maneuver recommendations. Notably, the solutions generated by SCR merely achieve a relatively optimal performance in terms of the velocity variation cost compared with RCR. This phenomenon essentially demonstrates the significant role of the optimization algorithm in the solution generation process.
The statistical analyses provided in Table 7 are all derived from the direct average calculation for each scenario. The flight conflict characteristics differ among various scenarios in practice. In low-complexity flight conflict scenarios, the resolution recommendations generated by the three methods exhibit no significant discrepancies. Meanwhile, with the increase in the complexity and conflict urgency, more pronounced disparities are expected in the resolution recommendations. To explore this phenomenon, the velocity variation and evaluation index values are recalculated via the following formulas:
ρ n = R m m n
S n = d V n ρ n
where ρ n denotes the conflict resolution efficiency. For the scenario numbered n , R n is the robustness of the conflict network, and the conflict resolution for this scenario is achieved by maneuvering m n UAVs. The value derived by dividing the total velocity variation by the unit conflict resolution efficiency denotes the velocity change cost required to achieve the conflict resolution per unit step, which is defined as the comprehensive cost–step index S n ( S t n , S p n , S v n ) . Each scenario corresponds to a specific S n . Unless otherwise specified, S ( S t , S p , S v ) is used hereinafter to represent the combined sample across all scenarios. In summary, a smaller value of this index indicates a lower velocity change cost and fewer required steps for scenarios with an equivalent degree of flight conflict, which means the corresponding method has a higher resolution efficiency. S integrates the velocity variation cost and the number of resolution steps while normalizing the conflict characteristics of each scenario, thus enabling the comparison of conflict resolution efficiency across different scenarios.
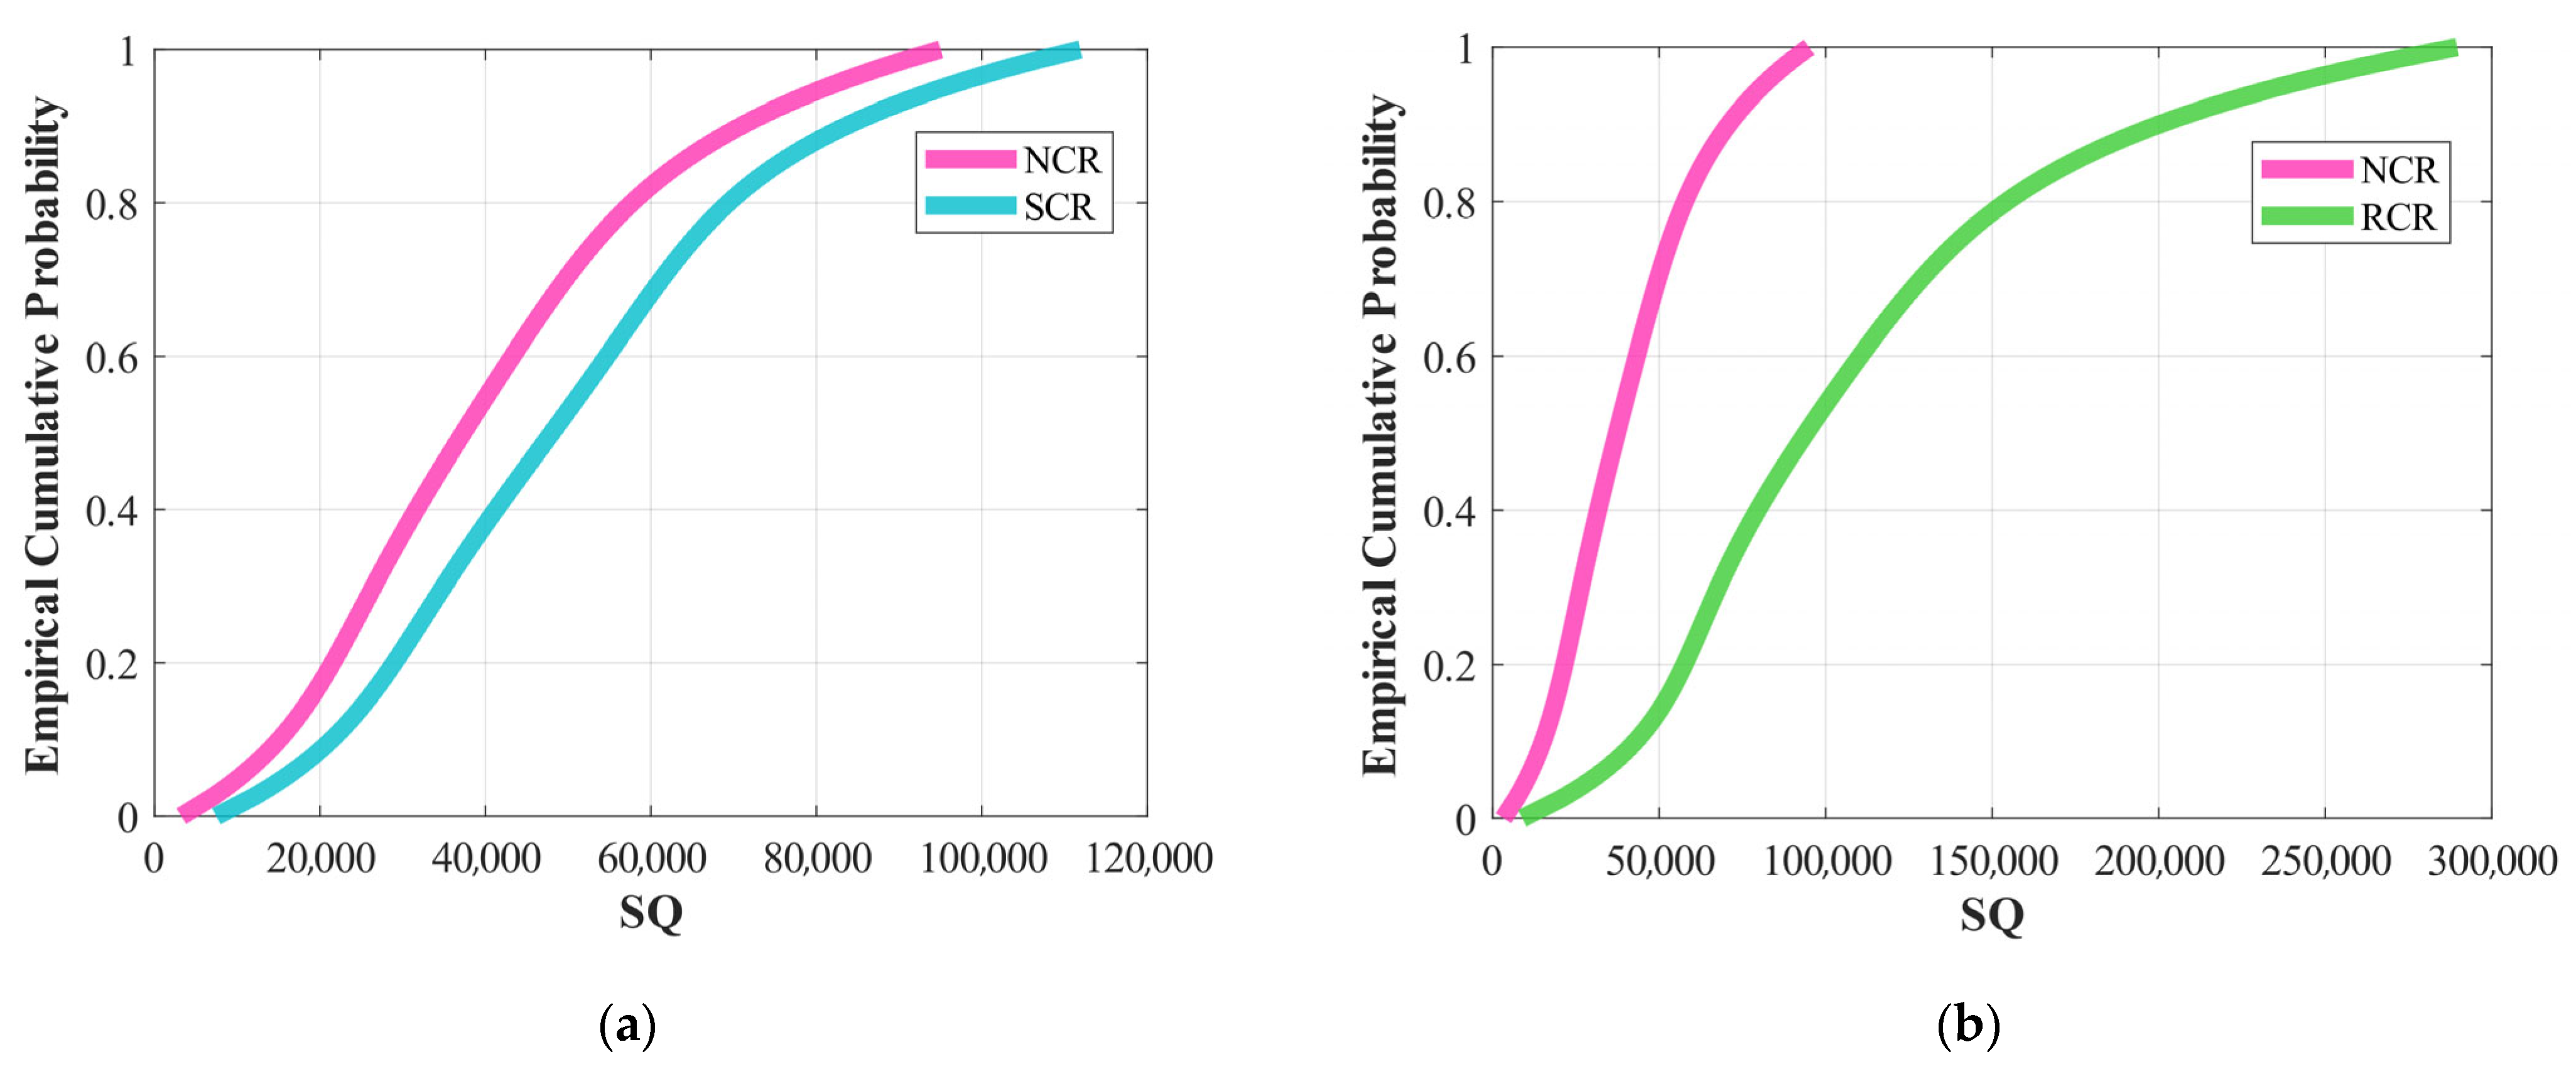
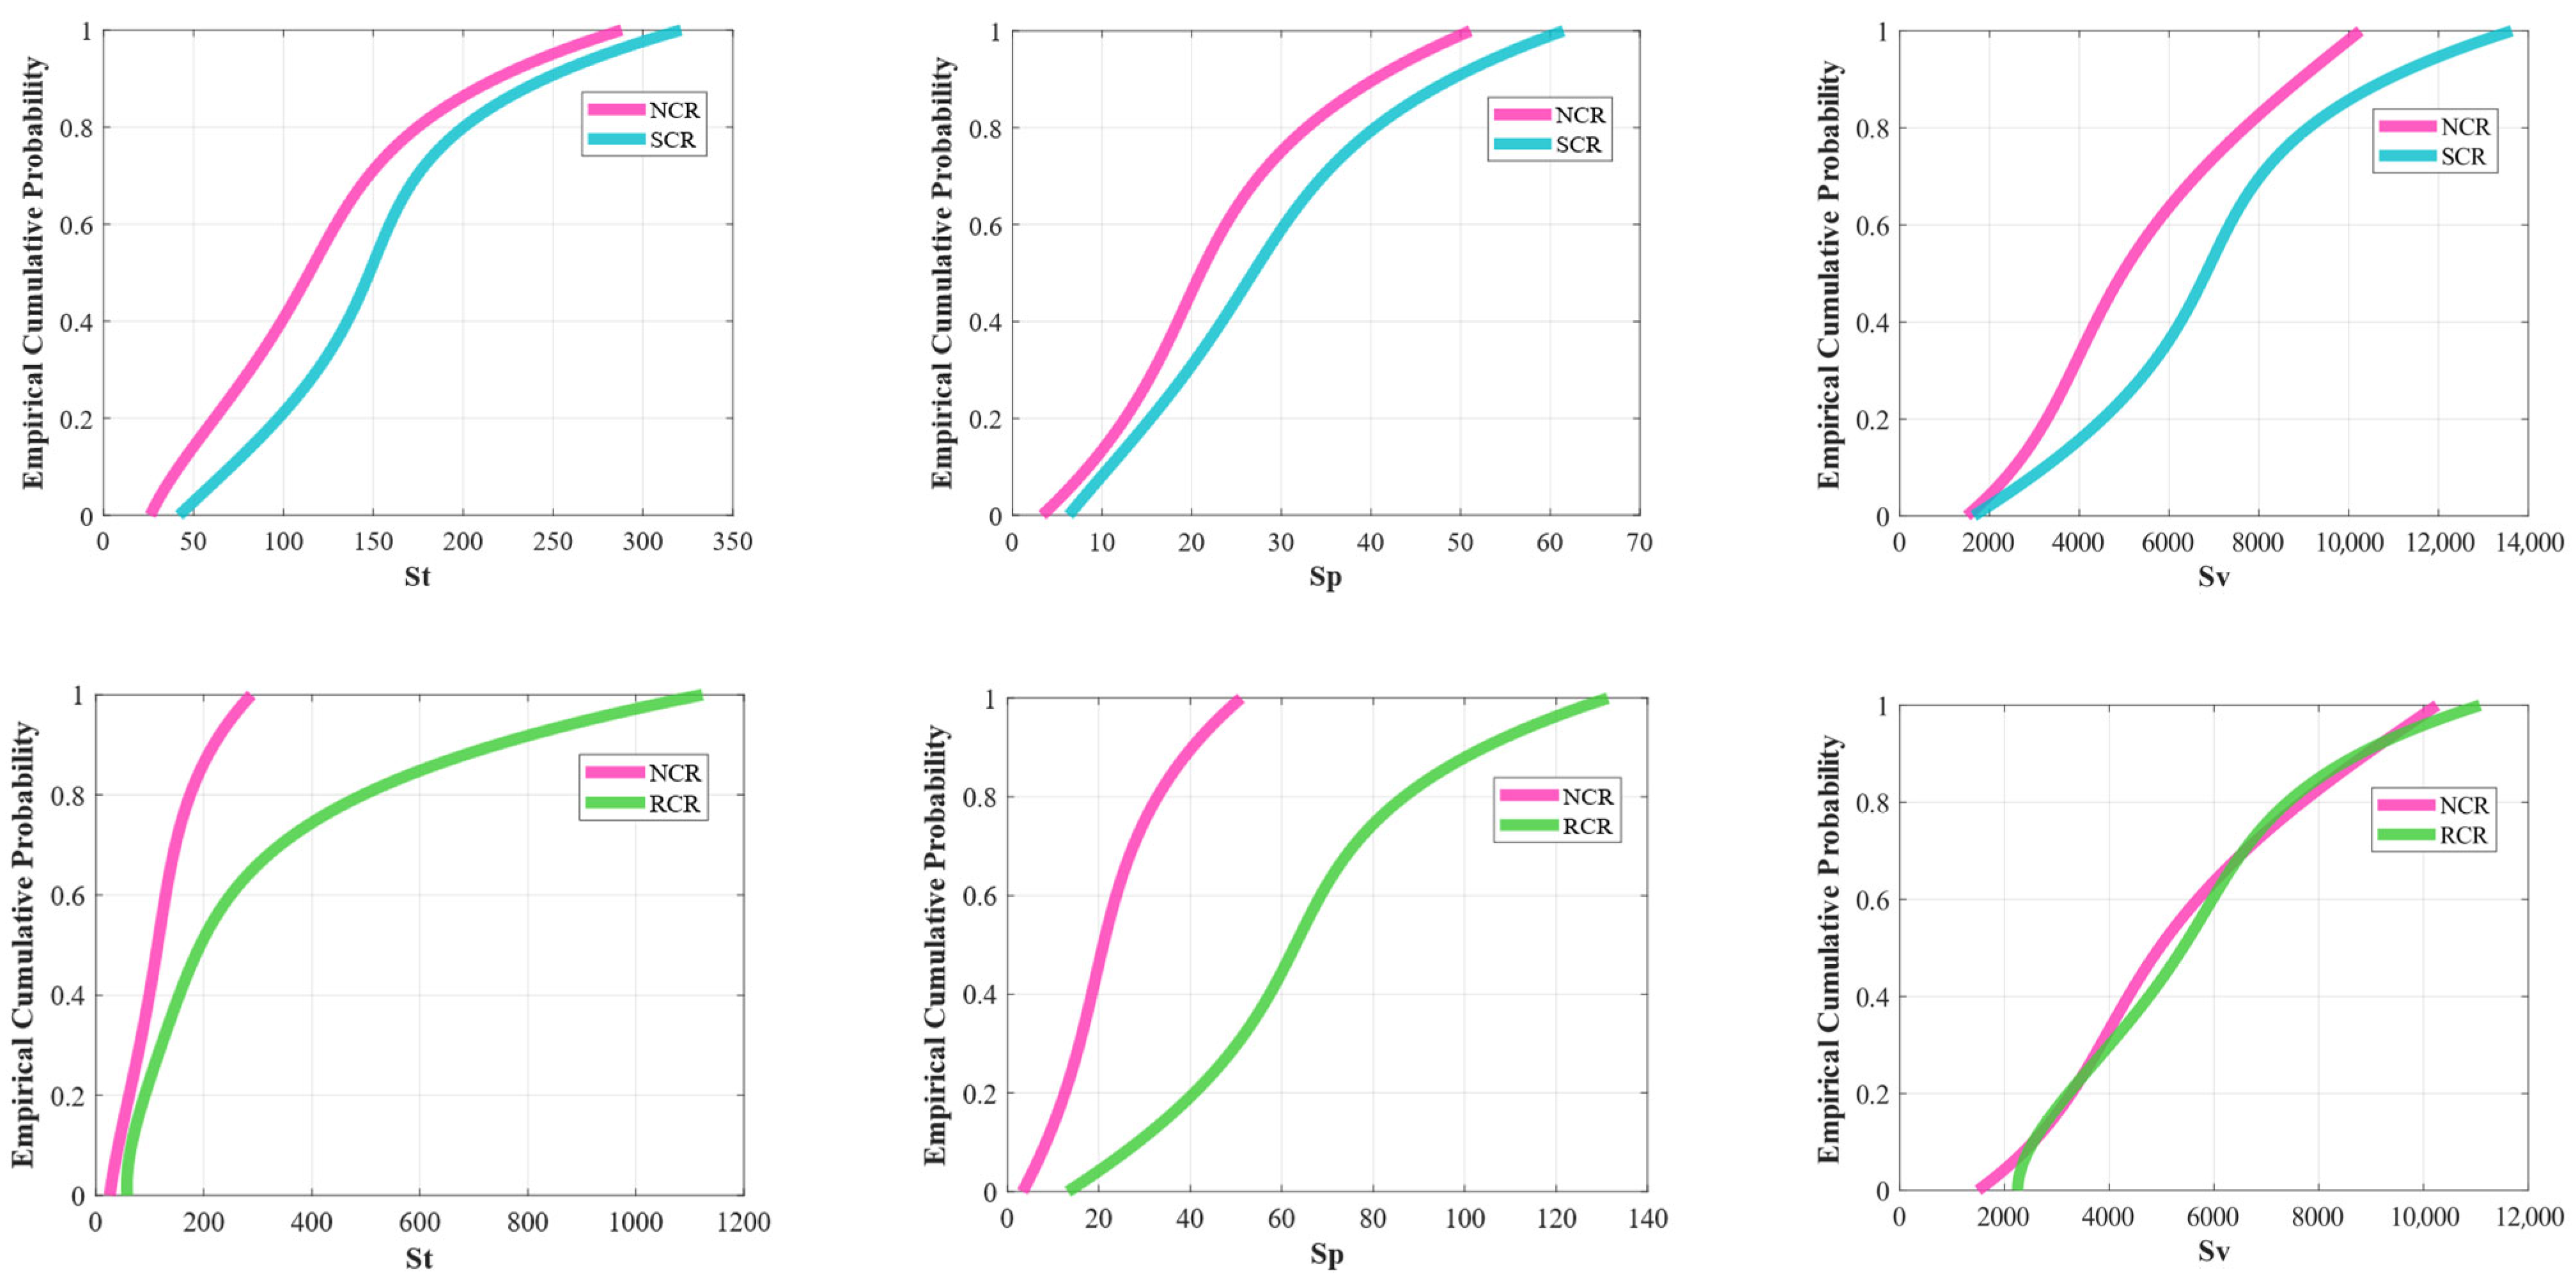
The empirical cumulative distribution function (ECDF) of S is presented in Figure 13, where the horizontal axis and the vertical axis representing the value of S and the empirical cumulative distribution probability of S . An increase in S on the horizontal axis indicates a gradual decrease in the resolution efficiency of the corresponding scenario, further indicating a continuous increase in the flight conflict complexity. For these complex scenarios with low resolution efficiency, a higher cost is required to achieve conflict resolution, such as more computational steps, a greater velocity variation cost, or a larger number of maneuvering UAVs.
In Figure 13, the red curve denotes the ECDF of NCR, in comparison with the blue curve for SCR and the green curve for RCR. It can be observed that the ECDF curve of SCR lies consistently to the right of the NCR curve, which means that at the same empirical cumulative distribution position, S of SCR is always larger, which indicates that its overall conflict resolution efficiency is lower than NCR. This trend is even more evident in subfigures for the RCR. Except for the speed magnitude component, the other two components clearly demonstrate that the efficiency of the RCR is lower than that of the NCR. Furthermore, it can be seen from the figures that as S increases, the gap between the red curve and the green curve widens incrementally, and the green curve can even be observed to lie to the right of the blue SCR. This indicates that when addressing more complex flight conflict scenarios, the cost disadvantage of the RCR—particularly in terms of the two velocity angle components—becomes more significant.
Considering the curve entanglement phenomenon observed in Figure 13, the fitness function Q is re-adopted herein to normalize the three velocity components, yielding the integrated index S Q . The ECDF curves of S Q are presented in Figure 14.
Evidently, Figure 14 exhibits a similar trend to Figure 13, further corroborating that NCR outperforms the other two methods significantly in terms of conflict resolution efficiency. Furthermore, in Figure 14b, the tail section of the green curve exhibits a significant rightward shift, resulting in a performance of RCR that is comparable to SCR: when addressing complex conflict resolution problems, RCR is particularly inefficient, and its efficiency deficiency is further exacerbated as the inherent complexity of the flight conflict scenario increases.
In summary, NCR exhibits superior performance in addressing multi-UAV conflict resolution problems compared with SCR and RCR.

3.5.4. Analysis of a Complex Scenario with 20 UAVs

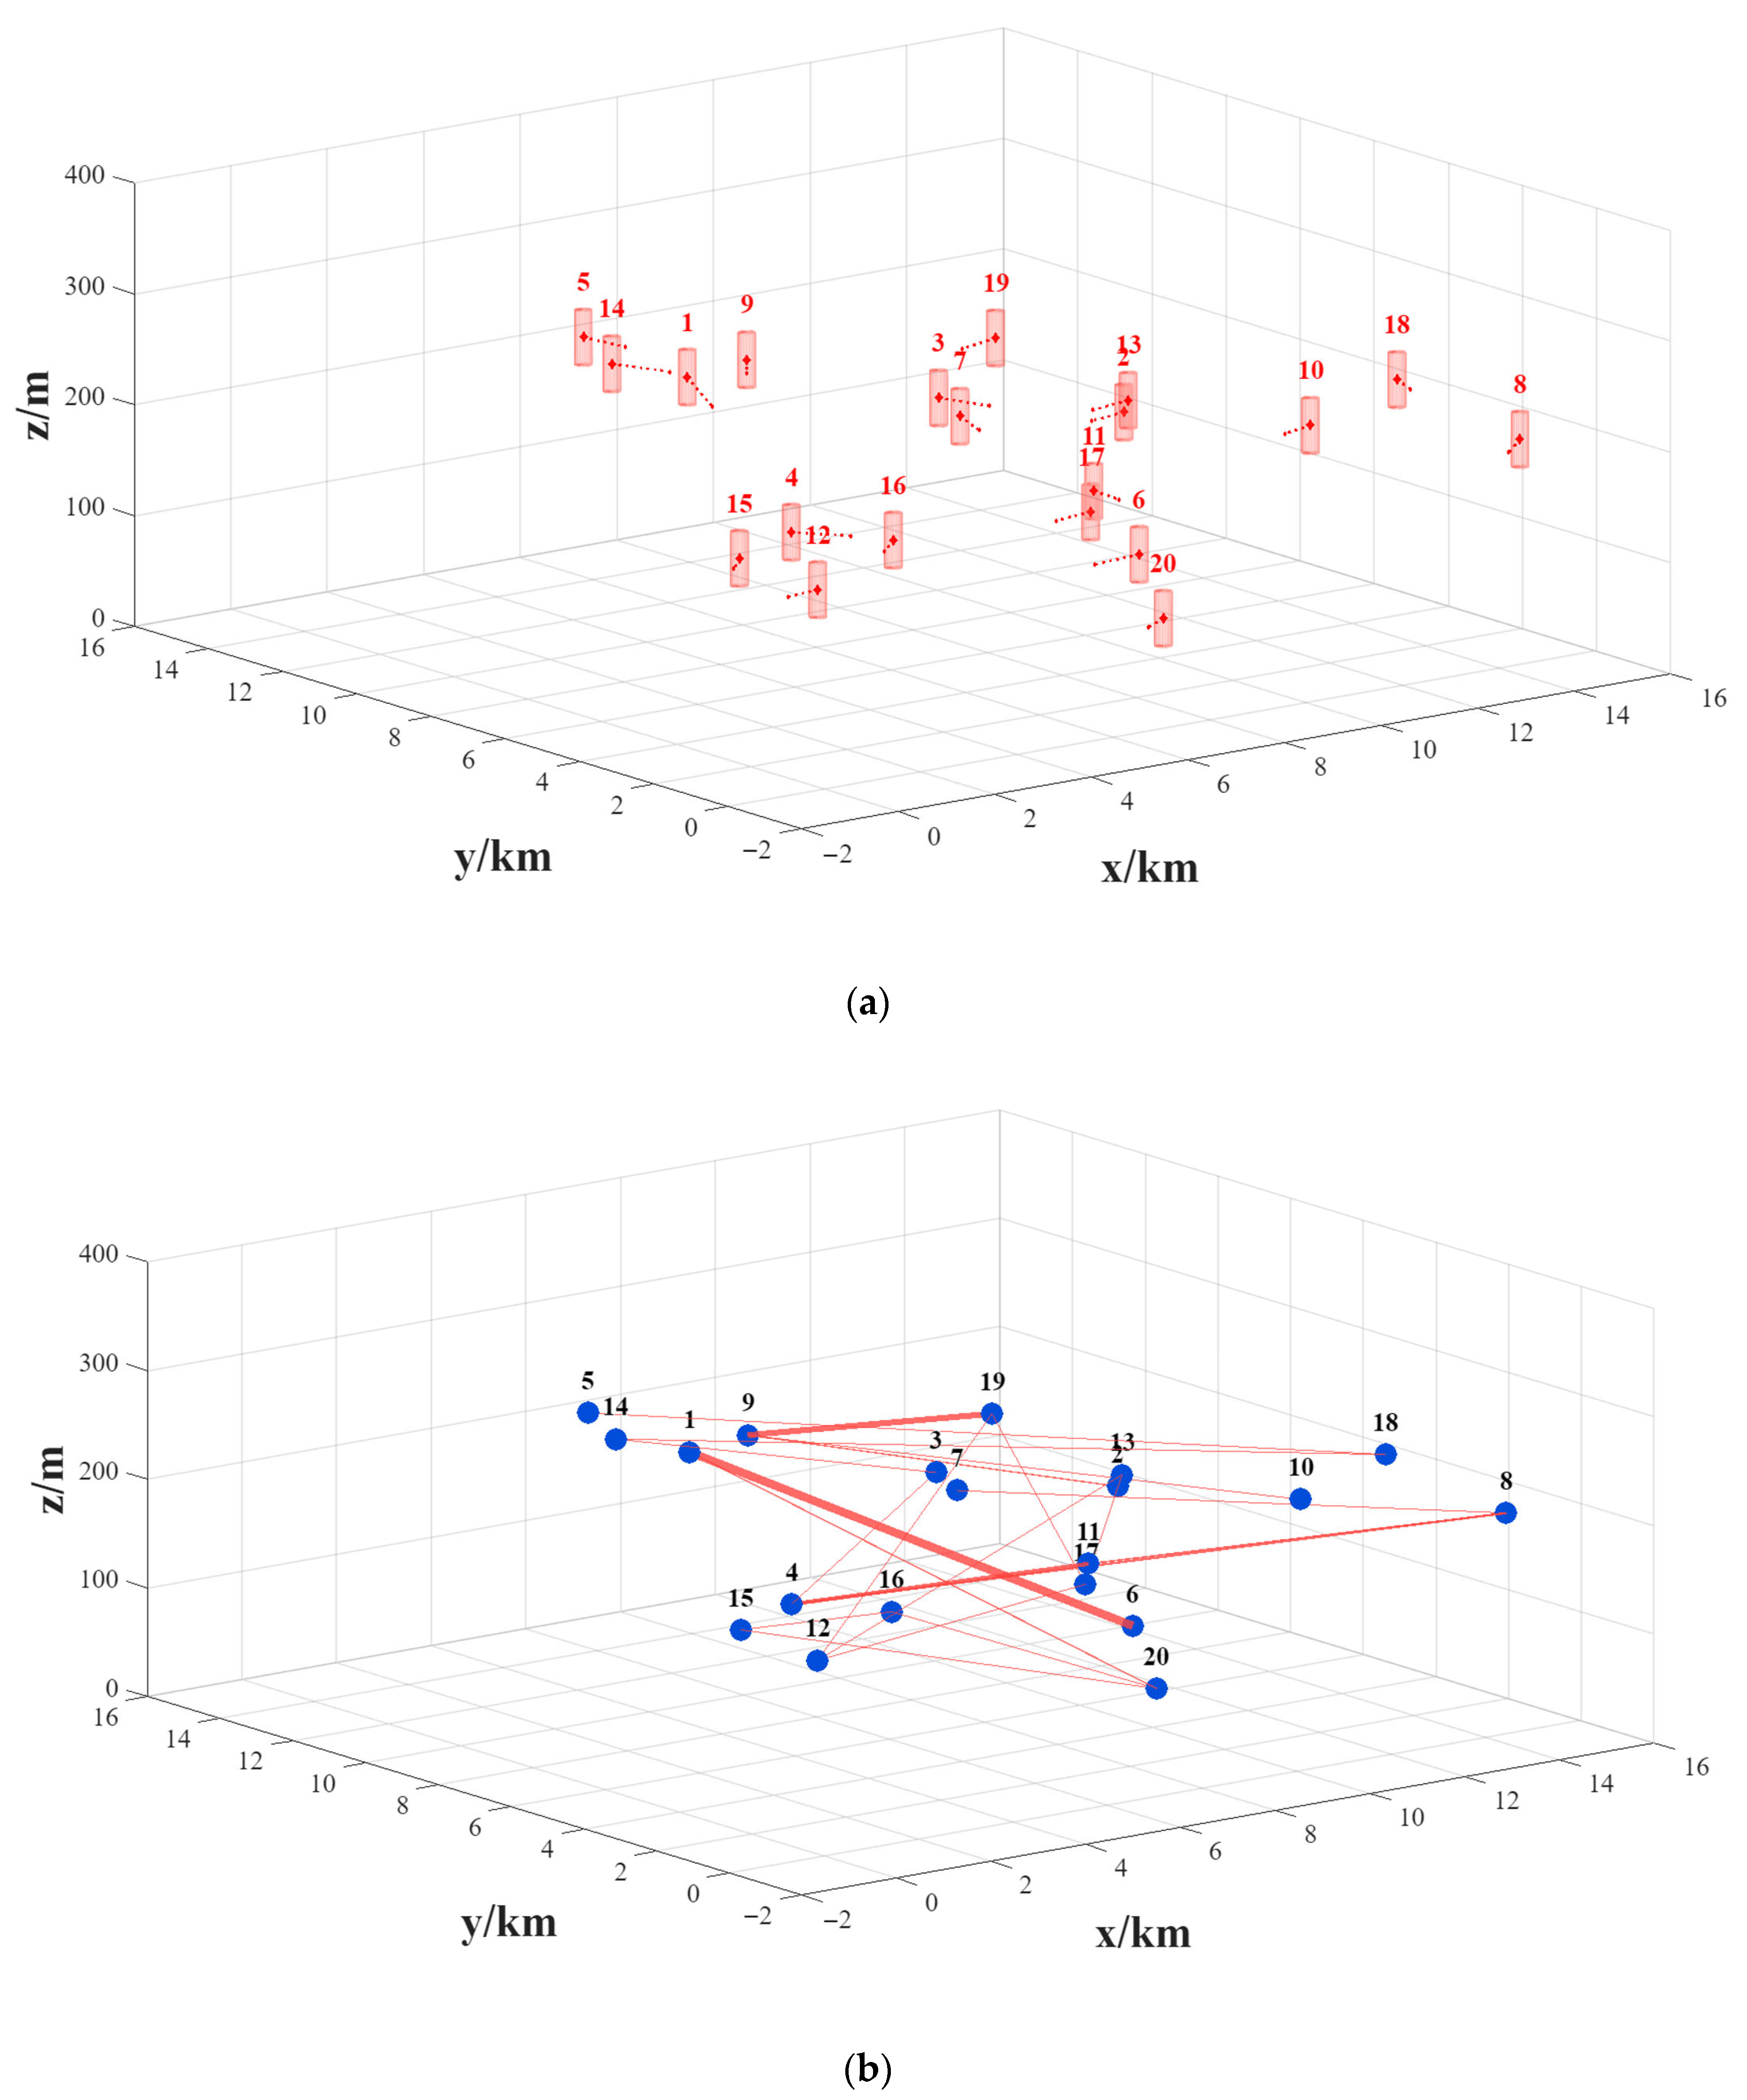
While the system-level statistical simulation evaluates overall performance, a scenario-specific analysis is necessary to illustrate the algorithms’ behavior under extreme bottleneck conditions. Therefore, a high-density convergence scenario involving 20 UAVs is selected for detailed profiling. As shown in Figure 15, this scenario generates a highly coupled initial conflict network with exactly 11 intersection edges. Consistent with the visual representations defined in Figure 5, all 20 UAVs are depicted as red cylinders, indicating that every single aircraft is inherently involved in the conflict network. The complete absence of blue cylinders (conflict-free UAVs) represents an extremely dense and fully coupled airspace bottleneck. The scenario presented in this section is designed to represent a high-density, complex interaction event that could arise in future unstructured airspace operations. Such a scenario might occur when multiple UAVs converge near a waypoint intersection, when a cluster of vehicles simultaneously adjusts headings due to environmental factors, or when several mission routes happen to intersect within a confined spatial–temporal window. The dense conflict network topology serves as a stress test for evaluating the algorithm’s capability to handle severe conflict situations that, while less frequent than the average cases captured in the 1000-scenario study, represent the critical edge conditions that any robust conflict resolution method must be able to address.
To evaluate the specific resolution costs, the detailed maneuver outputs of both NCR and the traditional APF baseline are summarized in Table 8. It is critical to note that the data for NCR and APF differ not only in magnitude but also in their fundamental physical properties. The NCR approach outputs one-time, discrete scheduled commands, meaning the UAVs only need to execute a single, precise adjustment to resolve the conflicts. Conversely, the APF baseline relies on continuous repulsive forces, which inherently induce ongoing trajectory oscillations. Therefore, the APF columns record the maximum reactive deviations experienced during the entire resolution process. To ensure an equitable comparison, Table 8 focuses exclusively on these final physical maneuver magnitudes, omitting the internal robustness metrics of the network.
The evidence in Table 8 reveals a stark contrast in control efficiency. Driven by the global pre-tactical topological evaluation, NCR explicitly preserves the original flight intents of non-critical aircraft. Specifically, 10 out of the 20 UAVs (50%) are successfully identified as quiet nodes and designated as “Unaltered”, maintaining their nominal trajectories without any intervention. For the maneuvering UAVs, NCR confines the adjustments within minimal boundaries. In sharp contrast, the reactive nature of APF triggers a global cascading effect, forcing all 20 UAVs into continuous and intense state changes to evade secondary conflicts, with certain aircraft experiencing extreme lateral deviations. This extreme scenario firmly establishes that the proposed NCR algorithm possesses the robust capability to efficiently untangle fully coupled, high-density conflicts. By scheduling maneuvers from a global network perspective, it ensures absolute safety while successfully preventing the airspace capacity degradation commonly caused by reactive algorithms.
It should be noted that as the number of conflicting edges increases sharply in extremely high-density scenarios, the computation time of the proposed algorithm increases accordingly. Further optimizing the computational efficiency of the algorithm for large-scale operations will be a key focus of our future research.

4. Conclusions

This paper addresses 3D flight conflict detection and resolution in multi-UAV scenarios, aiming to ensure the safe operation of multiple fixed-wing UAVs in shared airspace. Through model construction, method design, and extensive simulation validations—including both macroscopic statistical analyses and microscopic extreme-scenario profiling—the following conclusions are drawn.
  • The flight conflict network constructed based on complex network theory enables the quantitative description of multi-UAV conflict scenarios and the identification of key nodes. By treating each UAV as a network node and conflict urgency as the edge weight, the defined network and node robustness metrics accurately pinpoint key UAVs, thereby establishing a clear priority for formulating resolution recommendations and addressing the core issue of ambiguous priorities in dense airspace.
  • The proposed NCR method efficiently resolves multi-UAV conflicts through an iterative process of key node identification, optimal maneuver generation, and conflict network updating. The improved fitness function balances the reduction in network robustness with velocity variation costs, ensuring that generated maneuvers comply with fixed-wing UAV maneuverability constraints. Because velocity variations are always calculated relative to the initial state, the method avoids cumulative errors and preserves the practical executability of the recommendations.
  • Extensive simulations and comparative experiments validate the superiority of NCR. Compared with SCR, NCR requires fewer maneuvering UAVs and fewer resolution steps; compared with RCR, it achieves substantially lower velocity variation costs. When benchmarked against the classical APF method, NCR resolves the same conflicts with minimal scheduled maneuvers while preserving the original trajectories of non-critical aircraft, whereas APF induces continuous oscillations across nearly all UAVs. Statistical results from 1000 random scenarios confirm that NCR attains optimal performance in terms of average number of maneuvering UAVs, average velocity variation, and overall evaluation index. Its advantage becomes even more pronounced in highly complex conflict scenarios. Moreover, underlying 6-DOF aerodynamic simulations demonstrate that trajectory tracking deviations caused by physical inertia remain well within the preset safety margins, confirming the physical executability of the generated strategies under realistic aerodynamic constraints.
Despite these promising results, several limitations should be acknowledged. First, the hierarchical simulation architecture relies on an empirical time-window parameter to interface kinematic planning with 6-DOF dynamics; future work may embed simplified dynamic constraints directly into the optimization to improve platform adaptability. Second, the current validation does not account for stochastic disturbances such as wind gusts or navigation errors—developing a probabilistic conflict detection framework and conducting hardware-in-the-loop tests are natural next steps. Third, the flight protection zone dimensions are fixed; adaptive parameter models that reflect different UAV types and operational environments merit further investigation. Finally, the present study remains at the algorithmic development and high-fidelity simulation stage; practical deployment on physical UAV hardware and cross-platform interoperability are left as important subjects for future work.

Author Contributions

Conceptualization, L.Q. and W.P.; methodology, L.Q., W.P. and Q.H.; software, L.Q.; validation, L.Q.; formal analysis, L.Q.; investigation, Y.S.; resources, Y.L.; writing—original draft preparation, L.Q.; writing—review and editing, W.P., Q.H., Y.L.; project administration, L.Q.; funding acquisition, L.Q. All authors have read and agreed to the published version of the manuscript.

Funding

This research was funded by Engineering Technology Research Center for Civil Aviation Flight Technology and Flight Safety of Sichuan Province under Grant (GY2024-37D).

Data Availability Statement

The original contributions presented in this study are included in the article. Further inquiries can be directed to the corresponding author.

Conflicts of Interest

The authors declare no conflicts of interest.

References

  1. Yang, J.; Yin, D.; Niu, Y.; Shen, L. Airspace Conflict Resolution of Unmanned Aerial Vehicles; National Defense Industry Press: Beijing, China, 2023. [Google Scholar]
  2. Jia, Y. A scheme for unmanned aerial system traffic management in low-altitude airspace. Acta Aeronaut. Astronaut. Sin. 2025, 46, 531399. [Google Scholar]
  3. Badea, C.A.; Veytia, A.M.; Vidosavljević, A.; Ellerbroek, J.; Hoekstra, J.; Chen, S.; Conrad, C.; Chen, Y. Reviews and responses for very-low-level U-space conflict detection and resolution: Current developments and future prospects. J. Open Aviat. Sci. 2025, 3, 8179. [Google Scholar] [CrossRef]
  4. Hamissi, A.; Dhraief, A.; Sliman, L. A comprehensive survey on conflict detection and resolution in unmanned aircraft system traffic management. IEEE Trans. Intell. Transp. Syst. 2025, 26, 1395–1418. [Google Scholar] [CrossRef]
  5. D’apolito, F.; Fanta-Jende, P.; Widhalm, V.; Sulzbachner, C. Conflict detection, resolution, and collision avoidance for decentralized UAV autonomy: Classical methods and AI integration. Aerospace 2026, 13, 113. [Google Scholar] [CrossRef]
  6. Zhang, H.; Gan, X.; Xin, J.; Liu, Y.; Chen, X. Conflict resolution algorithm for multiple aircraft based on cooperative game. J. Beijing Univ. Aeronaut. Astronaut. 2022, 48, 863–871. [Google Scholar]
  7. Huang, Y.; Tang, J.; Lao, S. UAV flight conflict resolution algorithm based on complex network. Acta Aeronaut. Astronaut. Sin. 2018, 39, 114–121. [Google Scholar]
  8. Wu, M.; Wang, Z.; Gan, X.; Yang, G.; Wen, X. Identification of key flight conflict points based on complex network theory. J. Northwest. Polytech. Univ. 2020, 38, 279–287. [Google Scholar] [CrossRef]
  9. Wu, M.; Bi, K.; Wen, X.; Sun, J. Conflict resolution strategy based on optimal dominating set of flight conflict network. J. Beijing Univ. Aeronaut. Astronaut. 2023, 49, 242–253. [Google Scholar] [CrossRef]
  10. Bi, K.; Wu, M.; Wen, X.; Zhang, W.; Yang, W. Flight conflict resolution strategy based on flight conflict network and genetic algorithm. Syst. Eng. Electron. 2023, 45, 1429–1440. [Google Scholar]
  11. Feng, S.; Zeng, L.; Liu, J.; Yang, Y.; Song, W. Multi-UAVs Collaborative Path Planning in the Cramped Environment. IEEE/CAA J. Autom. Sin. 2024, 11, 529–538. [Google Scholar] [CrossRef]
  12. Zhou, Z.; Long, T.; Sun, J.; Li, J. Hierarchical Cooperative Path Planning Method Using Three-Dimensional Velocity-Obstacle Strategy for Multiple Fixed-Wing UAVs. J. Syst. Eng. Electron. 2025, 36, 1342–1352. [Google Scholar] [CrossRef]
  13. Al-Nabhan, N.; Alturkestani, R.; Belghith, A.; AlAloula, N. A conflict resolution approach for multiple unmanned aerial vehicles. Electronics 2025, 14, 2247. [Google Scholar] [CrossRef]
  14. Jond, H.B.; Beaver, L.E.; Jiroušek, M.; Ahmadlou, N.; Bakırcıoğlu, V.; Saska, M. Flatness-based finite-horizon multi-UAV formation trajectory planning and directionally aware collision avoidance tracking. J. Frankl. Inst. 2025, 362, 107867. [Google Scholar] [CrossRef]
  15. Zhong, Q.; Yu, Y.; Zhong, L.; Zhang, Y.; Liu, S.; Pan, W.; Yan, X. Optimizing safety buffer spacing and 3D dynamic obstacle avoidance strategies for urban low-altitude UAV (swarm) operations. Chin. J. Aeronaut. 2025, 38, 103901. [Google Scholar] [CrossRef]
  16. Agnihotri, R.; Sharma, S.K. Optimized conflict management for urban air mobility using swarm UAV networks. arXiv 2025, arXiv:2512.12632. [Google Scholar] [CrossRef]
  17. Vesentini, F.; Muradore, R.; Fiorini, P. A survey on Velocity Obstacle paradigm. Robot. Auton. Syst. 2024, 174, 104645. [Google Scholar] [CrossRef]
  18. Yang, Y.; Guo, X.; Hai, X.; Feng, Q.; Sun, B.; Wang, Z. Modeling and vulnerability analysis of UAV swarm based on two-layer multi-edge complex network. Reliab. Eng. Syst. Saf. 2025, 256, 110779. [Google Scholar] [CrossRef]
  19. Zou, F.; Li, J.; Niu, Y.F. Motion planning for agile fixed-wing UAVs in complex low-altitude environments. Robotica 2025, 43, 1640–1659. [Google Scholar] [CrossRef]
  20. Alejo, D.; Cobano, J.A.; Heredia, G.; Ollero, A. Particle Swarm Optimization for collision-free 4D trajectory planning in Unmanned Aerial Vehicles. In Proceedings of the International Conference on Unmanned Aircraft Systems (ICUAS2013), Atlanta, GA, USA, 28–31 May 2013; pp. 298–307. [Google Scholar]
  21. Alejo, D.; Cobano, J.A.; Heredia, G.; Ollero, A. Collision-free trajectory planning based on Maneuver Selection-Particle Swarm Optimization. In Proceedings of the 2015 International Conference on Unmanned Aircraft Systems (ICUAS), Denver, CO, USA, 9–12 June 2015; IEEE: New York, NY, USA, 2015; pp. 72–81. [Google Scholar]
  22. Pan, W.; Qin, L.; He, Q.; Huang, Y. Three-dimensional flight conflict detection and resolution based on particle swarm optimization. Aerospace 2023, 10, 740. [Google Scholar] [CrossRef]
  23. RTCA, Inc. AWP-3-2017: Detect and Avoid (DAA) White Paper Phase 2; RTCA: Washington, DC, USA, 2017. [Google Scholar]
  24. U.S. Department of Defense. Global Positioning System Standard Positioning Service Performance Standard, 5th ed.; DoD: Washington, DC, USA, 2020.
  25. Yang, X.; Ren, Z. Research on longitudinal safety separation assessment between UAV and civil aircraft based on wake vortex intensity. J. Saf. Sci. Technol. 2018, 14, 64–69. [Google Scholar]
  26. European Union Aviation Safety Agency. Report on Wake Turbulence Re-Categorisation (RECAT-EU); EASA: Cologne, Germany, 2021. [Google Scholar]
  27. Dehghannasiri, R.; Sohrabi, A. Practical distributed maneuvering target tracking using delayed information of heterogeneous unregistered sensors. Signal Process. 2022, 193, 108419. [Google Scholar] [CrossRef]
  28. European Union Aviation Safety Agency. Easy Access Rules for Unmanned Aircraft Systems (Regulation (EU) 2019/947); EASA: Cologne, Germany, 2022. [Google Scholar]
  29. Rolls-Royce. Unmanned Aircraft Systems: Technology White Paper. 2021. Available online: https://www.rolls-royce.com (accessed on 30 January 2026).
  30. Ravichandran, H.; Hota, S. Collision avoidance with optimal path planning of fixed-wing unmanned aerial vehicles. J. Guid. Control. Dyn. 2021, 44, 2118–2125. [Google Scholar] [CrossRef]
  31. Huang, X.; Sun, R.; Hu, H. An artificial potential field based cooperative UAV conflict detection and resolution under uncertain communication environment. In Proceedings of the 2022 IEEE International Conference on Unmanned Systems (ICUS), Guangzhou, China, 28–30 October 2022; IEEE: New York, NY, USA, 2022; pp. 309–314. [Google Scholar]
Figure 1. Flight protection zone in the shape of a cylinder.
Drones 10 00335 g001
Figure 2. 3D flight conflict detection model.
Drones 10 00335 g002
Figure 3. Flowchart of NCR.
Drones 10 00335 g003
Figure 4. A 6-DOF simulation platform based on MATLAB/Simulink.
Drones 10 00335 g004
Figure 5. Conflict situation: (a) scenario schematic and (b) conflict network.
Drones 10 00335 g005
Figure 6. Maneuver recommendations of NCR. The red cylinder represents the key UAV, the blue ones denote conflict-related UAVs with expanded protection zones, and the gray ones represent conflict-unrelated UAVs. The red solid line indicates the original velocity, and the black one denotes the new velocity. The red dashed line represents the conflicting relative velocity, while the blue one shows the new relative velocity after the maneuver recommendation is implemented. Each row corresponds to one step of NCR: (a,b) Step 1; (c,d) Step 2; (e,f) Step 3; (g,h) Step 4; and (i,j) Step 5.
Drones 10 00335 g006
Figure 7. 3D aerodynamic simulation trajectory tracking performance of fixed-wing UAVs: (a) UAV 7; (b) UAV 9; (c) UAV 11; (d) UAV 16; and (e) UAV 20.
Drones 10 00335 g007
Figure 8. The horizontal deviation and vertical deviation of UAVs: (a) horizontal deviation and (b) vertical deviation.
Drones 10 00335 g008
Figure 9. Maneuver recommendations of SCR. The red cylinder represents the key UAV, the blue ones denote conflict-related UAVs with expanded protection zones, and the gray ones represent conflict-unrelated UAVs. The red solid line indicates the original velocity, and the black one denotes the new velocity. The red dashed line represents the conflicting relative velocity. Each subplot corresponds to one step of SCR: (ag) Step 1 to 7.
Drones 10 00335 g009
Figure 10. The network robustness R m with the steps of NCR and SCR.
Drones 10 00335 g010
Figure 11. Maneuver recommendations of RCR. The red cylinder represents the key UAV, the blue ones denote conflict-related UAVs with expanded protection zones, and the gray ones represent conflict-unrelated UAVs. The red solid line indicates the original velocity, and the black one denotes the new velocity. The red dashed line represents the conflicting relative velocity. Each subplot corresponds to one step of RCR: (ae) Steps 1 to 5.
Drones 10 00335 g011
Figure 12. The network robustness R m with the steps of NCR and RCR.
Drones 10 00335 g012
Figure 13. The empirical cumulative distribution function curve of S .
Drones 10 00335 g013
Figure 14. The empirical cumulative distribution function curve of S Q : (a) NCR and SCR; (b) NCR and RCR.
Drones 10 00335 g014
Figure 15. The initial scenario of 20 UAVs in 3D airspace and its initial conflict network are shown in (a) and (b), respectively.
Drones 10 00335 g015
Table 1. The velocity and position information of the UAVs.
Serial Number of UAVsx/kmy/kmz/m θ φ v /(km/h)
11.41−1.95295−118.690.0167
25.01−0.8680146.290.0133
35.19−0.9216269.190.0156
4−0.789.037031.090.0199
55.84−0.31225−42.790.0135
61.458.02295155.090.0131
79.063.58207−116.890.0181
8−0.132.8258−32.690.0198
93.627.006624.390.0184
102.477.4980122.290.0170
114.53−0.91279−148.690.0172
123.081.45222−23.890.0160
138.351.51250103.090.0179
142.541.159544.990.0151
157.594.37184156.390.0192
169.901.3221465.290.0127
178.689.1531−44.090.0195
187.461.3087−26.290.0176
190.425.80107−120.290.0125
206.060.4891170.590.0166
Table 2. Conflict situations and adjacent relationships of the conflict network.
Node   i Node   j t c /s w i j
4201090.1618
516850.2437
712920.2145
7131550.0755
914670.3249
919450.4695
1020900.2220
1113740.2932
1920850.2416
Table 3. The maneuver recommendations and resolution results by NCR.
StepSerial Number of UAV θ φ v /(km/h) R m
Initial\\\\0.1123
19−9.5−0.480.0726
2204.8−9.6−70.0413
311−17.4−4.8190.0267
470−1.2−240.0122
516−8.0−3.380
Table 4. The maneuver recommendations and resolution results by SCR.
StepSerial Number of UAV θ φ v /(km/h) R m
Initial\\\\0.1123
1431.6−7.5−50.1042
253.6−1.5−250.0921
37−34.1−6.1240.0776
410−27.7−9.1240.0665
51118.1−9.8−280.0518
62029.8−2.600.0397
79−34.1−6.1240
Table 5. The maneuver recommendations and resolution results by RCR.
StepSerial Number of UAV θ φ v /(km/h) R m
Initial\\\\0.1438
1913.8−3.7−270.1016
22044.2−3.7210.0733
31323.4−9.480.0583
4162.7−7.2200.0439
512−14.0−14.2−210
Table 6. Performance comparison between NCR and the traditional reactive baseline APF.
AlgorithmSafety RateAverage Systemic Response RateTypical Maneuver Characteristics
APF100%92.93%Global Chain Maneuver
NCR100%25.59%Local Node Scheduling
Table 7. The statistical results of NCR, SCR and RCR.
NCRSCRRCR
m a /UAV5.126.035.19
d V a d t a / ° 92.1299.70231.55
d p a / ° 17.4718.6748.56
d v a /(km·h)72.1479.2072.05
F a 540.81580.631441.57
Table 8. Detailed comparison of maneuver states for the 20-UAV bottleneck scenario.
Serial Number of UAVNCR: Scheduled Maneuver CommandsAPF: Maximum Reactive Deviations
θ φ v
(km/h)
θ m a x φ m a x v m a x
(km/h)
18.1°−1.5°−1215.7°4.3°−14
2Unaltered44.5°−7.4°−26
3Unaltered−26.8°−7.2°18
4−12.8°−1.4°−29Unaltered
5Unaltered−15.1°−3.7°11
6Unaltered26.9°12.4°15
7Unaltered6.3°−23.8°−44
84.7−5.6°1927.3°4.8°−18
934.5°−9.6°−26−35.1°3.7°−15
10Unaltered9.2°−6.9°−9
11Unaltered−12.9°−3.9°48
120016Unaltered
13Unaltered−47.3°−16.7°−34
145.3°4.1°9−24.9°−15.8°−33
15Unaltered−10.6°4.8°19
16−14.0°−1.1°15−15.8°5.0°24
1715.5°−7.5°−26−56.7°17.3°−30
18−27.9°−7.1°−8−32.8°−5.0°19
19Unaltered32.9°−5.5°11
20−13.4°−0.3°1436.6°23.3°6
Disclaimer/Publisher’s Note: The statements, opinions and data contained in all publications are solely those of the individual author(s) and contributor(s) and not of MDPI and/or the editor(s). MDPI and/or the editor(s) disclaim responsibility for any injury to people or property resulting from any ideas, methods, instructions or products referred to in the content.