5.1. Characterization of Drone RF Signal
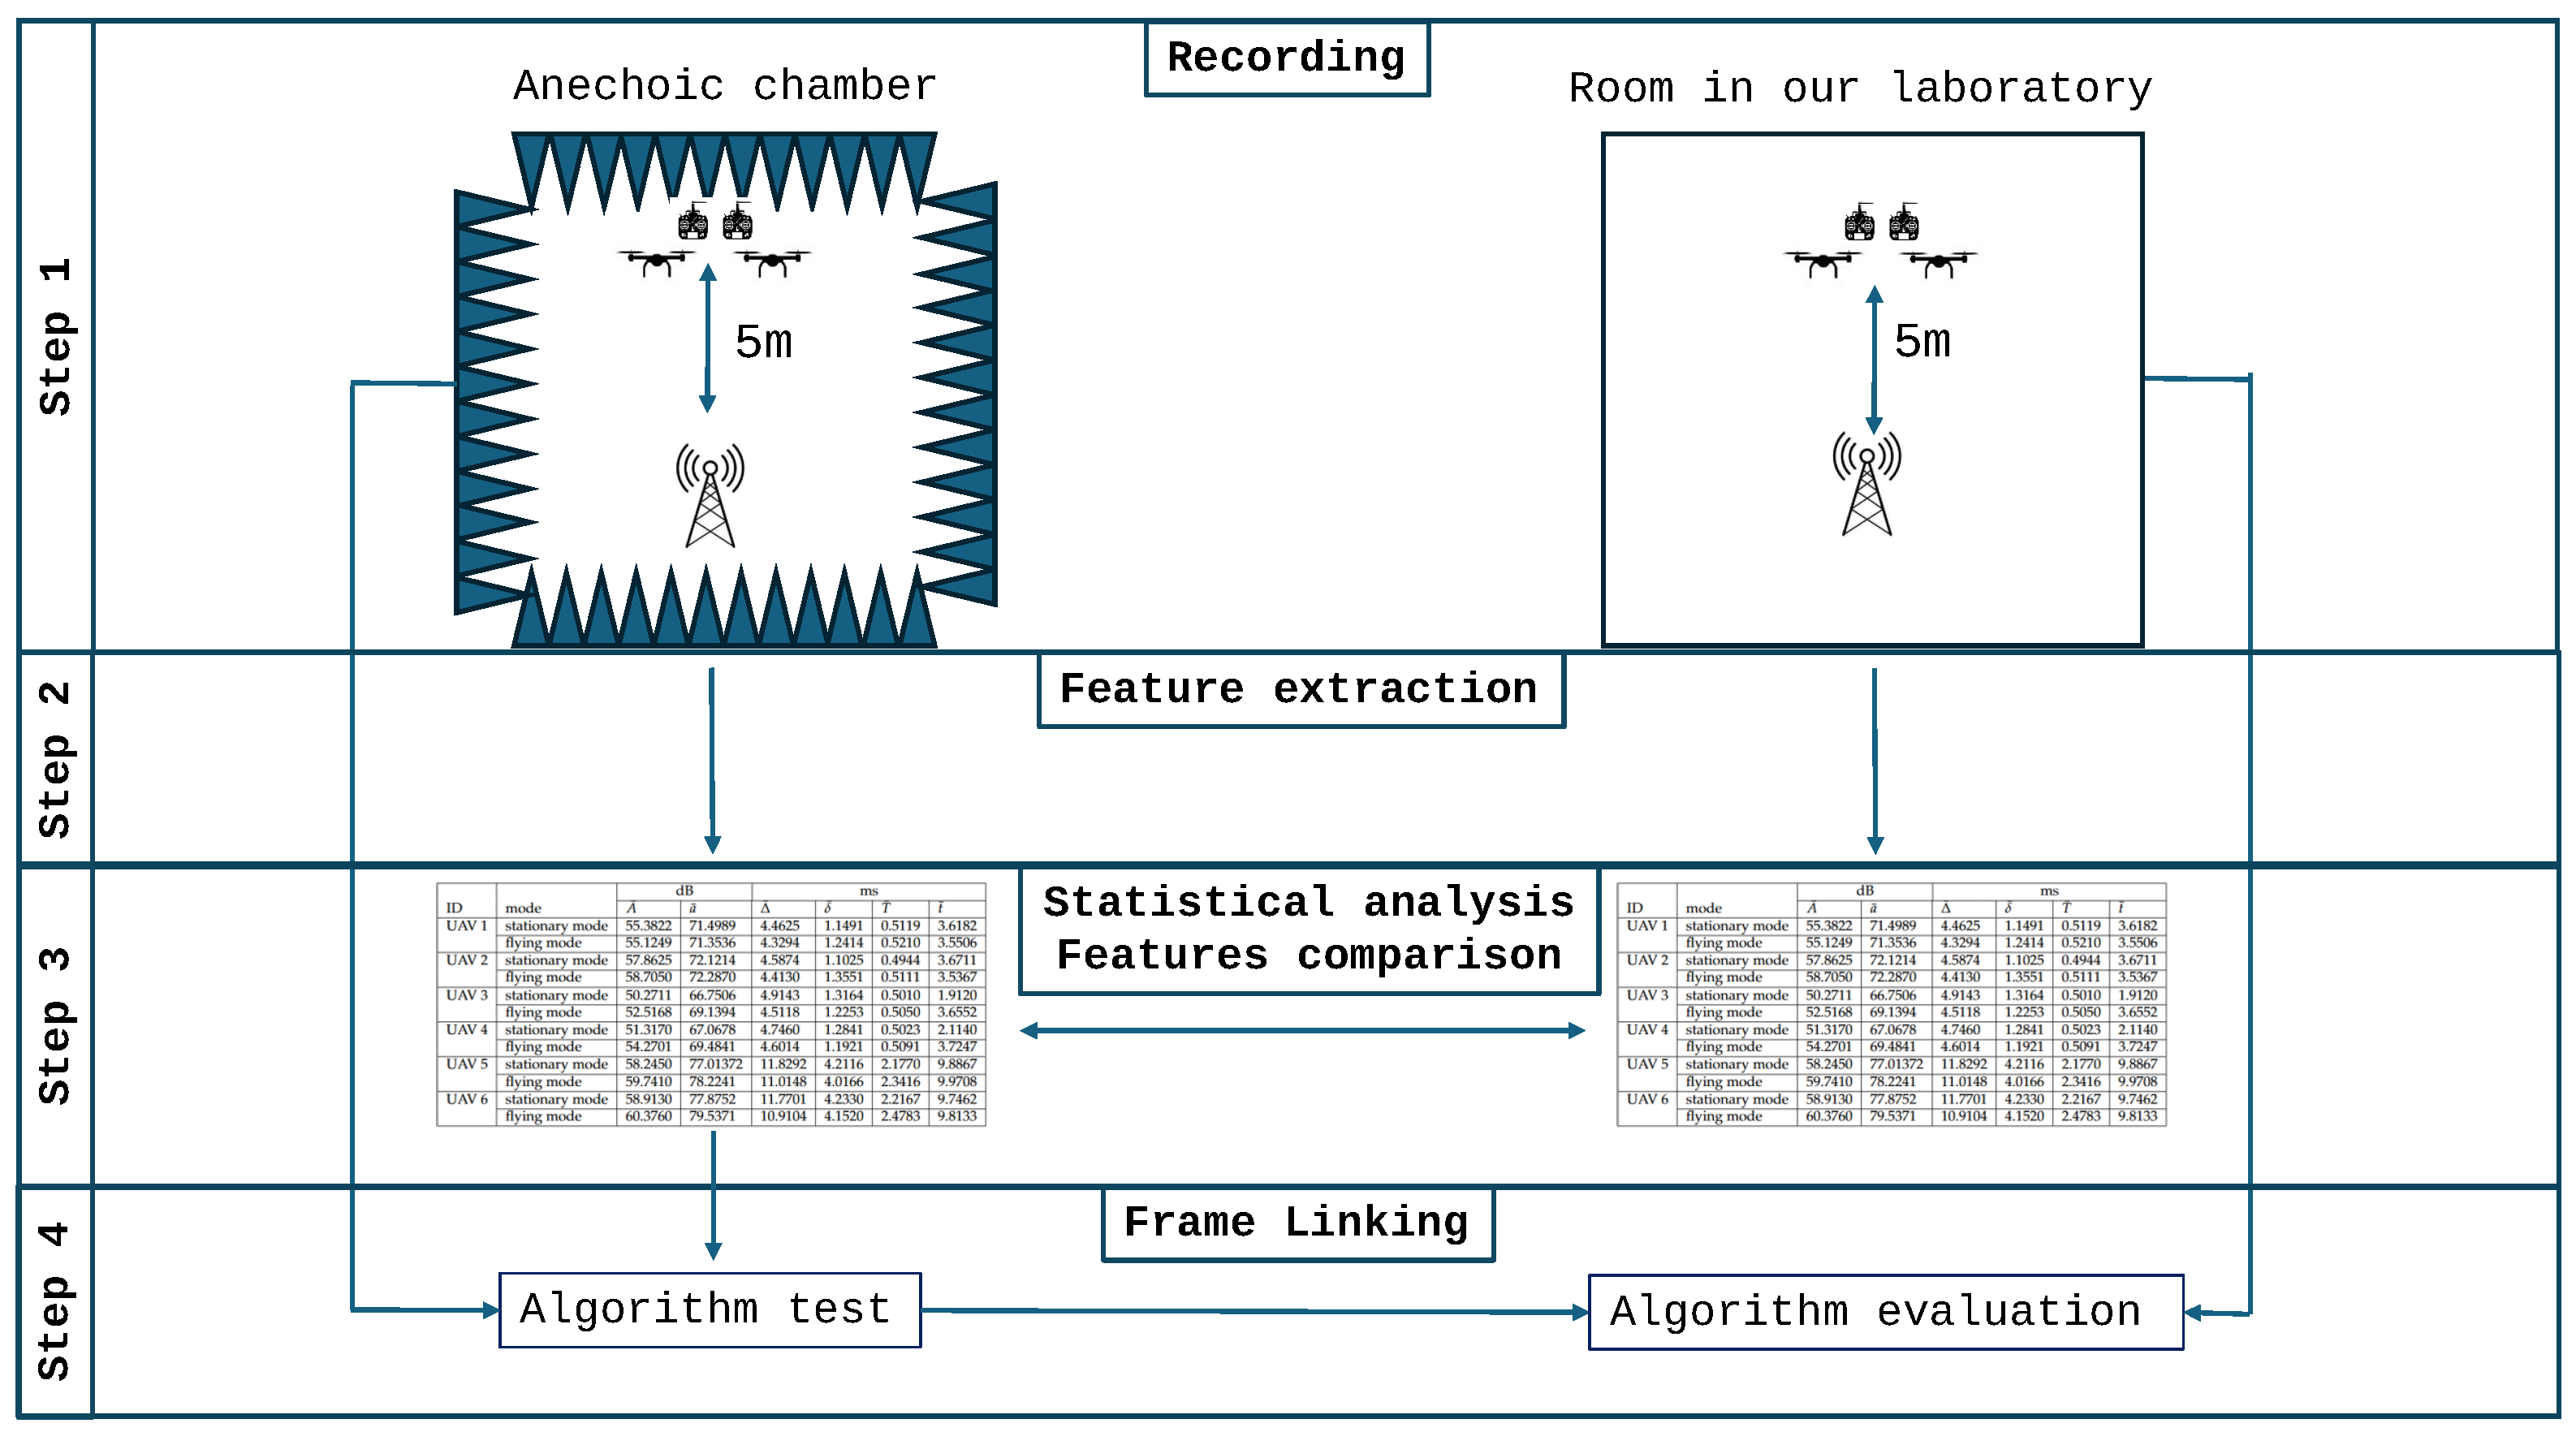
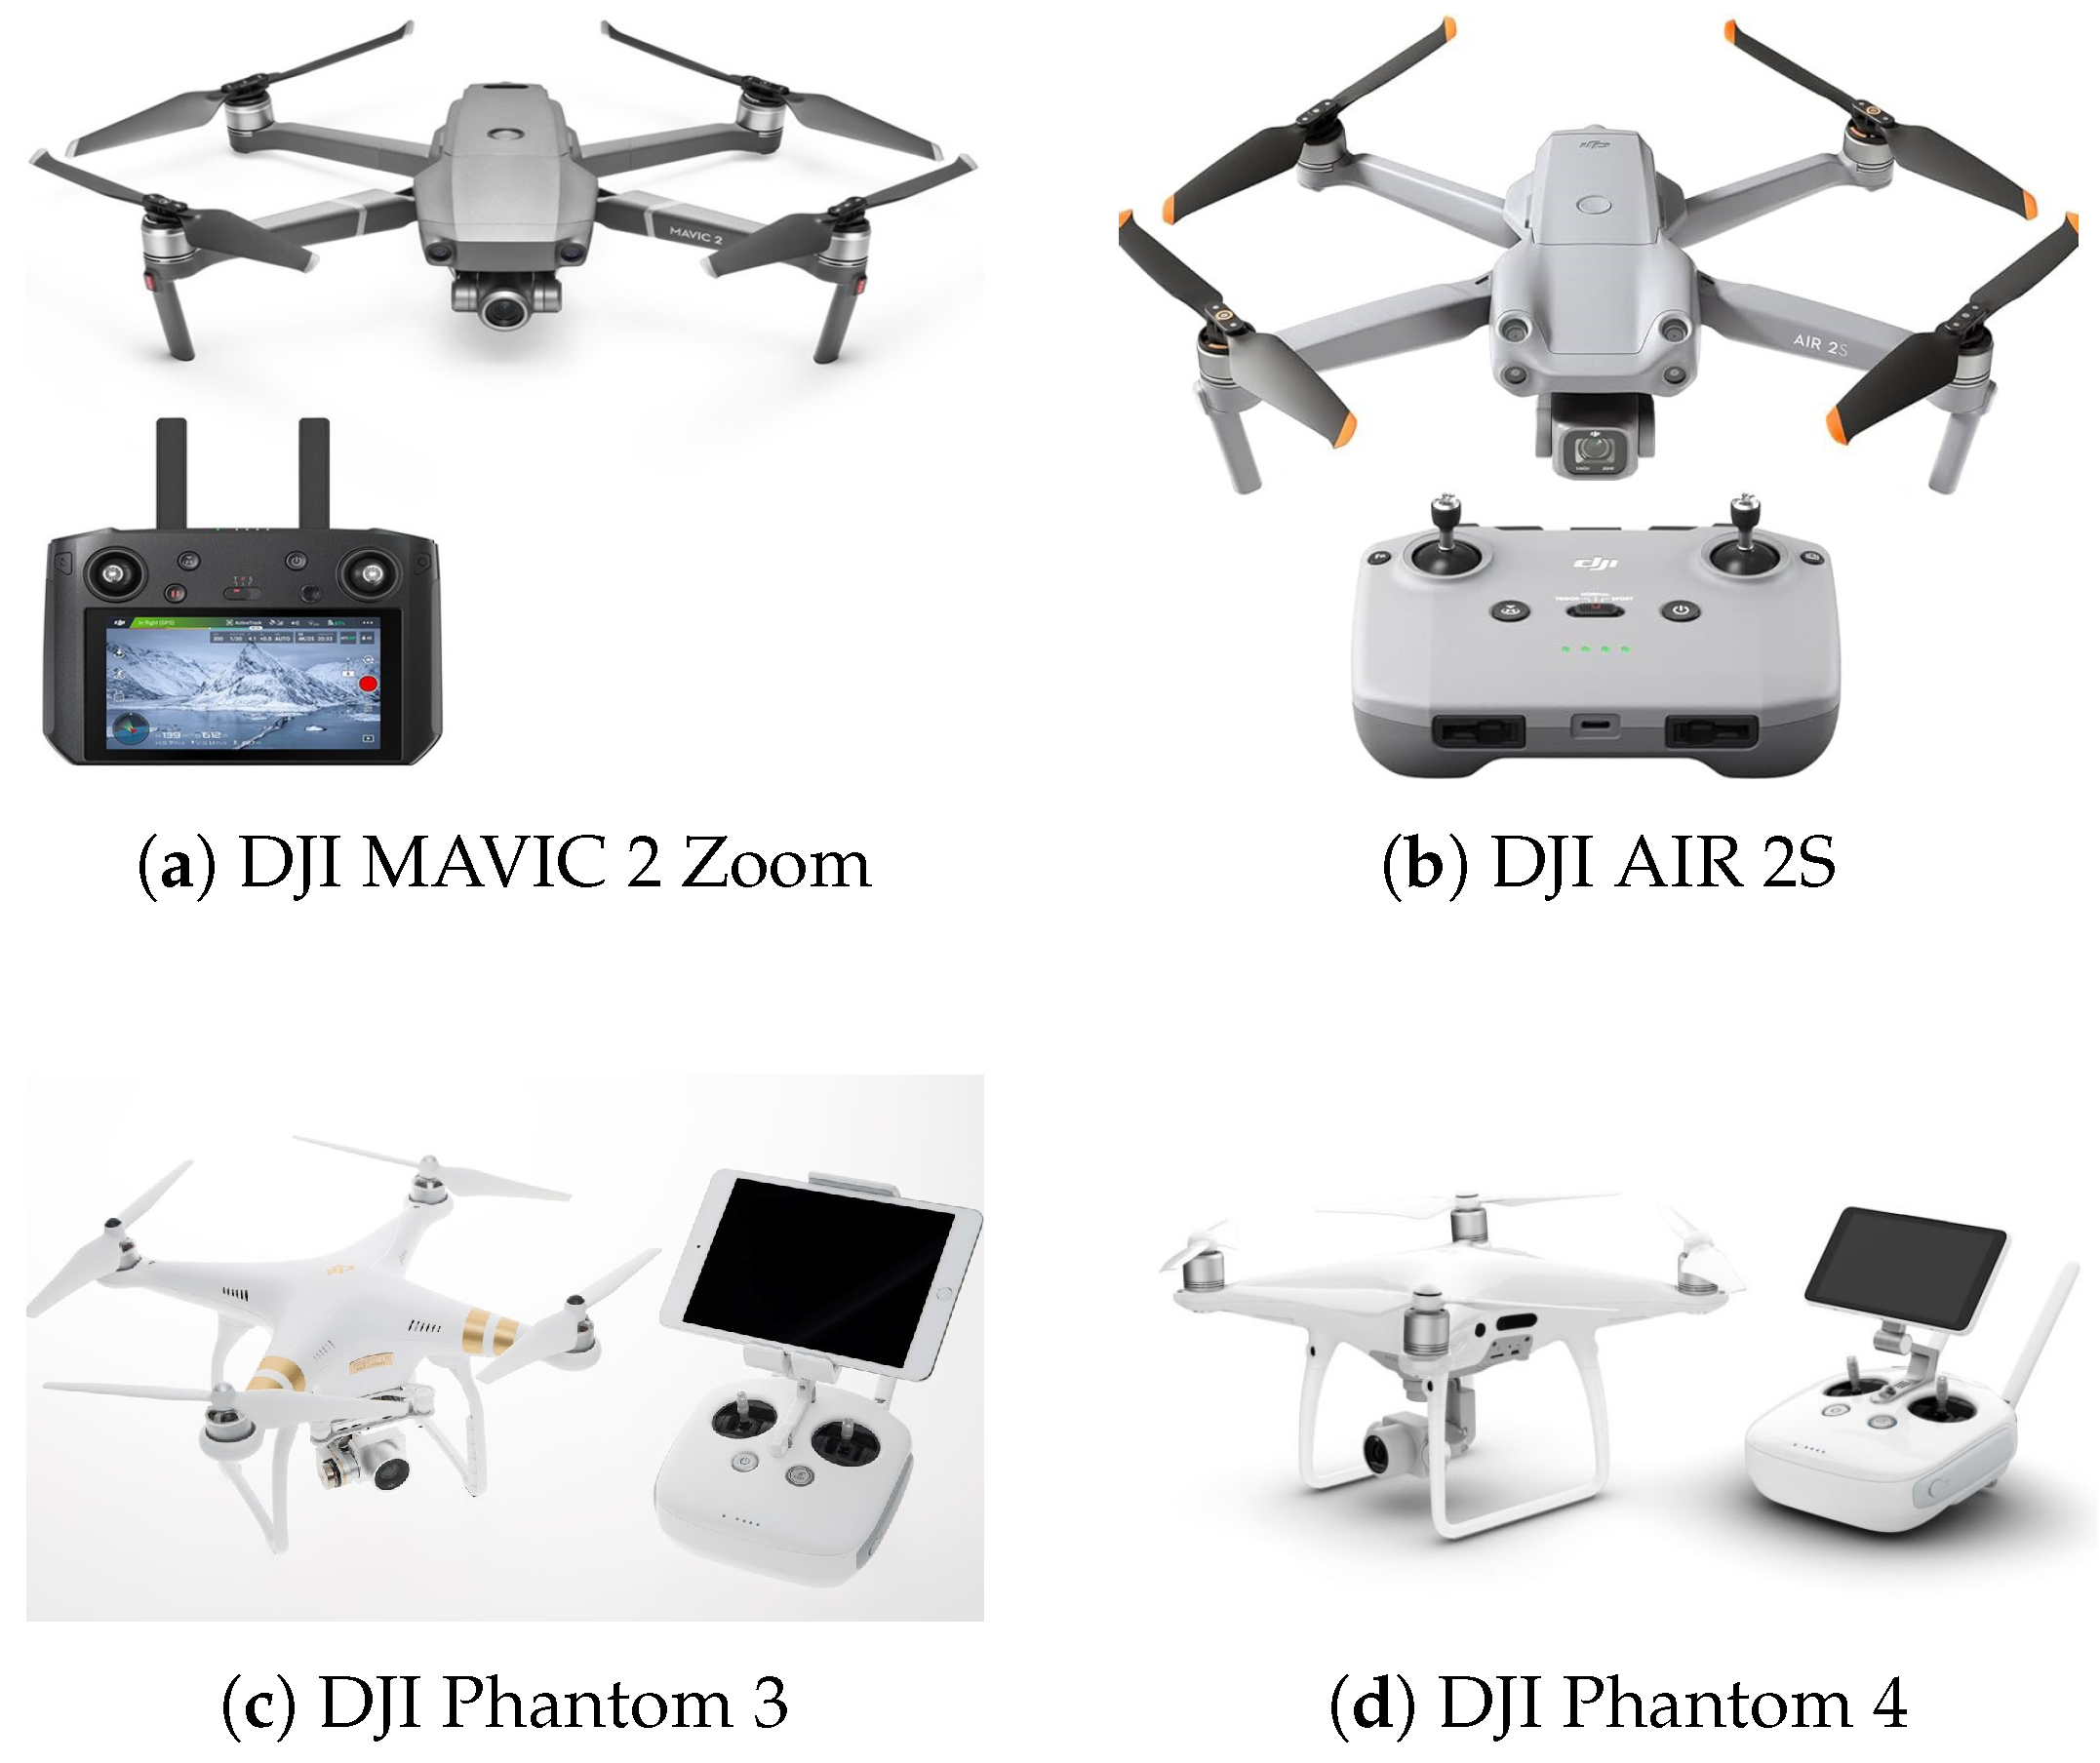
For this study, our objective was to thoroughly characterize the communication behavior between the remote control and six UAVs, categorized into three sets: two MAVIC 2 Zoom (UAV 1 and UAV 2), two AIR 2S (UAV 3 and UAV 4), one Phantom 4, and one Phantom 3 Pro (UAV 5 and UAV 6). The study focused on analyzing the characteristics of video and control communications independently for each set of UAVs. A comparative analysis was also performed for these UAVs in two distinct operational modes: stationary mode, where the controller does not issue flight commands, and flying mode, where active motion commands are transmitted. These modes represent typical scenarios for UAV operation, allowing us to assess variations in communication behavior under static and dynamic conditions.
To quantify communication performance, key indicators were identified and denoted as
,
,
,
,
, and
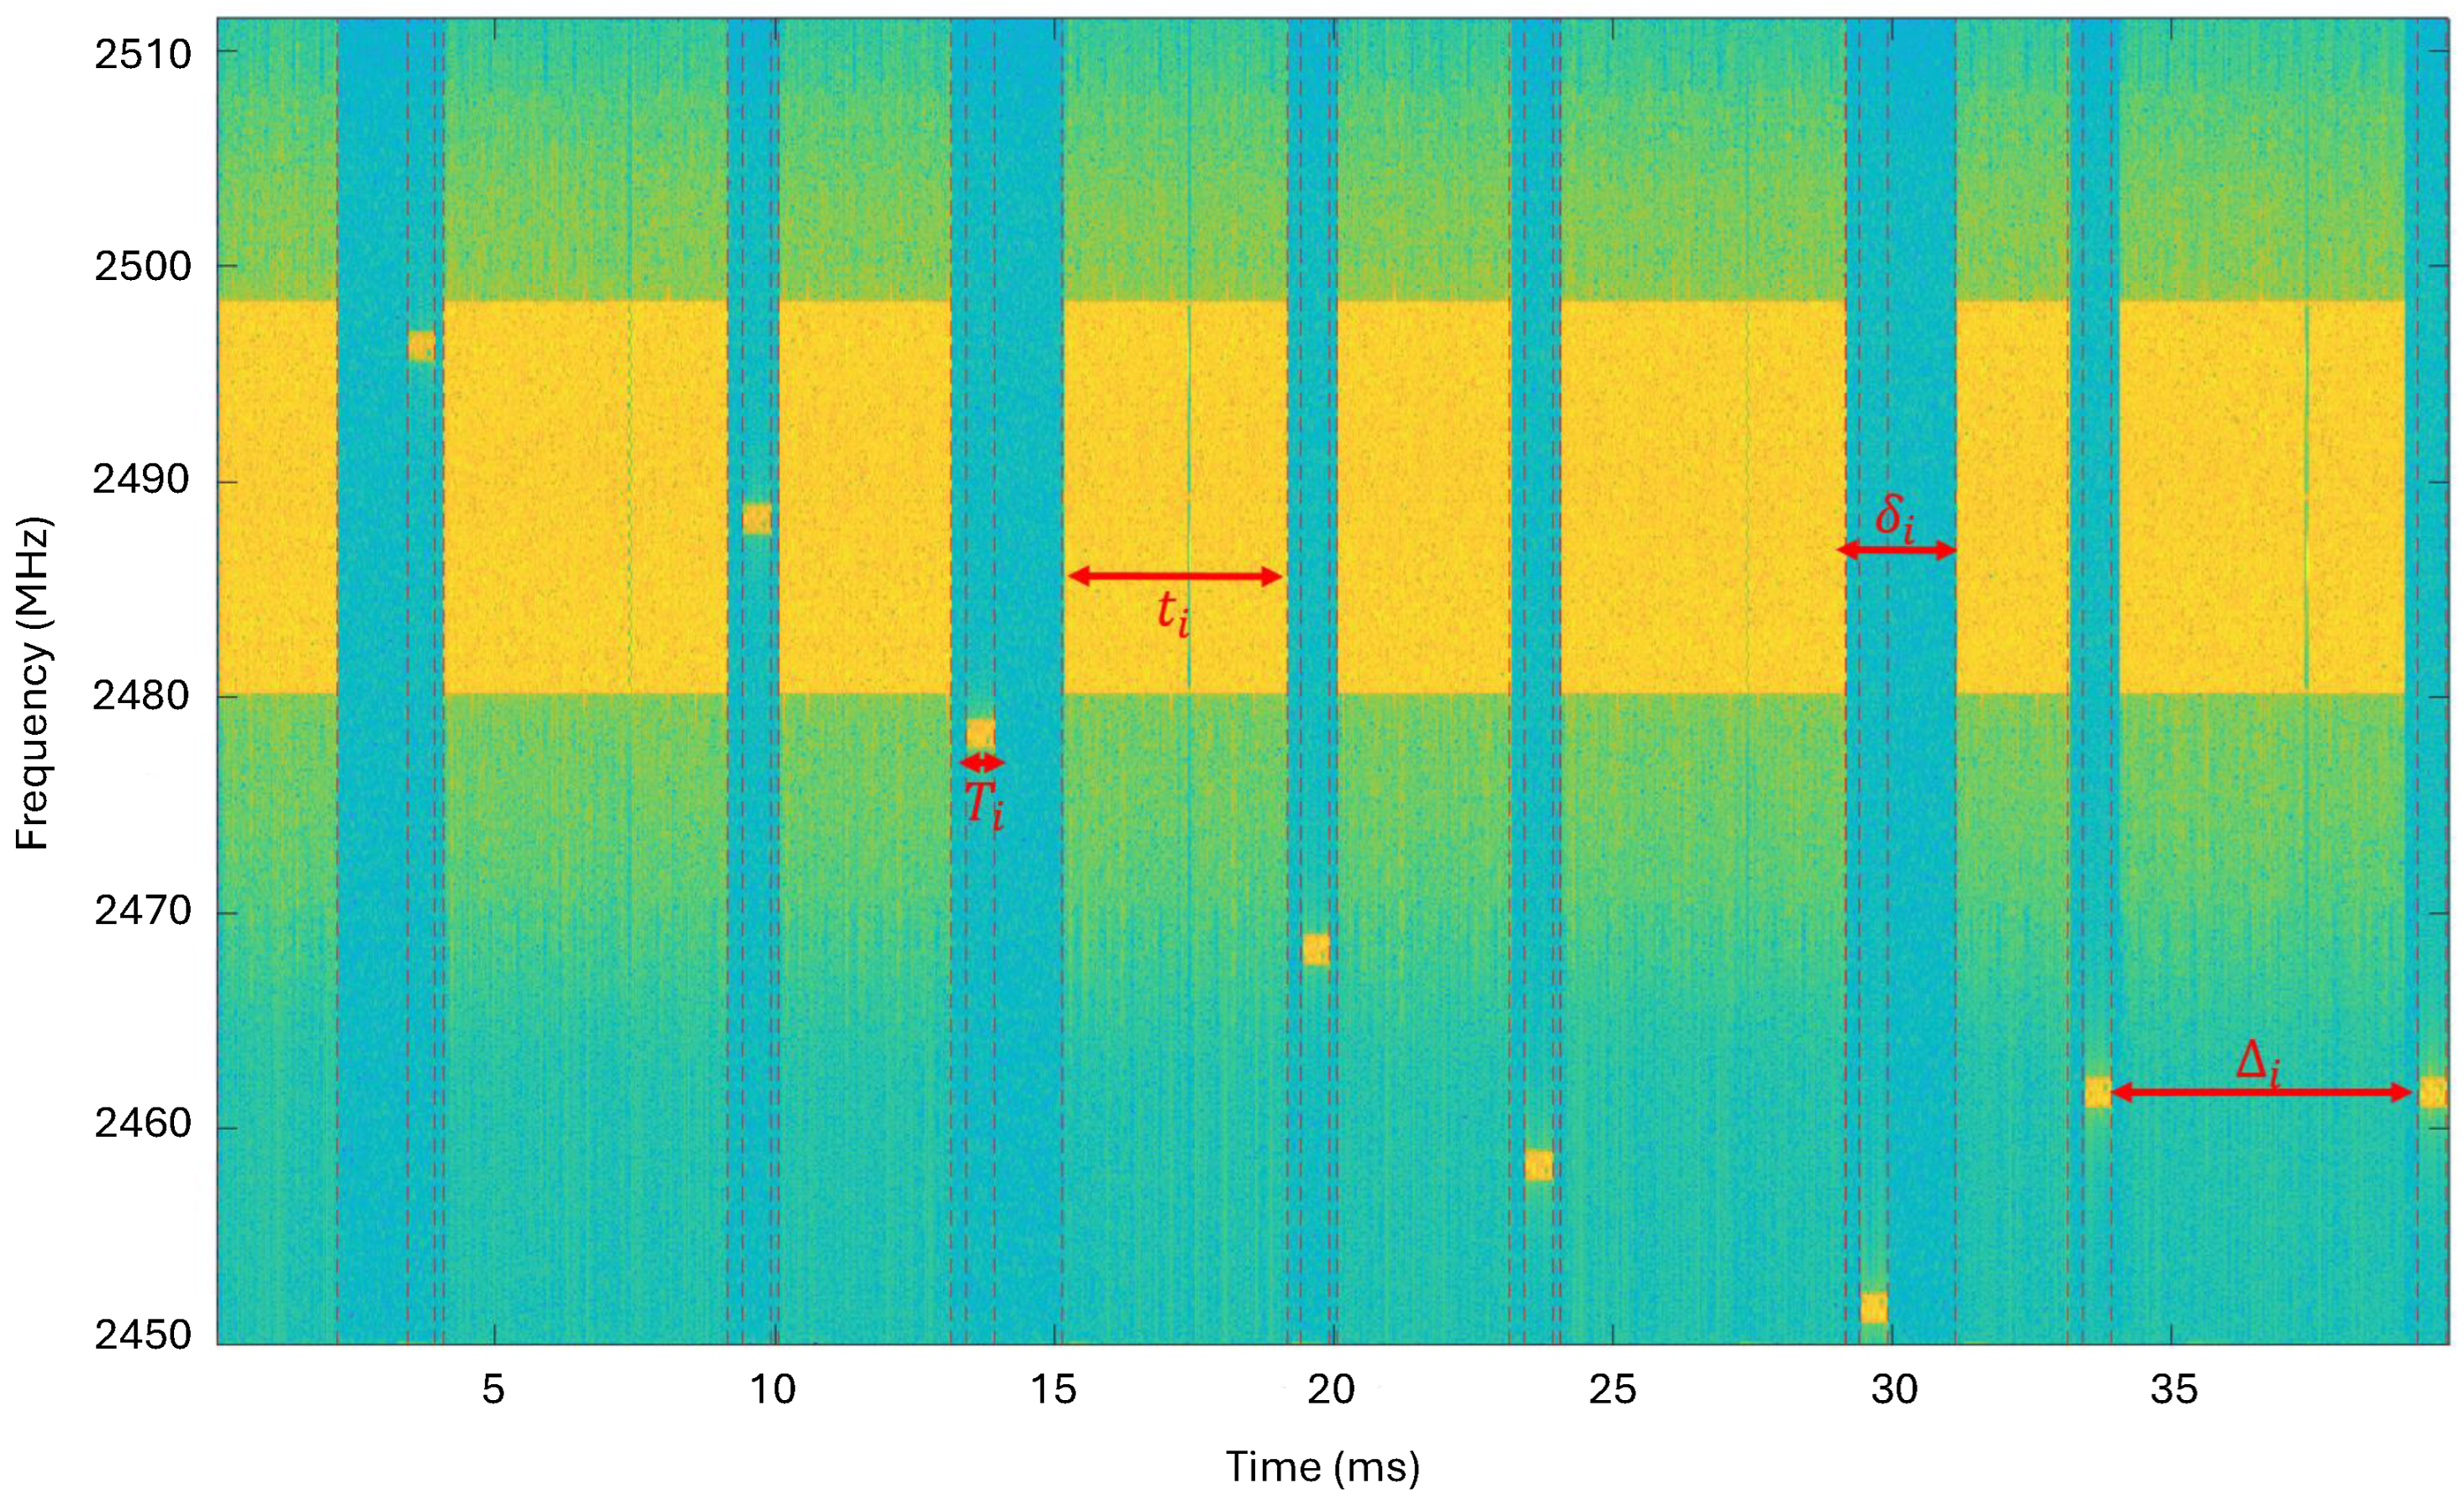
. These indicators capture average values of the power of controller communications, the power of communications from the UAV, the time intervals between control communications, the time intervals between communications from the UAV, the duration of control communications, and the duration of communications from the UAV, respectively. These metrics are summarized in
Table 3 and
Table 4, providing a clear overview of the communication characteristics for each set of UAVs and their respective modes.
To statistically evaluate differences in these indicators, the study employed the Wilcoxon–Mann–Whitney test (MW test) [
21,
22]. The Wilcoxon–Mann–Whitney test works by comparing ranks of the sampling. The purpose of this test is to show the difference in the average values of two samples and to highlight a difference in distribution. As the value is based on ranks, it allows differences between two distributions to be highlighted without requiring the samples to be normally distributed. This non-parametric test designed to compare the distributions of two independent samples is suitable for analyzing UAV data that may not conform to normality. For each comparison, the null hypothesis (
) posited that the medians of the distributions were equal (
), while the alternative hypothesis (
) suggested a difference (
). A significance threshold,
was used to determine whether the observed differences were statistically significant. A
p-value less than or equal to
led to the rejection of
, indicating a meaningful difference in the distributions.
Table 5 and
Table 6 summarize the results, presenting both the
p-values and a Boolean indicator (B) that takes a value of 1 if
is rejected and 0 otherwise.
The results reveal notable differences in the communication characteristics between the sets of UAVs. To highlight the ability of our study to accurately identify UAV communication frames, we describe the result for the 2 MAVIC 2 Zoom. For instance, in stationary mode, significant differences were observed between the two MAVIC 2 Zoom UAVs for most criteria, except in video communication times, which showed no statistically significant variation. This consistency in video communication under stationary conditions suggests stable handling of video signals irrespective of minor hardware or software variations within the same UAV model.
In flying mode, where the UAVs received active motion commands, the communication intervals and times were slightly different between the two MAVIC 2 Zoom UAVs. This finding implies that the method and frequency of transmitting motion commands are fully consistent within this set of UAVs, likely reflecting the design and operational protocols.
An intriguing pattern emerged when analyzing the behavior of individual UAVs in the two modes. For the same UAV, the transmission times of the control signals, , exhibited notable changes when transitioning from stationary to flying mode. Furthermore, the intervals between these control signal transmissions, , also vary between modes, indicating that the timing rhythm of the command transmission is affected by the type of operational mode.
The average power of controller communications is used as an additional metric to identify communication frames associated with the same UAV. This parameter demonstrated strong potential as an additional indicator for distinguishing UAVs based on their unique communication characteristics. However, the study excluded signal strength from the analysis despite observing significant differences in this parameter between MAVIC 2 Zoom UAVs. This exclusion was attributed to the stationary nature of the experimental setup, which did not involve UAV mobility. In future studies, incorporating dynamic scenarios with varying spatial separations and environmental factors could provide a more comprehensive understanding of the role of signal strength in UAV communication.
In conclusion, this study emphasizes the significance of characterizing the behavior of UAV communication across various operating modes and sets of UAVs. The findings offer valuable insight into the nuances of video and control signal transmission, paving the way for optimizing UAV communication systems for diverse applications. The use of robust statistical methods and well-defined metrics ensures the reliability of the results, making this research a solid foundation for further exploration in UAV communication analysis.
5.2. Automatic Linking
Our comprehensive study of two MAVIC 2 Zoom UAVs, two AIR 2S UAVs, a Phantom 4 UAV, and a Phantom 3 UAV has provided critical insights into the inherent differences and similarities among these UAVs within the same model family. This investigation is particularly significant for understanding how variations in design, technology, and operational parameters influence their characteristics of communication signals. The ability to differentiate and analyze these signals is crucial for various applications, including UAV identification, tracking, and ensuring secure communication protocols.
In associating communication signals with their respective UAVs, a fundamental challenge arises from the distinct differences between signals emitted by the UAVs themselves and those emitted by their controllers. These differences are often influenced by hardware specifications, signal modulation techniques, and frequency allocations, which vary between UAV models and their controllers. Addressing this challenge is vital for ensuring accurate identification and reducing potential errors in signal attribution.
Our approach involves a two-step systematic process for tracking and associating signals. The first step focuses on differentiating between signals emitted by the controllers and those from the UAVs. This distinction is achieved through a combination of signal analysis techniques, such as spectral analysis, modulation scheme identification, and machine learning classifiers trained to recognize unique patterns associated with controller and UAV transmissions. By isolating the specific signals for the UAVs, we create a foundation for a more precise analysis.
In the second step, the differentiated signals are subjected to a detailed examination to establish a strong link between the communication signals and the corresponding UAVs. This involves analyzing the temporal, spectral, and spatial characteristics of the signals. Furthermore, by leveraging advanced signal correlation techniques and real-time processing algorithms, we can accurately associate each communication signal with its source UAV. This step is crucial for applications such as swarm management, intrusion detection, and forensic investigations involving UAV operations.
The Drone Frame Identification and Association Algorithm is presented in Algorithm 1, with a detailed explanation provided in the subsequent subsections. For this algorithm, the complexity is given by
| Algorithm 1 Drone Frame Identification and Association Algorithm |
- 1:
- 2:
- 3:
- 4:
- 5:
- 6:
- 7:
- 8:
for new do - 9:
Step 1: Identify Drone Frame Appearance - 10:
- 11:
if then - 12:
Mark as a potential drone frame - 13:
else - 14:
Continue to the next frame - 15:
end if - 16:
Step 2: Verify Emission Timing - 17:
if then - 18:
Confirm as a valid drone frame - 19:
else - 20:
Discard as invalid - 21:
end if - 22:
Step 3: Associate Frame to UAV - 23:
Extract unique signal - 24:
- 25:
Assign to the UAV with the closest match - 26:
end for - 27:
Output: List of associated UAVs and their detected frames
|
5.2.1. Detecting Drone Frames via Cross-Correlation
In this initial step, the system aims to detect the presence of drone signals by comparing incoming frames with a pre-stored reference frame. This comparison is performed using cross-correlation, a mathematical technique that measures the similarity between two signals as a function of the time lag applied to one of them. Cross-correlation is particularly effective in scenarios with noise or interference, as it enhances the matching process by focusing on signal patterns rather than exact values.
The reference frame, which represents the characteristic signal structure of a known UAV communication pattern, serves as a template for identification. By computing the cross-correlation between each incoming frame and the reference frame, the system identifies peaks in the correlation output. These peaks indicate the presence of a signal resembling the reference frame, thus confirming the detection of a potential drone communication frame. This method ensures robustness against variations in signal strength or environmental noise, making it suitable for real-world UAV signal detection tasks.
The key operation of this step is the correlation. The complexity
per frame is multiplied by the number of frames
n:
5.2.2. Verifying Emission Timing with Database
Once a potential drone frame has been detected, the next step is to verify its temporal validity. UAVs typically emit signals at regular intervals or within characteristic time windows determined by their communication protocols. The system leverages a pre-compiled database containing the expected emission intervals for various UAV models.
By cross-referencing the timestamp of the detected frame against the database, the system ensures that the signal aligns with the expected timing characteristics. If the frame’s emission time falls within the predefined interval, it is validated as a genuine UAV signal. Conversely, frames falling outside the expected intervals are discarded as potential false positives, such as noise or unrelated signals. This time-based validation step is critical for maintaining the accuracy and reliability of the detection system, especially in environments with high signal activity.
This is a simple comparison of values. The complexity is a constant per recording:
5.2.3. Decision: Linking Frame to UAV
After validating a frame as a UAV signal, the final step is to associate it with the specific UAV that generated it. Each UAV model, and in some cases an individual UAV, has unique communication signal characteristics. These characteristics include parameters such as frequency bands, modulation schemes, emission power levels, and specific patterns in signal structure.
By analyzing the similarities and differences between the detected signal’s characteristics and the database entries using a cross-correlation technique, the frame is assigned to the UAV with the closest match. This association process not only identifies the source UAV but also helps track its activity over time.
The frame association follows a process similar to UAV communication signals originating from the remote controller, with the primary distinction lying in the reference frame used and the communication interval. This method ensures that signals are matched accurately to their respective UAVs by analyzing signal patterns and communication properties. Feature extraction (
) depends on the method. Here, it is
. The comparison of a signal and a reference signal depends on the number of reference UAVs (
K). If the signal is compared to
K drones, the complexity is
. For this step, the total complexity is
5.2.4. Evaluation
In order to evaluate the performance of our communication frame allocation, we will calculate the error ratio obtained from the recordings in which two UAVs communicate with their RC. The error ratio is defined by Equation (
1), where
represents the frame of the reference UAV allocated to the second UAV,
represents the frame of the second UAV allocated to the reference UAV,
represents the frame of the reference UAV, correctly allocated, and
represents the frame of the second UAV, correctly allocated.
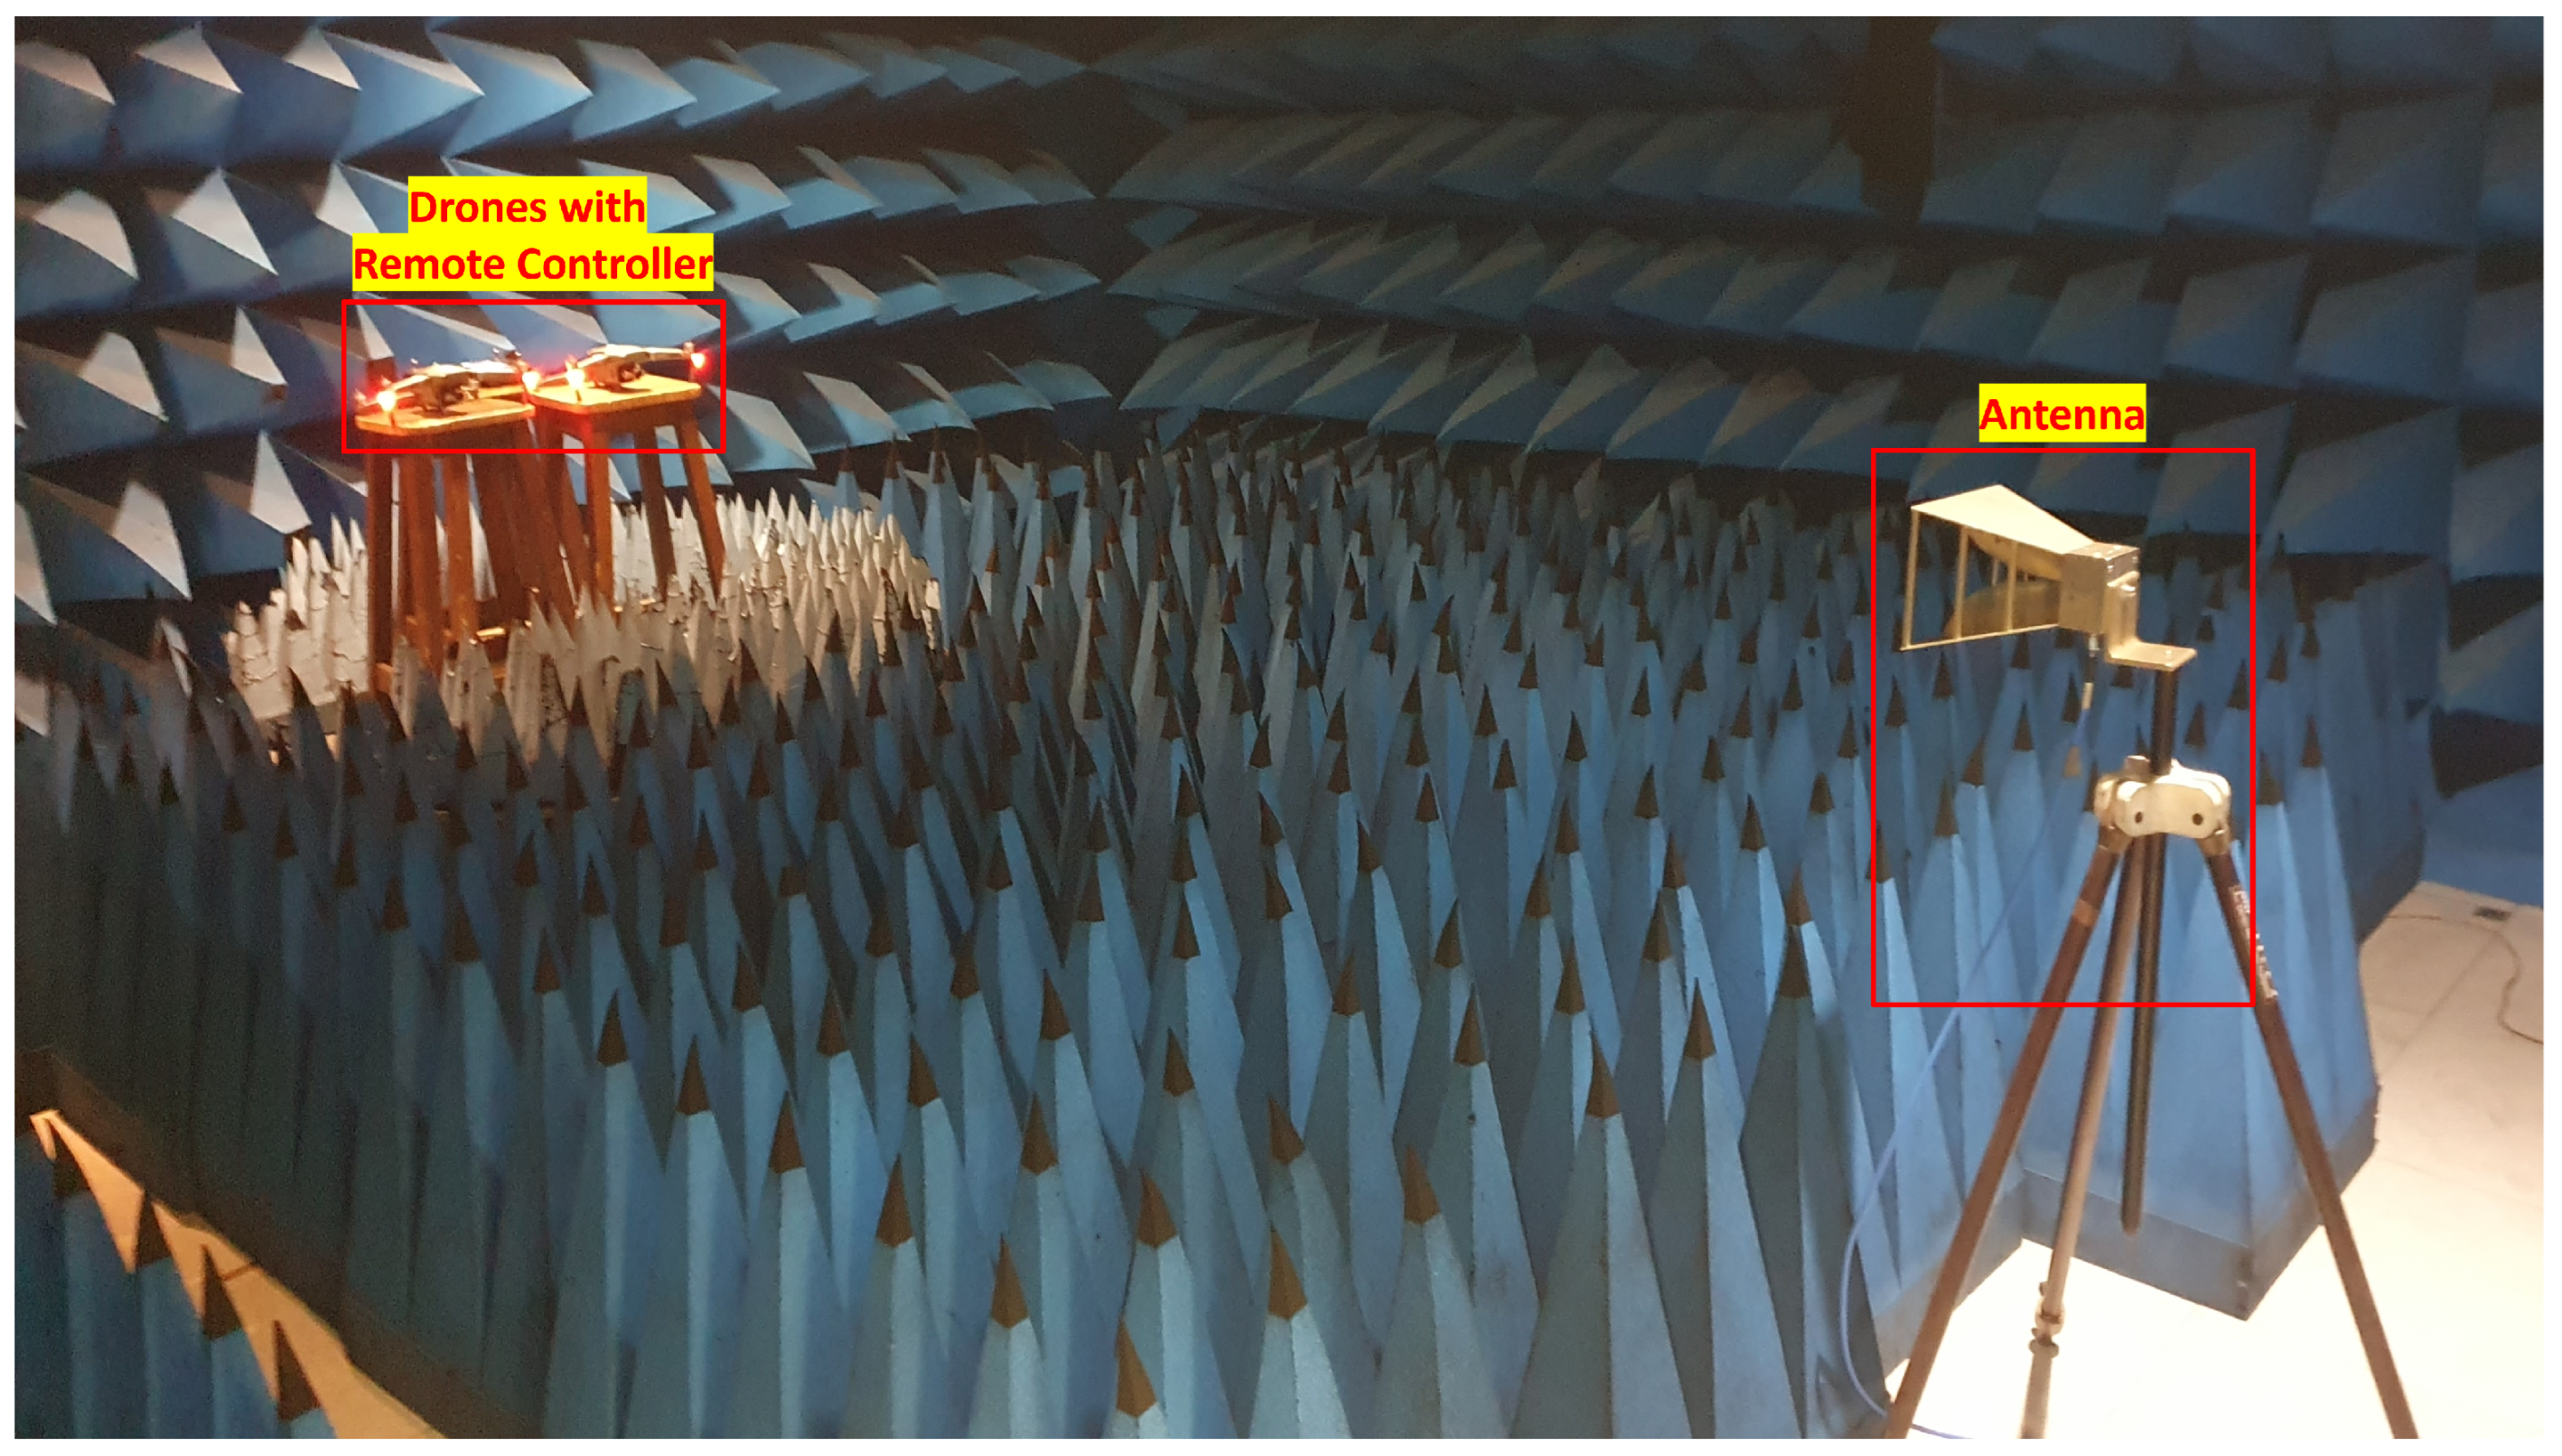
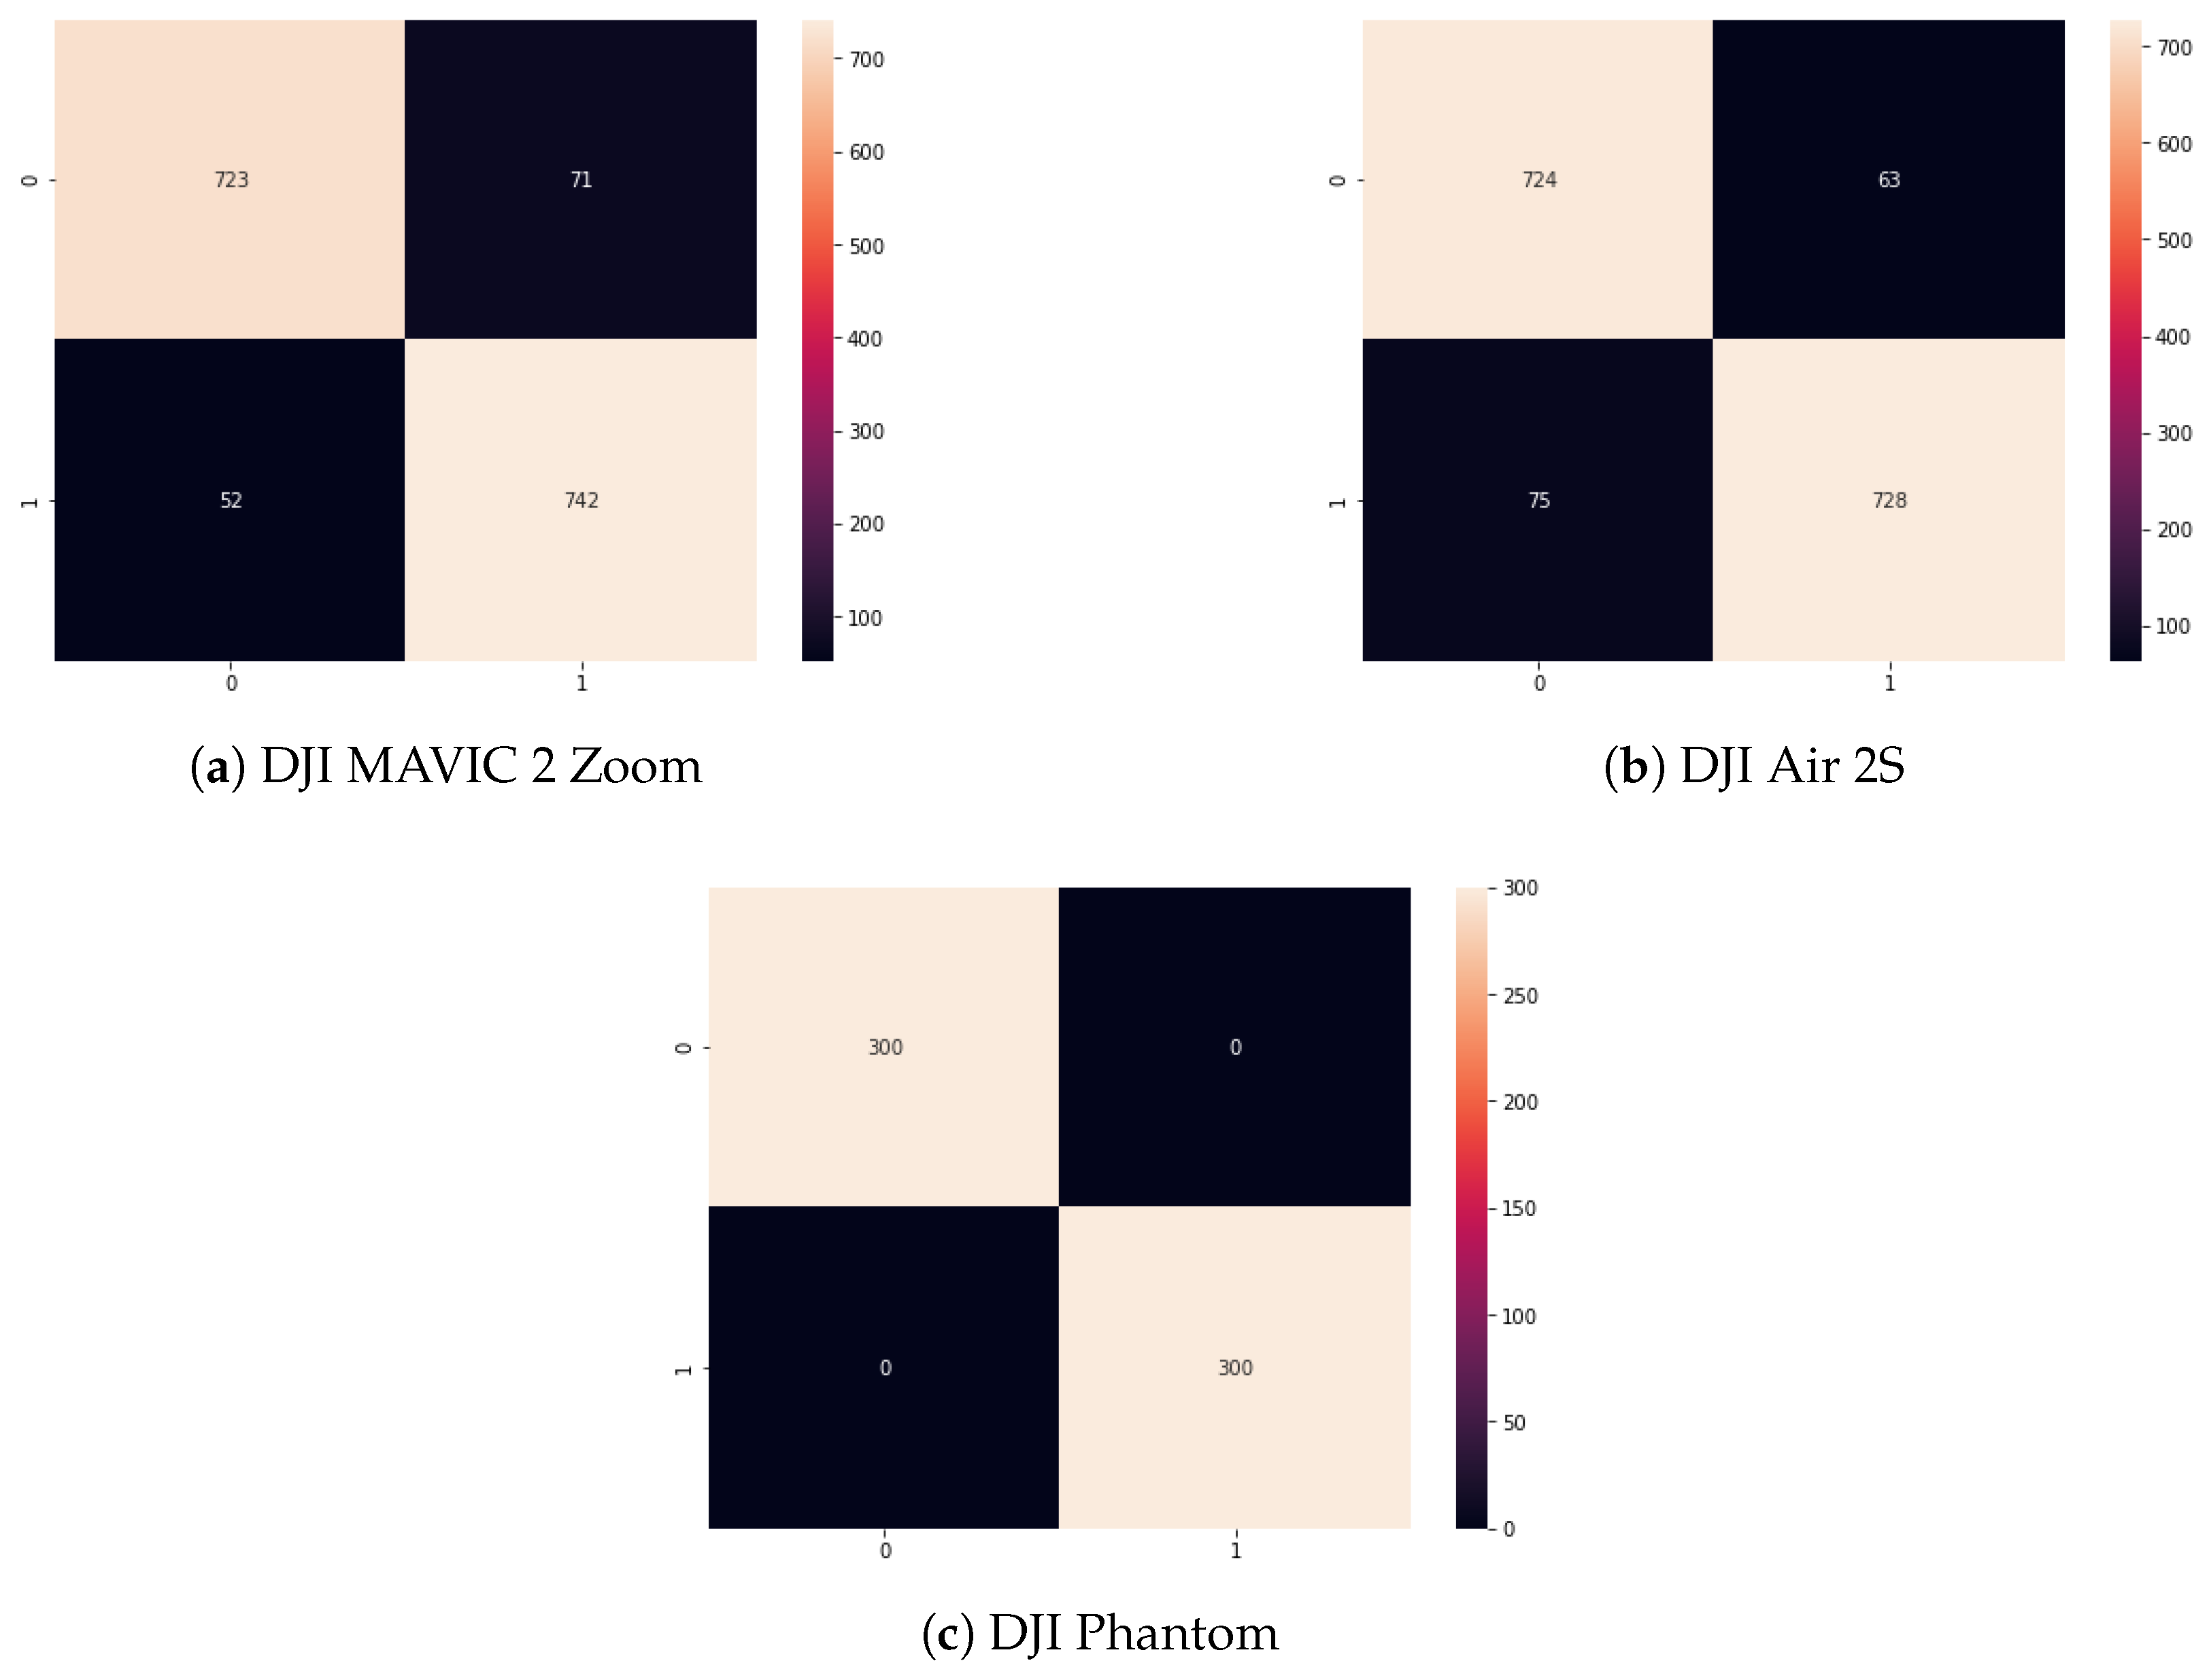
When two UAVs operate simultaneously, this approach successfully allocates the detected signal frames to the corresponding drone without misassociation errors. This high level of accuracy is facilitated by the stability of the UAV’s unique communication characteristics when tested in a controlled, anechoic chamber environment. The controlled testing environment minimizes external noise and interference, allowing the identification process to rely solely on each UAV signal’s stable and predictable characteristics. However, in the context of the RC’s communication signals during outside experimentation, there is a minor observed error rate of
, which is distributed between the DJI MAVIC 2 Zoom and the DJI Air 2S. The MAVIC 2 Zoom error rate is 7.8%, and the DJI Air 2S error rate is 8.7%. The confusion matrices are shown in
Figure 7.
This suggests that while the UAV’s signal properties are stable and consistent, the remote controller’s signals are more prone to variability or overlap, resulting in occasional misassociation. This percentage quantifies the probability of errors occurring during the association of remote controller communication signals.