Abstract
In this study, we investigated the curing kinetics of the epoxy system formed by the epoxy resin Diglycidyl ether of bisphenol A, Isophorone diamine hardener (IPD), and the thermoplastic modification agent Acrylonitrile butadiene styrene or ABS. The introduction of a third component, in this case ABS, has been carried out to improve the application of this system in waterproofing and use of paints, as well as improving resistance to the impact of this type of systems. In addition, obtaining kinetic and respective parameters will allow us to identify the properties and gain knowledge of possible applications in the industry. In particular, it is intended to reach a kinetic equation that is capable of describing variation in the reaction rate according to the degree of curing for the entire range of conversions, starting from the model proposed by Kamal et al.
1. Introduction
Curing reactions of epoxy systems with amines are exothermic, therefore, we used differential scanning calorimetry (DSC) as the main technique for determining the heat of the curing process. Kinetic parameters and the activation energies corresponding to the two reaction mechanisms (Autocatalytic and n-order) were determined. We also study the dependence of temperature according to the Arrhenius equation and the reaction order that is defined by two coefficients m and n (corresponding to the autocatalytic reaction and n-order, respectively). As the reaction progresses, it is expected that the degree of crosslinking will increase and consequently the reaction will be slower. This will be possible because such crosslinking prevents reactive molecules from coming into contact with the same facility. Therefore, chemical kinetic stops, because of reaction mechanisms are controlled by diffusion that increases in the final stages of curing. This diffusion control is so-called diffusion factor, which will be the function of the conversion, and has values from one (initial stages) to zero (when the reaction stops). Therefore, the coefficients that reflect this diffusion factor will be determined, hoping that the kinetic equation is perfectly defined.
2. Experimental
2.1. Materials
The epoxy resin is a commercially available DGEBA (n = 0) (Resin 332, Sigma Chemical Co., St. Louis, MO, USA), with an equivalent molecular mass of 173.6 g eq−1. Isophorone diamine (IPD) was chosen as a curing agent for this study, since it has been demonstrated in previous studies to have good reactivity with the resin BADGE (n = 0) [1,2,3]. IPD was purchased from Sigma-Aldrich Chemie, GmbH, Darmstadt, Germany. In this study, we used a Polyacrylonitrile-co-butadiene-co-styre (ABS) to lower the material’s viscosity. This thermoplastic was purchased from Sigma-Aldrich.
2.2. Samples Preparations
One g of epoxy resin (BADGE n = 0), 0.2 g of ABS, and a quantity stoichiometric of m-XDA (0.98 g) were carefully and homogeneously mixed at room temperature. In the second step, a sample of this mixture (typically 4–7 mg) was encapsulated in aluminum pans for the differential scanning calorimeter (DSC Q20) analysis. A heat flow calorimeter from the company TA, model DSC Q20, was used. We perform a dynamic calorimetric scan from −30 °C to 250 °C at a heating rate of 10 °C/minute to determine the total heat of curing reaction (ΔH0). A second scan from 10–200 °C at the same heating rate was performed to determine the glass transition temperature (Tg). Finally the samples were cured at different isothermal temperatures (from 40 °C to 70 °C). The isothermal reaction heats (ΔHT) were used to obtain kinetic and diffusion parameters.
3. Results and Discussion
The reaction rate of an epoxy system can be expressed by the contribution of two mechanisms: nth order and autocatalytic. Assuming stoichiometric proportions and equal reactivity for all amine hydrogen, the reaction rate using the Sourour and Kamal [4] kinetic model can be expressed:
where k1 and k2 are constants of two reactions, m and n are parameters related to the reaction orders for the autocatalytic reaction and n-order paths, respectively.
The critical conversion (αc), conversion at the beginning of the diffusion, for the formation of the network can be used to calculate the critical fraction free volume at which the curing reaction becomes diffusion controlled. A semiempirical model based on free volume considerations proposed by Chern and Polheim [5] was used to study the diffusion controlled reaction rate. This equation can be expressed as:
where A1 is an adjustable parameter.
The total heat of reaction (ΔH0) and the glass transition temperature (Tg) for the curing process are shown in Table 1.

Table 1.
Enthalpy changes and glass transition temperatures.
The degree of conversion at different temperatures (40, 50, 60, and 70 °C) has been calculated using the following expression:
These temperatures were chosen because they were close to the glass transition temperature.
Table 2 shows the enthalpies and the degree of conversion at different isothermal temperatures.
Table 2.
Values of enthalpy changes and conversion at different isothermal temperatures.
Analyzing these last values, the maximum value of degree of conversion being observed at 70 °C corresponds to higher conversion. It can also be seen in Table 2 that as the temperature decreases conversion also decreases. A similar behavior is observed in epoxy systems without ABS [6].
The kinetic model was made to fit plots of reaction rates vs. conversion at different isothermal temperatures. Table 3 shows constant rates and reaction orders for nth order and autocatalytic paths at different isothermal temperatures.
Table 3.
Values of k1 and k2 and reaction order for nth and autocatalyzed mechanism at different isothermal temperatures.
Table 3 shows that the reaction order is 2 and that the reaction rate of the autocatalytic mechanism for each temperature is higher than for the n-order.
With the values obtained from k1, k2, m, and n, the model can be extrapolated from α = 0 to α = 1. The reaction rate values obtained experimentally can be compared with those expected by the Kamal model. Figure 1 shows reaction rate versus conversion for experimental and Kamal model data at 70 °C. We can clearly compare the effect of the diffusion control over reaction rate. If the curing was controlled throughout the conversion interval by the mechanisms of the chemical kinetics, the reaction rate would follow the experimental curve for all conversion range.
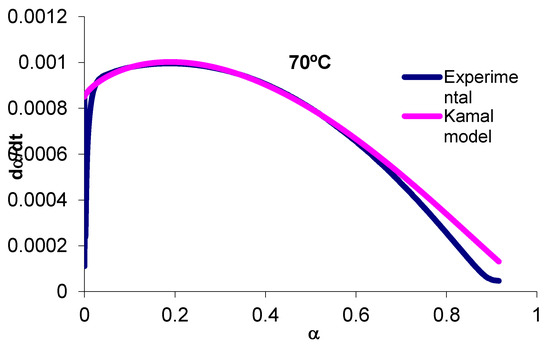
Figure 1.
Plot of the reaction rate versus α at 70 °C.
Using the diffusion factor F(α) the reaction rate can be expressed in the following form to account for effects of diffusion:
Table 4 shows the diffusion parameters at different isothermal temperatures.
Table 4.
Diffusion parameters at different isothermal temperatures.
Critical conversion, αc, depends on temperature very clearly, because as the curing temperatures approach the glass transition temperature, the effects of gelation appear later. The values obtained are in good agreement with those obtained for similar systems [1,2].
Figure 2 show F(α) versus conversion for different curing temperatures, as well as the fitting to obtain diffusion parameters.
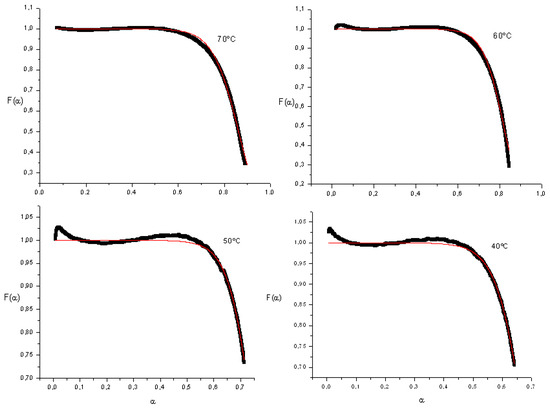
Figure 2.
Diffusion factor versus conversion.
In the reaction’s initial stages, where chemical kinetics control mechanism, the diffusion factor remains constant. As the diffusion effect is present, the diffusion value will approach zero. Decrease in the diffusion value begins at higher conversion values (around the value of the critical conversion as the curing temperature increases).
Figure 3 shows the reaction rate versus conversion at 60 °C, and the experimental results are compared with those obtained with the chemical kinetic model and with the kinetic model accounting for diffusion. The agreement is extremely good between the experimental results and kinetic model accounting for diffusion.
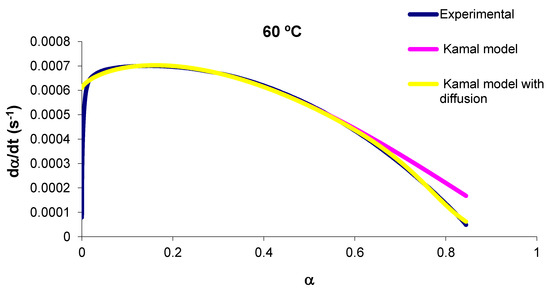
Figure 3.
Plot of the reaction rate versus α at 90 °C.
On the basis of Table 3, the activation energies corresponding to the n-order and autocatalytic paths have been obtained from an Arrhenius plot of ln k versus 1000/T (where k is the specific reaction rate and T is the absolute temperature), and they are shown in Table 5.
Table 5.
Activation energies corresponding to the n-order and autocatalytic paths.
This table shows the proximity of the activation energies, which suggests that the curing reaction could be represented by a global activation energy. The autocatalytic Ea is slightly lower than the EA order n, so we believe that impurities act as good catalysts. This data are approximately one third of the value that the activation energies would have in case of working without ABS.
4. Conclusions
The total heat of a curing reaction and the glass transition temperature of the system were determined by Differential Scanning Calorimetry, obtaining the values of 397.6 J/g and 69.93 °C, respectively. The values obtained without filler are 482.5 J/g and 105.6 °C, respectively. A comparison between these values with an epoxy system without ABS (BADGE (n = 0)/IPD) shows that the total heat of reaction decreases around 27.28% and the glass transition temperature decreases (17.83%). It has been determined a kinetic model that describes the behavior of the curing reaction of the BADGE system (n = 0)/IPD/ABS for all conversion ranges, and both in the initial stages of the reaction where the chemical kinetics is the predominant mechanism as in the last stages, where the reaction is dominated by the diffusion mechanism. A diffusion factor model has been included to quantify the diffusion control. The activation energies of the mechanisms involved in the curing reaction were estimated. The obtained values are 39.3 kJ/mol and 40.9 kJ/mol for the autocatalytic and n-order mechanism, respectively. These results suggest that the cure reaction could be represented by unique activation energy. Besides the values of activation energies for the system without ABS are higher than the epoxy system with ABS, so this lower activation energy facilitates the formation of the activated complex.
References
- Núñez, L.; Fraga, F.; Núñez, M.R.; Villanueva, M. Effects of diffusion on the kinetic study and TTT cure diagram for an epoxy/diamine system. J. Appl. Polym. Sci. 1998, 70, 1931–1938. [Google Scholar] [CrossRef]
- Núñez, L.; Fraga, F.; Núñez, M.R.; Castro, A.; Fraga, L. Effects of diffusion on the kinetic study of the system BADGE n = 0/m-xylylenediamine. J. Appl. Polym. Sci. 1999, 74, 2997–3005. [Google Scholar] [CrossRef]
- Núñez, L.; Fraga, F.; Fraga, L.; Castro, A. Kinetic study of the epoxy system BADGE n = 0/IPD/ABS. J. Appl. Polym. Sci. 1997, 63, 635. [Google Scholar] [CrossRef]
- Sourour, S.; Kamal, M.R. Differential scanning calorimetry of epoxy cure: Isothermal cure kinetics. Thermochim. Acta 1976, 14, 41–59. [Google Scholar] [CrossRef]
- Chern, C.S.; Pholein, G.W. A kinetic model for curing reactions of epoxides with amines. Polym. Eng. Sci. 1987, 27, 788–795. [Google Scholar] [CrossRef]
- Fraga, F.; Penas, M.; Castro, C.; Rodríguez-Núñez, E.; Martínez-Ageitos, J.M. Cure kinetics of a diglycidyl ether of bisphenol a epoxy network (n = 0) with isophorone diamine. J. Appl. Polym. Sci. 2007, 106, 4169–4173. [Google Scholar] [CrossRef]
© 2018 by the authors. Licensee MDPI, Basel, Switzerland. This article is an open access article distributed under the terms and conditions of the Creative Commons Attribution (CC BY) license (https://creativecommons.org/licenses/by/4.0/).