Proceeding Paper

Evaluation of Starch Hydrolysis for Glycemic Index Prediction of Rice Varieties †

1
National Institute for Agricultural and Veterinary Research (INIAV), I.P., Av. da República, 2780-157 Oeiras, Portugal
2
CBIOS-ULTH, Research Center for Biosciences and Health Technologies, Universidade Lusófona de Humanidades e Tecnologias, Campo Grande 376, 1740-024 Lisboa, Portugal
3
CEDOC, NOVA Medical School, Faculdade de Ciências Médicas, Universidade NOVA de Lisboa, Campo dos Mártires da Pátria, 130, 1169-056 Lisboa, Portugal
4
Faculty of Sciences and Technology (FCT) & Centre for Mathematics and Applications (CMA), NOVA, University of Lisbon, 2829-516 Caparica, Portugal
5
iBET, Institute of Experimental Biology and Technology, Av. da República, Apartado 12, 2781-901 Oeiras, Portugal
6
ITQB NOVA, Instituto de Tecnologia Química e Biológica António Xavier, Av. da República, 2780-157 Oeiras, Portugal
7
GREEN-IT Bioresources for Sustainability, ITQB NOVA, Av. da República, 2780-157 Oeiras, Portugal
*
Author to whom correspondence should be addressed.
Presented at the 1st International Electronic Conference on Food Science and Functional Foods, 10–25 November 2020; Available online: https://foods_2020.sciforum.net/.
Proceedings 2021, 70(1), 101; https://doi.org/10.3390/foods_2020-07643
Published: 9 November 2020

Abstract

:
Rice consumed as white cooked polished grain has been considered a high glycemic index (GI) food, particularly compared with other starchy foods. However, the GI levels of rice based food can vary among different rice types and food processing technologies. Rice GI variation can be affected by several factors, such as rice variety, the genetic background of rice as well as due to crop edaphoclimatic conditions. The main difference in rice starch composition that influences GI is the amylose content. Besides the chemical composition of rice, the gelatinization characteristics and food processing can also contribute to starch retrogradation, thus increasing the level of resistant starch with a great influence on GI. To understand the glycemic response of rice types differing in amylose and viscosity profiles, four rice samples were analyzed and compared with standard and resistant HI-MAIZE corn starches. An in vitro enzymatic starch hydrolysis procedure was applied to estimate GI. The results indicate substantial differences in the starch hydrolysis of the two corn starches. Starch hydrolysis tended to be more rapid and efficient for ‘Waxy’ and ‘Ceres’ (intermediate-amylose) rice types than for ‘Maçarico’ (high-amylose rice). In addition, the data show that the Maçarico variety has the lowest estimated GI and the highest retrogradation rate compared with ‘Waxy’, ‘Ceres’ and ‘Basmati’ type. The results obtained reinforce the importance of knowing amylose content and viscosity profiles for the prediction of rice glycemic responses.

1. Introduction

Rice, one of the staple foods of the world’s population, is consumed as white cooked polished grain and has been considered a high glycemic index (GI) food (64–93%) [1]. Because rice is a fundamental food in our diet, it is imperative to evaluate its characteristics, which can differ among different rice varieties. As such, all studies are essential to improve the nutritional characteristics of rice, together with the active search for new varieties with better quality and healthier characteristics. The glycemic index (GI) is a measure of the glucose response to the intake of a fixed amount of carbohydrates available in the food [2] and can be determined in vivo [3] or extrapolated by in vitro methods assessing the rate of digestion. There are several factors that influence the GI of foods, such as the type of sugar, starch and its amylose/amylopectin ratio, and the genetic background or crop edaphoclimatic conditions [4,5,6]. In the case of rice varieties, the differences on GI have been reported and established by important factors such as amylose content, resistant starch and gelatinization characteristics, which can be predictors of starch digestion rate [7,8,9]. Amylose content is the main difference in rice starch composition that influence GI, their linear structure hamper the action of amylolytic enzymes and is more resistant to digestion than amylopectin that has a branched structure. So, high-amylose rice varieties were reported to have lower glycemic values than low-amylose varieties. There are even some studies that prove the positive correlation with the resistant starch content in the sample with low GI [8,9]. Amylose content is directly related to increased viscosity parameters [10]. Rice starch retrogradation can have a positive influence on decreasing starch digestibility increasing the resistant starch. This occurs because starch granule reorganization through hydrogen bonds increases the resistance to digestive enzymes, becoming more difficult to hydrolyze the starch [11,12,13,14]. This process is greatly influenced by food processing, such as parboiling technology and the cooking method.
As such, the main aim of this study was to understand the glycemic response of rice from different samples (‘Basmati’, ‘Ceres’, ‘Maçarico’ and ‘Waxy’) which differ in some of the parameters related to the extension of starch hydrolysis such as amylose and viscosity profiles.

2. Material and Methods

2.1. Samples

Four different rice samples were analysed: two Portuguese rice varieties (Ceres and Maçarico) and two commercial rice types (Basmati and a glutinous rice—Waxy), which were compared with two standard corn starches (S4126, Sigma Aldrich, USA) and resistant corn starch, HI-MAIZE (1043, National Starch and Food Innovation, Hamburg, Germany). The two varieties were recently released by the Portuguese Rice Breeding Program, Ceres (Japonica type) and Maçarico (Indica type).

2.2. Amylose Content

The determination of amylose content was based on the standard iodine colorimeric method according ISO 6647-2:2015 [15].

2.3. Rapid Visco Analyzer (RVA) Measurement

Gelatinization and pasting profiles of white rice flours were determined through a rapid visco analyzer (RVA, Newport Scientific, Warriewood, Australia), with the software Thermocline for Windows (TCW) according to the AACC method 76-21. Each rice flour sample (3–4 g) was mixed with 24–25 g distilled water and was measured on a dry weight (dw) basis. Peak, minimum (trough), maximum and final viscosities were obtained through a curve resulting from a cycle of heating, cooling and stirring a suspension of flour in water. The samples were kept at 50 °C for 1 min, heated at 12 °C/min to 95 °C, kept at 95 °C for 2.5 min and cooled to 12 °C/min at 50 °C for 3 min. The determination was performed at a speed of 960 rpm in the first 10 s and then at 160 rpm.

2.4. In Vitro Kinetics of Starch Digestion

The starch digestibility and estimated GI was measured using a modified method suggested by Goni et al. (1997) [16]. White rice flour (50 mg) was just homogenized in distilled water and was immediately followed by the process of enzyme addition to start the starch digestion. Finally, the glucose content was measured using a glucose oxidase peroxidase kit (K-GLUC, Megazyme). Glucose was converted into starch by multiplying with 0.9. The rate of starch digestion was expressed as a percentage of the total starch hydrolyzed at different times (0, 5, 10, 30, and 60 min). The kinetics of starch digestion was estimated by non-linear equations; the first equation and second equation are as follows:
C = C∞ (1 − e −kt)
AUC =   =   C   ( t f     t 0 )   +   C k   ( e kt f e kt 0 ) ]
where C corresponds to the percentage of starch hydrolyzed at time t, C∞ is the equilibrium percentage of starch hydrolyzed after 60 min, k is the kinetic constant and t is the chosen time (min). Given pairs of points (yi, ti), the kinetic constants C∞ and k can be obtained by the minimization of the error sum of squares. Once the kinetic equation constants are estimated, Goni et al. (1997) computes the AUC (area under the hydrolysis curve) as the integral (Equation (2)) of the kinetic equation in the interval [t0, tf]. The hydrolysis index (HI) was obtained by dividing the AUC sample by the AUC reference sample (corn starch). With HI determines the predicted glycemic index (GI) using a model (Equation (3)):
GI = 39.6207 + (0.5498 × HI)

3. Results and Discussion

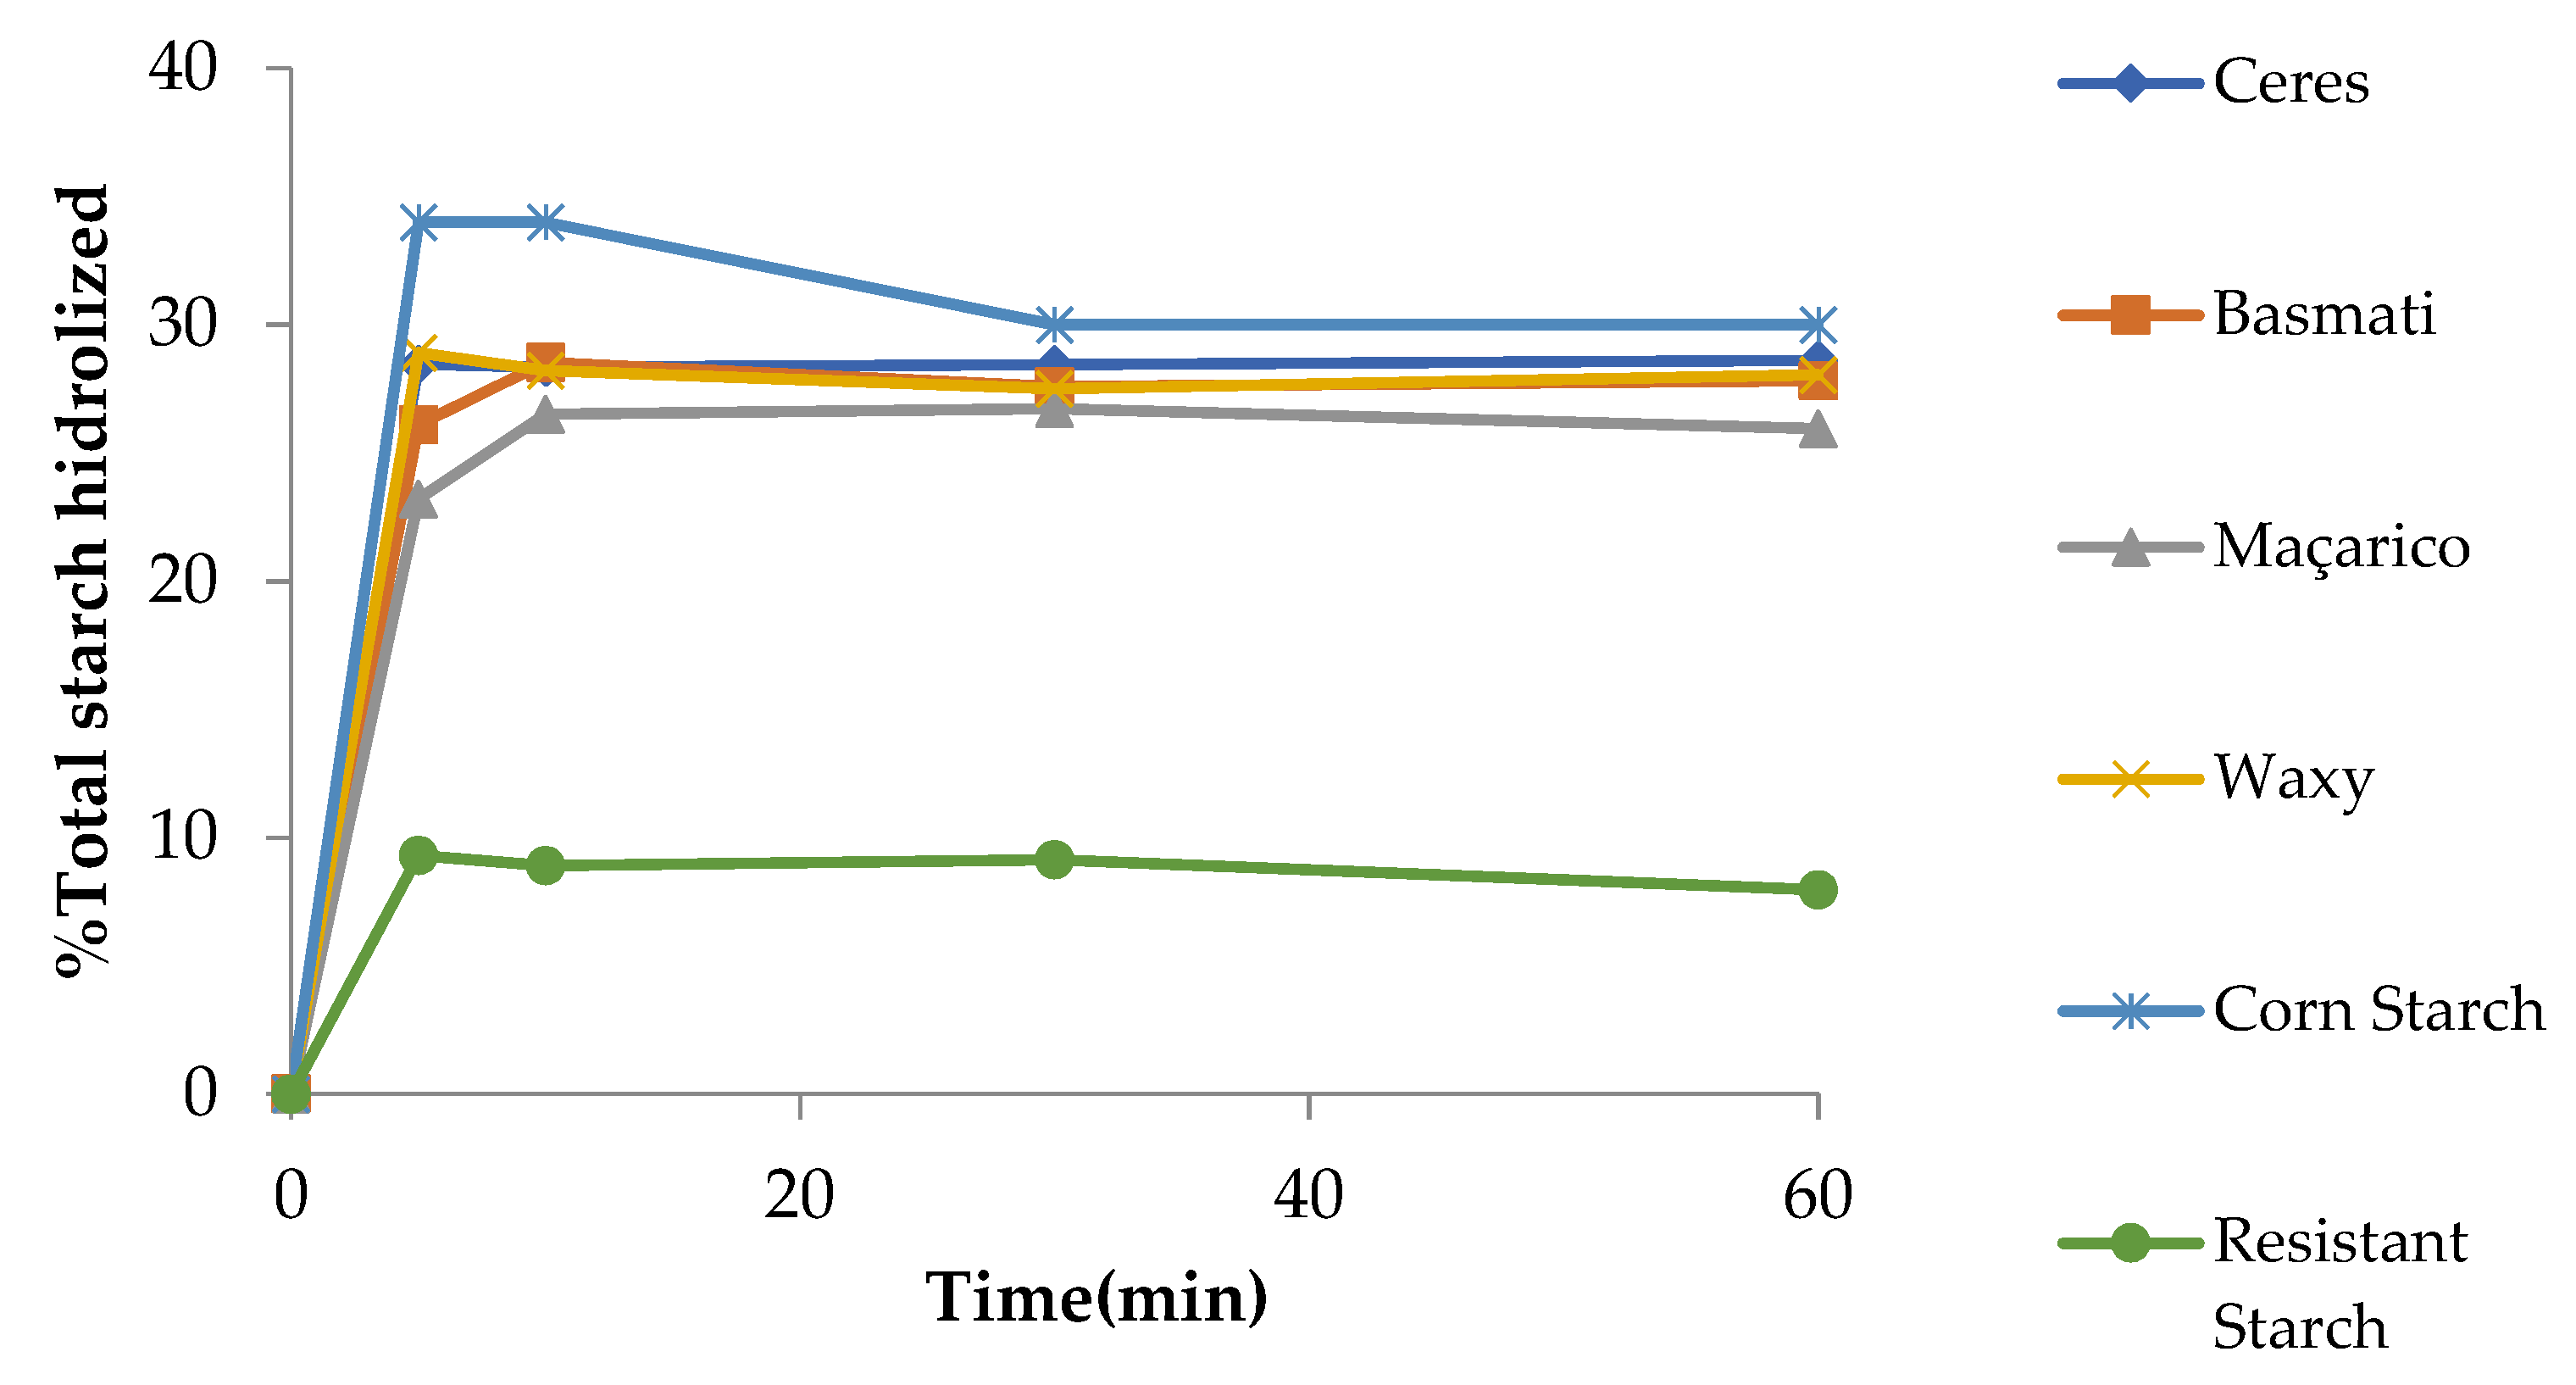
3.1. In Vitro Starch Hydrolysis Rate Compared with Corn Starches and Estimated GI

In order to prove the effectiveness and usefulness of this in vitro digestion method to GI estimate, the samples were selected based on knowing relationships associated with GI variation, defined in the literature. For this purpose, two starches from corn were selected as standards and four varieties of rice were selected according to the amylose and pasting parameters data variability. As expected, in Figure 1, there was a wide variation, with significant differences between the normal corn starch hydrolysis curve (higher hydrolysis rate and GI = 94.6, Table 1) and the resistant starch corn starch hydrolysis curve (the lower hydrolysis rate and GI = 54.8). These two standards curves and associated GI are the expected highest and lowest limits for the rice flour samples. Although the hydrolysis curves of all the rice samples are not very different (GI from 83.71 to 88.49), it was possible to establish significant differences between the different rice types. Ceres rice has the highest rate of hydrolysis of starch, and Maçarico rice has the lowest rate of hydrolysis, which was later reflected in the final GI of each sample. In addition, the values obtained for the estimated glycemic index of rice samples are according with expectations, and are in the same range as those reported in the literature [5,9,16,17]. Thus, the results obtained show the effectiveness of the method, proving that it is a useful and simple method, which can be used in a first rapid screening for GI estimation of rice varieties.

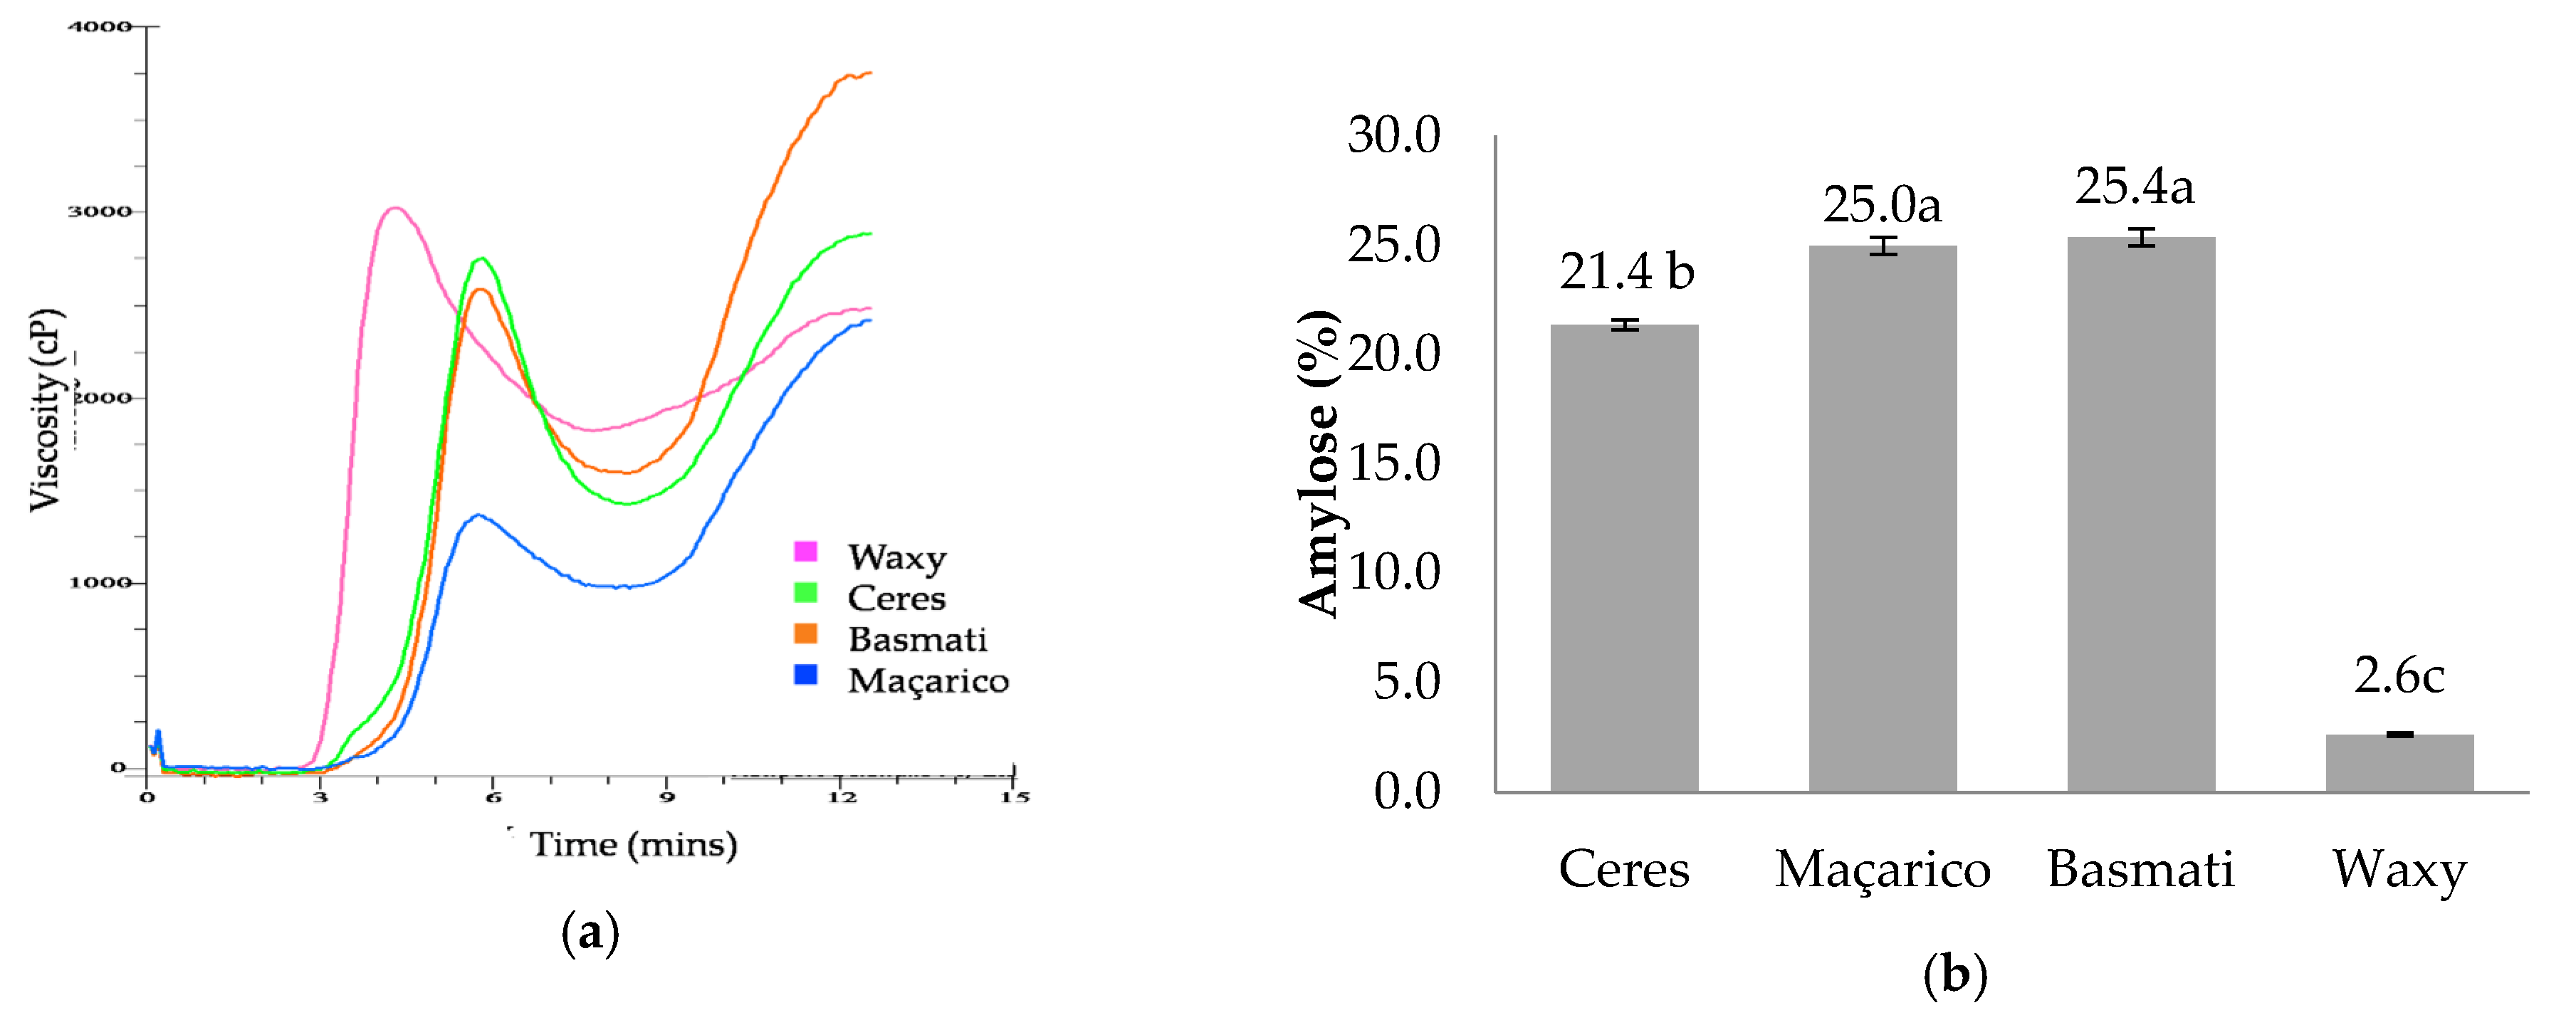
3.2. Variation in the GI of Rice Samples and Its Relation with Amylose Content

The amylose rice content (Figure 2b) indicates a significant variation between rice samples (exception between Basmati and Maçarico varieties). The two samples with the highest amylose content, Basmati (25.4%) and Maçarico (25.0%), also have the lowest GI (86.6 and 83.7, respectively). These data show the influence of amylose content on starch hydrolysis and thus on the GI; however, the overall correlation was not positive. Despite the lower number of varieties analyzed, the relationship is evidently reflected too in differences occurring in the low/intermediate and high amylose rice samples. The Ceres sample with intermediate amylose content (21.4%) and the Waxy sample with the lowest amylose value (2.6%) both presented a high glycemic response. The amylose content is not the only factor to affect starch digestibility; the specific proteins and other compounds can affect the viscosity characteristics and the starch hydrolysis.

3.3. Variation in the GI of Rice Samples and Its Relation with Viscosity Profiles

Table 1 gives the values for paste viscosity parameters and the estimated glycemic index (GI) of rice samples. The paste viscosity parameters analyzed were peak (peak viscosity), trough (minimum viscosity), breakdown viscosity (difference between maximum viscosity and minimum viscosity) and the final viscosity (after retrogradation).
Waxy rice has the maximum peak viscosity compared to the other samples with a significant difference, which means that it has a greater gelatinization capacity than the other samples. There was also great variability in the estimated glycemic index between the rice samples except between Ceres and Waxy varieties. Maçarico shows the lowest viscosity profile (Figure 2a) and corresponds to the variety with the lowest hydrolysis curve starch, following the hydrolysis curve of the resistant starch (Figure 1) and showing the lowest estimated glycemic index of the rice varieties analyzed. RVA parameters’ peak, trough and breakdown have a positive correlation with the GI (0.96, 0.82 and 0.99).

4. Conclusions

The present work describes a simple in vitro method for predicting the GI of different rice samples and also finds possible correlations with other parameters, such as amylose content and gelatinization profiles. The results obtained support the use of the starch hydrolysis method for rice GI estimation. The rice varieties with higher amylose contents and lower pasting profiles exhibit lower GIs compared with the Waxy and intermediate amylose varieties.

Funding

This research received financial support from TRACE-RICE—tracing rice and valorizing side streams along Mediterranean blockchain, grant n°1934, (call 2019, Section 1 Agrofood) of the PRIMA Programme supported under Horizon 2020, the European Union’s Framework Programme for Research and Innovation.

Conflicts of Interest

The authors declare no conflict of interest.

References

  1. Hu, J.; La Vecchia, C.; Augustin, L.S.; Negri, E.; de Groh, M.; Morrison, H. Glycemic index, glycemic load and cancer risk. Ann. Oncol. 2013, 24, 245, 251. [Google Scholar] [CrossRef] [PubMed]
  2. Thilakavathy, S.; Pandeeswari, N.K. The glycemic index—A science based diet. Int. J. Pharm. Med. Biol. Sci. 2012, 1, 259–265. [Google Scholar]
  3. ISO 26642:2010. Food Products—Determination of the Glycaemic Index (GI) and Recommendation for Food Classification; International Organization of Standardization: Geneva, Switzerland, 2010. [Google Scholar]
  4. Anacleto, R.; Badoni, S.; Parween, S.; Butardo, V.M.; Misra, G.; Cuevas, R.P.; Kuhlmann, M.; Trinidad, T.P.; Mallilin, A.C.; Acuin, C.; et al. ntegrating a genome-wide association study with a large-scale transcriptome analysis to predict genetic regions influencing the glycaemic index and texture in rice. Plant Biotechnol. J. 2019, 17, 1261–1275. [Google Scholar] [CrossRef] [PubMed]
  5. Frei, M.; Siddhuraju, P.; Becker, K. Studies on the in vitro starch digestibility and the glycemic index of six different indigenous rice cultivars from the Philippines. Food Chem. 2003, 83, 395–402. [Google Scholar] [CrossRef]
  6. Jenkins, D.J.; Kendall, C.W.; Augustin, L.S.; Franceschi, S.; Hamidi, M.; Marchie, A. Glycemic index: Overview of implications in health and disease. Am. J. Clin. Nutr. 2002, 76, 266–273. [Google Scholar] [CrossRef]
  7. Chang, U.J.; Hong, Y.H.; Jung, E.Y.; Suh, H.J. Overview of rice and health: Rice and the Glycemic Index. In Wheat and Rice in Disease Prevention and Health, 1 st ed.; Publisher: Elsevier: London, 2014; Volume 27, pp. 357–363. [Google Scholar]
  8. Kumar, A.; Sahoo, U.; Baisakha, B.; Okpani, O.A.; Ngangkham, U.; Parameswaran, C.; Basak, N.; Kumar, G.; Sharma, S.G. Resistant starch could be decisive in determining the glycemic index of rice cultivars. J. Cereal Sci. 2018, 79, 348–353. [Google Scholar] [CrossRef]
  9. Hu, P.; Zhao, H.; Duan, Z.; Linlin, Z.; Wu, D. Starch digestibility and the estimated glycemic score of different types of rice differing in amylose contents. J. Cereal Sci. 2004, 40, 231, 237. [Google Scholar] [CrossRef]
  10. Wani, I.; Sogi, D.; Wani, A.; Gill, B. Physico-chemical and functional properties of flours from Indian kidney bean (Phaseolus vulgaris L.) cultivars. LWT-Food Sci. Technol. 2013, 53, 278–284. [Google Scholar] [CrossRef]
  11. Chiu, C.J.; Liu, S.; Willett, W.C.; Wolever, T. Informing food choices and health outcomes by use of the dietary glycemic index. Nutr. Rev. 2011, 69, 231–242. [Google Scholar] [CrossRef] [PubMed]
  12. Foster-Powell, K.; Holt, S.H.A.; Brand-Miller, J.C. International table of glycemic index and glycemic load values. Am. J. Clin. Nutr. 2002, 76, 5–56. [Google Scholar] [CrossRef] [PubMed]
  13. Jain, A.; Rao, S.M.; Sethi, S.; Ramesh, A.; Tiwari, S.; Mandal, S.K.; Singh, N.K.; Modi, N.; Bansal, V.; Kalaichelvani, C. Effect of cooking on amylose content of rice. Eur. J. Exp. Biol. 2012, 2, 385–388. [Google Scholar]
  14. Nugent, A. Health properties of resistant starch. Nutr. Bull. 2005, 30, 27–54. [Google Scholar] [CrossRef]
  15. ISO 6647-2:2015. Rice—Determination of Amylose Content—Part 2: Routine Method; International Organization of Standardization: Geneva, Switzerland, 2015. [Google Scholar]
  16. Goni, I.; Garcia-AIonso, A.; Saura-Calixto, F. A starch hydrolysis procedure to estimate glycemic index. Nutr. Res. 1997, 17, 427–437. [Google Scholar] [CrossRef]
  17. Deepa, G.; Singh, V.; Naidu, K.A. A comparative study on starch digestibility, glycemic index and resistant starch of pigmented (‘Njavara’ and ‘Jyothi’) and a non-pigmented (‘IR 64′) rice varieties. J. Food Sci. Technol. 2010, 47, 644–649. [Google Scholar] [CrossRef] [PubMed]
Figure 1. In vitro starch hydrolysis rate of rice samples and corn starches.
Proceedings 70 00101 g001
Figure 2. (a) RVA profiles and (b) amylose content of rice flours; values with different letters are significantly different (p < 0.05).
Proceedings 70 00101 g002
Table 1. Rapid Visco Analyzer (RVA) parameters and estimated glycemic index (GI) of rice flour samples.
TypesRVA ParametersEstimated GI (%)
PeakTroughBreakdownFinal Viscosity
Ceres2750 b1428 c1322 a2892 b88.49 b
Basmati2589 c1592 b997 c3755 a86.65 c
Maçarico1368 d977 d391 d2422 d83.71 d
Waxy3025 a1819 a1206 b2488 c88.20 b
Resistant starch 54.80 e
Corn starch 94.60 a
GI—estimated glycemic index; Different letters (a–e) within one column denote statistically significant differences (p < 0.05).
Publisher’s Note: MDPI stays neutral with regard to jurisdictional claims in published maps and institutional affiliations.

