1. Introduction
Dispenser printing is a means of printing e-textile circuits using a robotically actuated syringe and nozzle connected to a pneumatic pressure controller. This technique has a number of advantages. First, it is very easy to set and change the printed design; it is a direct-write technique, so all that is required is to change the robot’s program. This is not true of other printing techniques such as stencil or screen printing, which require an expensive screen to be fabricated for each design.
Dispenser printers are also capable of printing on a wide range of substrates. Because they use a non-contact process—the only thing to touch the substrate is the paste itself–printing on particularly delicate or adhesive materials is possible [
1]. Additionally, because the vertical position of the nozzle can be changed dynamically while printing, dispenser printing can be used on uneven substrates. These advantages make it possible to print, for example, over seams or on the medical dressings used for testing in this work.
A challenge remains, however, in accurately measuring the surface profile of a substrate so that the dispenser’s tool path can effectively compensate for height changes. There are a number of possible ways of doing this. The first is simply to position the nozzle above enough points in the design and move it slowly down until it appears to make contact with the substrate and record the position. While this method is sufficiently accurate, it is slow and cannot be automated with the Fisnar system used in this study (
Figure 1).
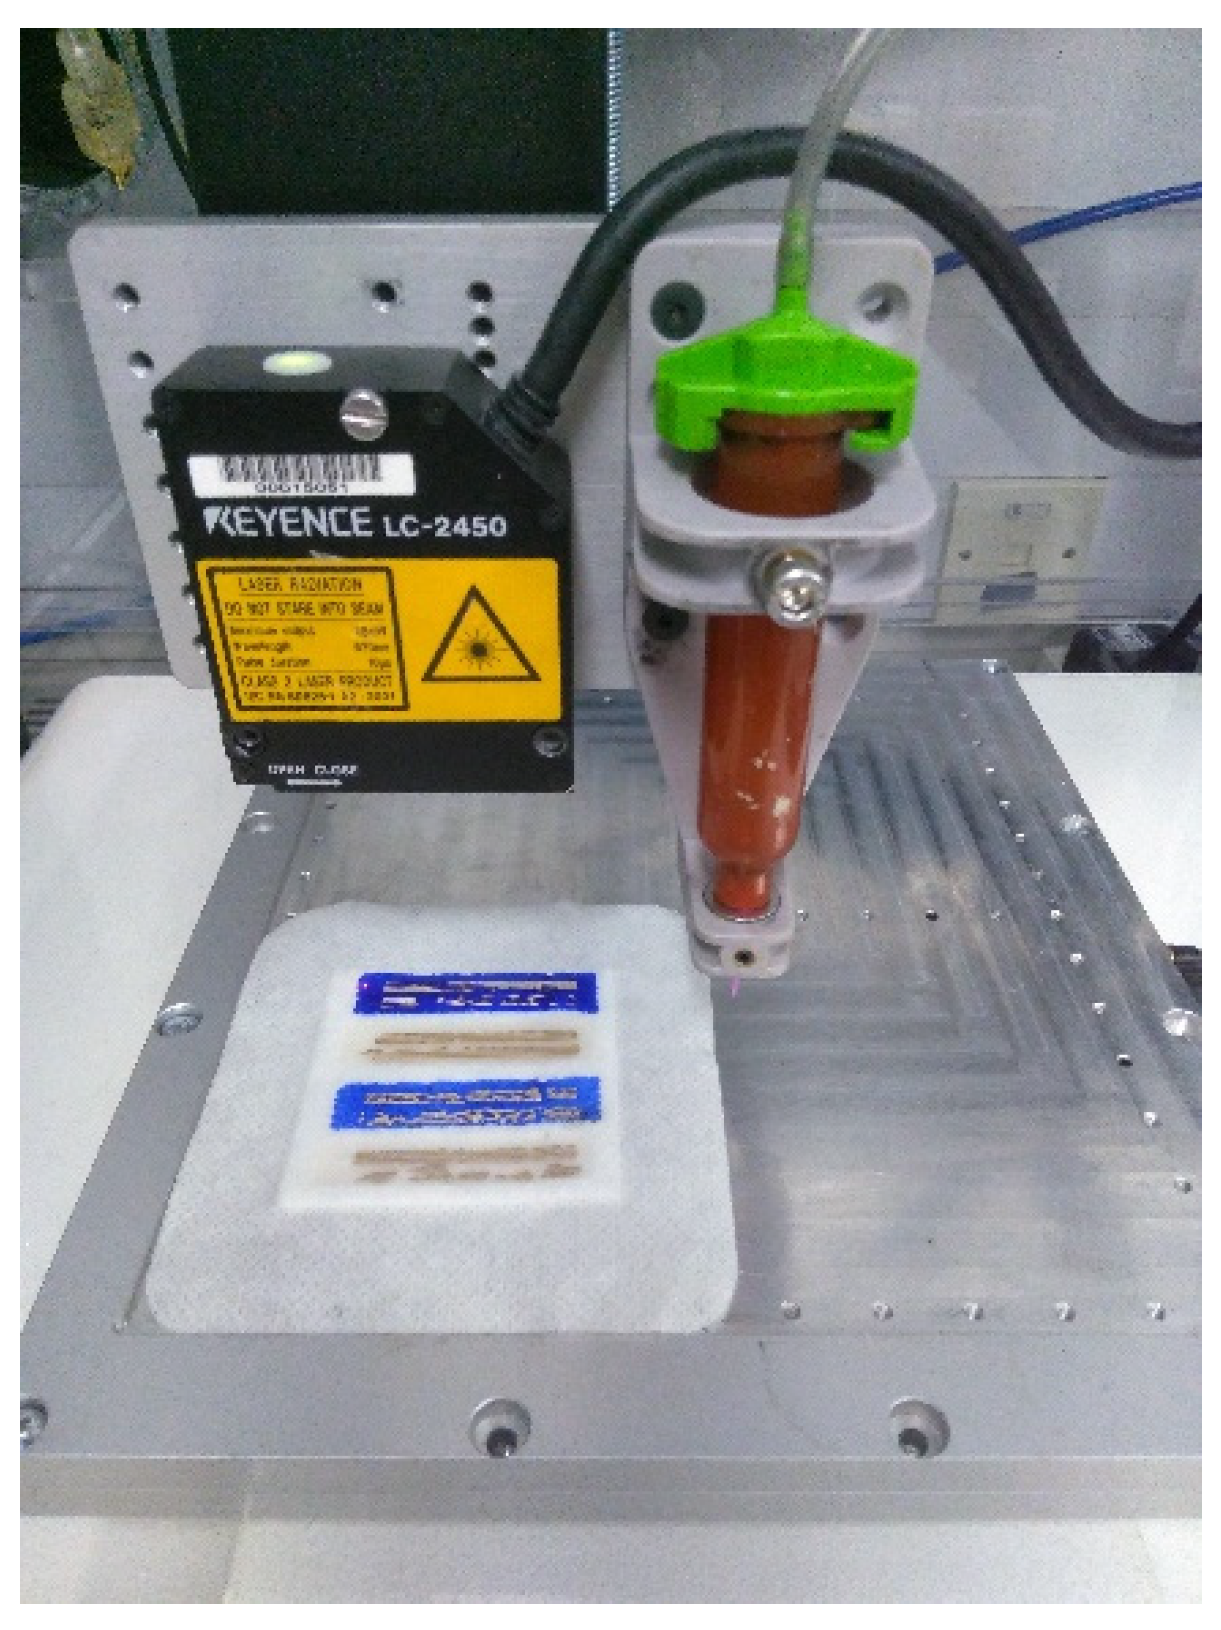
An alternative to this is using a laser displacement meter, as shown in
Figure 2. This is a device that can be attached to the head of the dispenser, that shines a laser down on to the substrate and measures the distance. This has the advantage that it can quickly and automatically measure a large number of points without touching the substrate surface.
The main problem with laser profiling, however, is that the laser needs to bounce cleanly off the surface of the substrate to give an accurate reading; if the laser penetrates into the material before bouncing back, the device will over-read the distance. This issue is particularly relevant when working with textiles as any textile with fibres that are not packed tightly together, for example, the absorbent padding of medical dressings, will allow light to penetrate into it. This is also true of the translucent interface layer, printed onto the textile to provide a smooth surface for the conductive pastes [
2].
The aim of this work was to investigate means of adapting the established dispenser printing process to allow for easy profiling of substrates so that changes in a substrate’s height can be compensated for quickly and automatically.
2. Method
In order to identify the available range of nozzle clearances that result in successful prints, a series of lines were printed using Smart Fabric Inks Ltd. Fabinks-TC-C4007 Silver polymer paste [
3] on polyimide (DuPont-Kapton) film. Kapton film provided a flat surface, completely parallel to the print bed that the silver paste could adhere to without the need for an interface layer. This setup removed as much uncertainty as possible for the nozzle height settings. The test lines were printed using a 30 gauge (0.16 mm inner diameter) nozzle, 35 kPa of pressure, and a print speed of 2 mm/s. Straight, 40 mm long lines were printed with nozzle heights ranging from 0 to 400 µm above the surface. These were then cured in a box oven at 120 °C for 3 minutes, and the trace resistances were measured with a multimeter.
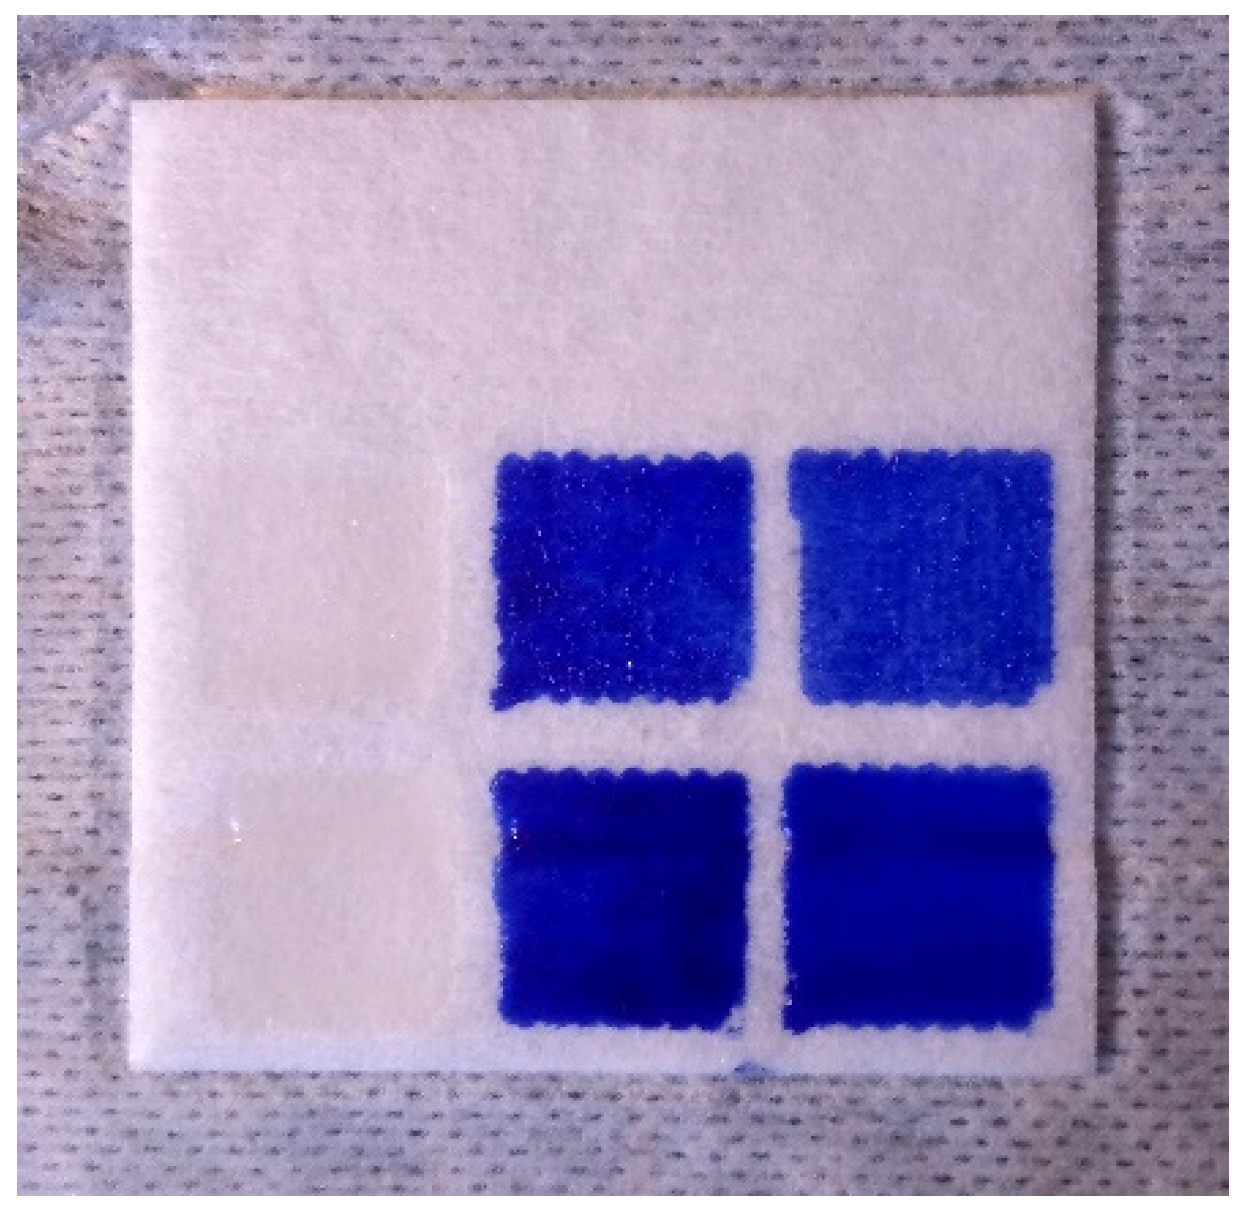
The accuracy of the laser at measuring the distance to the surface of an interface layer (Fabink-UV-IF1004) was tested on squares of interface containing different concentrations of blue dye. Six squares were used: two with no dye, two with 20 mg of dye per gram of interface, and two with 50 mg per gram of interface. One of each pair was a single layer of interface, and the other was two layers. These were cured for 3 minutes under 250 W, 380 nm wavelength UV light. The two-layer squares were made by printing and curing one layer completely, then printing and curing a second layer on top.
When measuring with the laser (a Keyence LC-2540), 9 points in grid, 0.2mm apart were measured; values more than 1.5 standard deviations from the mean were discarded, and the average taken of the measurements that remained. This was so that errors caused by local spots of poor reflection or the random distribution of fibres in the textile did not significantly affect the output.
The height of each interface square was measured by position the laser above it, recording the value and then moving the head across to an uncovered point on the printer bed and subtracting the value recorded there. The height difference recorded by the laser was then compared to the difference measured by manually moving a nozzle tip down to the surface and reading off the position. This nozzle contact method has a small error itself, repeatedly measuring the same point showed it varied by approximately 10 µm in most cases, but this depended on the surface and visibility. This error was always smaller than the laser’s, meaning that it did not invalidate the overall results. Moreover, because most laser systems can only give relative measurements, some nozzle contact measurement is always needed in order to derive the offset between the laser’s zero and the nozzle tip.
Using these two systems, the laser error for a particular surface was calculated as the difference between the height measured by the laser and the height measured by the nozzle.
Lastly, software was written to measure the height profile of the section of a substrate along the printing path of a design. The software then generates a three-dimensional tool path based on that data. This was used to print a series of three 40 mm test lines on strips of interface, both blue and clear, single- and double-layered, which were compared to lines printed at a fixed height.
3. Results and Discussion
The results of the Kapton test are shown in
Figure 3 and
Figure 4. It is clear from
Figure 3 that when the nozzle clearance is too large, the paste begins to build up on the nozzle and is deposited one drip at a time and so does not form a continuous path. If the clearance is too small, however, the paste is impeded from leaving the nozzle by the substrate itself. This results in less paste being deposited and a lower trace conductance.
Figure 4 shows that the best conductance is achieved by printing with 200 µm between the nozzle and the substrate. However, if the clearance moves above that, the conductance reduces very quickly. As such, the ideal clearance value will depend on the relative requirements of conductance and print reliability for a particular application. The results also show that the available clearance range for a print with good conductance is only from around 50 to 200 µm, meaning that, if a substrate’s surface varies in height by more than 150 µm, as many textile substrates do, some form of height compensation is necessary.
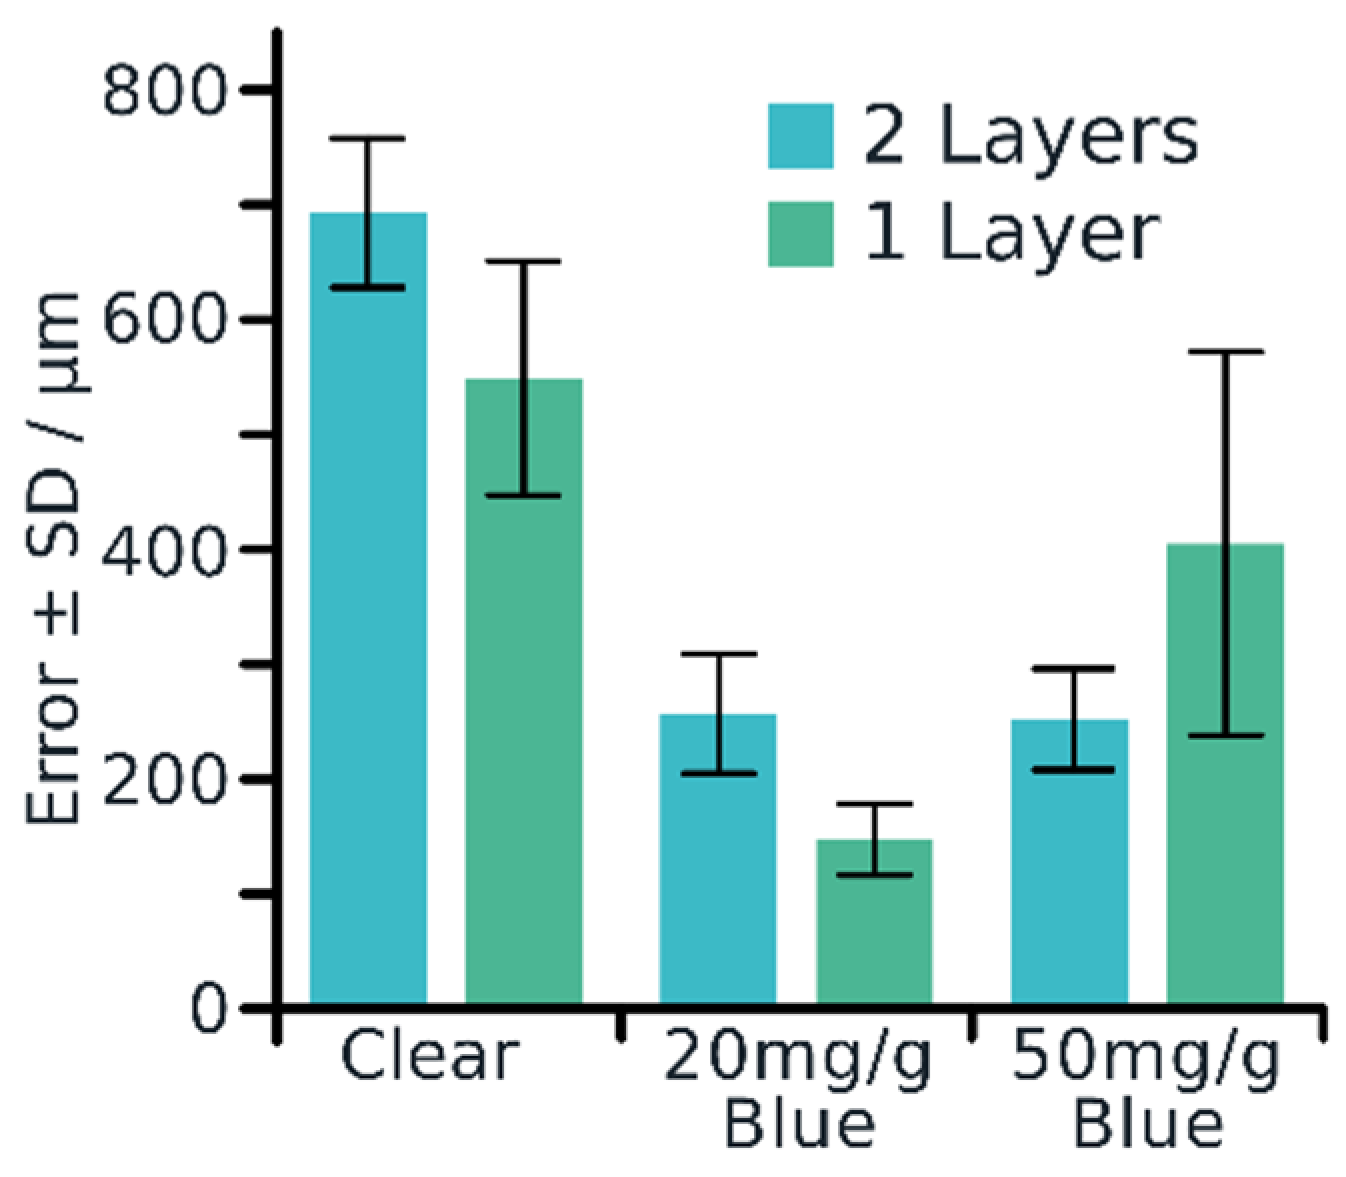
The results of testing the laser on the differently dyed interface squares in
Figure 5 are shown in
Figure 6. They show that a single layer of interface with 20 mg of dye added per gram of paste resulted in the smallest discrepancy between the laser and the manual nozzle measurements. While the total error in this case can be larger than the 150 µm range identified above, the standard deviation of the error is small enough that simply subtracting a fixed offset from the laser’s output can give a sufficiently accurate result.
The reason for the poorer performance of the darker, 50 mg/g blue is that the darker surface did not reflect enough laser light for it to make an accurate measurement. This implies that the ideal dye concentration exists at a balance between making the interface as opaque as possible while keeping it sufficiently reflective for the laser to work.
The reason that using a single layer of interface gave a smaller error with the clear and 20 mg/g squares was potentially that the first layer was able to soak into the textile, while the second layer sat above the surface. This meant that the surface of the first layer was a mixture of the interface and the textile’s fibres, which will have increased both its opacity and lightness.
Printing test lines using laser-measured heights revealed that, while two layers of interface are less accurately measured, they typically provide a smoother and more consistent surface than a single layer does. This is advantageous because it means that there is a lower chance of any surface defects that the scanning procedure may miss and that any errors produced by the laser will likely be similar across the surface. A smoother surface also means that the averaging procedure described above could be performed over a larger area, potentially increasing accuracy and reliability.
4. Conclusions and Future Work
While dispenser printing is a useful tool in the development and production of e-textiles, the requirement to keep the nozzle clearance within a 150 µm range means that some form of height compensation is necessary when printing on uneven textile substrates. Laser displacement measurement is a promising means of achieving this, allowing automated collection of the necessary height data to be carried out with the substrate on the print bed. The results presented above show that, in certain cases, laser measurement can achieve the accuracy required for successful dispenser printing.
However, these results also show that the surface the laser is profiling needs to meet height standards for opacity and reflectivity to be measured accurately. Adding dye to the translucent interface can help to achieve this, but it is difficult to make the interface opaque enough without making it too dark to reflect the laser’s light. One option that may make finding this balance easier is using different colour dye. The dark blue dye used here is not the ideal colour for reflecting the red light of the laser. Using a red dye instead could allow the interface’s opacity to be increased further while keeping the surface suitably reflective and thus increase the profiling accuracy even further.


