Proceeding Paper

Design and Acceptability of a Multi-Ingredients Snack Bar Employing Regional PRODUCTS with High Nutritional Value †

by
Francisco Teodoro Rios
,
Argentina Angelica Amaya
,
Manuel Oscar Lobo
and
Norma Cristina Samman
*
Centro de Investigaciones Interdisciplinarias en Tecnologías y Desarrollo Social para el NOA-(CIITED), CONICET-Facultad de Ingeniería, Universidad Nacional de Jujuy, Ítalo Palanca 10.4600, San Salvador de Jujuy, Jujuy, Argentina
*
Author to whom correspondence should be addressed.
Presented at the 2nd International Conference of IaValSe-Food Network, Lisbon, Portugal, 21–22 October 2019.
Proceedings 2020, 53(1), 14; https://doi.org/10.3390/proceedings2020053014
Published: 26 August 2020
(This article belongs to the Proceedings of The 2nd International Conference of Ia ValSe-Food Network)

Abstract

:
The aim was to develop a snack bar using regional food products. The formulation included traditional cereals and amaranth, quinoa, sunflower, flax, chia, sesame and poppy seeds subjected to different treatments. Two sensory evaluations were carried out to evaluate acceptability. Snack bars containing toasted seeds presented high acceptability by the consumer. Amaranth, quinoa, chia and sunflower significantly increased the acceptability. The sensory methods applied allowed for the selection of ingredients and processing technologies that increase the preference of consumers.

1. Introduction

The need to have a greater number of nutritious and healthy foods leads to the development of new products, with the incorporation of ingredients or active compounds that have beneficial effects for health [1]. A balanced and healthy diet depends on many factors, among which the quality and composition of raw materials that are used in the formulation of foods stand out. Snack bars are products that allow for the incorporation of multiple ingredients that, when properly selected, can increase the nutritional and functional value of the product. Andean grains such as quinoa (Chenopodium quinoa) and amaranth (Amaranthus caudatus), recognized for the nutritional quality of their proteins and their contribution in essential fatty acids, minerals and dietary fiber, are being reintroduced in the Andean region of the Argentine Northwest [2]. On the other hand, seeds such as chia (Salvia hispanica L.) and sesame (Sesamum indicum) are ingredients that can be used in the development of snack bars. Nutritionally, the seeds stand out in general due to the high content of lipids, proteins and fibers. The lipids of chia seeds have a high content of polyunsaturated fatty acids (PUFAs), particularly omega-3 (linolenic acid) and omega-6 (linoleic acid) [3]. Therefore, they could be adequate to supplement cereals nutritionally in the formulation of snack bars. In addition to their nutritional properties, seeds provide functional components such as polyphenols and flavonoids [4]. Therefore, the seeds have significant advantages over other ingredients used in the manufacturing of bars, such as oats and rice. However, it is necessary to prepare these raw materials prior to their use, which can induce negative effects in their nutritional and functional compounds and, consequently, in the final product. An important aspect to take into account in the design and development of products is to consider the preference and acceptance of the type and quantity of any ingredient by consumers.
This work proposes to develop a snack bar with high consumer acceptability by employing nutritious regional food products rich in functional compounds.

2. Materials and Methods

2.1. Materials

Quinoa (Chenopodium quinoa Willd. var. Inta Hornillos) and amaranth (Amaranthus caudatus var. rosado) were provided by the Instituto de Investigacion y Desarrollo Tecnologico para la Agricultura Familiar (IPAF) (Jujuy-Argentina). The seeds of chia (Salvia hispanica L.), sesame (Sesamum indicum), flax (Linum usitatissimum), sunflower (Helianthus annuus) and poppy (Papaver somniferum) were purchased from Melar S.A. (Argentina). Puffed rice and oats (rolled) were purchased at the local market (Jujuy). In the preparation of the binder, honey obtained from producers of the region of the Yungas (Jujuy) and commercial sucrose were used. The amounts and ratio of honey/sucrose remained constant in the preparation of the bars.

2.2. Methods

The nutritional compositions of quinoa and amaranth (proteins, moisture, lipids, fiber and ash) were determined by official AOAC methods [5].

2.3. Design and Elaboration of the Snack Bars

For the elaboration of the bar, the seeds and cereals were added to the union syrup and continuously mixed until obtaining a homogeneous composition. Then, they were placed in stainless steel molds, pressed for 10 min and left to stand (1 h) at room temperature. The product was packaged and stored at room temperature up to sensory analysis [6].
The design and development of the product was carried out through a sensory analysis with 160 consumers in two stages. Consumers were recruited among students, teachers and administrative staff of the Faculty of Engineering, with an age range between 18 and 50 years, of both genders. The evaluation was carried out in the sensory analysis laboratory of the Engineering Faculty—UNJu. Each consumer was given the total samples of each experimental design in 20 g portions of each, coded by three random digits. Next to the trays, a form was provided describing the objective of the study and the instructions to carry out the analysis as well as drinking water for mouth wash between samples.

2.4. Sensory Analysis

2.4.1. Sensory Analysis 1

In the first place, the acceptability of the samples (seeds to be used as ingredients in the snack bar) was studied, to which different processes were applied depending on the temperature (T) and time (t). The applied processes were toasting (190 °C × 3 min), boiling (boiling: t1 = 15 min and t2 = 25 min), dry heating (T = 80 °C, t1 = 45 and t2 = 60 min) and baking (T = 130 °C, t = 30 and 45 min). In the first trial, a total of seven samples were analyzed (3 processes two times = 6 + 1 processes: roasting). The evaluation of acceptability was made with 75 consumers using a hedonic scale of 9 points with the following extremes: I dislike it a lot = 1 and I like it a lot = 9. In addition to the hedonic test, a survey was carried out with open questions to generate the descriptors of the samples. The attributes most frequently used (>20%) were selected as descriptive attributes of the samples.

2.4.2. Sensory Analysis 2

Once the processes of adaptation of the raw materials were defined, a second sensory analysis was carried out with 85 consumers. The acceptability of the samples was evaluated in addition to a check-all-that-apply test that included 16 attributes grouped into appearance, taste, aroma and texture. The second sensory analysis was carried out with the objective of selecting the ingredients that produce the highest preference of the samples following a Taguchi L8 (27) design. According to the design, eight trials were carried out at two levels: absence and presence of each seed, which corresponds to the seven variables: quinoa, amaranth, chia, sesame, sunflower, flax and poppy.

2.5. Statistical Analysis

Samples from both trials were evaluated using the ANOVA, considering the processes and ingredients as variation factors. A principal component analysis (PCA) was applied to the descriptive data of each sensory analysis for its correlation with the acceptability of the samples.

3. Results

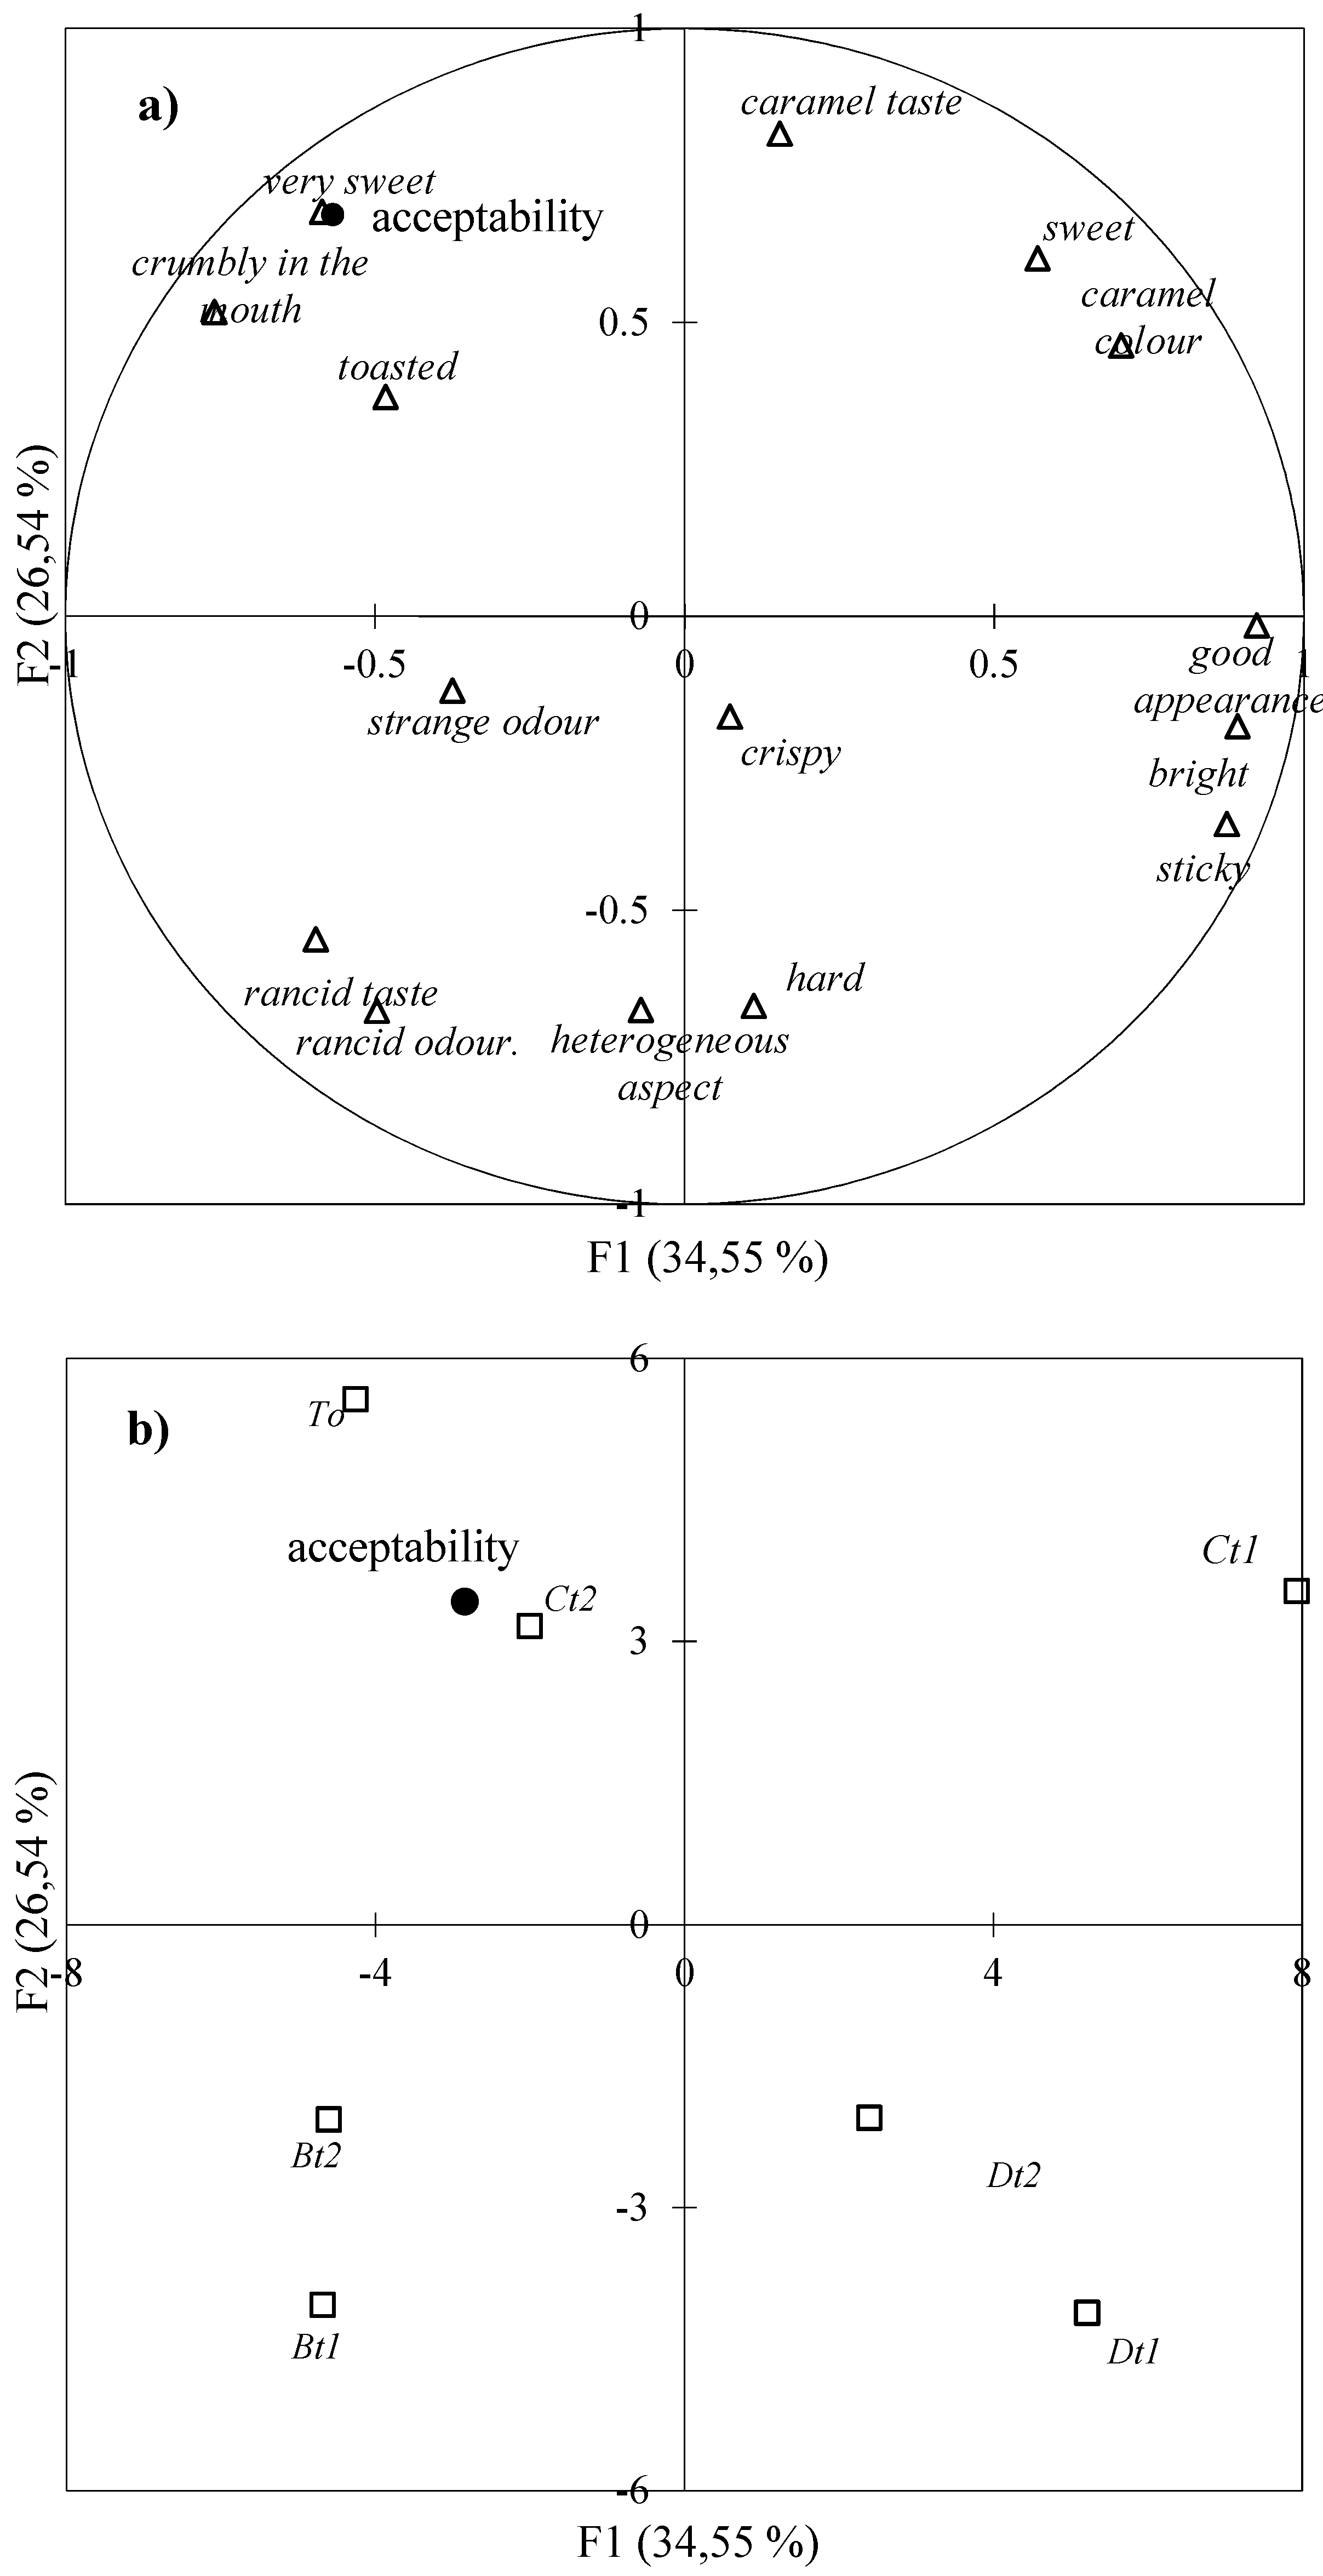
3.1. Sensory Analysis. Process Selection

Table 1 shows the multi-ingredient snack bar acceptability for a total of 75 consumers. Seeds and Andean grains were cooked by different processing conditions (n = 7) to study their incorporation into the bar. The ANOVA applied to the acceptability data determined significant differences (p < 0.05). The samples To and Ct2 presented the highest acceptability in opposition to Dt2. Figure 1 shows the PCA of the attributes and the relationship with the acceptability of the samples, which was used as a supplementary variable. The first two factors (F) explain 61.09% of the total variability of the data. The positive factor F1 indicates that the attributes that characterize the samples Ct1 and Dt1 were related to “good appearance”, “bright” and “caramel color”. However, the increase in acceptability was correlated to a negative F1, which is associated with samples To and Ct1, highlighting the attributes of “toasted”, “crumbly in the mouth” and “very sweet”. On the other hand, along the negative axis of F2, opposite to To, the samples of lower acceptance were observed: Bt1, Bt2 and Dt2. The B samples were strongly associated with the attributes “rancid taste” and “rancid smell”; for this reason, they would be rejected. In the case of D samples, although they were associated with “bright” and “good appearance”, they would be rejected for “hard” and “sticky” attributes. Therefore, the processes that produced greater acceptance corresponded to the roasting of raw materials, followed by cooking.

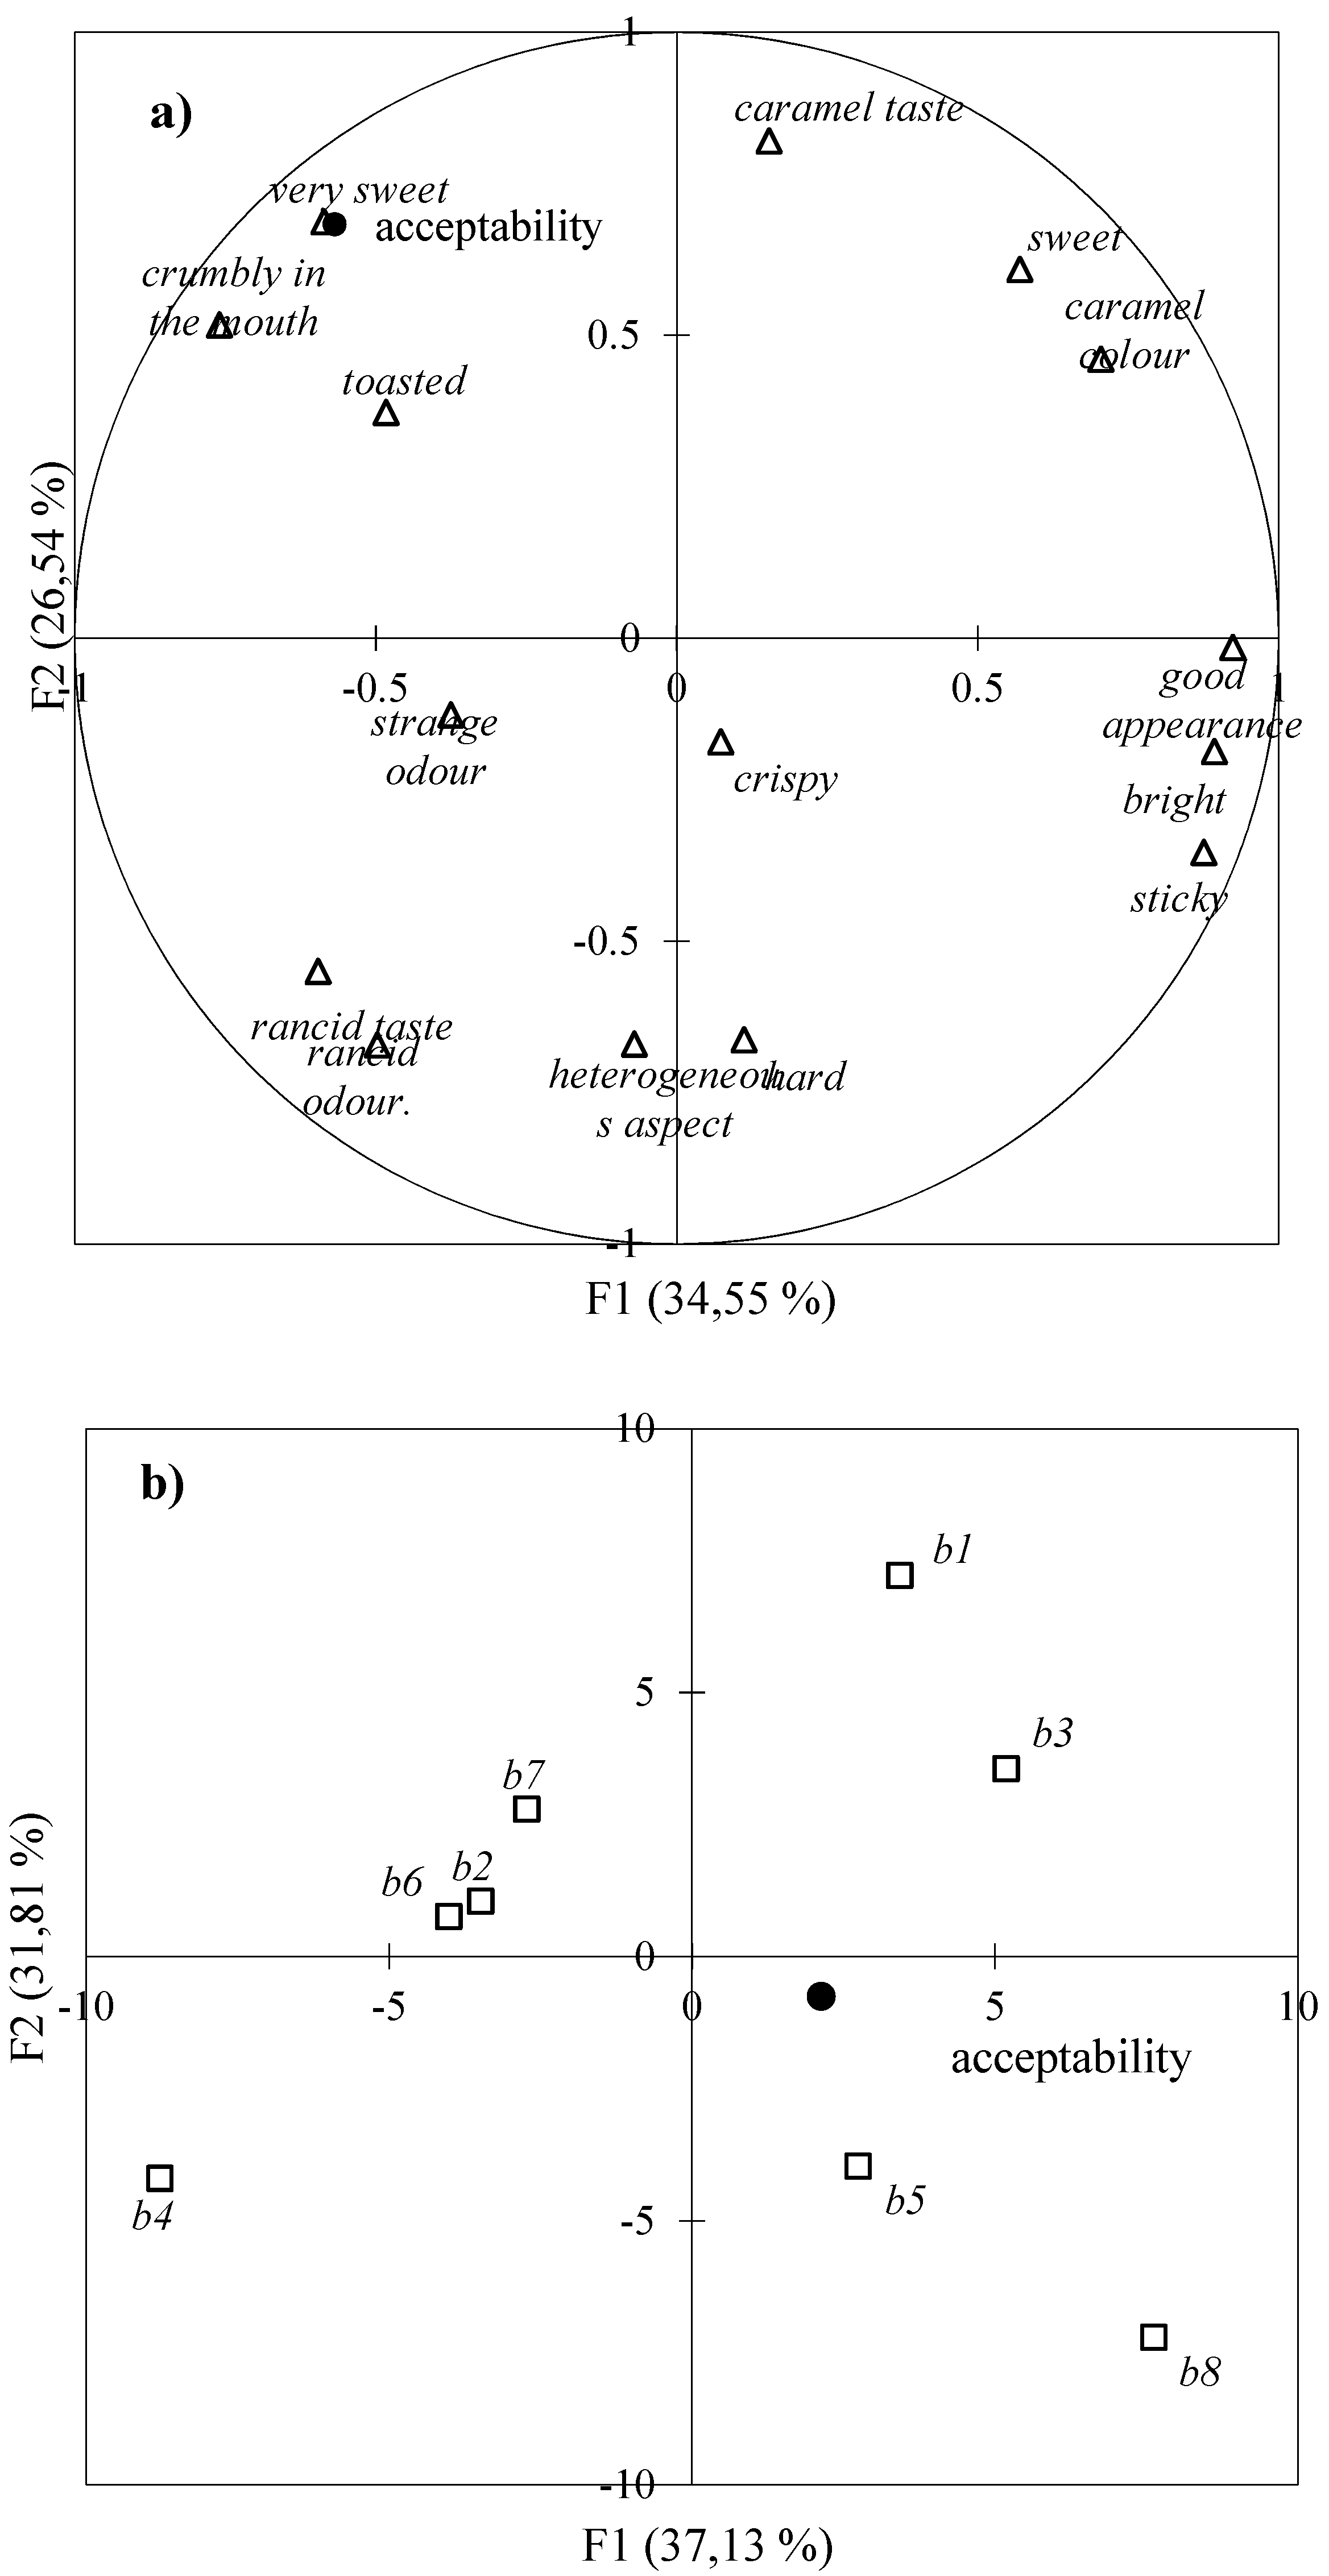
3.2. Sensorial Analysis. Ingredient Selection

Table 2 shows the ANOVA applied to the samples that presented a combination of the relative content of the different ingredients for their selection and incorporation into the final product. The samples with higher proportions of amaranth, quinoa, sunflower and chia presented the highest preference. In contrast, the samples in which flax and poppy predominated (b6 and b7) were significantly (p < 0.05) the least accepted. In Figure 2, the PCA shows the relationship between the attributes and the acceptability of the different formulations. The first two factors explained 68.94% of the total variability. The positive F1 factor indicated a weak correlation with the increase in the acceptability of the samples. According to the F1 axis, a separation of the samples into two groups was observed.
The samples placed in the F1 positive sector were those of greater acceptance and were associated mainly with the attributes “good appearance” and “sweet taste”. In the case of the negative F2 axis, there was a negative correlation (r > 0.70) between the acceptability and the taste and smell attributes due to rancidity. The attribute “too rancid” was perceived mainly in seeds with high lipid content, such as flax, poppy, chia and sunflower. In addition, the “heterogeneous aspect” provided by flax and poppy, related to their color and, negatively influenced the acceptability of the samples. Therefore, due to the attributes provided by the flax and poppy seeds, their incorporation into the formulation of the bars was discarded.

3.3. Nutritional Analysis

Table 3 shows the nutritional composition of the raw materials and selected snack bar. The chemical composition of the seeds showed a high content of lipids, followed by proteins. On the other hand, rice and oats have a high content of carbohydrates (CH). Therefore, the bar could be correctly complemented with seeds, cereals and Andean crops in order to elaborate a product of high nutritional value and greater acceptability. In the nutritional composition of the final product, lipids and proteins were in the range of FAO’s nutrient contribution recommendations. Additionally, the use of seeds in an integral way was responsible for the high content of dietary fiber.

4. Discussion

According to the sensory study, the most important attributes for the preferences of snack bars were the appearance, “bright” and “good appearance”, followed by the taste, principally “sweet” and “toasted”. The “sweet taste” attribute is one of the most important and representative of snack bars. “Sweet taste” and its intensity can mask other ingredients, like antioxidants, which usually are rejected by consumers despite the fact that their consumption may be beneficial for health [6]. However, it should be mentioned that the increase in “sweet taste” implies the addition of simple sugars, which is negative from the point of view of health recommendations.
The “rancid taste” and “rancid smell” attributes were identified as rejected attributes for different products. The attribute “rancid” is characteristic of the oxidation of the lipids of the seeds due to processing at high temperatures for long times [7]. In this sense, roasting was the better process to use due to the short time involved [8]. Despite the fact that the seed content improves the nutritional composition of the product, both the processes and the consumers did not accept a high content of the seeds in the final product. Furthermore [9] determined that the health information did not determine the selection of a snack bar. Therefore, the design of a product with high nutritional and functional value does not only depend on the health benefits but also on aspects that condition the preference of the consumers.

5. Conclusions

The sensorial methods applied allowed for the selection of ingredients and processing technologies that increase the preference of consumers, identifying attributes of acceptability and rejection.
In general, the acceptance of snack bars depended mainly on attributes such as “sweetness” and “good appearance”, and rejection occurred in formulations containing ingredients with high lipid content that were treated at high temperatures for a long time.

Acknowledgments

This work was supported by grant Ia ValSe-Food-CYTED (Ref. 119RT0567) and Consejo Nacional de Investigaciones Científicas y Técnicas CONICET and Secretaria de Ciencia y Técnica y Estudios Regionales SECTER, Universidad Nacional de Jujuy (Argentina).

References

  1. Sun-Waterhouse, D.; Farr, J.; Wibisono, R.; Saleh, Z. Fruit-based functional foods I: Production of food-grade apple fibre ingredients. Int. J. Food Sci. Technol. 2008, 43, 2113–2122. [Google Scholar] [CrossRef]
  2. Nascimento, A.C.; Mota, C.; Coelho, I.; Gueifão, S.; Santos, M.; Matos, A.; Sammán, N.; Castanheira, I. Characterization of nutrient profile of quinoa (Chenopodium quinoa), amaranth (Amaranthus caudatus), and purple corn (Zea mays L.) consumed in the North of Argentina: Proximates, minerals and trace elements. Food Chem. 2014, 148, 420–426. [Google Scholar] [CrossRef] [PubMed]
  3. Pizarro, P.L.; Almeida, E.L.; Sammán, N.C.; Chang, Y.K. Evaluation of whole chia (Salvia hispanica L.) flour and hydrogenated vegetable fat in pound cake. LWT Food Sci. Technol. 2013, 54, 73–79. [Google Scholar] [CrossRef]
  4. Coelho, M.S.; de Araujo Aquino, S.; Latorres, J.M.; de las Mercedes Salas-Mellado, M. In vitro and in vivo antioxidant capacity of chia protein hydrolysates and peptides. Food Hydrocoll. 2019, 91, 19–25. [Google Scholar] [CrossRef]
  5. AOAC. Official Methods of Analysis of the Association of Official Agricultural Chemists, 16th ed.; AOAC: Washington, DC, USA, 1995. [Google Scholar]
  6. Rios, F.; Lobo, M.; Sammán, N. Acceptability of beehive products as ingredients in quinoa bars. J. Sci. Food Agric. 2018, 98, 174–182. [Google Scholar] [CrossRef] [PubMed]
  7. Damodaran, S.; Parkin, K.L. Química de los Alimentos de Fennema; Editorial Acribia: Zaragoza, Spain, 2018. [Google Scholar]
  8. Repo-Carrasco-Valencia, R.A.; Encina, C.R.; Binaghi, M.J.; Greco, C.B.; Ronayne de Ferrer, P.A. Effects of roasting and boiling of quinoa, kiwicha and kañiwa on composition and availability of minerals in vitro. J. Sci. Food Agric. 2010, 90, 2068–2073. [Google Scholar] [CrossRef] [PubMed]
  9. Pinto, V.R.A.; de Oliveira Freitas, T.B.; de Souza Dantas, M.I.; Della Lucia, S.M.; Melo, L.F.; Minim, V.P.R.; Bressan, J. Influence of package and health-related claims on perception and sensory acceptability of snack bars. Food Res. Int. 2017, 101, 103–113. [Google Scholar] [CrossRef] [PubMed]
Figure 1. Representation of F1–F2 factors of the principal component analysis applied to the data of the first sensorial analysis—process selection. (a) Variables: sensory attributes (∆), supplementary variable: acceptability (●). (b) Samples (□), supplementary variable: acceptability (●).
Proceedings 53 00014 g001
Figure 2. Representation of F1–F2 factors of the principal component analysis applied to the data of the second sensorial analysis—ingredient selection. (a) Variables: sensory attributes (∆), supplementary variable: acceptability (●). (b) Samples (□), supplementary variable: acceptability (●).
Proceedings 53 00014 g002
Table 1. Conditions and response of acceptability of the different preparation processes.
ProcessTemperature (°C)Time (min)Acceptability (n = 75)
Toasting (To)19036.53 a
Cooking (Ct2)94206.11 a
Baking (Bt2)130455.27 b
Baking (Bt1)130305.26 b
Cooking (Ct1)94105.02 b
Dry heating (Dt1)80454.73 b
Dry heating (Dt2)80604.05 c
Different letters in the same column indicate statistically significant differences, p < 0.05.
Table 2. Variables and experimental design response to the selection of ingredients.
SampleAmaranthQuinoaChiaSunflowerSesamePoppyFlaxAcceptability
(n = 85) *
b122121126.00 a
b322112215.82 ab
b221221215.74 ab
b421212125.70 ab
b512222115.37 b
b611122223.54 c
b712211224.42 c
b811111115.71 ab
* Different letters in the same column indicate statistically significant differences, p < 0.05.
Table 3. Proximal composition of the selected ingredients and the final product.
IngredientMoistureProteinLipidAshFiberCarbohydrates *
(g/100 g)
Oats8.216.96.91.710.666.3
Sesame3.817.749.74.5186.4
Sunflower3.719.956.42.92.717.1
Chia7.720314.631.55.2
Amaranth10.513.46.42.911.355.3
Quinoa11.312.16.3210.457.2
Rice8.65.90.70.51.782.5
Final product10.29.710.52.36.560.8
* Calculated by difference.
Publisher’s Note: MDPI stays neutral with regard to jurisdictional claims in published maps and institutional affiliations.

