Proceeding Paper

Shoe–Surface Tribology in Hardcourt Tennis †

Department of Mechanical Engineering, University of Sheffield, Sheffield S1 3JD, UK
*
Author to whom correspondence should be addressed.
Presented at the 13th Conference of the International Sports Engineering Association, Online, 22–26 June 2020.
Proceedings 2020, 49(1), 90; https://doi.org/10.3390/proceedings2020049090
Published: 15 June 2020

Abstract

:
Sports shoes used for hardcourt tennis vary greatly in outsole tread design. In this study, a series of experiments were conducted on individual shoe tread elements, replicating the tribological conditions they will experience during hardcourt step and slide movements. It was found that tread element orientation does not influence the friction during step movements, but has a moderate effect on the friction during hardcourt slides. This is considered to be due to differing amounts of wear and frictional heat experienced.

1. Introduction

In most sports, the only direct contact athletes make with their external environment is through the shoe–surface interface. As such, shoe–surface friction or traction, is inevitably linked to performance and injury likelihood [1,2,3].
On tennis hardcourts, change-of-direction movements can be split into steps and slides. An influential factor for these hardcourt change-of-direction movements is the tennis shoe itself. To improve the friction, and therefore performance of steps and slides, tennis shoe outsole designs are frequently modified and updated. Studies have been conducted attempting to understand how shoe tread design influences friction on hardcourt surfaces [4,5,6,7], the findings of which indicate that it does. However, from these studies, it is difficult to identify the key tread parameters that cause the frictional difference. This is a difficult task due to the complex nature of rubber’s material properties, combined with the role of wearing and frictional heating inevitable with tennis shoe surface interactions. The study conducted by Hale et al. [7] sheds light on some of the frictional factors posed by the tread. However, the tests were run on simple rubber shapes from a commercially available rubber, not on actual tennis shoe treads. Applying these findings to real tennis shoe treads, like that shown in Figure 1, is challenging.
Using kinetic and kinematic information provided by biomechanical studies on hardcourt steps [9] and slides [8], mechanical experiments can be conducted under the same tribological conditions. Thus, investigating how outsole properties affect their frictional performance.
It is hypothesized that when rubber type and nominal contact area are the same, tread shape will have no effect on the static friction observed during hardcourt steps. However, tread shape is expected to influence the dynamic friction of hardcourt slides, due to the effects of frictional heating and wearing recorded in similar interactions [7,10,11].

2. Materials and Methods

2.1. Tread Elements and Hardcourt Surface

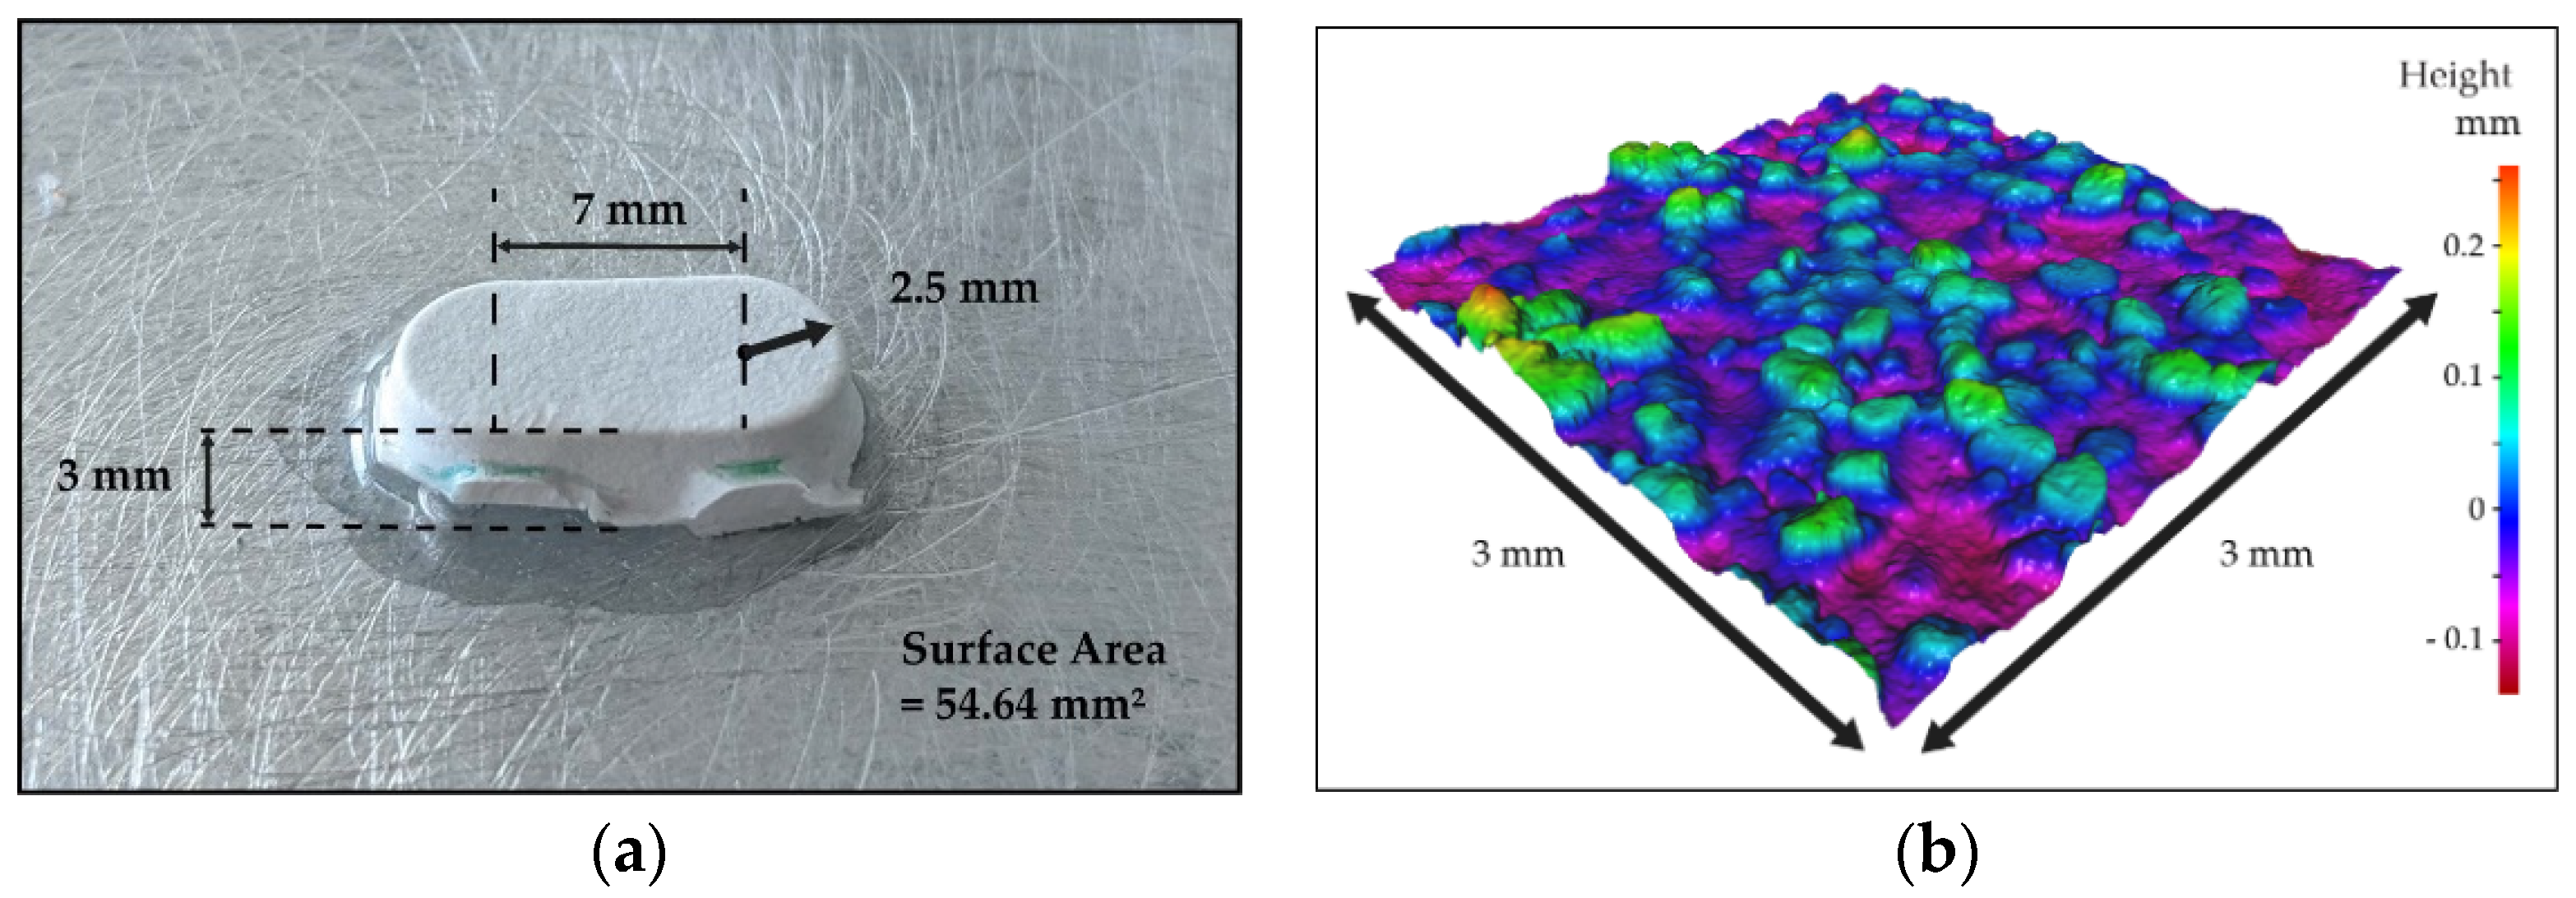
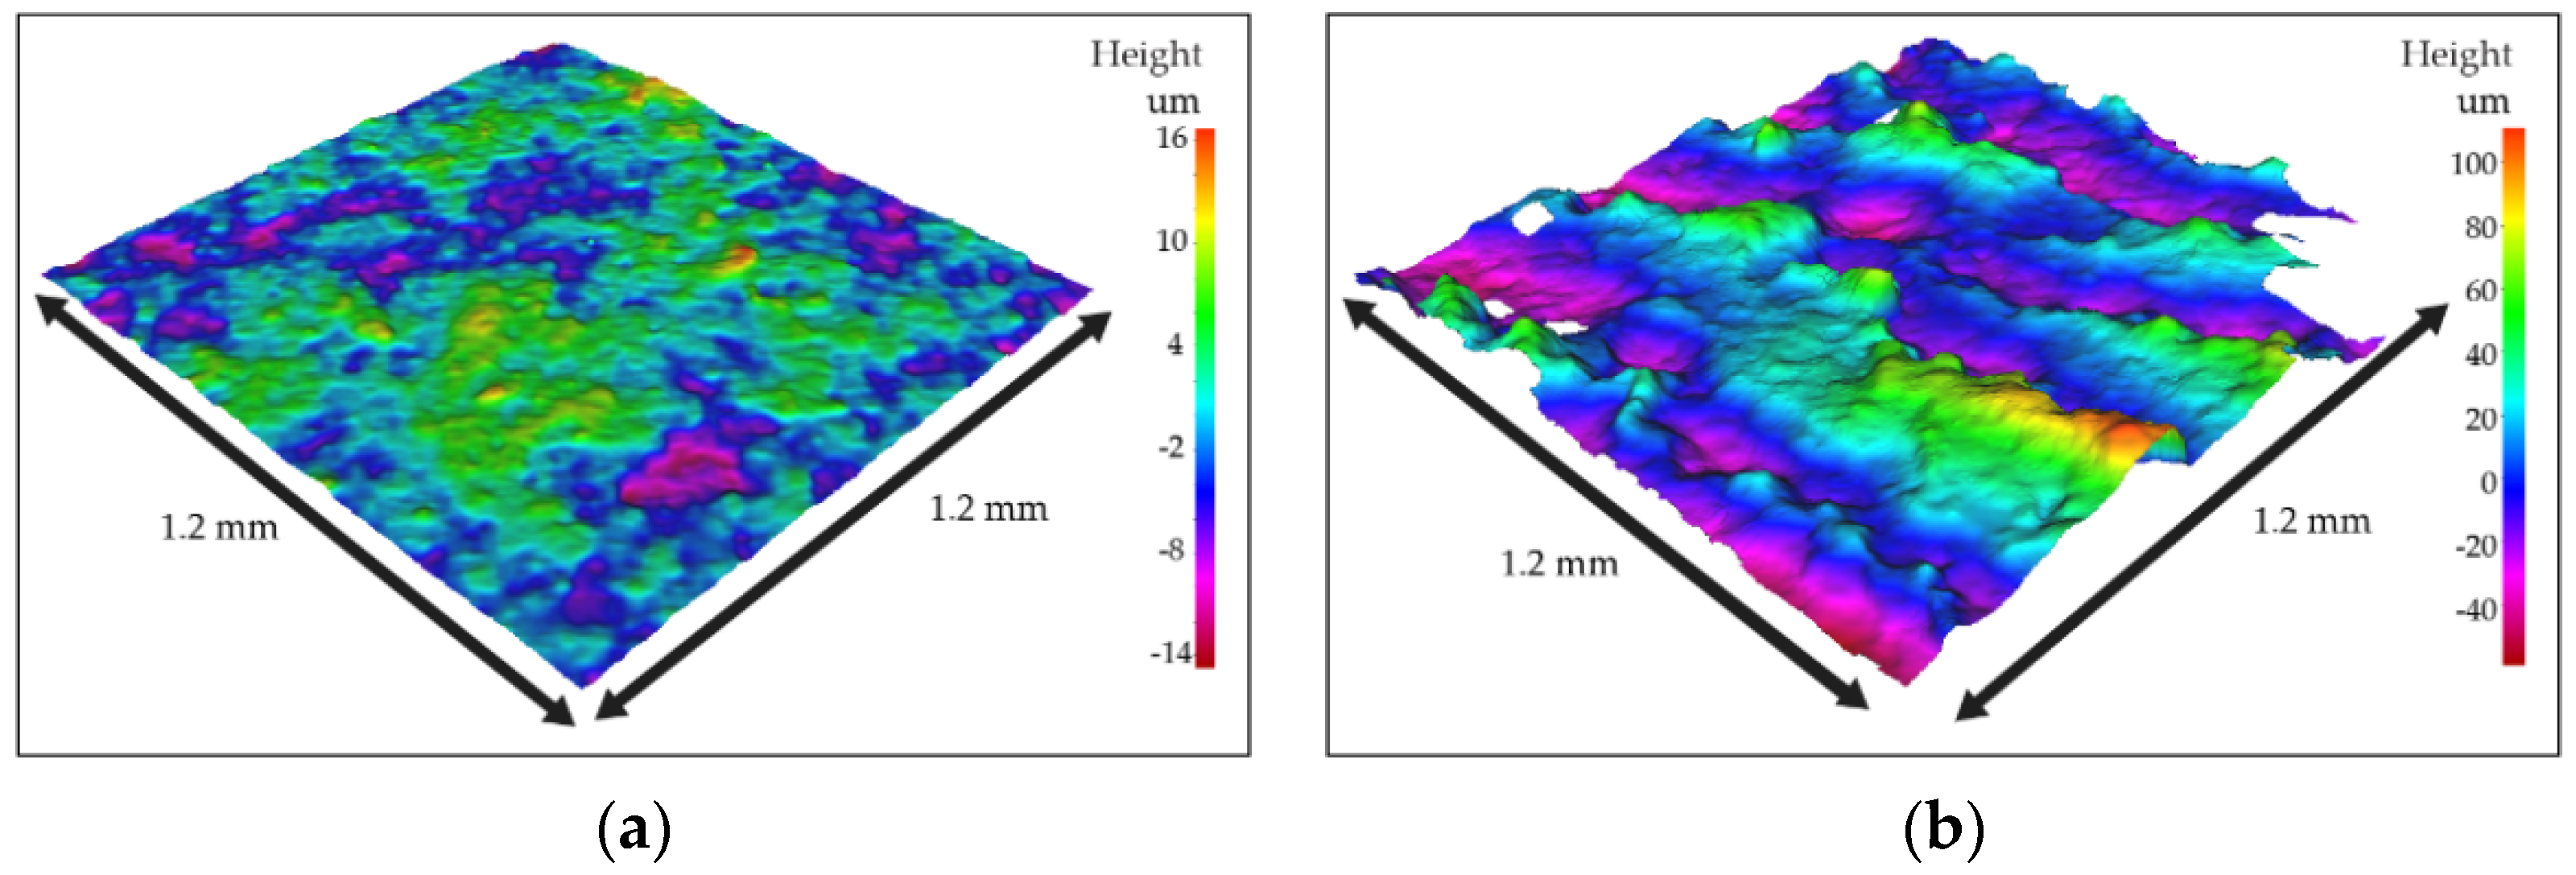
Four identical rubber tread elements were cut from a Babolat Propulse tennis shoe. The Shore A hardness of these elements was 76 and their surface topography was collected using optical methods (Alicona, InfiniteFocus SL, Optimax, Leicestershire, UK). These tread elements were selected as they make up the majority of the Babolat outsole (Figure 1). Their dimensions are shown in Figure 2a.
A single hardcourt sample was used for all experiments (LMG1, Sport Group), constructed from a sand-paint mix, beneath which were layers of plywood. The surface topography can be seen in Figure 2b and was characterized by the following parameters: Sa = 46.5 μm, Sq = 58.5 μm and Sz = 400.9 μm.

2.2. Experimental Set-Up

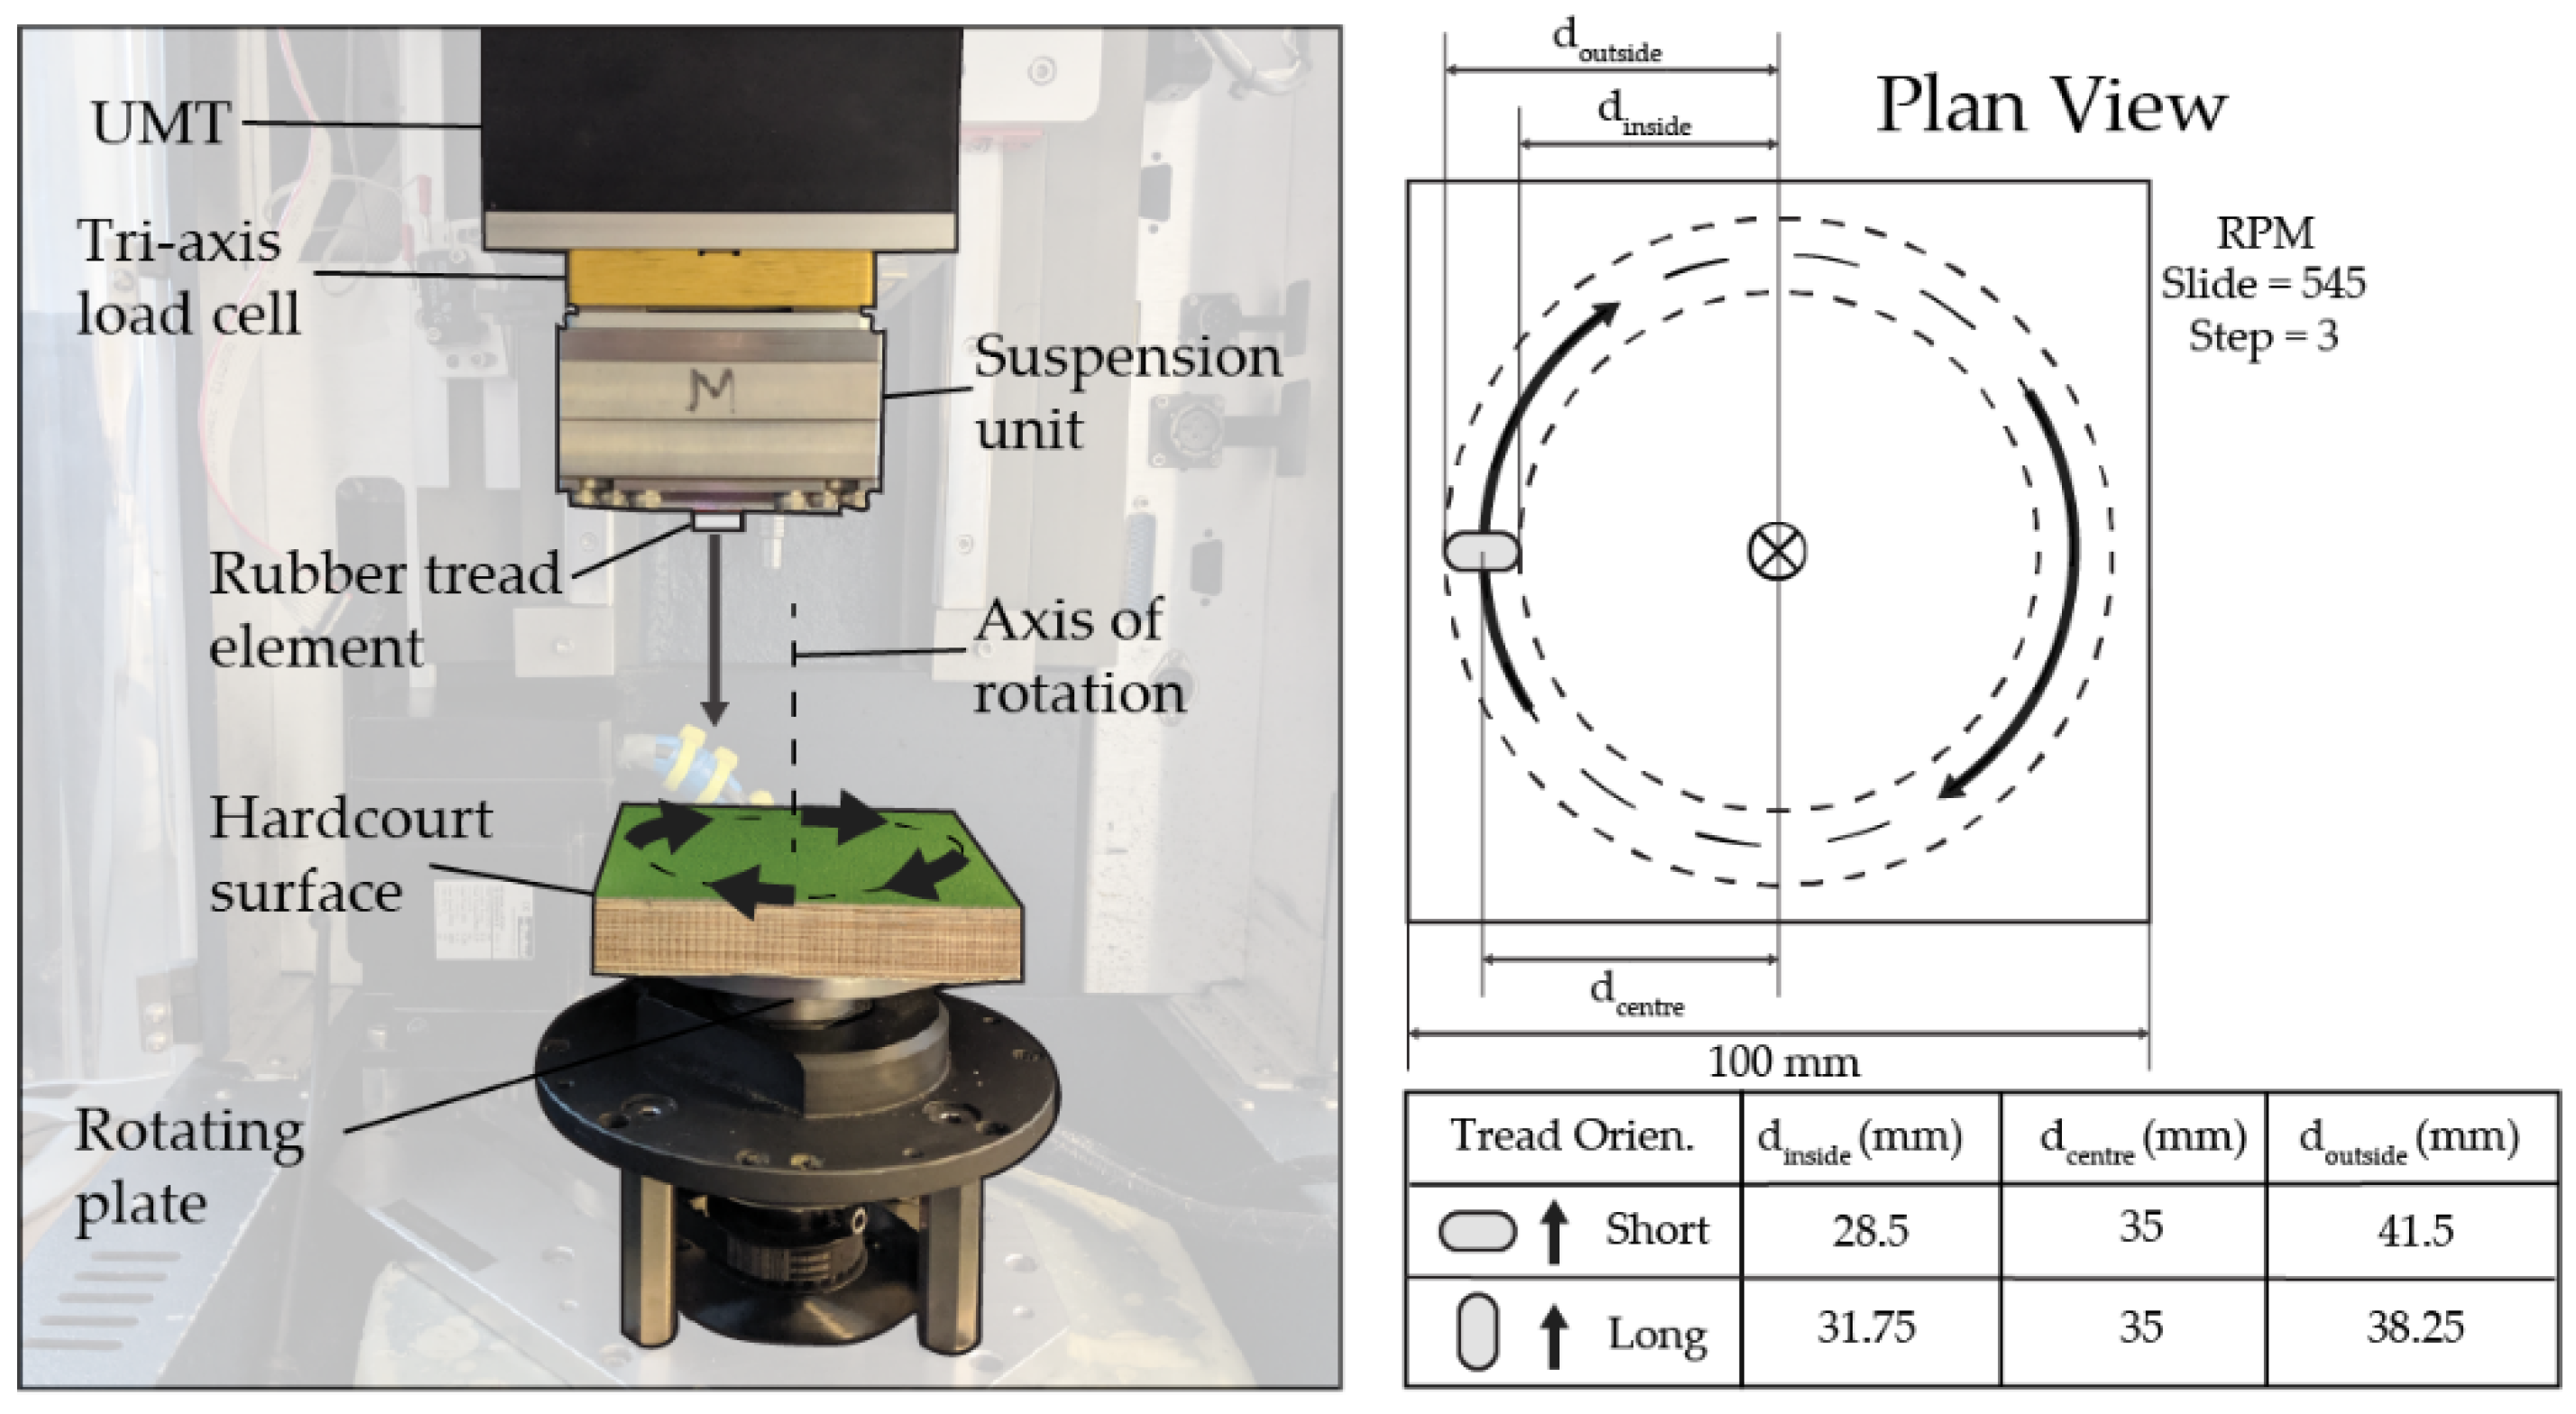
A Universal Mechanical Tester (UMT) tribometer (CETR-UMT2, Bruker, Massachusetts, USA) was used with a rotary attachment to which the hardcourt was fixed. This allowed the replication of the high-speed interactions synonymous with hardcourt sliding (≈2000 mm/s).
Each tread element was stuck with super glue to a flat steel plate which, in turn, was attached to a suspension unit and a tri-axis load cell within the UMT (Figure 3). This load cell records the normal and friction forces generated during sliding, outputting coefficients of friction (CoF).
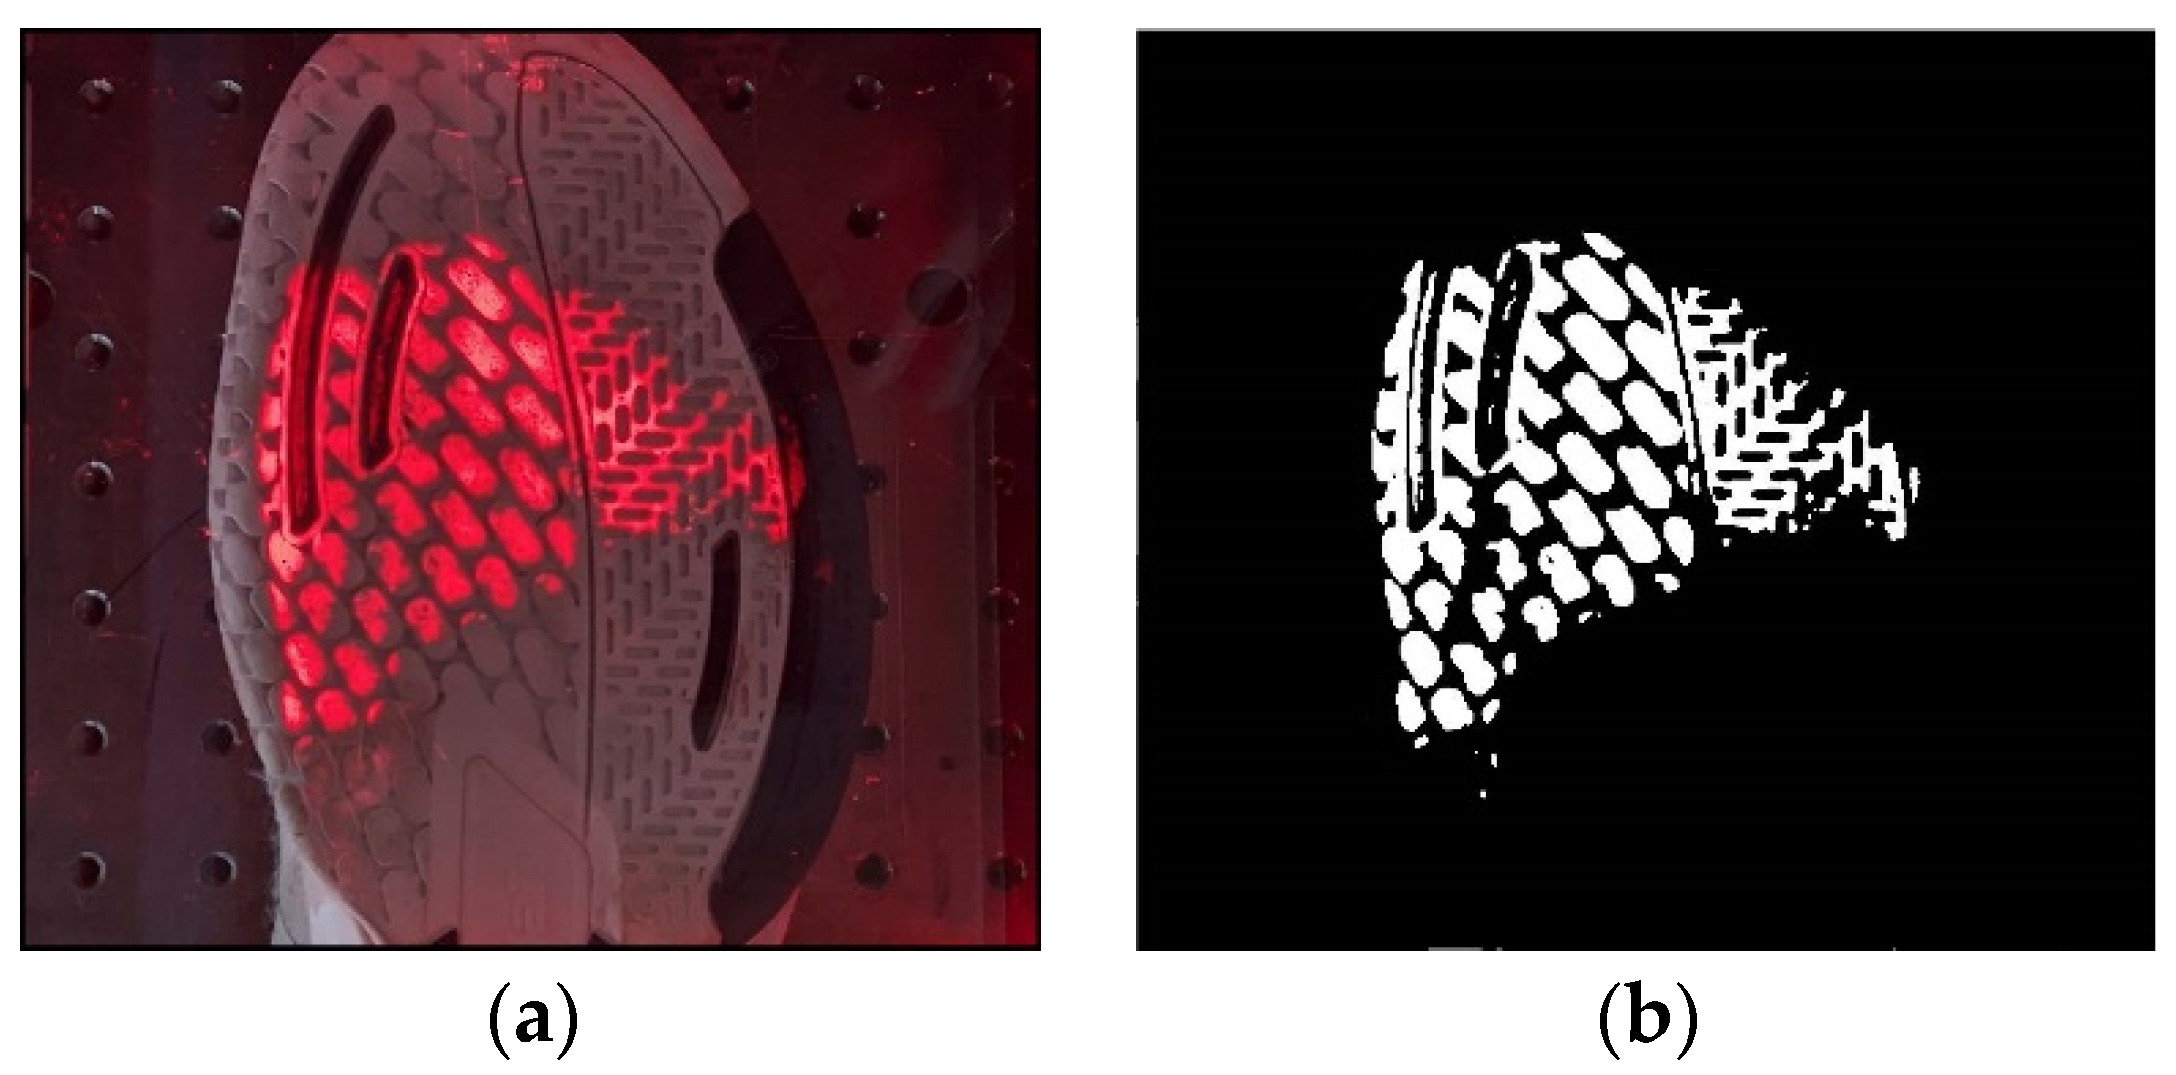
For the step movement, the figure of 1100 N for mean peak normal force was used to inform the normal load calculations. This figure was obtained in a study by Clarke et al. [9] via a force plate placed beneath a hardcourt tennis sample as players performed step movements. To then determine the normal load on a single tread element, nominal contact area experiments, based on the Needham and Sharp frustrated total internal reflection approach [12], were conducted on the forefoot of the Babolat tennis shoe with a normal load of 1100 N (Figure 4). An image was then taken of the resulting footprint before being analyzed using a bespoke image processing program (MATLAB R2017b) to determine the contact area at the specified normal load.
Averaging the pressure over the entire contact region (1830 mm2), while knowing the contact area of the single tread element (54.6 mm2), a representative normal load of 33 N was selected and used during the “step” experiments.
A similar process was carried out to determine the normal load of 25 N that was used for the slide movement, using the pressure insole data provided by Starbuck et al. [8], shown in Figure 1.
Table 1 shows the key test parameters used for the two selected movements. The hardcourt slide velocity of 2000 mm/s has been observed during video analysis of men’s professional hardcourt tennis [13].

2.3. Experiment Summary

In total, four tests were performed with five repeats of each. The step and slide tests were run with two different tread orientations: one parallel to the slide direction (long) and one perpendicular to the slide direction (short) (Figure 3). A new tread element was used for each of the four separate tests. The surface and rubber were lightly brushed between repeat tests to remove any loose surface contaminants.

3. Results

3.1. Step Movement Coefficient of Friction

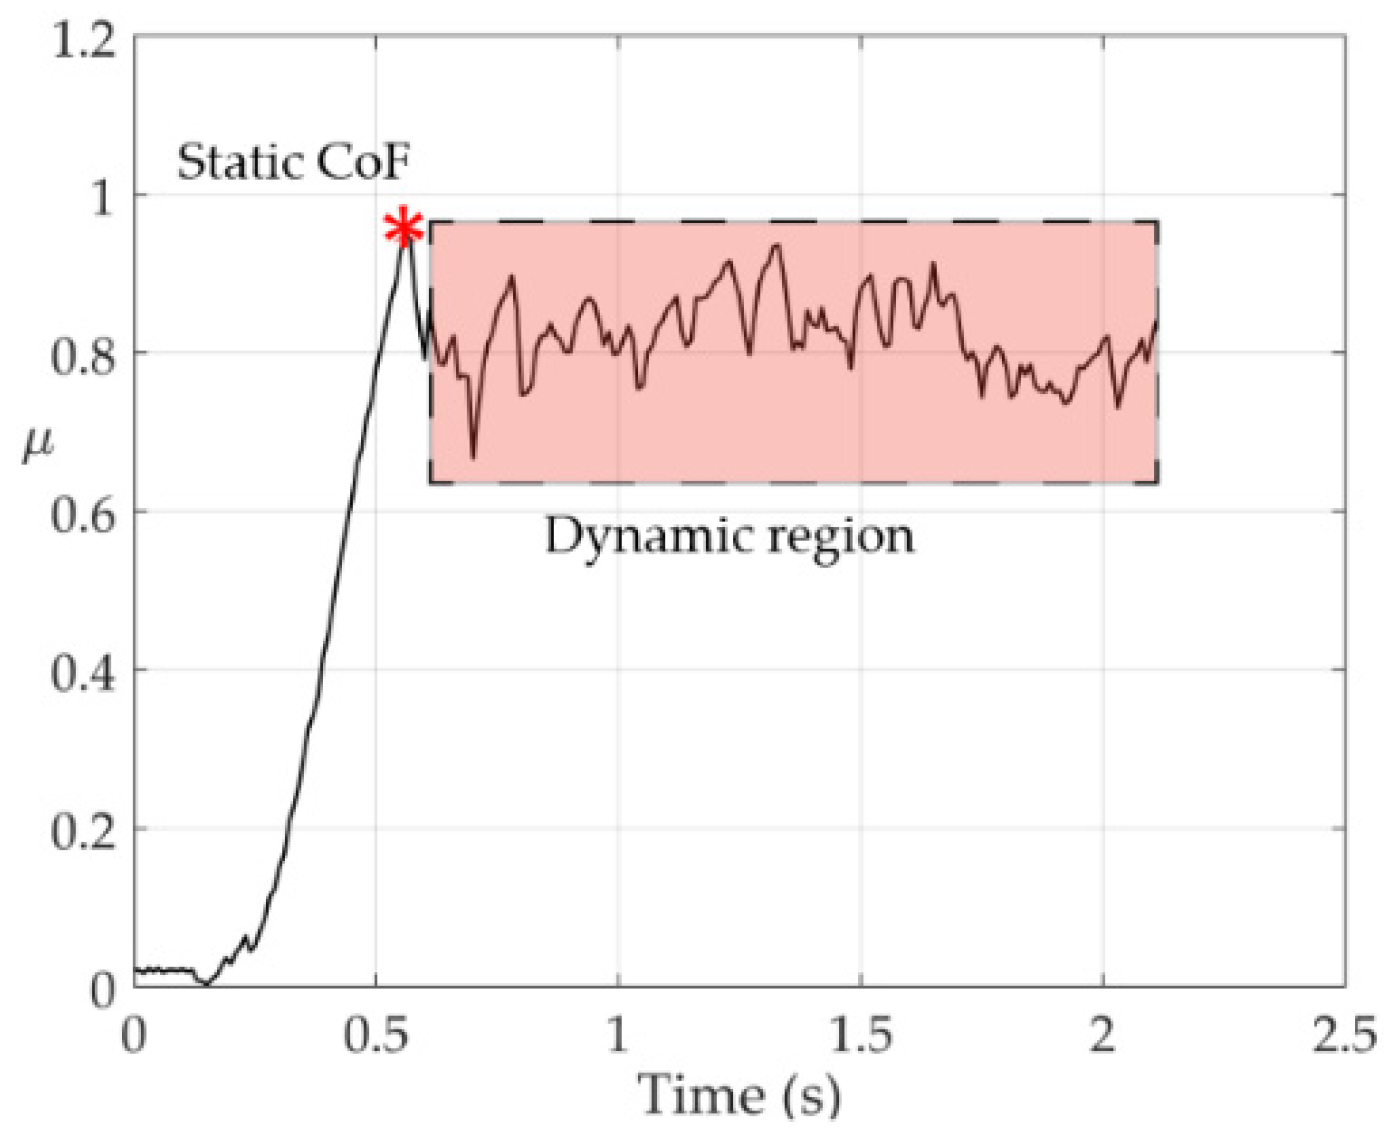
Figure 5 shows how the CoFs were determined for the step movement experiments. As step movements are mostly concerned with the static friction (the friction needed to be overcome to initiate motion), these values are the only ones reported for this movement.
These static CoF values were identified as the ratio of normal to frictional force at the initiation of bulk sliding. This value is shown by a red star on Figure 5.

3.2. Slide Movement Coefficient of Friction

The hardcourt slide is most concerned with the dynamic CoF (the friction needed to maintain sliding motion) and as such, are the only CoF values reported for this subsection of experiments. These values were taken from averaging all the CoF values during the first 0.5 s of the 0.8 s long contact. All trials demonstrated smooth sliding in this region.

3.3. Tread Orientation

Figure 6 shows the recorded friction coefficients for both test conditions and tread orientations. Each plot is made up from five data points with the mean values marked as crosses.
A Mann–Whitney test indicated that during the step test, the static CoF was not significantly different (U = 12, p = 1) between short (median = 0.802) and long (median = 0.86) tread orientations. A second Mann–Whitney test showed that during the slide test, dynamic CoF was also not significantly different (U = 5, p = 0.151) between short (median = 0.984) and long (median = 0.908) tread orientations. An effect size of 0.496 was also calculated for the slide test data. By Cohen’s classification of effect size, tread orientation has a moderate effect (≥0.3) on dynamic CoF and nearly a large effect (≥0.5).

3.4. Wear Analysis

As shown in Figure 7, after the slide tests, the rubber surface was roughened, leaving grooves. Furthermore, “long” and “short” tread elements produced different amounts of wear during the slide tests, with mass loss values of 17.3 and 21.2 mg, respectively.

4. Discussion

The step CoF readings (Figure 6) support the previously stated hypothesis that tread orientation would cause no significant variance in static friction during step movements. Furthermore, as predicted, a frictional difference was observed for the two tread orientations during the slide test. Although this was not a significant difference (p = 0.151), the plots and moderate effect size (0.496) imply the “short” tread orientation is likely to produce higher dynamic friction during sliding than the “long” orientation. This increase in dynamic friction could be due to a combination of frictional heating effects, as described by Fortunato et al. [11], and wear effects. Hale et al. [7] and Emani and Khaleghian [10] both found a positive correlation between dynamic friction and wear for sliding rubber blocks. This increase in friction due to wearing can be understood by considering the additional energy needed to break internal bonds within the rubber, leading to mass loss. This means more tangential force is needed to maintain the same rate of sliding. Additionally, Hale et al. [7] observed that shapes with a greater leading-edge length experienced more mass loss during sliding. This same finding is observed here. The “short” tread orientation has a longer leading-edge than the “long” orientation, and thus, experienced an increased mass loss of 3.9 mg in comparison to the “long” tread element, hence, explaining the increase in dynamic friction for the “short” tread orientation.
Wear analysis of the tread element surface shows a drastic roughening of its topography, increasing the surface height range from 30 to 140 μm. This change in roughness is likely to have a frictional effect also.

5. Conclusions

Taking data from biomechanical studies on hardcourt tennis movements, two tribological tests were developed to analyze the frictional performance of a real tennis shoe tread element in two orientations. No frictional difference was observed for the change in orientation for the step movement. During the slide tests, tread orientation was shown to have a moderate effect on dynamic CoF. This frictional effect is considered to be a result of varied degrees of frictional heating and wearing that are shape dependent. This research suggests that the frictional effect of tread during hardcourt tennis depends on the nature of the movement being performed, and whether it results in wearing of the individual elements.
Further work will aim to better understand the role of frictional heating through direct measurement, as well as examining whether the same frictional effects described in this study occur during the testing of full-sized tennis shoes. This will be investigated using a full-shoe test device, capable of generating loads and slide velocities representative of step and slide movements.

Acknowledgments

The authors acknowledge the funding to conduct this research from the Engineering and Physical Science Research Council (EPSRC) and the International Tennis Federation (ITF). We would also like to thank Sport Group for supplying the surfaces.

Conflicts of Interest

The authors declare no conflict of interest. The funding sponsors had no role in the design of the study; in the collection, analyses, or interpretation of data; in the writing of the manuscript, and in the decision to publish the results.

References

  1. Nigg, B.M.; Stefanyshyn, D.J.; Rozitis, A.I.; Mündermann, A. Resultant knee joint moments for lateral movement tasks on sliding and non-sliding sport surfaces. J. Sports Sci. 2009, 27, 427–435. [Google Scholar] [CrossRef] [PubMed]
  2. Luo, G.; Stefanyshyn, D. Identification of critical traction values for maximum athletic performance. Footwear Sci. 2011, 3, 127–138. [Google Scholar] [CrossRef]
  3. Worobets, J.; Wannop, J.W. Influence of basketball shoe mass, outsole traction, and forefoot bending stiffness on three athletic movements. Sport Biomech. 2015, 14, 351–360. [Google Scholar] [CrossRef] [PubMed]
  4. Goff, J.E.; Ura, D.; Boswell, L.; Carré, M.J. Parametric Study of Simulated Tennis Shoe Treads. Procedia Eng. 2016, 147, 443–448. [Google Scholar] [CrossRef]
  5. Goff, J.E.; Boswell, L.; Ura, D.; Kozy, M.; Carré, M. Critical shoe contact area ratio for sliding on a tennis hard court. Proc. Inst. Mech. Eng. Part P J. Sport Eng. Technol. 2018, 2, 112–121. [Google Scholar] [CrossRef]
  6. Ura, D.; Clarke, J.; Carré, M. Effect of shoe orientation on shoe-surface traction in tennis. Footwear Sci. 2013, 5, 86–87. [Google Scholar] [CrossRef]
  7. Hale, J.; Lewis, R.; Carré, M.J. Rubber friction and the effect of shape. Tribol. Int. 2020, 141, 1–6. [Google Scholar] [CrossRef]
  8. Starbuck, C.; Damm, L.; Clarke, J.; Carré, M.; Capel-Davis, J.; Miller, S.; Stiles, V.; Dixon, S. The influence of tennis court surfaces on player perceptions and biomechanical response. J. Sports Sci. 2016, 34, 1627–1636. [Google Scholar] [CrossRef] [PubMed]
  9. Clarke, J.; Carré, M.J.; Damm, L.; Dixon, S. The development of an apparatus to understand the traction developed at the shoe-surface interface in tennis. Proc. Inst. Mech. Eng. Part P J. Sport Eng. Technol. 2013, 227, 149–160. [Google Scholar] [CrossRef]
  10. Emami, A.; Khaleghian, S. Investigation of tribological behavior of Styrene-Butadiene Rubber compound on asphalt-like surfaces. Tribol. Int. 2019, 136, 487–495. [Google Scholar] [CrossRef]
  11. Fortunato, G.; Ciaravola, V.; Furno, A.; Lorenz, B.; Persson, B.N.J. General theory of frictional heating with application to rubber friction. J. Phys. Condens. Matter. 2015, 27, 1–16. [Google Scholar] [CrossRef] [PubMed]
  12. Needham, J.A.; Sharp, J.S. Watch your step! A frustrated total internal reflection approach to forensic footwear imaging. Sci. Rep. 2016, 6, 1–7. [Google Scholar] [CrossRef]
  13. Ura, D. Development of a Test Device to Measure the Tribological Behaviour of Shoe-Surface Interactions in Tennis. Ph.D. Thesis, University of Sheffield, Sheffield, UK, 2014. [Google Scholar]
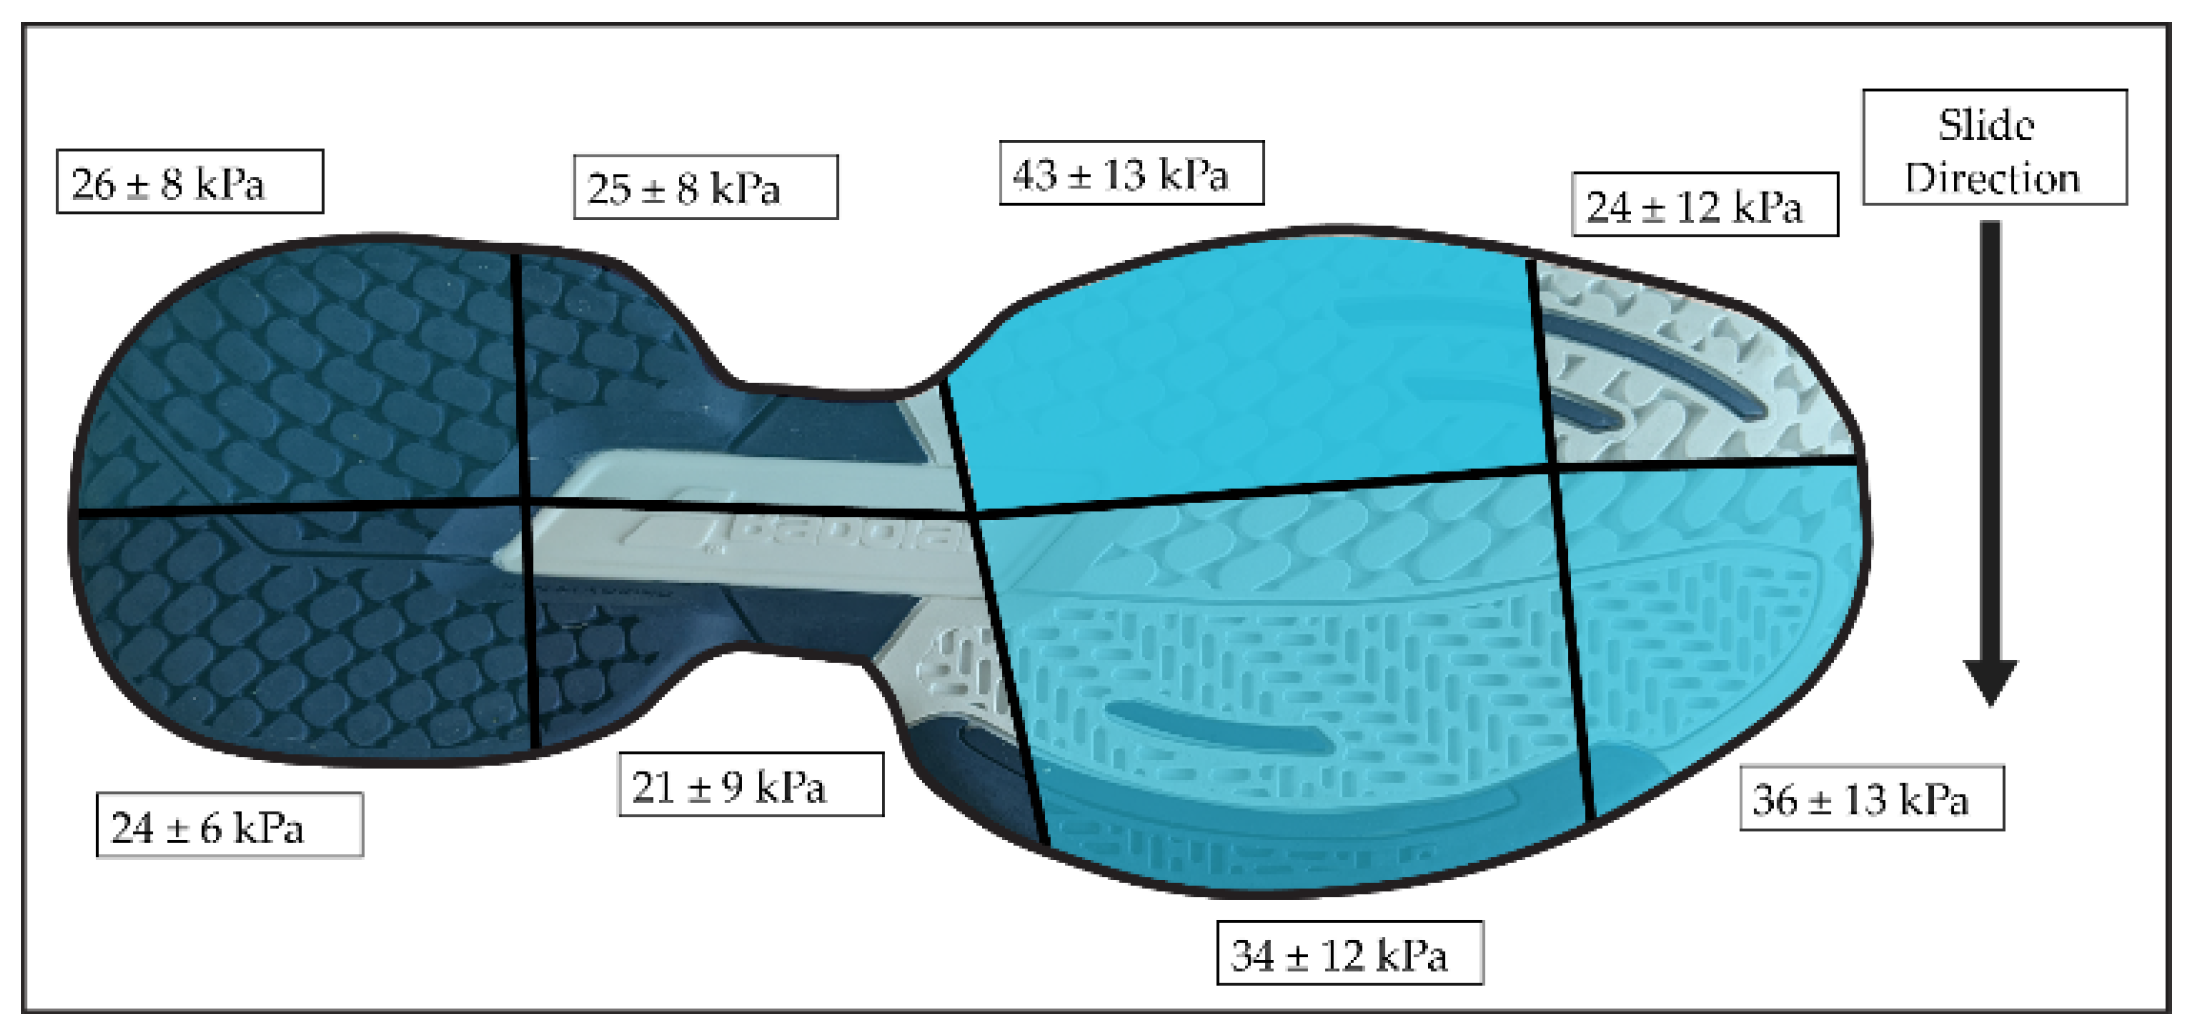
Figure 1. A mean pressure insole map from a leading foot during a hardcourt slide [8].
Proceedings 49 00090 g001
Figure 2. (a) A cut out Babolat tread segment with measurements to calculate the nominal contact area; (b) Surface scan of hardcourt sample.
Proceedings 49 00090 g002
Figure 3. The experimental set-up.
Proceedings 49 00090 g003
Figure 4. (a) A footprint image of the Babolat forefoot with a normal load of 1100 N; (b) A binary version of the footprint from which contact areas were calculated.
Proceedings 49 00090 g004
Figure 5. A typical CoF-time trace from the step experiments. The red star indicates the static CoF.
Proceedings 49 00090 g005
Figure 6. (a) The static CoF readings for the step test; (b) The dynamic CoF readings for the slide test.
Proceedings 49 00090 g006
Figure 7. (a) A rubber surface scan taken before any testing; (b) A rubber surface scan taken after the hardcourt slide testing with noticeable increased roughness through wearing.
Proceedings 49 00090 g007
Table 1. Test parameters for steps and slides with the tests done by each tread element.
MovementTest Parameters
Normal Load (N)Slide Velocity (mm/s)Total Slide Time (s)
Step331010
Slide2520000.8
Publisher’s Note: MDPI stays neutral with regard to jurisdictional claims in published maps and institutional affiliations.