The IART System for Race Walking: Experience with World-Class Olympic Race Walkers †


 and
and 
Abstract
:1. Introduction
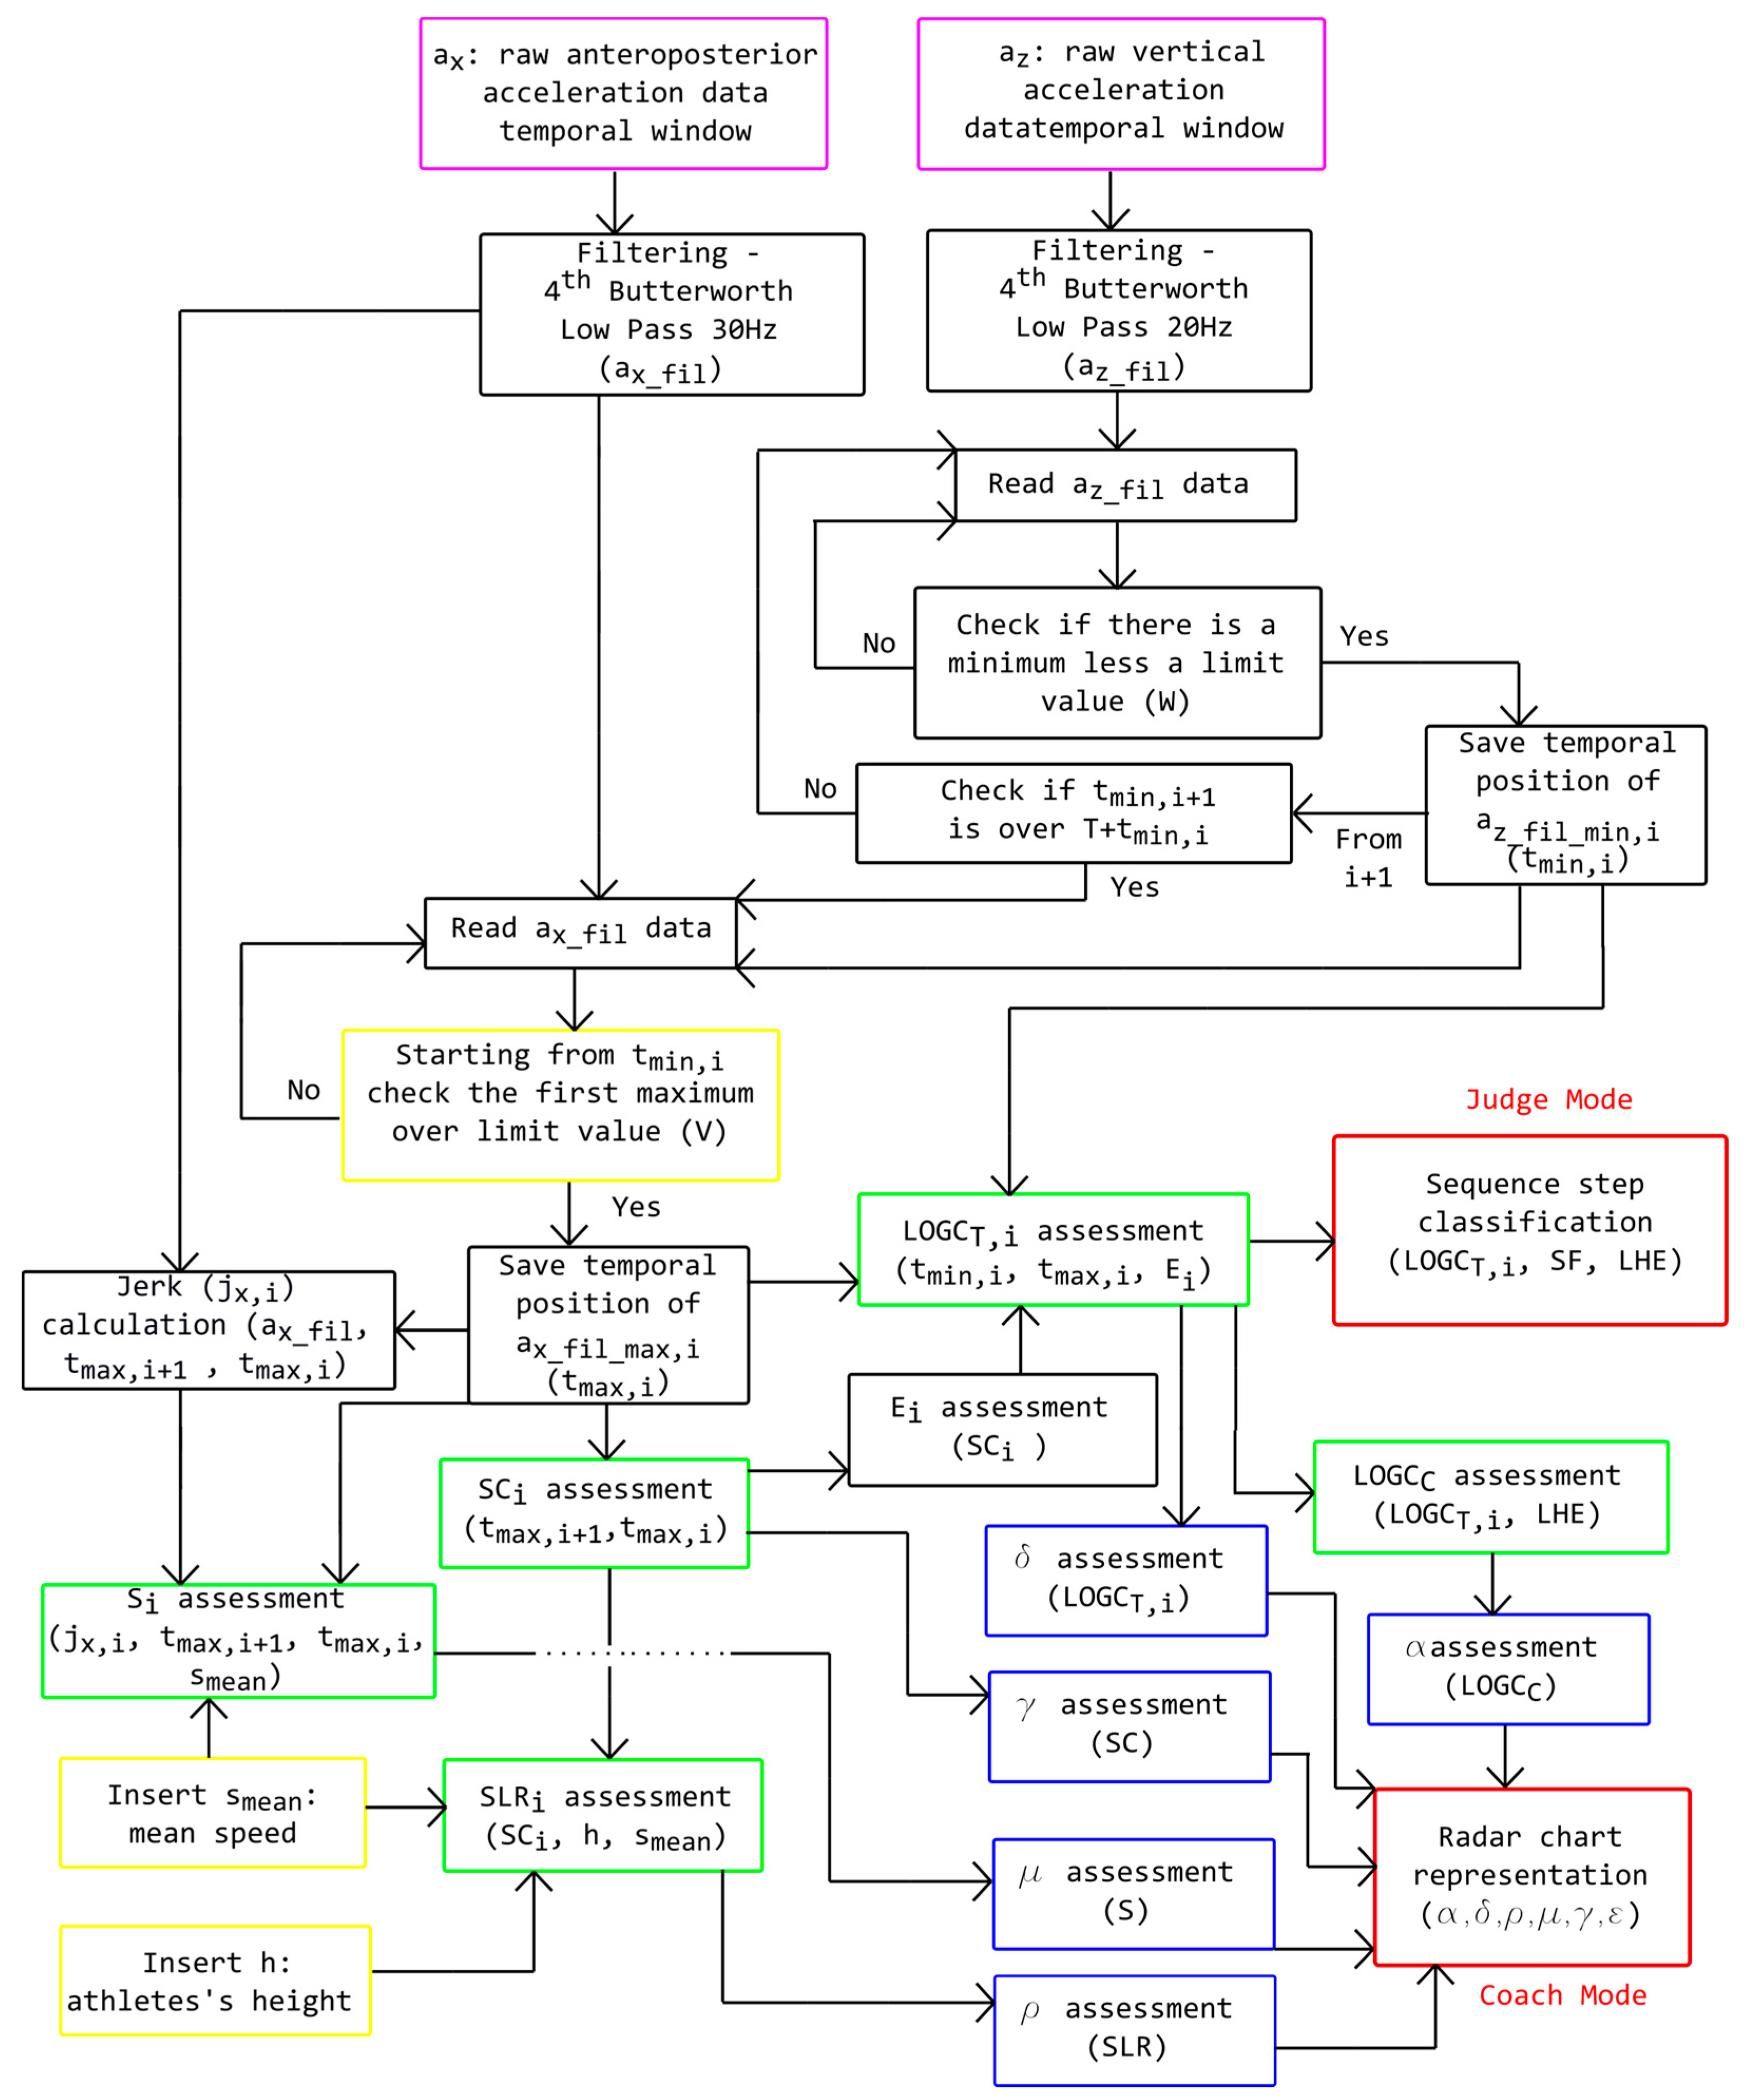
2. Materials and Methods
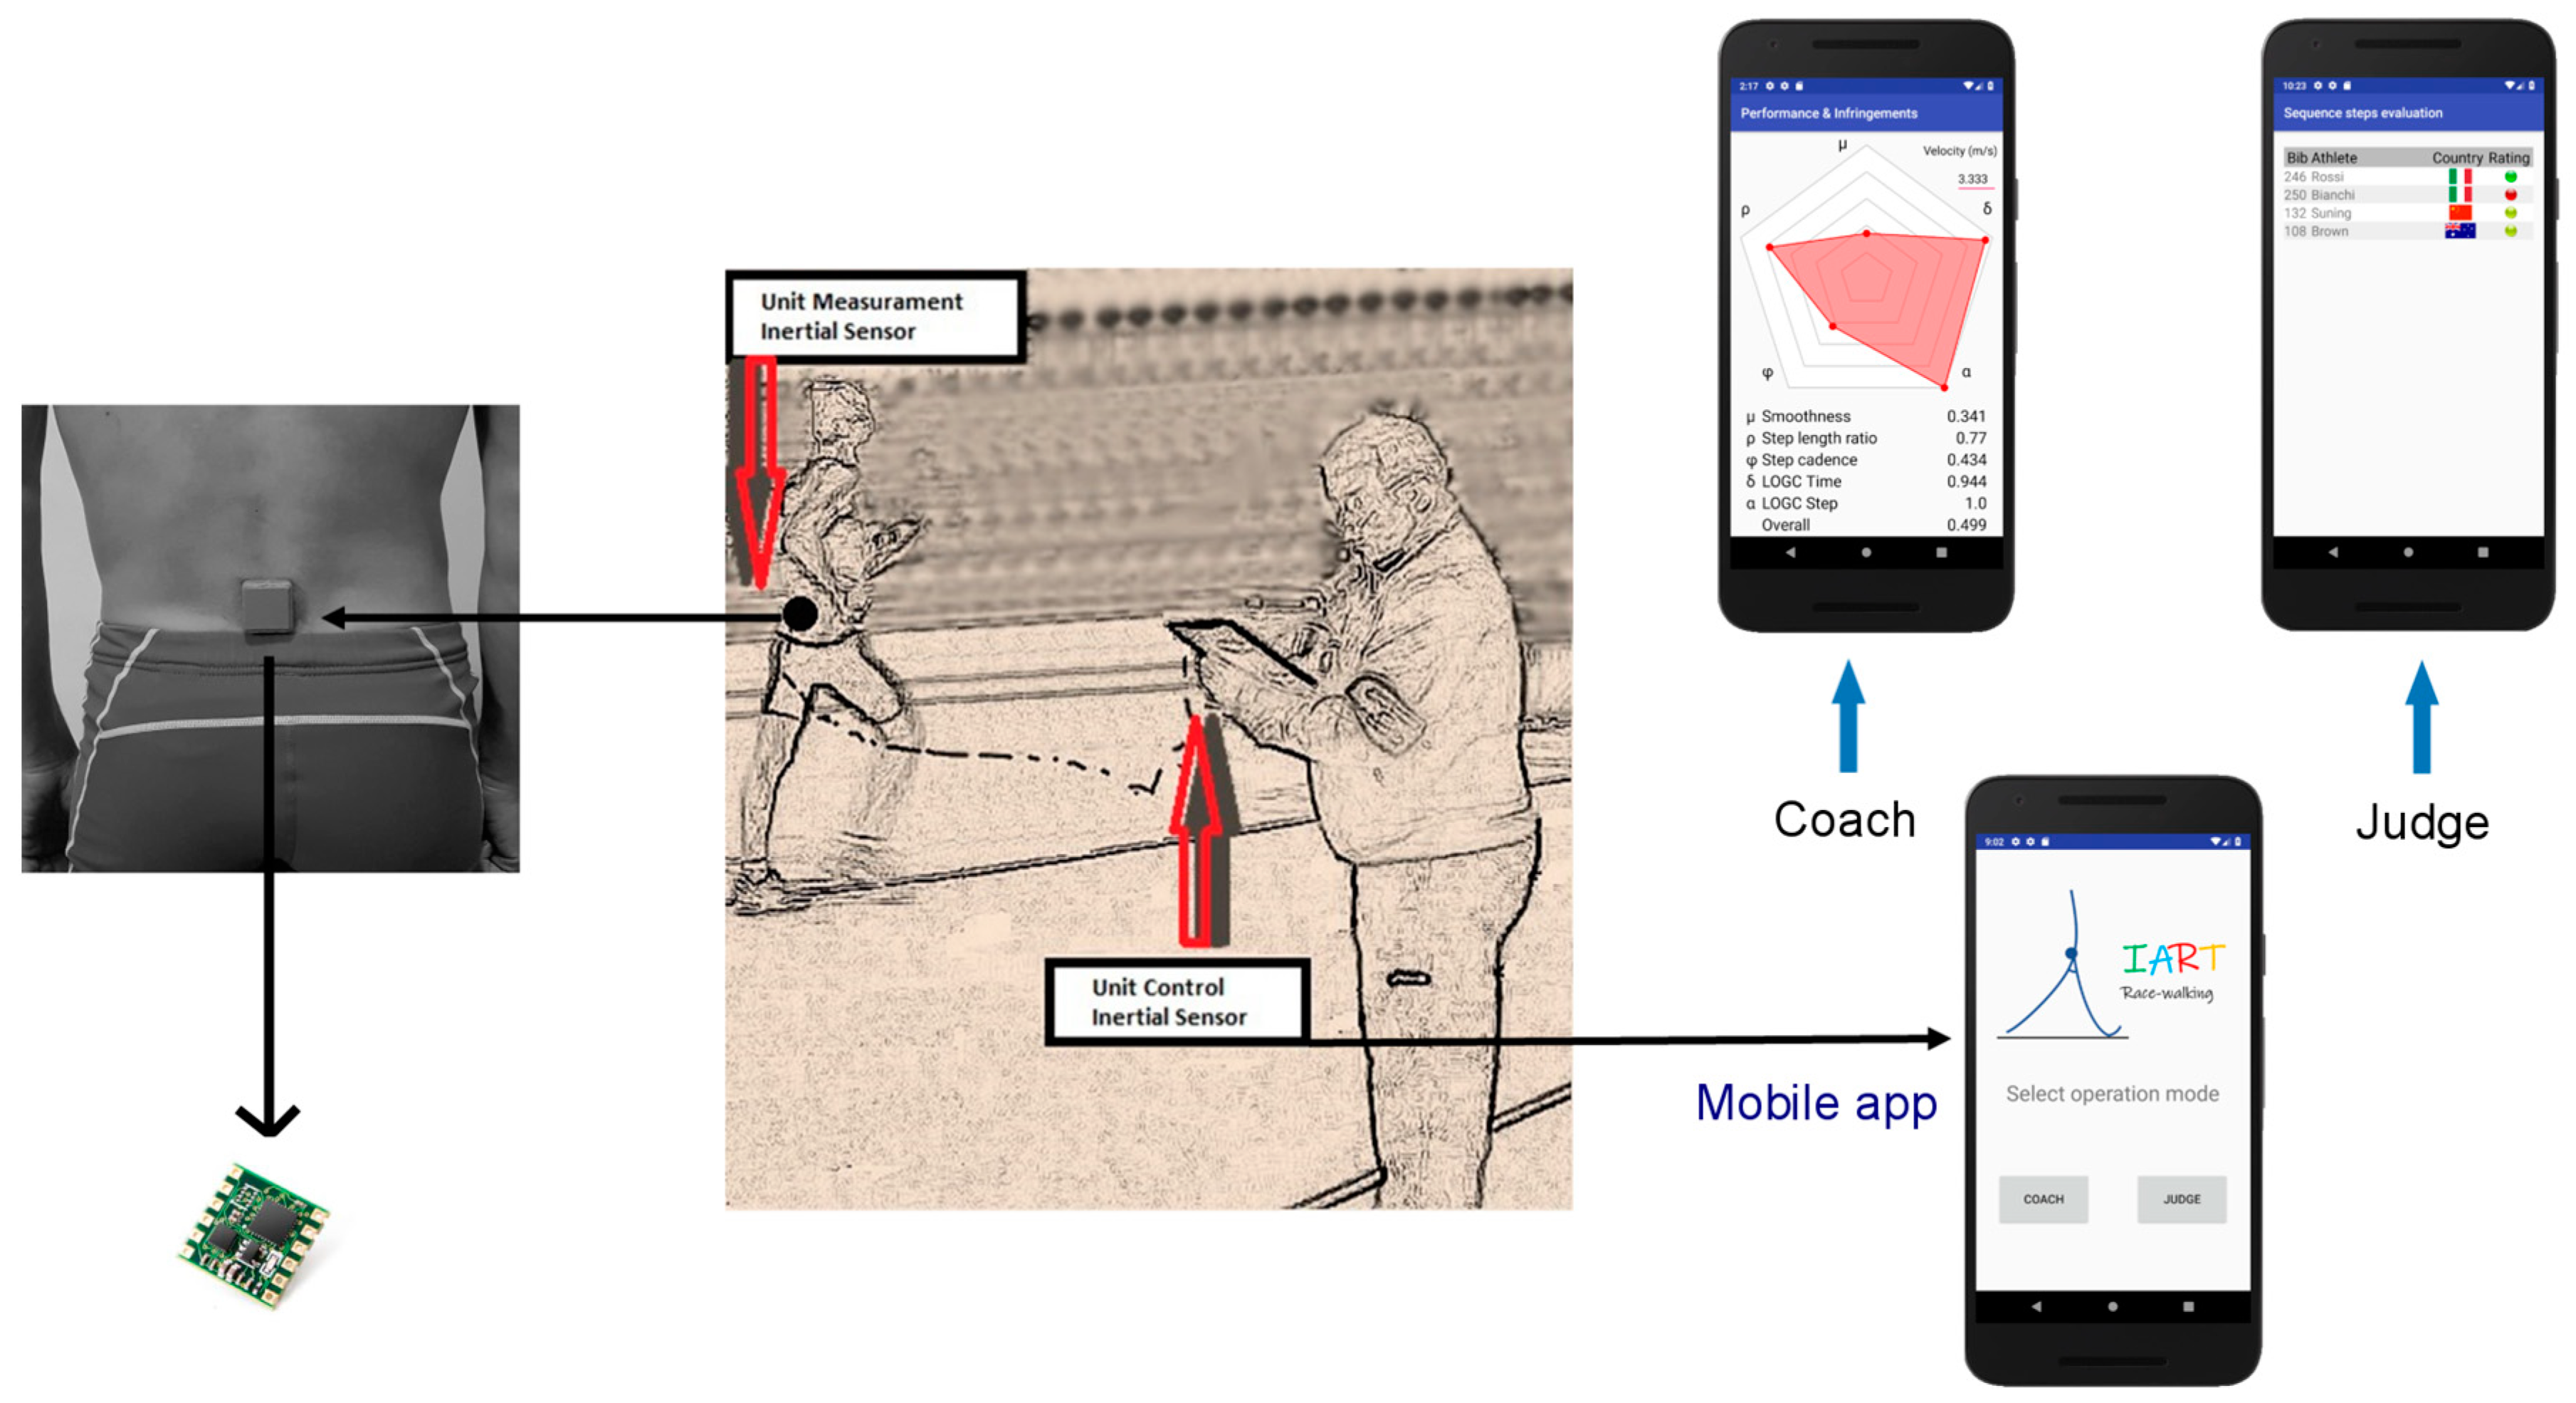
2.1. Measurament Unit
2.2. Management Unit
2.3. Athletes and Experimental Protocol
3. Results
3.1. Judges Mode
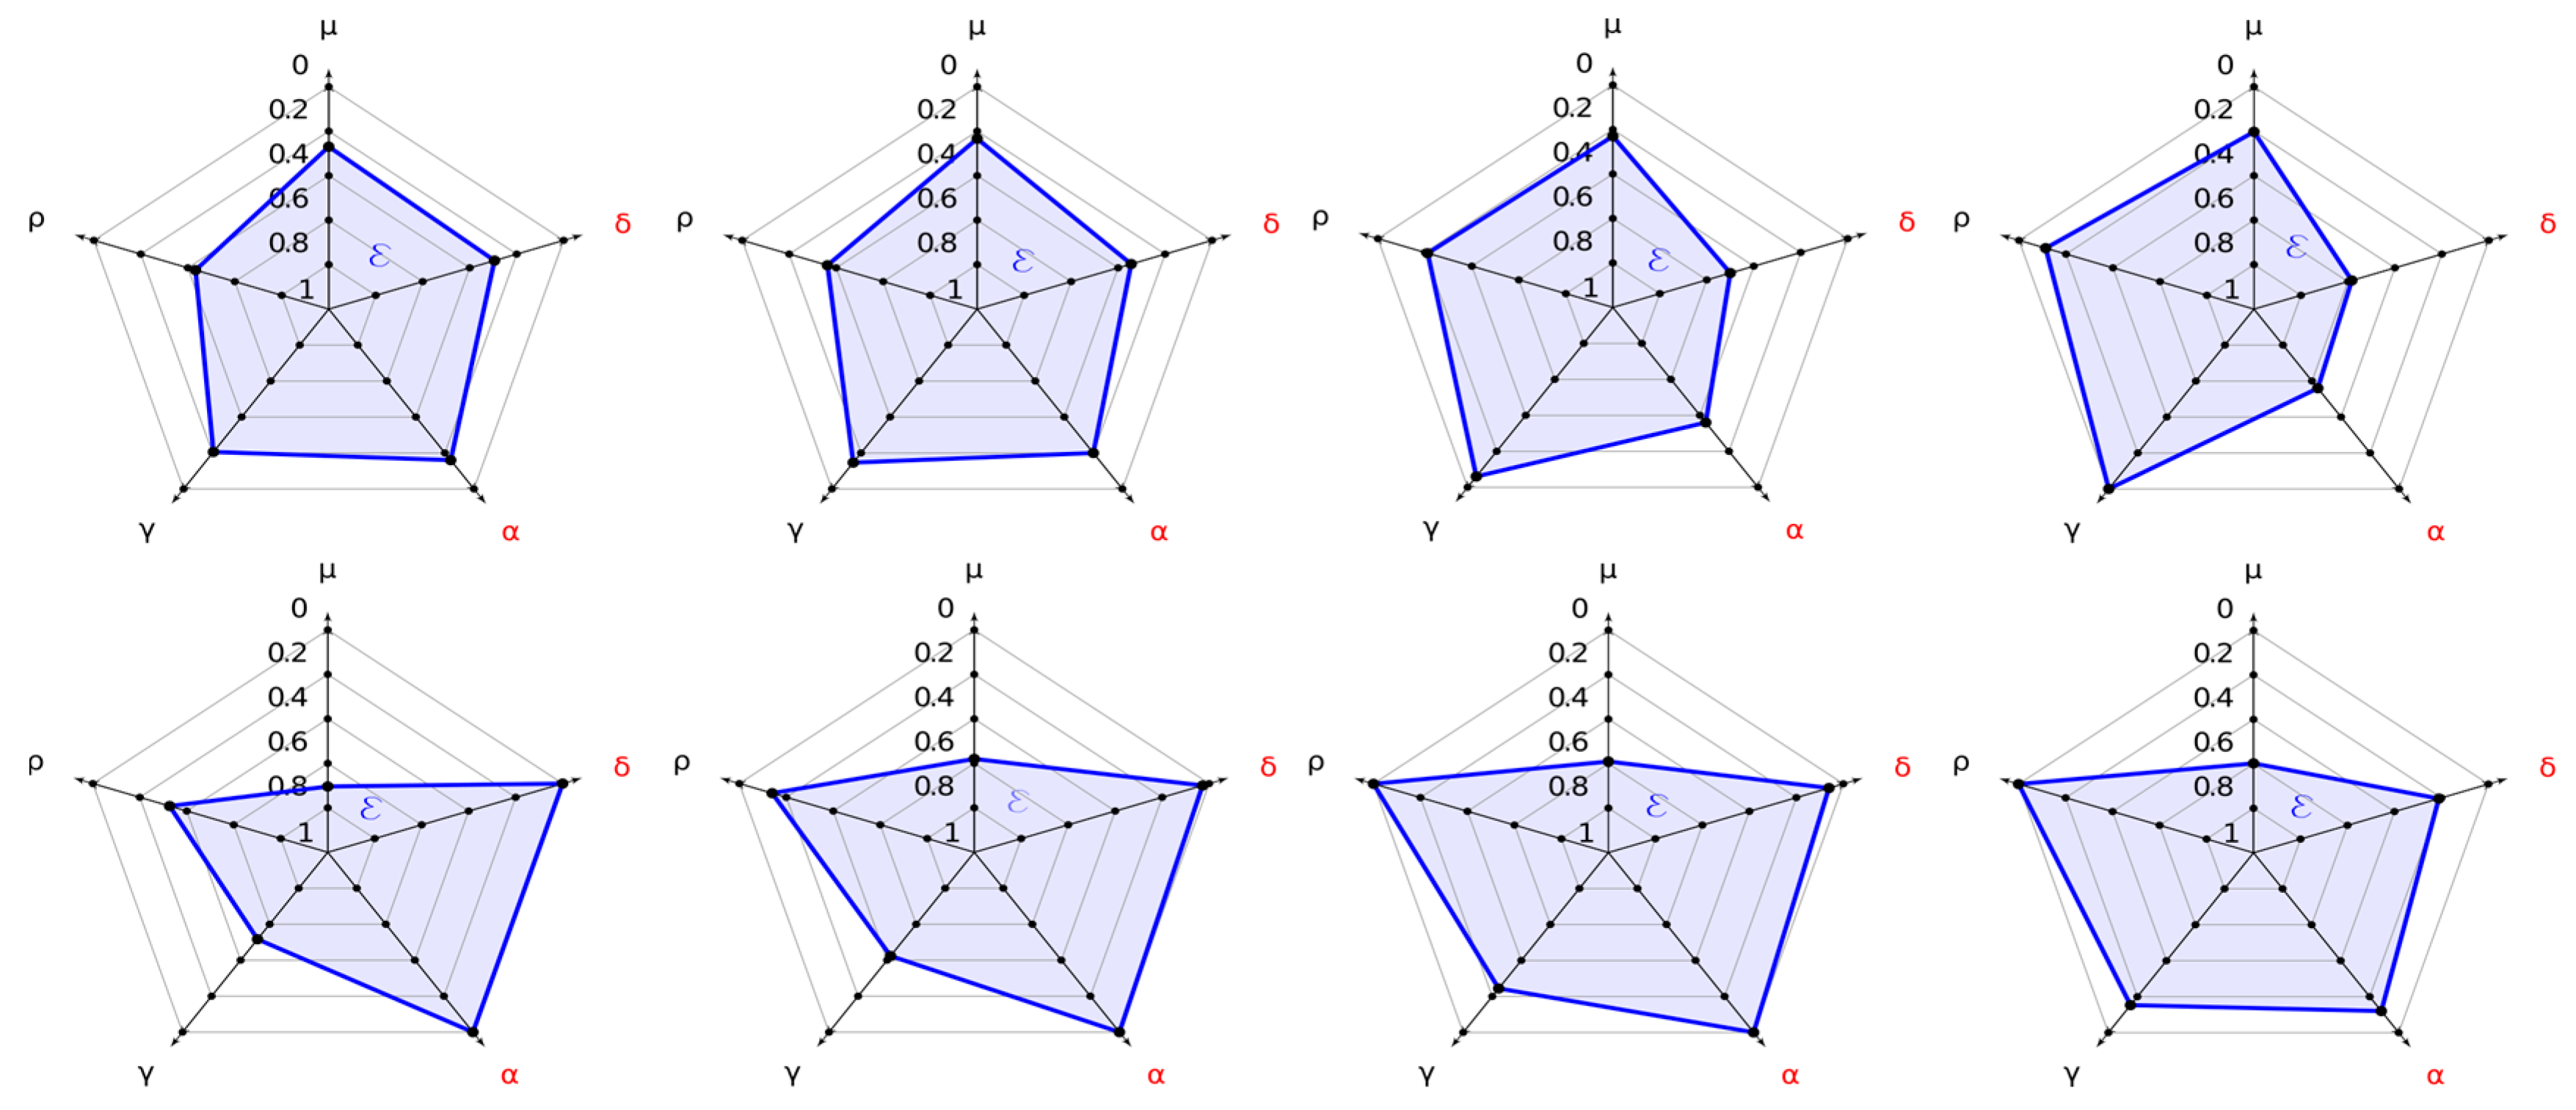
3.2. Coach Mode
4. Discussion
5. Conclusions
Acknowledgments
Conflicts of Interest
References
- IAAF. Race Walking a Guide to Judging and Organising. A Guide for Judges, Officials, Coaches and Athletes; World Athletics: Monaco, 2018. [Google Scholar]
- Di Gironimo, G.; Caporaso, T.; Amodeo, G.; Del Giudice, D.M.; Lanzotti, A.; Odenwald, S. Outdoor tests for the validation of an inertial system able to detect illegal steps in race-walking. Procedia Eng. 2016, 147, 544–549. [Google Scholar] [CrossRef]
- Di Gironimo, G.; Caporaso, T.; Del Giudice, D.M.; Tarallo, A.; Lanzotti, A. Development of a new experimental protocol for analysing the race-walking technique based on kinematic and dynamic parameters. Procedia Eng. 2016, 147, 741–746. [Google Scholar] [CrossRef]
- “Olympic.org”: 50 km walk men. Available online: https://www.olympic.org/rio-2016/athletics/50km-walk-men (accessed on 20 May 2020).
- Hanley, B. A biomechanical analysis of world-class senior and junior race walkers. New Stud. Athl. 2013, 28, 75–82. [Google Scholar]
- Lee, J.B.; Mellifont, R.B.; Burkett, B.J.; James, D.A. Detection of illegal race walking: A tool to assist coaching and judging. Sensors 2013, 13, 16065–16074. [Google Scholar] [CrossRef]
- Taborri, J.; Palermo, E.; Rossi, S. Automatic Detection of Faults in Race Walking: A Comparative Analysis of Machine-Learning Algorithms Fed with Inertial Sensor Data. Sensors 2019, 19, 1461. [Google Scholar] [CrossRef]
- Di Gironimo, G.; Caporaso, T.; Del Giudice, D.M.; Lanzotti, A. Towards a new monitoring system to detect illegal steps in race-walking. IJIDeM 2017, 11, 317–329. [Google Scholar] [CrossRef]
- Caporaso, T.; Grazioso, S. The IART system: Inertial Assistant Referee and Trainer for race-walking. Sensors 2020, 20, 783. [Google Scholar] [CrossRef]
- Caporaso, T.; Grazioso, S.; Di Gironimo, G.; Lanzotti, A. Biomechanical indices represented on radar chart for assessment of performance and infringements in elite race walkers. Sports Eng. 2020, 23, 4. [Google Scholar] [CrossRef]
- Knicker, A.; Loch, M. Race walking technique and judging—The final report of the International Athletic Foundation research project. New Stud. Athl. 1990, 5, 25–38. [Google Scholar]
- Hanley, B.; Tucker, C.B.; Bissas, A. Assessment of IAAF racewalk judges’ ability to detect legal and non-legal technique. Front. Sports Act. Living 2019, 1, 9. [Google Scholar] [CrossRef]

| 12.0 km/h | 13.0 km/h | 14.0 km/h | 14.5 km/h | 15.5 km/h | |
|---|---|---|---|---|---|
| LOGCT [ms] | 20 ± 10 | 35 ± 10 | 40 ± 10 | 45 ± 10 | 65 ± 10 |
| False Alarm [%] | 8 | 24 | 33 | 14 | 100 |
| Miss Alarm [%] | 64 | 52 | 22 | 55 | 0 |
| TPR [%] | 92 | 76 | 66 | 86 | 0 |
| FPR [%] | 64 | 52 | 22 | 54 | 0 |
| Accuracy [%] | 91 | 73 | 70 | 79 | 94 |
Publisher’s Note: MDPI stays neutral with regard to jurisdictional claims in published maps and institutional affiliations. |
© 2020 by the authors. Licensee MDPI, Basel, Switzerland. This article is an open access article distributed under the terms and conditions of the Creative Commons Attribution (CC BY) license (https://creativecommons.org/licenses/by/4.0/).
Share and Cite
Caporaso, T.; Grazioso, S.; Panariello, D.; Gironimo, G.D.; Lanzotti, A. The IART System for Race Walking: Experience with World-Class Olympic Race Walkers. Proceedings 2020, 49, 79. https://doi.org/10.3390/proceedings2020049079
Caporaso T, Grazioso S, Panariello D, Gironimo GD, Lanzotti A. The IART System for Race Walking: Experience with World-Class Olympic Race Walkers. Proceedings. 2020; 49(1):79. https://doi.org/10.3390/proceedings2020049079
Chicago/Turabian StyleCaporaso, Teodorico, Stanislao Grazioso, Dario Panariello, Giuseppe Di Gironimo, and Antonio Lanzotti. 2020. "The IART System for Race Walking: Experience with World-Class Olympic Race Walkers" Proceedings 49, no. 1: 79. https://doi.org/10.3390/proceedings2020049079
APA StyleCaporaso, T., Grazioso, S., Panariello, D., Gironimo, G. D., & Lanzotti, A. (2020). The IART System for Race Walking: Experience with World-Class Olympic Race Walkers. Proceedings, 49(1), 79. https://doi.org/10.3390/proceedings2020049079