Clustering Golfers through Force Plate Analysis †

Abstract
:1. Introduction
2. Materials and Methods
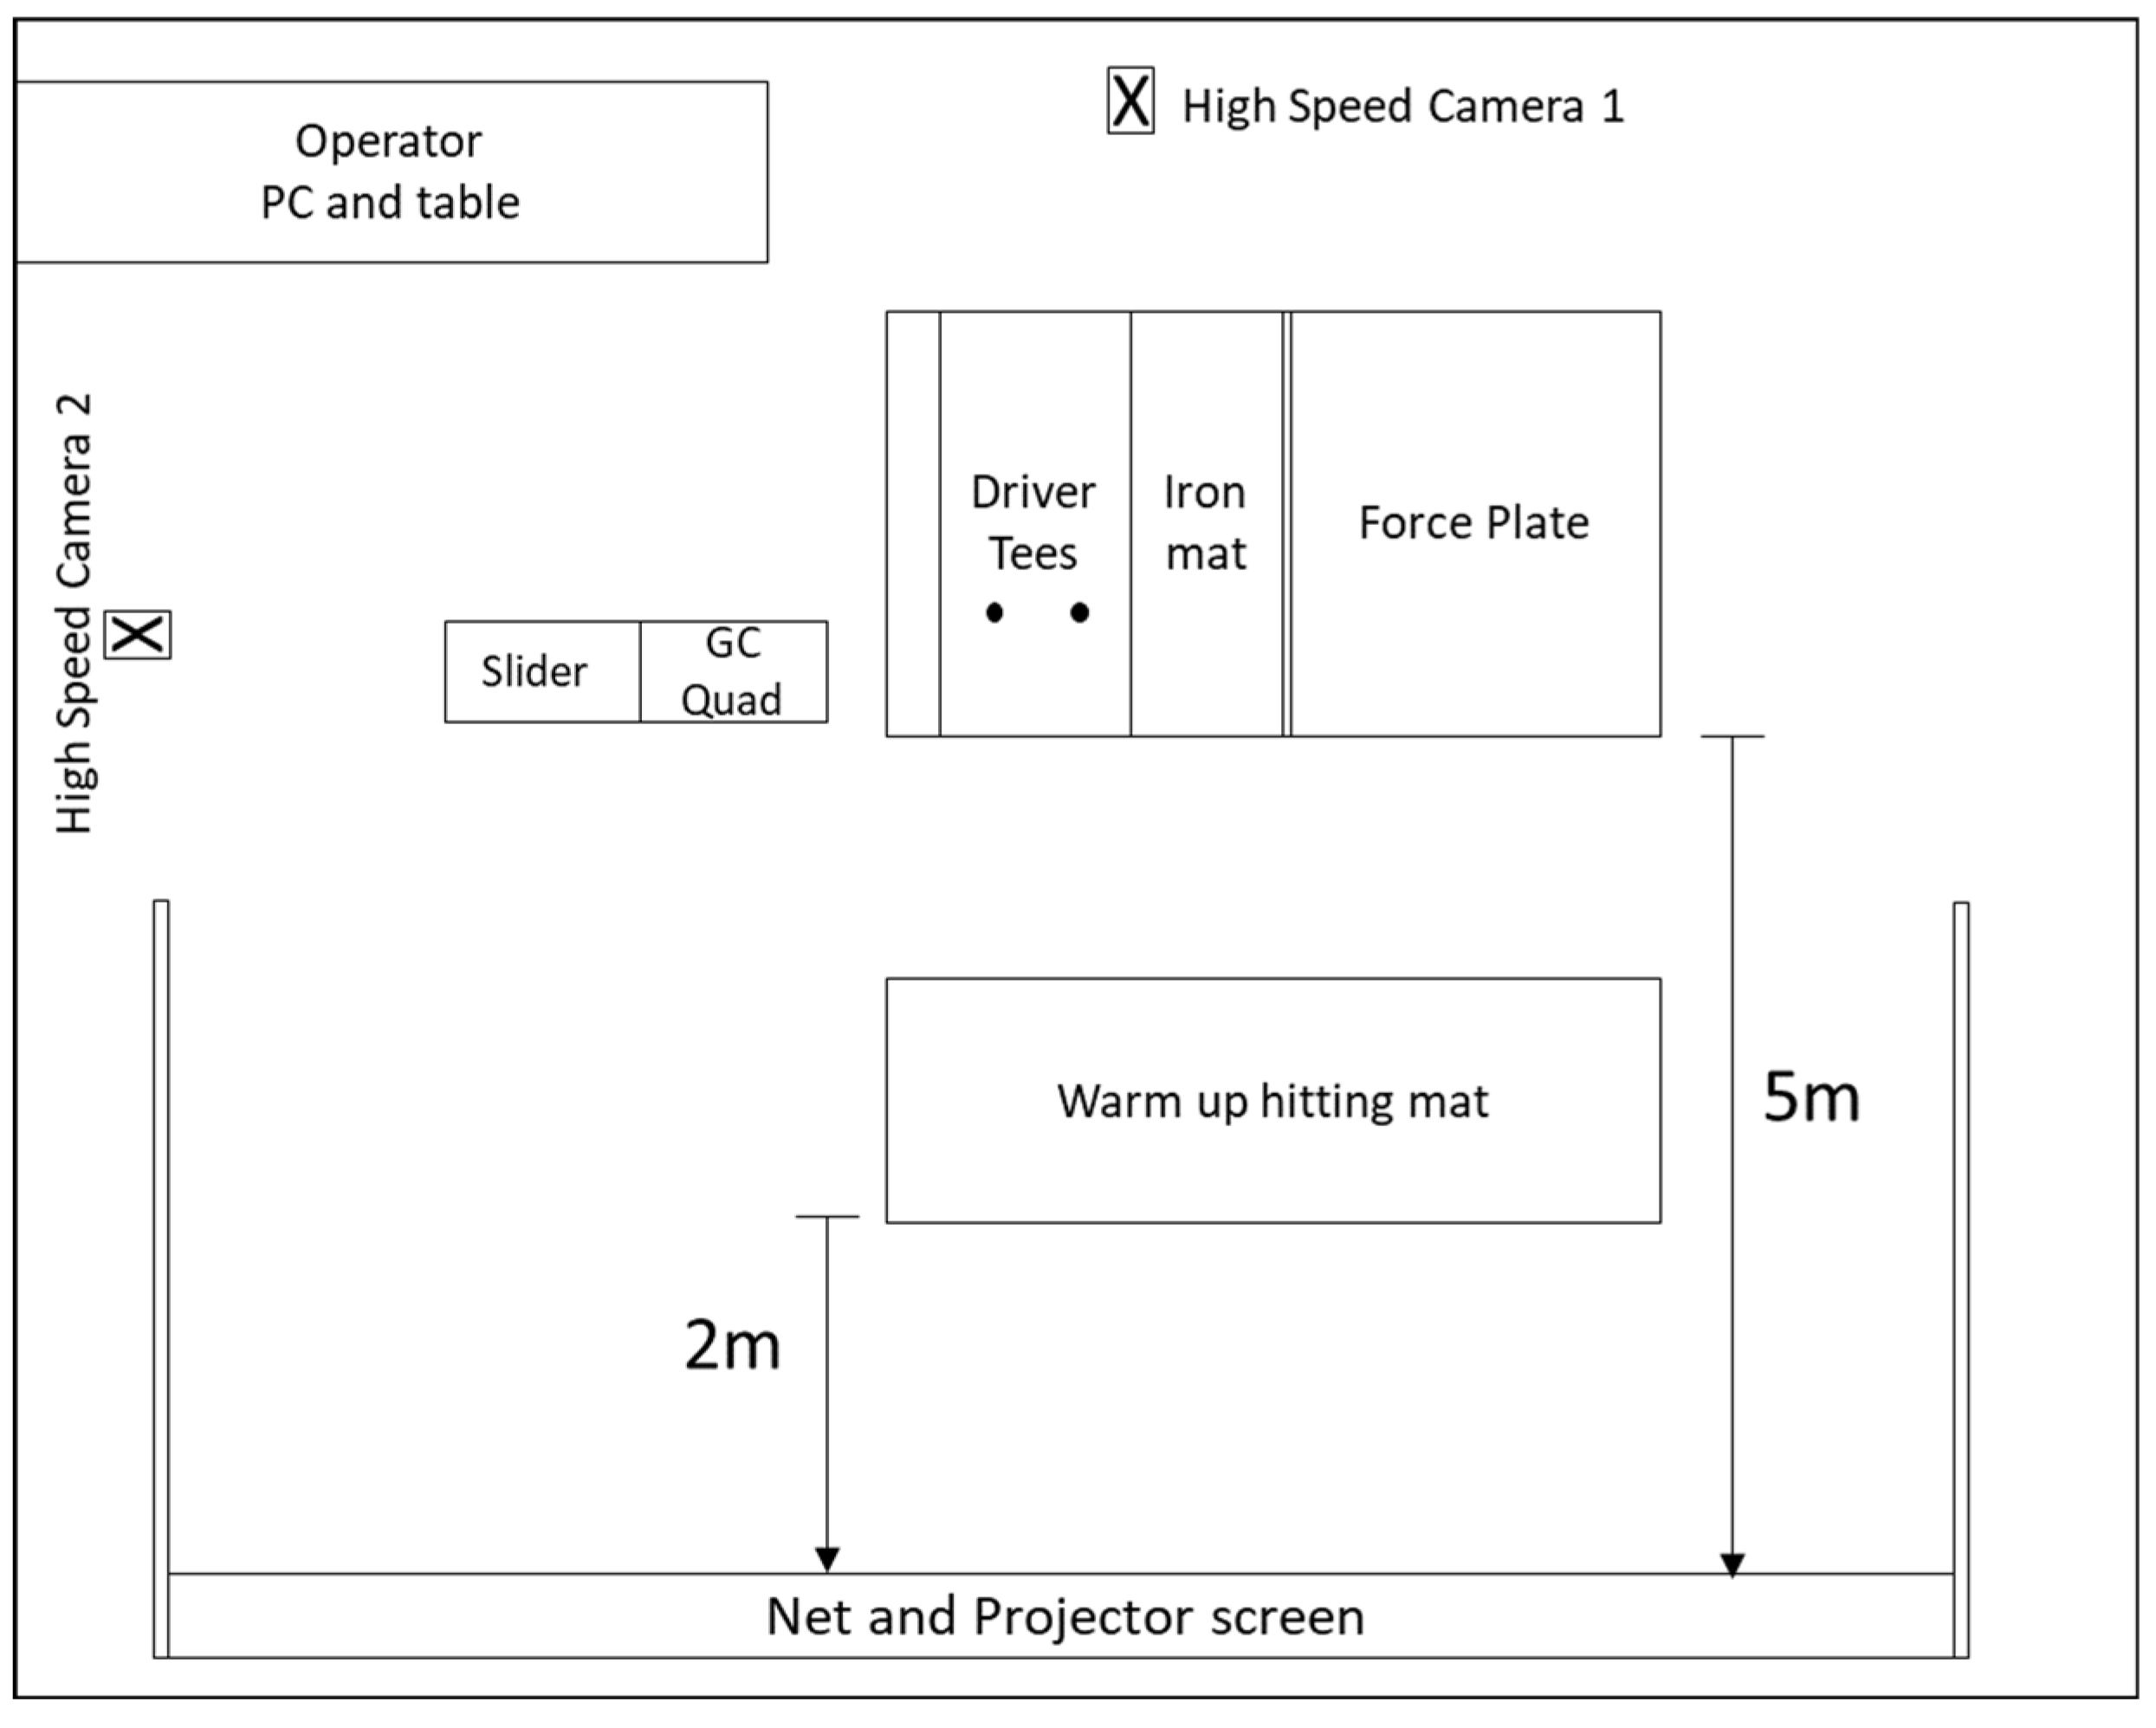
2.1. Materials
2.2. Pilot Study
2.3. Anaylsis
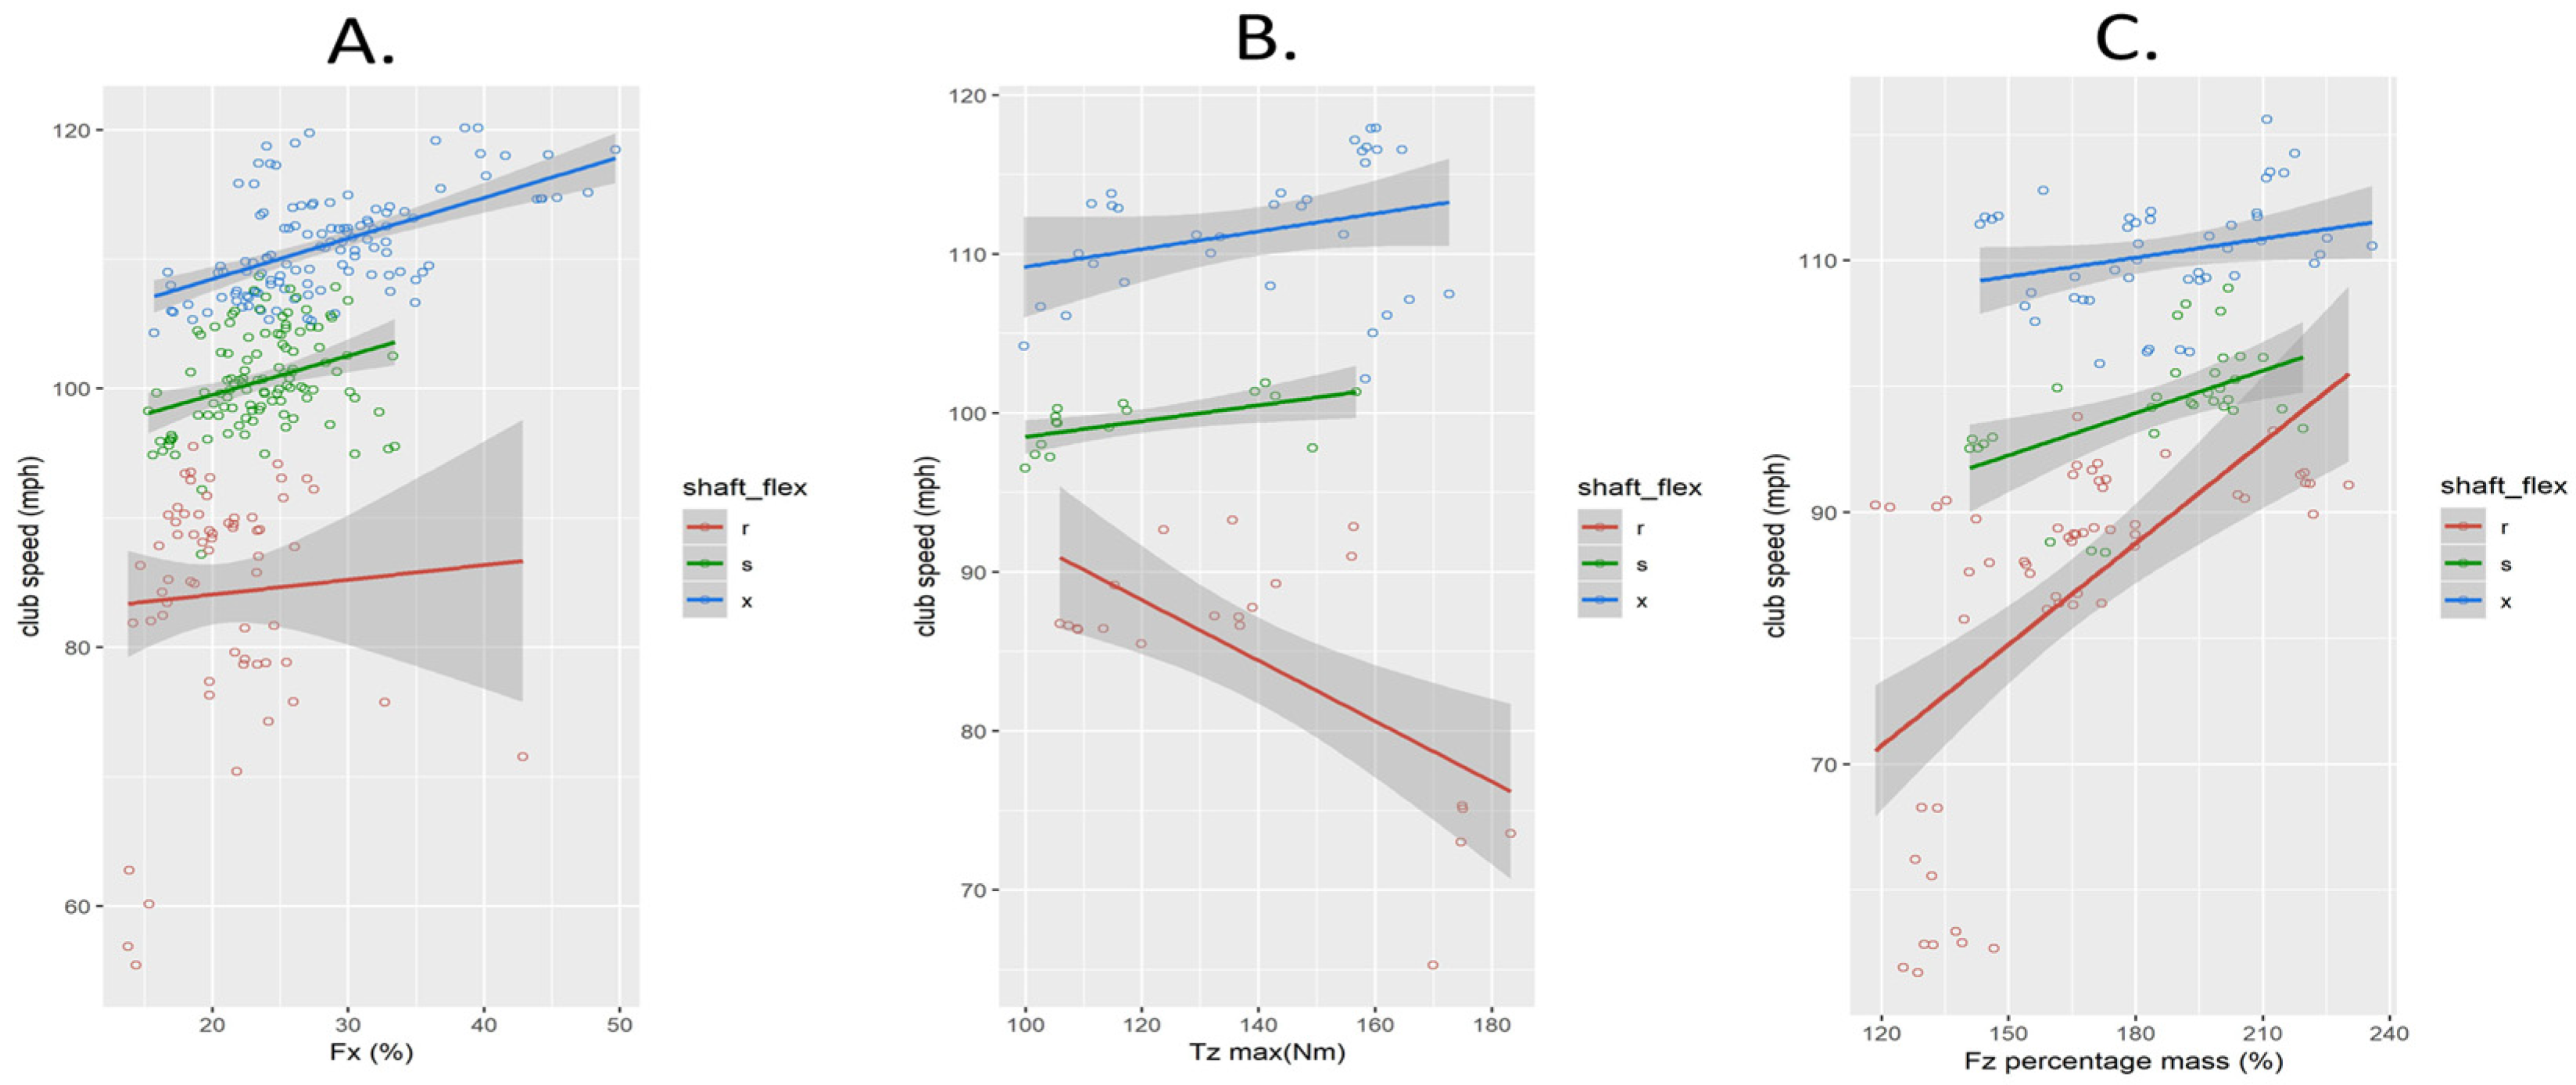
3. Results
4. Discussion
5. Conclusions
Conflicts of Interest
References
- Postolache, O.; Postolache, G. Development and selection of balance sensing devices. IEEE Instrum. Meas. Mag. 2017, 20, 38–48. [Google Scholar]
- Choi, A.; Kang, T.G.; Mun, J.H. Biomechanical Evaluation of Dynamic Balance Control Ability During Golf Swing. J. Med Boil. Eng. 2016, 36, 430–439. [Google Scholar] [CrossRef]
- Ball, K.; Best, R.J. Different centre of pressure patterns within the golf stroke II: Group-based analysis. J. Sports Sci. 2007, 25, 771–779. [Google Scholar] [CrossRef] [PubMed]
- Ball, K.; Best, R.J. Different centre of pressure patterns within the golf stroke I: Cluster analysis. J. Sports Sci. 2007, 25, 757–770. [Google Scholar] [CrossRef] [PubMed]
- Lynn, S.K.; Noffal, G.J.; Wu, W.F.; Vandervoort, A.A. Using Principal Components Analysis to Determine Differences in 3D Loading Patterns Between Beginner and Collegiate Level Golfers. Int. J. Golf. Sci. 2012, 1, 25–41. [Google Scholar] [CrossRef]


| Category | CoP at Backswing | CoP at Contact |
|---|---|---|
| Front foot CoP style | Back foot | Front foot |
| Reverse CoP style | Mid stance of front foot | Mid stance |
| Category | Slow | Medium | Fast |
|---|---|---|---|
| Speed | <42 m/s (95 mph) | 42 m/s (95 mph)–47 m/s (105 mph) | >47 m/s (105 mph) |
| Driver Specifications | 10.5° G400 Alta 55 R | 10.5° G400 Alta CB 55 S | 8.98° G400 LST Tour 65 X |
| Iron Specifications | 30.04° G400 AWT 2.0 R | 30.05° G400 AWT 2.0 S | 33.00° I210 Dynamic gold ×100 |
| Golfers | 31 | 33 | 41 |
| Handicap | 17.55 ± 10.65 | 10.16 ± 5.64 | 3.13 ± 4.04 |
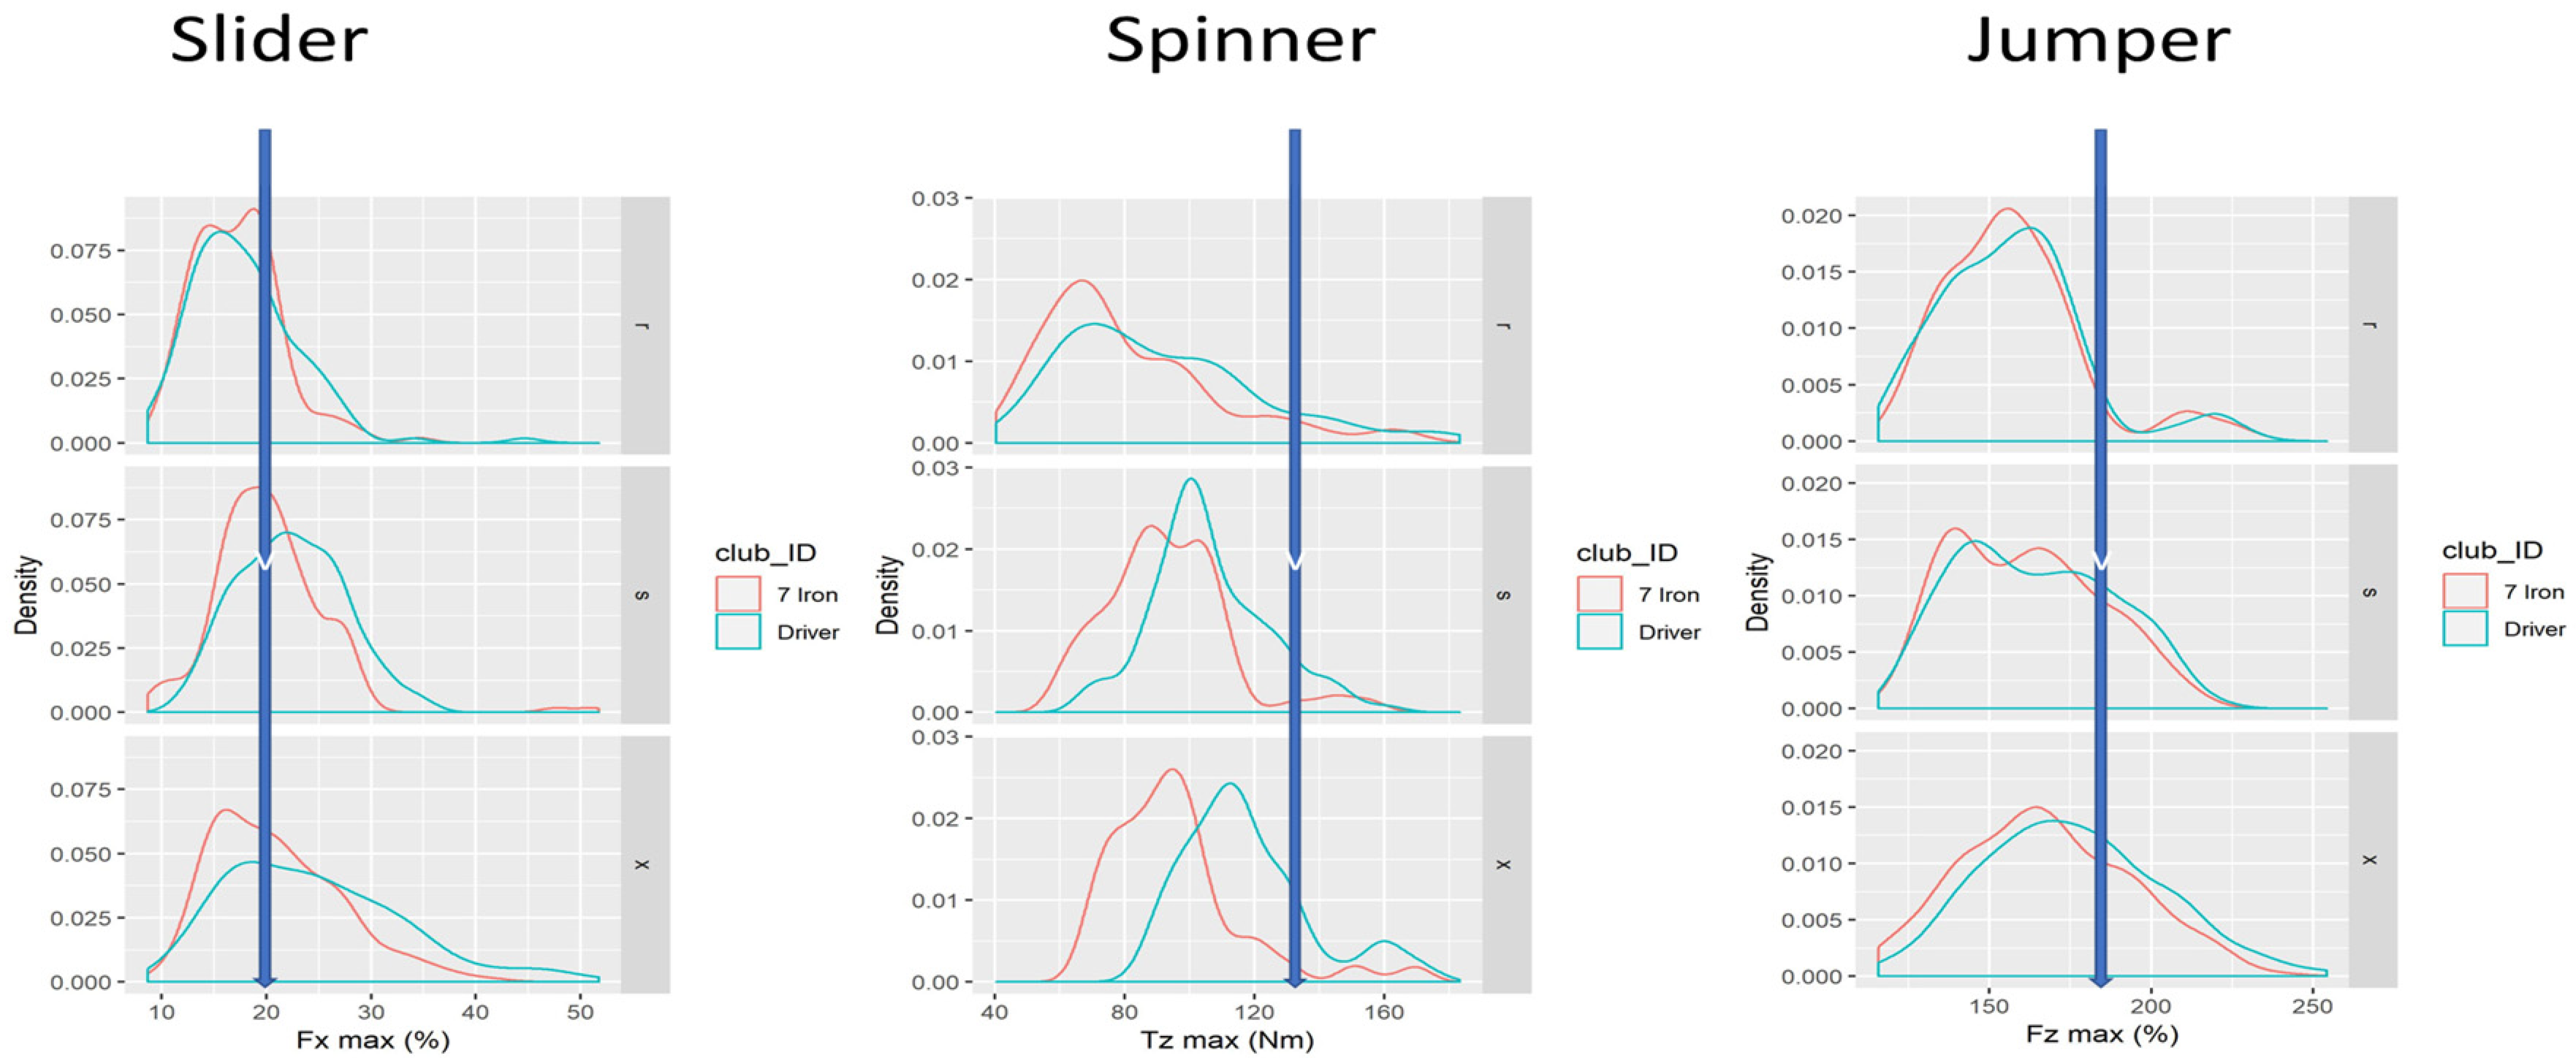
| Measure | Jumper | Spinner | Slider |
|---|---|---|---|
| Primary Force Plane | Vertical | Twisting | Forward/backward |
| Tour threshold | 179% bw | 127.7 Nm | 19.0% bw |
| % Player pool | 32% | 10% | 58% |
| Club | Same Category | Two Categories | Three Categories |
|---|---|---|---|
| Driver | 67% | 32% | 1% |
| Iron | 85% | 14% | 1% |
| Combined | 53% | 38% | 9% |
| Factor (Units) | Group Mean | Slider | Jumper | Spinner |
|---|---|---|---|---|
| Face Angle (°) | 0.48 ± 5.9 | 0.53 ± 5.4 | 0.96 ± 6.6 | −1.44 ± 6.4 |
| Attack Angle (°) | −0.86 ± 4.1 | −0.94 ± 4.0 | −1.02 ± 3.8 | 0.16 ± 4.4 |
| Dispersion Area (y2) | 315.41 ± 415.6 | 338.5 ± 448.3 | 227.30 ± 329.4 | 461.77 ± 410.2 |
| Offline Distance (y) | −2.01 ± 22.2 | −2.61 ± 23.0 | 0.20 ± 18.3 | −5.56 ± 28.1 |
| Club path (°) | 0.32 ± 4.7 | 1.18 ± 4.7 | −0.65 ± 4.2 | −1.57 ± 5.3 |
| Closure rate (°/s) | 2643 ± 1107 | 2561 ± 983.4 | 2729 ± 1379 | 2857 ± 682 |
Publisher’s Note: MDPI stays neutral with regard to jurisdictional claims in published maps and institutional affiliations. |
© 2020 by the authors. Licensee MDPI, Basel, Switzerland. This article is an open access article distributed under the terms and conditions of the Creative Commons Attribution (CC BY) license (http://creativecommons.org/licenses/by/4.0/).
Share and Cite
Shepherd, J.; Henrikson, E.; Lynn, S.; Wood, P. Clustering Golfers through Force Plate Analysis. Proceedings 2020, 49, 63. https://doi.org/10.3390/proceedings2020049063
Shepherd J, Henrikson E, Lynn S, Wood P. Clustering Golfers through Force Plate Analysis. Proceedings. 2020; 49(1):63. https://doi.org/10.3390/proceedings2020049063
Chicago/Turabian StyleShepherd, Jonathan, Erik Henrikson, Scott Lynn, and Paul Wood. 2020. "Clustering Golfers through Force Plate Analysis" Proceedings 49, no. 1: 63. https://doi.org/10.3390/proceedings2020049063
APA StyleShepherd, J., Henrikson, E., Lynn, S., & Wood, P. (2020). Clustering Golfers through Force Plate Analysis. Proceedings, 49(1), 63. https://doi.org/10.3390/proceedings2020049063