Proceeding Paper

Experimental and Computational Study of Archery Arrows Fletched with Straight Vanes †

1
Department of Mechanical Engineering and Intelligent Systems, Graduate School of Informatics and Engineering, University of Electro-Communications, 1-5-1 Chofugaoka, Chofu, Tokyo 182-8585, Japan
2
JAXA, 7-44-1 Jindaiji-higashimachi, Chofu, Tokyo 182-8522, Japan
*
Author to whom correspondence should be addressed.
Presented at the 13th Conference of the International Sports Engineering Association, Online, 22–26 June 2020.
Proceedings 2020, 49(1), 56; https://doi.org/10.3390/proceedings2020049056
Published: 15 June 2020

Abstract

:
The aerodynamic characteristics of archery arrows fletched with two types of straight vanes, for which the area is different, were studied. The arrows’ pitching moment (CM), lift (CL) and drag (CD) coefficients were measured in the 60 × 60 cm Magnetic Suspension and Balance System (MSBS) from JAXA. At a Reynolds number of Re = 1.2 × 10⁴, the values of CD were 1.56 and 2.05 for the short and large vanes, respectively. In a second experimental procedure, the arrows’ deceleration in free flight was measured by inserting an acceleration sensor inside their shafts. For shots with an initial velocity of around 56.4 ms−1, a velocity decay of around 8% was measured. A turbulent–laminar boundary layer transition during free flight was found for shots with an average Re = 1.8 × 10⁴. Lastly, through numerical computations, the area difference of the two vanes was analyzed to verify the importance of CM and CL during the arrows’ flights.

1. Introduction

With the increasing popularity of sports engineering, new techniques and tools are being developed to improve the performance of sporting equipment. The present study attempts to advance the understanding of the dynamics of arrows used in archery competition.
Previously, Miyazaki [1] analyzed the influence of arrows’ points in their dynamics. Two different points were studied, the so-called bulge-type and a streamlined. At a Reynolds number of around Re = 2.4 × 10⁴, the boundary layer appeared to be fully turbulent when using the bulge-type point. For the same Re value and using the streamlined point, laminar values of the drag coefficient, CD, were found. The latter suggests that with a proper selection of an arrow’s point, the archer may be able to control the transition from a laminar to a turbulent boundary layer. The deviations in the trajectories of arrows subject to background wind, with laminar and turbulent boundary layers, have been compared [2]. Such deviations in the trajectory are clearly larger for those arrows with turbulent boundary layers than for the laminar cases.
Miyazaki [3] also studied the response of arrows fletched with two different types of curved vanes. It was concluded that by using the vanes with larger area, it is possible to improve the stabilization of arrows during their flights. Numerical computations have been performed [2] to obtain the trajectories of arrows subject to background wind in an archery range of 70 m. Nevertheless, in such computations, CD was considered to remain constant along the complete arrows’ flight. However, it is known that an arrow’s velocity decays around 15% in a 70 m archery field [2]. Since the drag force exerted on flying arrows is proportional to the square of the velocity [3], the variation of the velocity, and likewise CD, must be taken into account to carry out a more realistic analysis.
In this study, the changing drag force exerted on arrows during free flight was measured by an acceleration sensor inserted in the arrow shaft. The experiments were performed at a 55 m indoor archery range. The arrows were fletched with two types of straight vanes, for which the area is different. The static aerodynamic properties of the arrows were measured in the 60 × 60 cm Magnetic Suspension and Balance System (MSBS) from JAXA. Finally, the obtained aerodynamic properties of the arrows were considered in the computation of the equations of a rigid body to simulate the trajectory and attitude of arrows in free flight. From the numerical simulations it is possible to observe some of the flight characteristics that cannot be appreciated during shooting experiments or in MSBS tests.

2. Materials and Methods

This section describes the arrows’ characteristics, the two experimental procedures and the details of the numerical computations.

2.1. Description of the Arrows and the Acceleration Sensor

Arrows are elongated bodies composed of a shaft, a point and a set of fletched vanes for stabilization. The shaft used was an A/C/E 1206 H series/1000, manufactured by wrapping an outer carbon sheet around an inner aluminum alloy tube (Figure 1a). Its mean external radius was r = 2.62 × 10⁻³ m. The point was a bulge-type point and its corresponding insert was shaped to hold steady the point with the arrow’s shaft. The total length of the arrow was l = 0.638 m. Three straight plastic vanes were fletched in the rear part of the arrow to give stabilization during flight. The chosen vanes were Easton Diamond Vanes, size 175 and size 280, hereafter referred to as short and large vanes, respectively (Figure 1b). The total mass of the arrow fletched with short vanes was 14.2 × 10⁻³ kg, whereas the mass for the arrow fletched with large vanes was 15.3 × 10⁻³ kg.
The three components of the angular velocity and the acceleration of the arrow were measured using the acceleration sensor (Logical Product, LP-UUEC002) shown in Figure 1a. It was inserted inside the arrow’s shaft and located in the front part, near the point. The total mass of the sensor, holders (to fix it tightly inside the arrow’s shaft) and battery was 1.37 × 10⁻³ kg. The acceleration sensor operated with a measurement frequency of 200 Hz and its acceleration range was ±16 G. Its maximum rotation rate range was up to ±2250 deg∙s-1.

2.2. Free-Flight and MSBS Experiments

The free flight tests were performed at an indoor archery range of 55 m using a compressed-air launching system, which is a cannon-like device [1]. This propulsion system allowed us to fix the arrows in a steady position before the shot by inserting them in the cannon’s nozzle. To make sure that the initial orientation of the arrows was the same during all the tests, the nozzle was introduced fully into the shaft. The compressed-air launching system also prevented the arrows from showing the characteristic flexural oscillation that would be present if the arrow were shot with a recurve bow. It was possible to shoot the arrows with any initial velocity, V0, up to 75 ms−1 by adjusting the air’s pressure. The pressure range was 4.5–7 MPa, which corresponds to an initial velocity range of 48–57 ms−1. All the ventilation systems were turned off to avoid the interference of the background wind. The arrows’ initial velocity and initial angle of attack were obtained by recording their flights using a high-speed video camera located at 1 m from the launching position. The velocity was verified to decay less than 1% between the launching and the camera positions. Using the acceleration sensor, it was possible to obtain the arrows’ acceleration [G] and the angular velocity [deg∙s-1] in the x, y and z components.
The MSBS is a magnetic wind tunnel that allowed us to suspend the arrows against gravity by using a magnetic field. It was possible to obtain the aerodynamic loads exerted on the arrows from the variation in the electric current necessary to keep them fixed in position. Through the MSBS tests, the values of the drag (CD), lift (CL) and pitching moment (CM) coefficients were obtained.

2.3. Mathematical Model

In this section, the mathematical model used to simulate the motion of archery arrows in free flight, the chosen numerical method to test such a model and the initial conditions used in the computations are described [3].

2.3.1. Equations of Arrow Motion

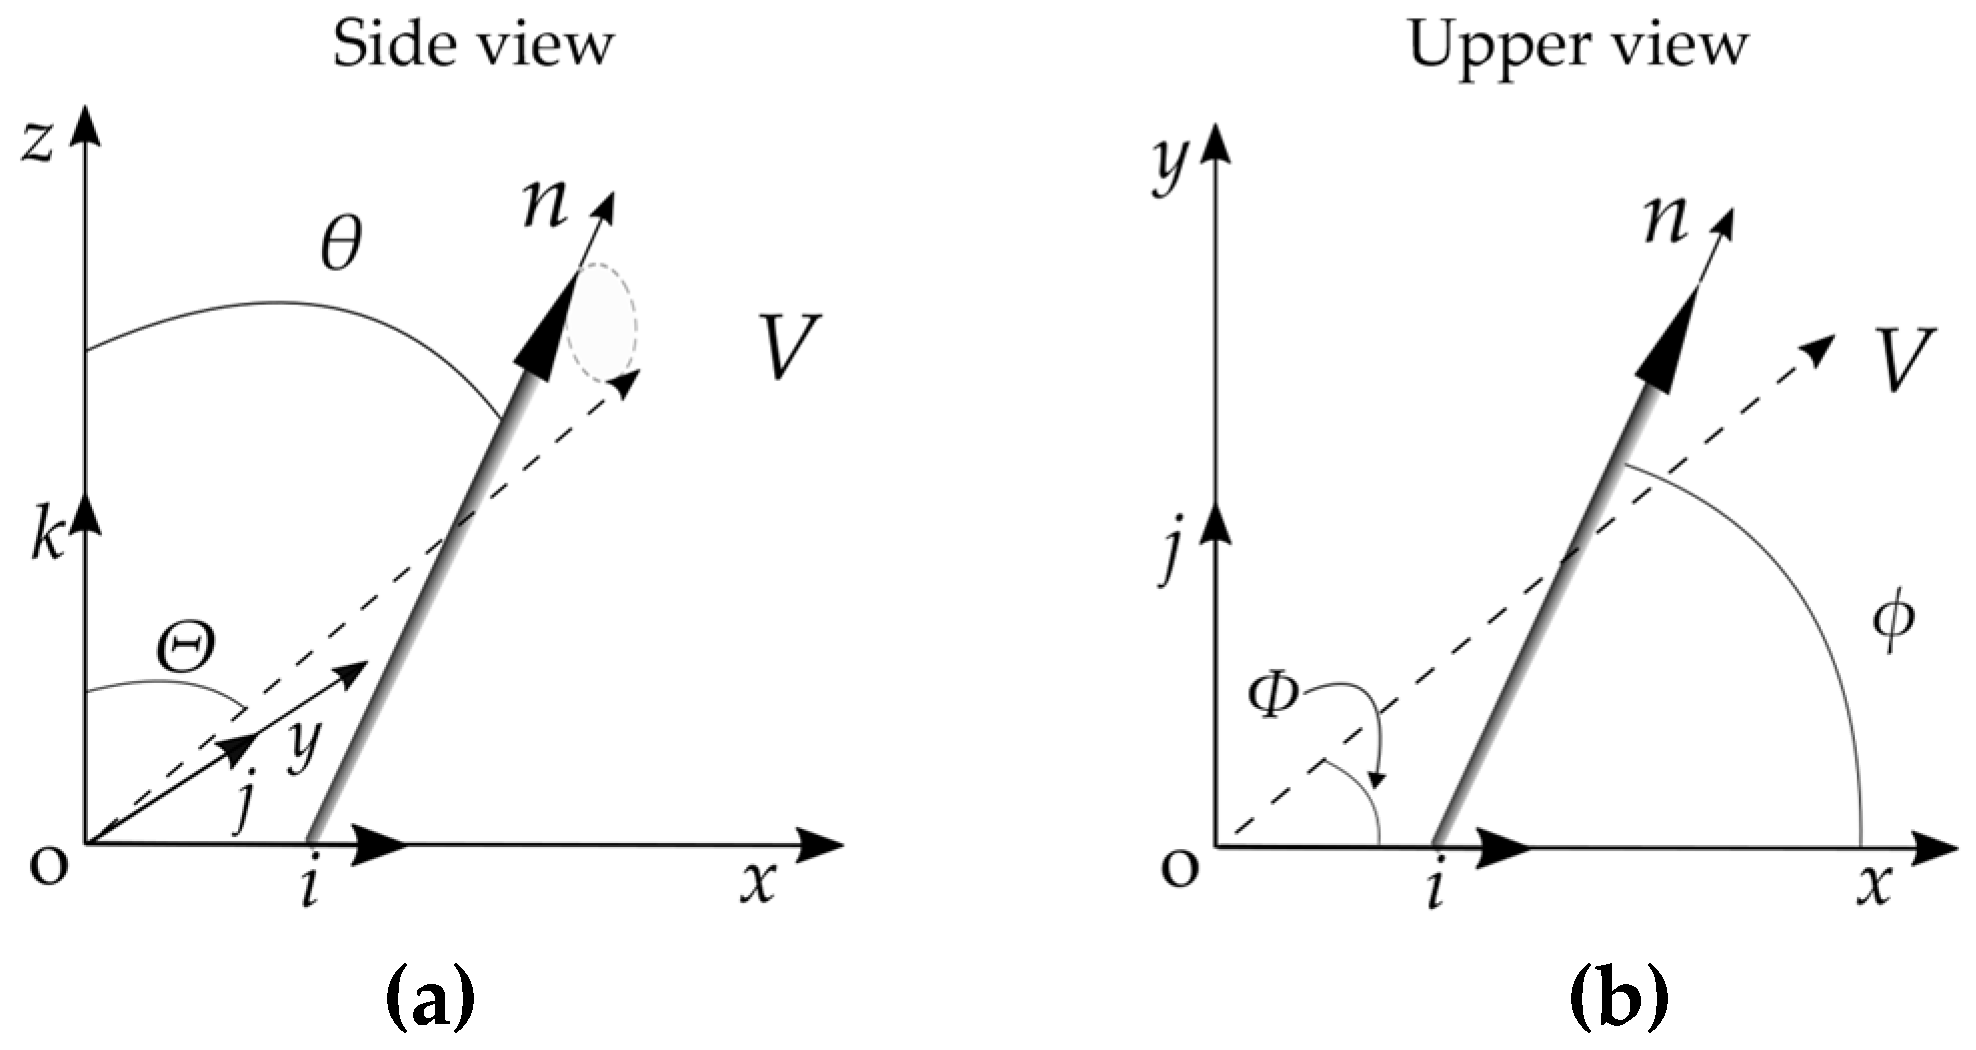
The arrows were assumed to be rigid bodies; therefore, no flexural oscillation along the shaft was considered. The effect of the background wind was also neglected due to the fact all the tests were performed indoors. An x, y and z coordinate system is defined with i, j and k as the corresponding unit vectors (Figure 2). The velocity of the arrow’s center of mass is denoted as V = (V sinΘcosΦ, V sinΘsinΦ, V cosΘ), where Θ is the angle formed between V and the z axis. The angle Φ is formed between the x axis and the projection of V in the horizontal x-y plane. The instantaneous velocity is V.
During its free flight, the arrow’s axis might not be aligned with the velocity vector V, as shown in Figure 2a. To measure such misalignment, the concept of angle of attack can be introduced and defined as γ = cos−1[n · V/|V|], where n is a unit vector along the arrow’s axis. The lift and drag forces exerted on the arrows are expressed as FL = α ρ π r 2 [ | V | 2 n ( n V ) V ] / 2 and F D = C D ρ π r 2 | V |   V / 2 , respectively. Here α is a parameter related to the lift coefficient by CL = αγ. The air’s density is ρ, the arrow’s radius is r and CD corresponds to the drag coefficient. The angular momentum is defined as L = In × dn/dt + I3ω3n, where I and I3 are the moments of inertia around the center of mass and the arrow’s axis, respectively. The instantaneous value of ω3 was obtained from the data provided by the acceleration sensor. The equations of arrow motion are
M d V d t = M g k + F D + F L   ,
d L d t = I n × d 2 n d t 2 + I 3 ( d ω 3 d t n + ω 3 d n d t ) ,
= 1 2 β ρ π r 2 l | V | n × V + N 3 n ,
where β is a numerical parameter related with the pitching moment coefficient by CM = −βγ. M is the mass of the arrow and g is the gravitational acceleration. The arrow’s length is given by l. Finally, N3 is the axial component of the torque, N, exerted on the arrow during free flight and can be estimated using the data of the acceleration sensor.

2.3.2. Numerical Computations and Initial Conditions

From the left-hand sides of Equations (1) and (2), we have dx/dt, dy/dt, dz/dt, dV/dt, dΘ/dt, dΦ/dt, dωθ/dt, dωϕ/dt, where dθ/dt = ωθ and dϕ/dt = ωϕ. A standard fourth-order Runge–Kutta method was chosen to solve such a system of differential equations with a time step Δt = 5 × 10⁻⁵ s. The required initial conditions are given by the arrow’s initial position as x0 = y0 = 0 and z0 = 0.30 m. The value of z0 is the height of the launching system from the floor. The initial velocity V0 and the initial angle between the arrow and the vertical z axis, Θ0 = θ0, were obtained from the recorded images. The values of Φ0 = ϕ0 = 0 define that the arrow’s axis is initially aligned with the target’s center point. Finally, (dθ/dt)0 = (dϕ /dt)0 = 0 due to the arrow sliding along the nozzle of the shooting device.

3. Results

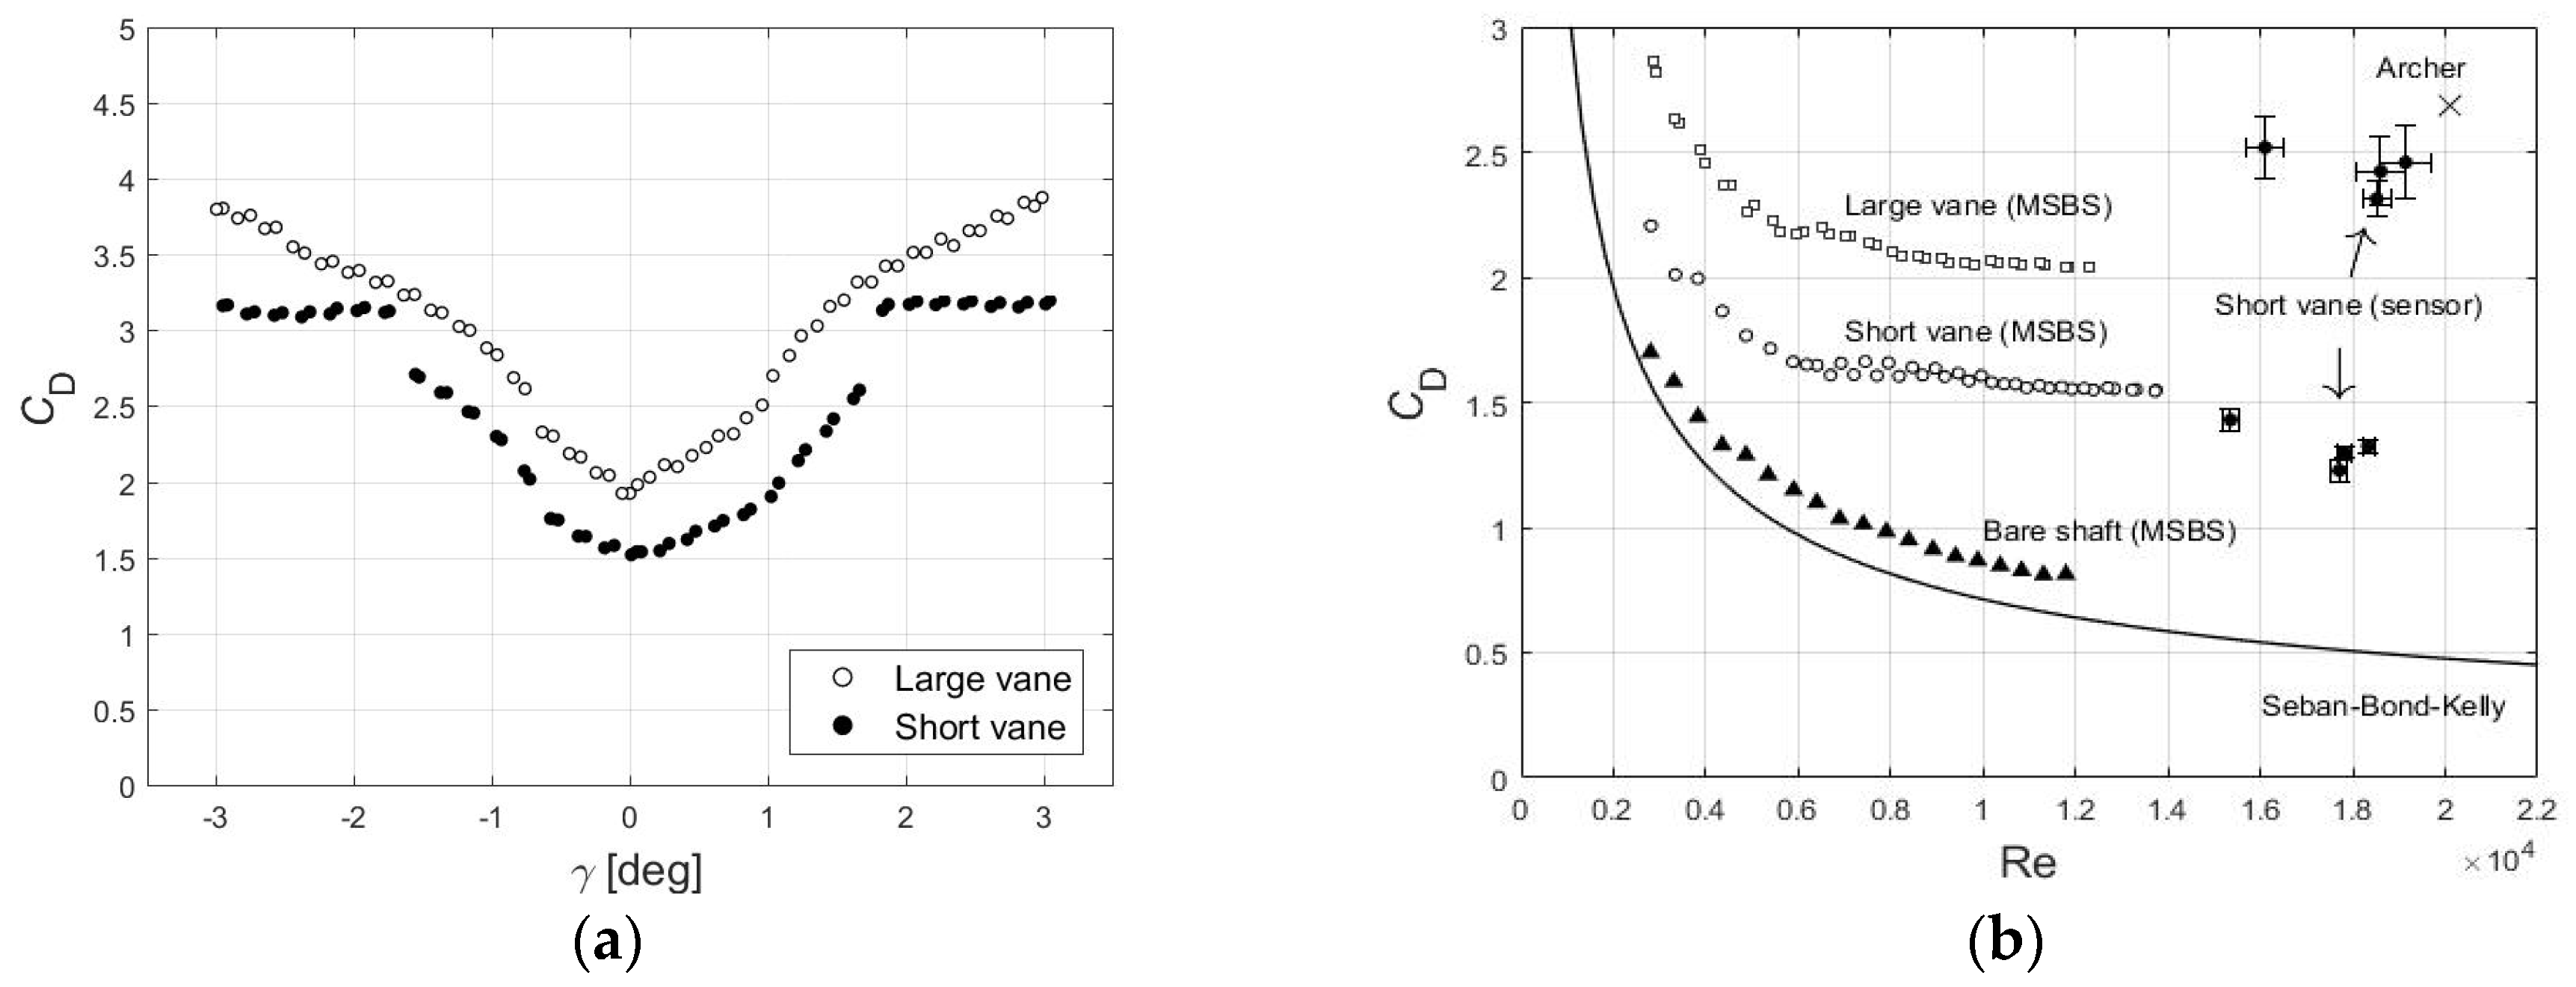
Figure 3a shows the dependence of CD on γ for the arrows fletched with short and large vanes at Re = 1.0 × 10⁴, obtained from the MSBS tests. When γ = 0, relatively small laminar drag coefficients were obtained. The value of CD increased for γ ≠ 0, suggesting the transition from a laminar to a turbulent boundary layer. A typical Re for an arrow shot with a recurve bow by an archer was Re ≥ 2.0 × 10⁴ for which a fully turbulent flow can be expected [2]. The results in Figure 3a correspond to the half of such Re; nevertheless it can be appreciated there is a delicate dependence between CD and γ, even at relatively low values of Re. The drag exerted on the arrows can be said to be sensitive to the value of γ.
In Figure 3b, the dependence of CD on Re obtained from the MSBS tests and the acceleration sensor is shown. The Reynolds number is given by Re = 2Vrair, where νair is the kinematic viscosity of the air at room temperature. The solid line shows the behavior of CD for a laminar boundary layer around a semi-infinite cylinder with the same radius as the analyzed arrow [4]. Closed triangles indicate the results corresponding to the bare shaft with the point attached. The difference between the bare shaft and the theoretical calculation arises from the existing pressure drag in the MSBS measurements. At Re = 1.2 × 10⁴, the value of the drag coefficient was CD = 1.56 and CD = 2.05 for the short (open circles) and large vanes (open squares), respectively.
Closed circles show the results obtained from the acceleration sensor in the free flight experiments for arrows fletched with short vanes. In the Reynolds number range 1.55 × 10⁴ < Re < 1.95 × 10⁴, both laminar and turbulent values of CD were found, indicating a boundary layer transition. The relatively large vertical error bars suggest that a fully turbulent boundary layer is not developed for such Re. The horizontal error bars are appreciably larger for the turbulent cases than for the laminar cases, which illustrates the more rapid velocity decay, as expected. For comparison, the multiplication symbol represents the typical value for a shot performed by an elite archer equipped with a recurve bow for an A/C/E-type arrow fletched with three curved vanes. At Re = 2.01 × 10⁴, a turbulent value of CD = 2.69 is reported in the literature [2].
In the inferior part of Figure 4a, we show the obtained deceleration, in the arrow’s axial direction αa, measured with the acceleration sensor. The case corresponds to a shot with an initial velocity of V0 = 56.4 ms−1 and a flying time of 1.04 s. For t < 0.40 s, the arrow was exposed to an average value of 0.65 G. Nevertheless, for t > 0.45 s the average deceleration decreased to around 0.30 G, which can be interpreted as a transition from turbulent to laminar boundary layer during the arrow’s free flight. To explain such behavior, the time evolution of the angle of attack was computed and shown in the superior part of Figure 4a. The value of γ decayed from a maximum of around 0.36° to values smaller than 0.1°. It is appreciated that the turbulent–laminar transition occurred when the value of the angle of attack was γ < 0.3°. The state of the boundary layer, and therefore the exerted drag, was highly sensitive to the arrows’ attitude [2,3]. By integrating the deceleration, the velocity decay was found to be around 8% during free flight. Such velocity reduction might also partially explain the transition from a turbulent to a laminar boundary layer.
Figure 4b shows the lift (CL) and pitching moment (CM) coefficients as a function of γ, from which the parameters α and β were obtained. α and β are related with CL and CM, respectively. The obtained values were αshort = 39.1 rad−1 and βshort = 18.8 rad−1 for the arrows fletched with short vanes and αlarge = 62.1 rad−1 and βlarge = 33.9 rad−1 for arrows fletched with large vanes. The counterbalancing effect between the lift force, exerted near the vanes, and the pitching moment, exerted around the center of mass located in the arrow’s front part, has important implications. To explore the importance of the magnitude of α and β, the time evolution of γ was computed for arrows with both types of vanes.
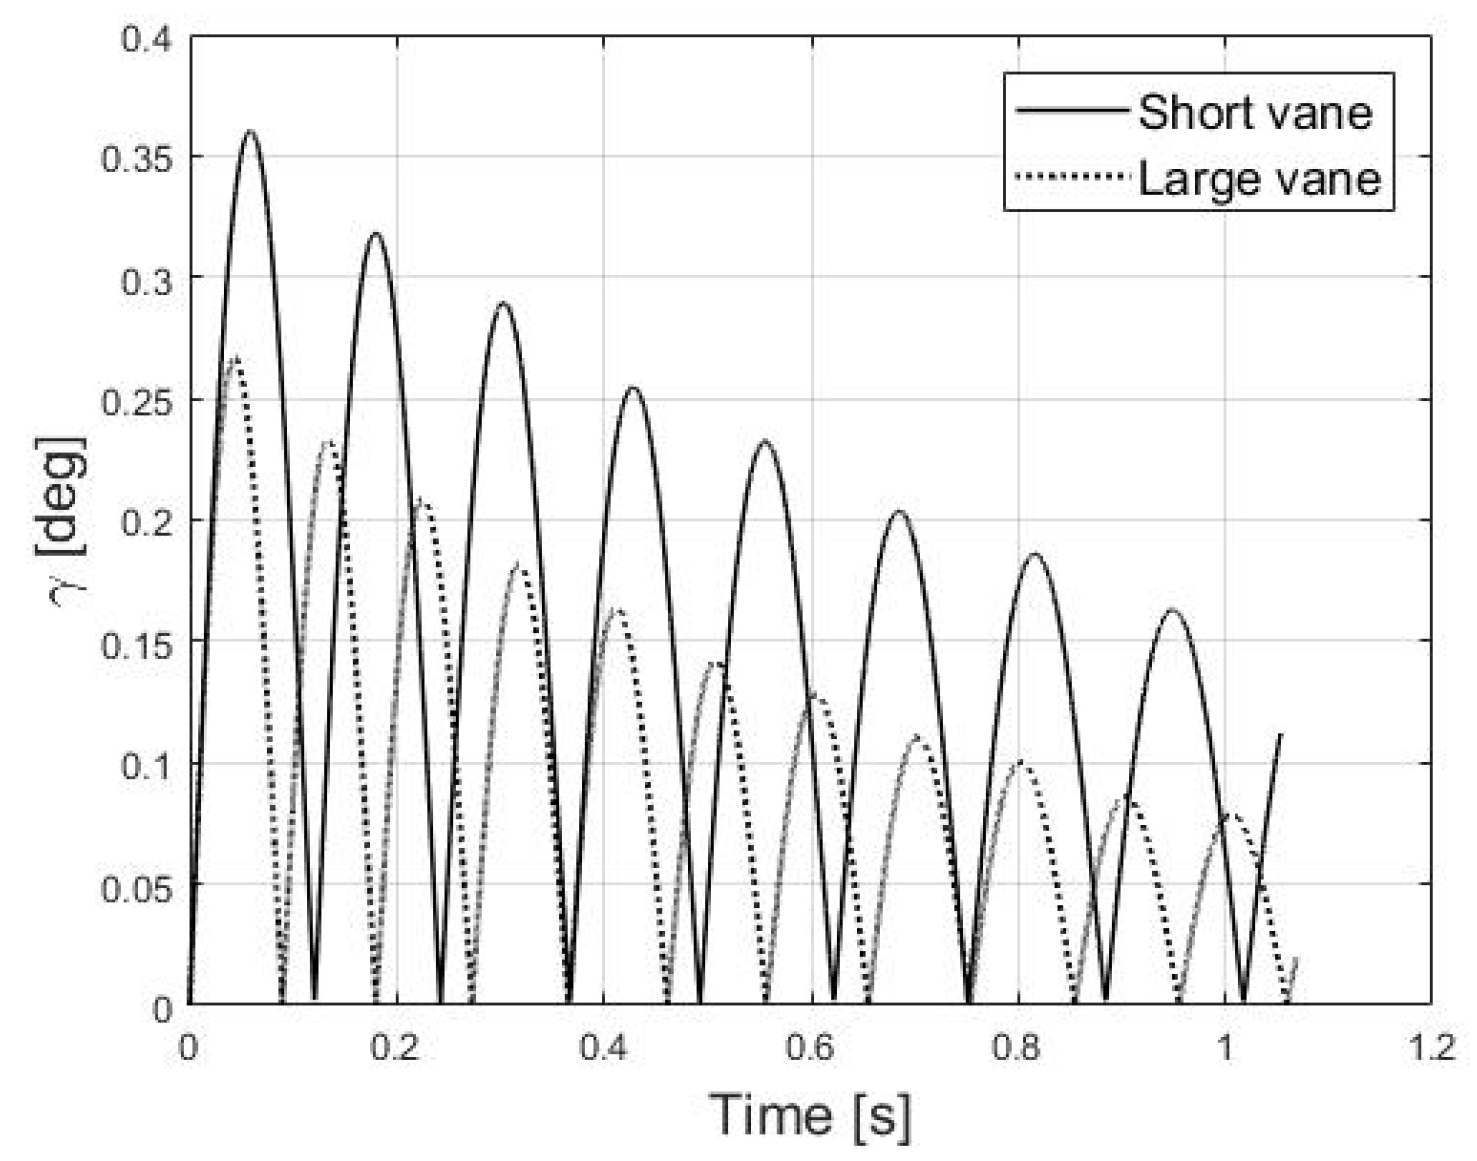
In Figure 5, the results for shots with an initial velocity of V0 = 56 ms−1 are shown. For the short and large vanes, respectively, the oscillation frequency of the angle of attack was 4 Hz and 5.3 Hz. The larger pitching moment experienced by the arrows with large vanes also caused the oscillation frequency to increase. It was verified that for values of β close to zero, the oscillatory arrow’s behavior almost disappeared, generating large angles of attack of the order γ > 3°, and therefore increasing the exerted drag. The maximum angles of attack were 0.36° and 0.27° for the short and large vanes, respectively. The lift exerted on the vanes increases with their area. The larger lift forces generated by the large vanes drifted the arrow vertically and reduced the magnitude of the angle of attack.

4. Conclusions

The aerodynamic characteristics of arrows fletched with two different straight vanes, for which the area is different, were analyzed. From the MSBS tests at Re = 1.2 × 10⁴, the laminar values of the drag coefficient CD = 1.56 and CD = 2.05 for the short and large vanes were obtained, respectively. From the acceleration sensor data at Re < 1.8 × 10⁴, laminar values of around CD = 1.35 were found. For Re > 1.85 × 10⁴, values of the drag coefficient were around CD = 2.45, suggesting that the transition from laminar to turbulent boundary layer takes place at such Re.
A transition from turbulent to laminar boundary layer was detected with the acceleration sensor during the free flight experiments, which was explained by the fact that the value of the angle of attack reduces along the arrow’s trajectory. For angles of attack γ < 0.3°, a laminar boundary layer was formed and the drag reduced in average from 0.65 G to 0.30 G. The velocity reduction of around 8% during the flight might also contribute to the turbulent–laminar boundary layer transition.
The importance of the pitching moment and the lift exerted on the arrows during free flight was also examined. Arrows fletched with large straight vanes showed more stable flights than those fletched with the short vanes. Large values of pitching and lift moments are desirable to achieve stable flights.

Acknowledgments

This work was partially supported by a Grant in Aid for Scientific Research (C) 18k03943.

Conflicts of Interest

The authors declare no conflict of interest.

References

  1. Miyazaki, T.; Mukaiyama, K.; Komori, Y.; Okawa, K.; Taguchi, S.; Sugiura, H. Aerodynamic properties of an archery arrow. Sports Eng. 2013, 16, 43–54. [Google Scholar] [CrossRef]
  2. Ortiz, J.; Ando, M.; Murayama, K.; Miyazaki, T.; Sugiura, H. Computation of the trajectory and attitude of arrows subject to background wind. Sports Eng. 2019, 22, 7. [Google Scholar] [CrossRef]
  3. Miyazaki, T.; Matsumoto, T.; Ando, R.; Ortiz, J.; Sugiura, H. Indeterminacy of drag exerted on an arrow in free flight: Arrow attitude and laminar-turbulent transition. Europhysics 2017, 38, 6. [Google Scholar] [CrossRef]
  4. Seban, R.A.; Bond, R. Skin-friction and heat-transfer characteristics of a laminar boundary layer on a cylinder in axial incompressible flow. J. Aeronaut. Sci. 1951, 18, 671–675. [Google Scholar] [CrossRef]
Figure 1. (a) Superior part: acceleration sensor, bottom: arrow shaft; (b) left: two straight vanes, center: screw-in point with insert, right: cross-sectional view of the arrow’s shaft.
Proceedings 49 00056 g001
Figure 2. (a) Side and (b) upper views from an arrow in free flight.
Proceedings 49 00056 g002
Figure 3. (a) CD as a function of γ at Re = 1.0 × 10⁴; (b) CD as a function of Re obtained from the Magnetic Suspension and Balance System (MSBS) tests and the acceleration sensor.
Proceedings 49 00056 g003
Figure 4. (a) Superior part: time evolution of γ for a shot with initial velocity V0 = 56.4 ms−1, bottom: arrow’s deceleration in the axial component measured with the acceleration sensor; (b) CL and CM as a function of γ at Re = 1.0 × 10⁴.
Proceedings 49 00056 g004
Figure 5. Time evolution of γ for the short and large vanes with V0 = 56 ms−1.
Proceedings 49 00056 g005
Publisher’s Note: MDPI stays neutral with regard to jurisdictional claims in published maps and institutional affiliations.