Effects of Pimple Height of a Table Tennis Rubber on Ball Rebound Behavior †

Abstract
:1. Introduction
2. Modeling of Rubber Material
2.1. Material Models of Sheet and Foam Layers
2.2. Experimental Tests for Material Modeling
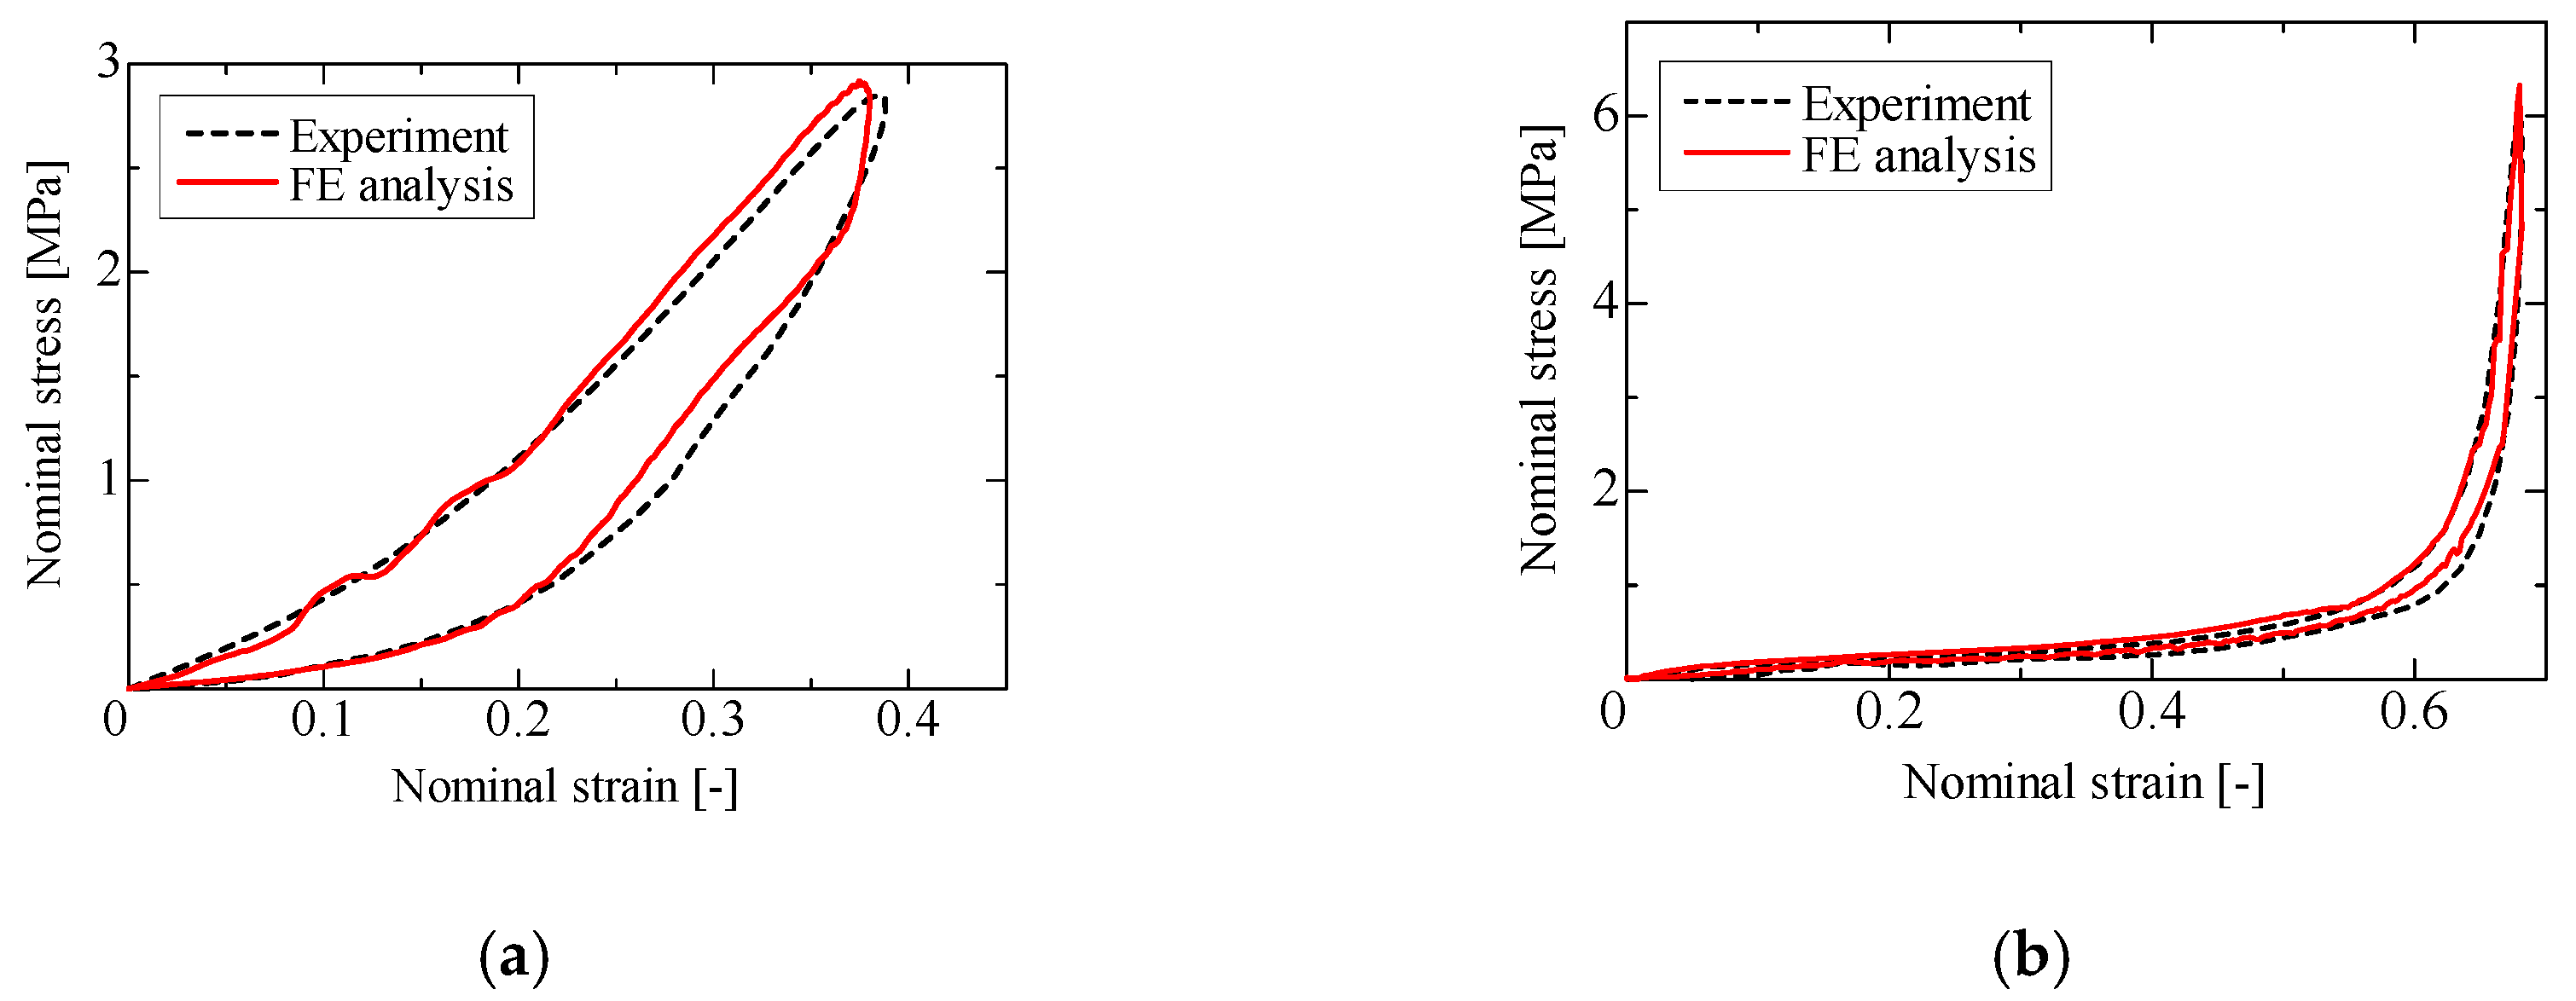
2.3. Accuracy Varidation of Material Models
3. Construction of Impact Simulation Model for Ball and Rubber Model
3.1. Impact Tests for Accuracy Validation of Impact Simulation Model
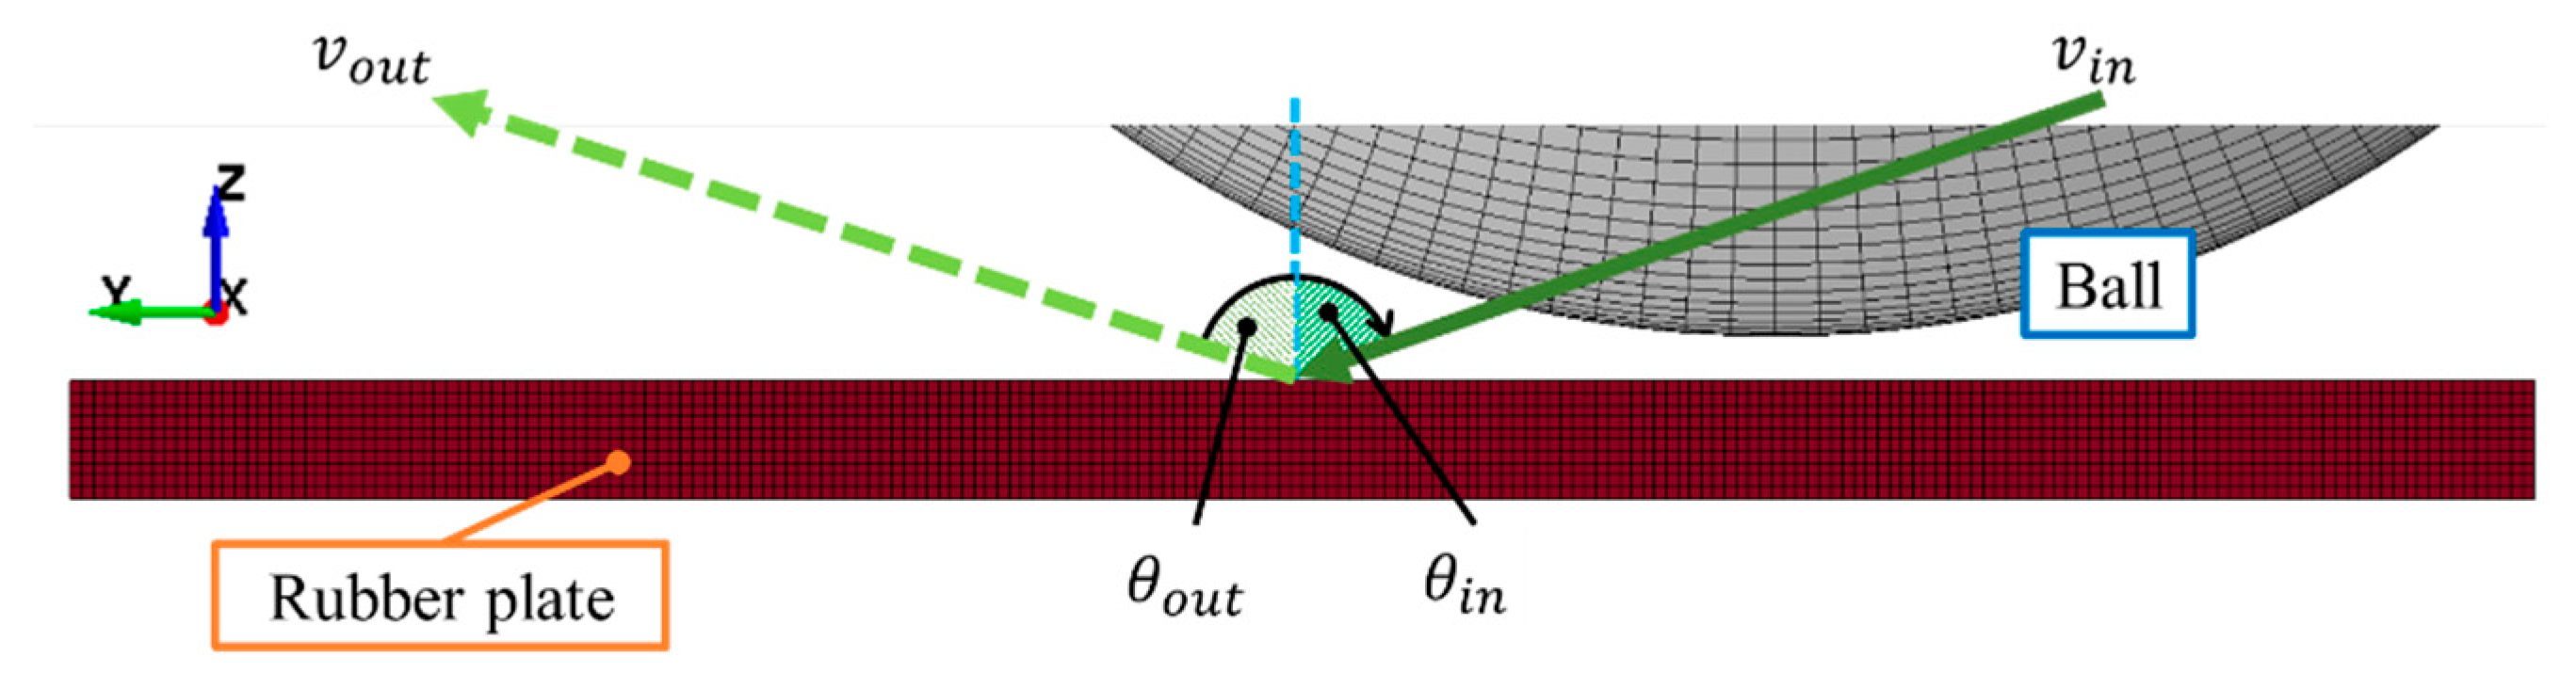
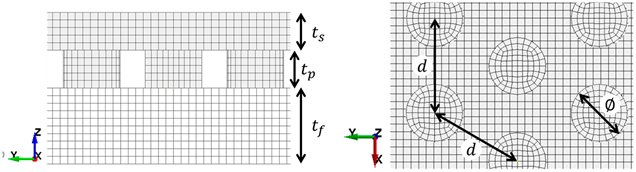
3.2. Modeling of Impact between Ball and Rubber Plate
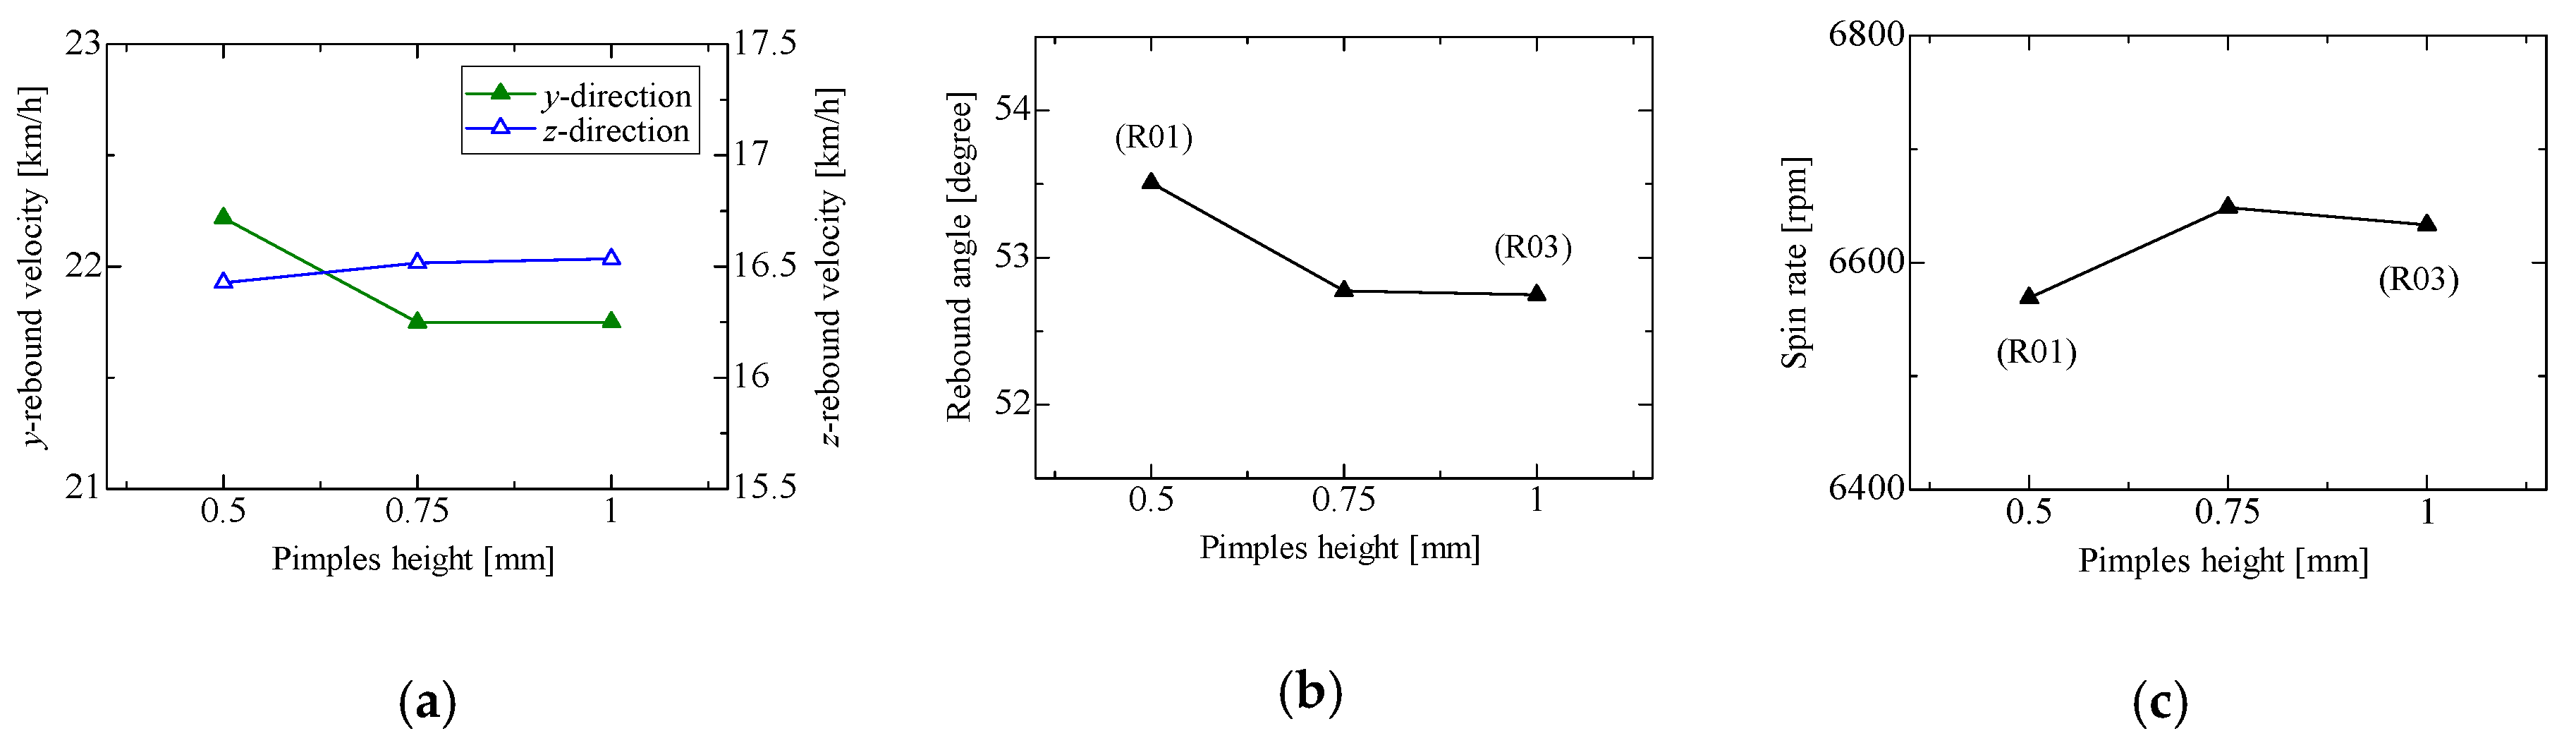
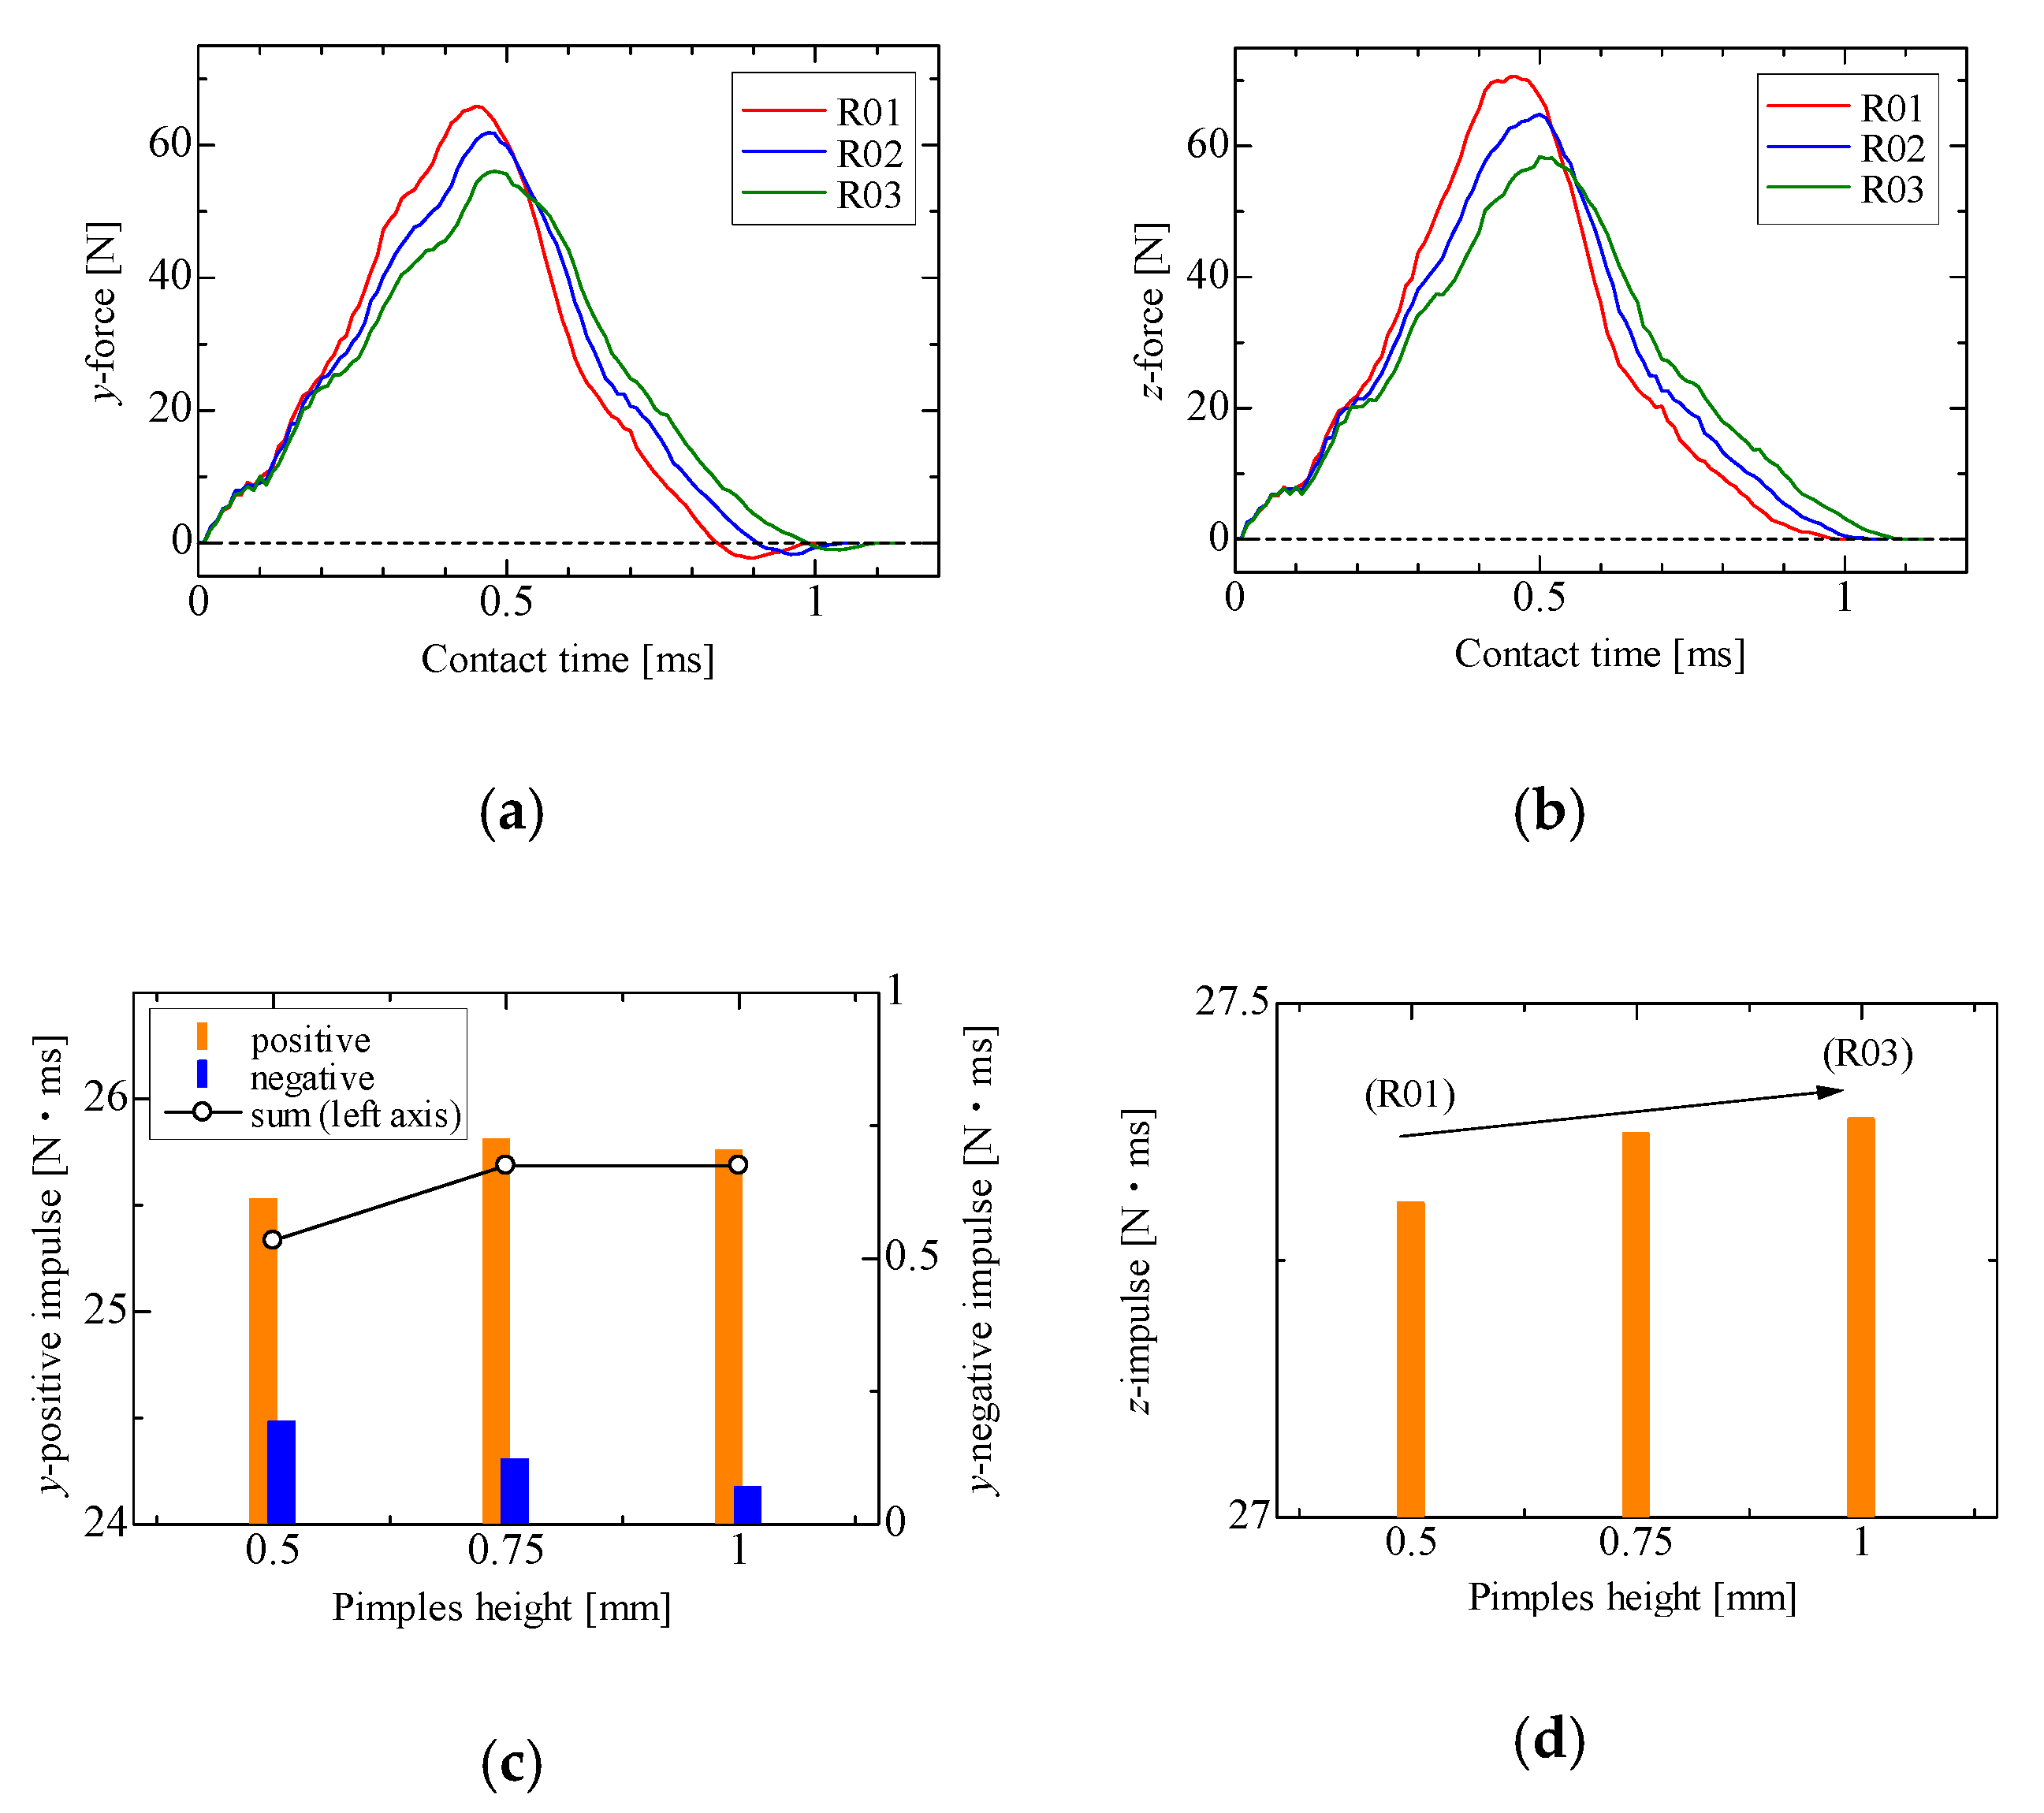
4. Effects of Pimple Height on Rebound Behavior
5. Conclusions
References
- International Table Tennis Federation, Technical Leaflet T4: Racket Covering, Available online:. Available online: http://www.ittf.com/wp-content/uploads/2017/10/T4_Racket_Coverings_BOD2017.pdf_0.pdf (accessed on 15 December 2019).
- Wei-bing, Z.; Yin, L.; Graham, M. A pilot study on characteristic of table tennis bat rubber. J. Chem. Pharm. Res. 2014, 6, 1299–1301. [Google Scholar]
- Varenberg, M.; Varenberg, A. Table Tennis Rubber: Tribological Characterization. Tribol Left. 2012, 47, 51–56. [Google Scholar] [CrossRef]
- Varenberg, M.; Varenberg, A. Table Tennis Rubber: Preliminary Displacement in Pimples-Out Rubber. Tribol Left. 2014, 53, 101–105. [Google Scholar] [CrossRef]
- Rinaldi, G.R.; Manin, L.; Bonnard, C.; Drillon, A.; Lourenco, H.; Havard, N. Non-linearity of the ball/rubber impact in table tennis: Experiments and modeling. Procedia Eng. 2016, 147, 348–353. [Google Scholar] [CrossRef]
- Rinaldi, G.R.; Manin, L.; Moineau, S.; Havard, N. Table Tennis Ball Impacting Racket Polymeric Coating: Experiments and Modeling of Key Performance Metrics. Appl. Sci. 2019, 9, 158–175. [Google Scholar] [CrossRef]
- Washida, Y.; Higuchi, N.; Satoh, M. Oblique impact of a table tennis ball on the rubber using Finite Element Analysis. In Proceedings of the Japan Society of Mechanical Engineers, Tokyo, Japan, 8–11 September 2019; The Japan Society of Mechanical Engineers: Tokyo, Japan, 2019; Volume 19-1, p. J23202. (In Japanese). [Google Scholar]
- Livermore Software Technology Corporation. LS-DYNA Theory Manual; Livermore Software Technology Corporation: California, USA, 2019. [Google Scholar]
- Kolling, S.; Du Bois, P.A.; Benson, D.J. A Simplified Rubber Model with Damage. In Proceedings of the 4th LS-DYNA Anwenderforum Crash II: Bamberg, Germany, 14–15 October 2005; p. B II. [Google Scholar]
- Benson, D.J.; Kolling, S.; Du Bois, P.A. A Simplified Approach for Strain-Rate Dependent Hyperelastic Materials with Damage. In Proceedings of the 9th International LS-DYNA Users Conference, Material Modeling (1), Dearborn, Michigan, USA, 4–6 June 2006; pp. 29–42. [Google Scholar]
- Serifi, E.; Hirth, A.; Matthaei, A.; Müllerschön, H. Modeling of Foams using MAT83—Preparation and Evaluation of Experimental Data. In Proceedings of the 4th European LS-DYNA Users Conference Material II, ULM, Germany, 22–23 May 2003; pp. 59–72. [Google Scholar]
- Srivastava, V.; Srivastava, R. Performance Evaluation of Fu Chang and Low Density Foam Model for Expanded Polypropylene. MIT Int. J. Mech. Eng. 2014, 4, 49–53. [Google Scholar]
- Hadano, A.; Tanaka, K. Finite Element Modeling for a Table Tennis Ball Based on Impact Behavior Obtained from High-Speed Imaging. In Proceedings of the International Conference on Advanced Technology in Experimental Mechanics 2019, Niigata, Japan, 7–10 October 2019. [Google Scholar]

| (1) |
| (2) |
| Relative volume Bulk moduli |
| (3) |
| (4) (5) |
| (6) (7) (8) |
| the state variable : nonlinear part of the strain |
| expression for the past history of material constants |
| Normal impact | Oblique impact | |
|---|---|---|
 |  | |
| No data | 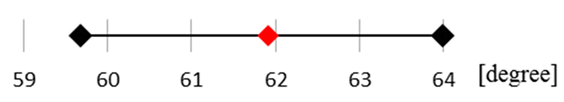 | |
| No data | 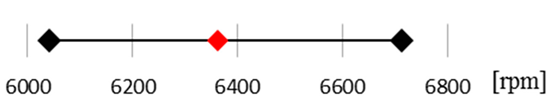 | |
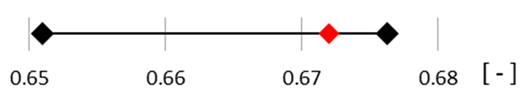
 Experiment range Experiment range  FE analysis FE analysis | ||
 | |||||
| ID | Sheet layer | Foam layer | |||
| R01 | 1.00 | 1.50 | 0.50 | 2.50 | 2.0 |
| R02 | 1.00 | 1.50 | 0.75 | 2.50 | 2.0 |
| R03 | 1.00 | 1.50 | 1.00 | 2.50 | 2.0 |
Publisher’s Note: MDPI stays neutral with regard to jurisdictional claims in published maps and institutional affiliations. |
© 2020 by the authors. Licensee MDPI, Basel, Switzerland. This article is an open access article distributed under the terms and conditions of the Creative Commons Attribution (CC BY) license (https://creativecommons.org/licenses/by/4.0/).
Share and Cite
Miyazawa, Y.; Hadano, A.; Tanaka, K. Effects of Pimple Height of a Table Tennis Rubber on Ball Rebound Behavior. Proceedings 2020, 49, 55. https://doi.org/10.3390/proceedings2020049055
Miyazawa Y, Hadano A, Tanaka K. Effects of Pimple Height of a Table Tennis Rubber on Ball Rebound Behavior. Proceedings. 2020; 49(1):55. https://doi.org/10.3390/proceedings2020049055
Chicago/Turabian StyleMiyazawa, Yoshiya, Akihiro Hadano, and Katsumasa Tanaka. 2020. "Effects of Pimple Height of a Table Tennis Rubber on Ball Rebound Behavior" Proceedings 49, no. 1: 55. https://doi.org/10.3390/proceedings2020049055
APA StyleMiyazawa, Y., Hadano, A., & Tanaka, K. (2020). Effects of Pimple Height of a Table Tennis Rubber on Ball Rebound Behavior. Proceedings, 49(1), 55. https://doi.org/10.3390/proceedings2020049055