Abstract
Recently, in the field of sports, studies have been actively conducted to collect and analyze human behavior data from various sensors for assisting exercise. However, there are very few studies targeting disabled subjects. The purpose of this study was to suggest a model for heart rate estimation in driving a wheel-chair using a wearable device and to assist the exercise of wheel-chair users. The suggested model estimated the heart rate transformed from the data of 6-axis sensors (accelerations and angular velocities) using machine learning. The sensors were attached to the undercarriage of the wheel-chair. Input to the suggested model were acceleration toward a driving direction, angle of slope and oxygen intake. The suggested model estimated the heart rate every 12 s. When the suggested model was applied to heart rate estimation during normal driving of the wheel-chair, it was confirmed that estimation was possible within 9.34 bpm mean absolute error.
1. Introduction
Recently, the spread of wearable devices makes the measurement and analysis of various sensors data easy. Furthermore, with the development of the AI or the deep learning, studies have been actively performed using the data effectively obtained from such devices. In the field of sports or health care, studies using a human behavior data measured by these devices are performed actively for the purpose of a human exercise or health assisting. For example, an estimation model has been suggested for estimating an exercise level using an acceleration data measured by a device attached to subject [1]. Most studies are, however, for healthy subject and few for disabled subject. Therefore, the purpose of this study is to suggest a model to estimate the heart rate using a data detected by a wearable device in driving a wheel-chair and to support the movement of wheel-chair users. Heart rate estimation models in walking for healthy subjects [2] and physical work load level estimation models in driving a wheel-chair [3] have been already reported. However, heart rate estimation model in driving a wheel-chair has not been reported. If the heart rate can be estimated using only a 6-axis sensor, a biometric sensor for measuring the heart rate is not required, and the work load on the subject can be reduced without a specific device Furthermore, if the road conditions (distance, angle of slope) and the driving speed of the subjects are understood beforehand, the future heart rate can be predicted. It is expected to lead us to a specific exercise support such as pre-determining an exercise plan according to an objective of a subject.
2. Materials and Methods
2.1. Experimental Protocol
In order to obtain data for the construction and verification of the heart rate estimation model that we suggested, acceleration and heart rate in driving a wheel-chair were measured. The experiment was carried out by a following method. Each subject was on a wheel-chair and drove a wheel-chair on the route (600 m) between AB in the Nagaoka University of Technology campus shown in Figure 1 with the speed the same as an everyday walking work load (natural pace). The route from A to B was route 1, and the route from B to A was route 2. Acceleration data and heart rate were measured when subjects drove a wheel-chair in each route. Parallel to a measurement, heart rate was monitored in real time during the experiment. Before starting driving on each route, each subject took a rest of 5 min or more. It was confirmed that the heart rate of each subject was in the resting state before starting driving. The subjects were 6 healthy males (22–23 age, average weight: 64.2 kg). The wheel-chair used in this experiment was a standard self-propelled wheel-chair (Figure 2).
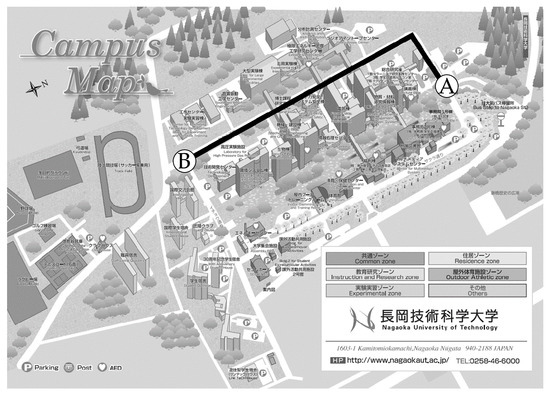
Figure 1.
Experimental route (in Nagaoka University of Technology).
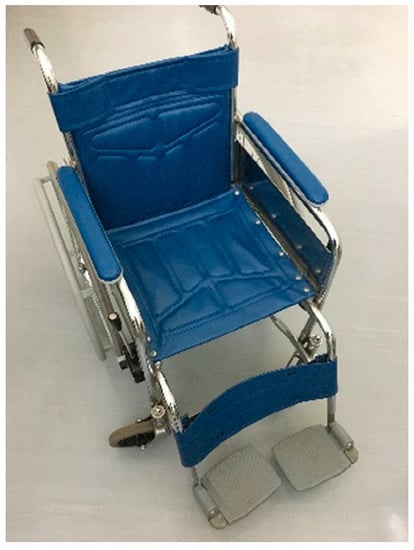
Figure 2.
Wheel-chair.
2.2. Measurement Data
Measurement data were three-axis acceleration (G), three-axis angular velocity (°/s), and heart rate (bpm). Acceleration and angular velocity were measured with a 6-axis sensor (MPU-6050, InvenSense, sampling time 20 ms, Figure 3) attached to the back of the seat of a wheel-chair, and heart rate was measured using a heart rate sensor (POLAR H10; the measurement was performed at a sampling time of 1 s, Figure 4). The data of the 6-axis sensor used the values that through the low-pass and high-pass filters described in Equations (1) and (2).
where Sl and Sh are the data through the low-pass and high-pass filters. Y is the raw data of the sensor. t (= 1, 2, 3, …) is the time, and α is the smoothing coefficient. The smoothing coefficient α was set to 0.9.
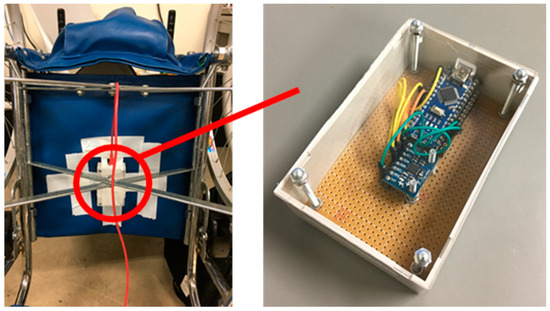
Figure 3.
6-axis sensor.
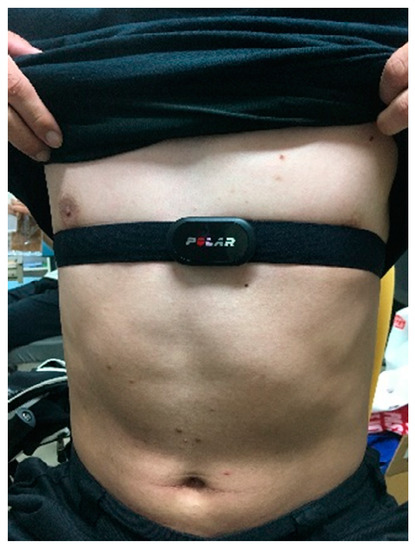
Figure 4.
Heart rate sensor.
2.3. Calculated Data
Using the above-mentioned measurement data, the acceleration toward a driving direction (G), an angle of slope (°), and the oxygen intake (ml/kg/min) were calculated. Those data were used as an input data of the suggested model. The acceleration toward driving direction reflects the behavior during driving. The angle of slope is a significant effect on the work load during driving. Oxygen intake has the property of change in the same way of heart rate change and is highly correlated with heart rate [4]. For the reasons above, these were adopted as input data to the suggested model. The calculation method of each data is as follows. The acceleration toward driving direction was calculated by half-wave rectification of the driving direction axis acceleration sensor data. The angle of slope was calculated from 3-axis acceleration data and 3-axis angular velocity data using a madgwick filter [5]. There is no established calculation method for oxygen intake in wheel-chair driving. Therefore, it was calculated by using of the relational equation of acceleration toward driving direction and angle of slope derived from a previous study [6]. The values to be input (acceleration toward driving direction and angle of slope) were the mean values of the data from the current value to 3 min ago. Oxygen intake with a running time of less than 3 min was calculated with the shortage at rest (running acceleration = 0 G).
Where VO2, acc and slope are the oxygen intake (ml/kg/min), acceleration toward a driving direction (G) and angle of slope (°).
2.4. Data Processing
Measurement data were smoothed by a half overlap with 24 seconds window size. Therefore, the data after smoothing becomes 12 s interval. After smoothing, in order to make all samples the same data size, zero padding was performed. For heart rate data, the value obtained by subtracting the initial value of each sample was used. Thus, these data represent the variation values from the initial heart rate of each sample. Therefore, the suggested model estimates the variation value from the initial heart rate (heart rate in rest).
2.5. Suggested Model Construction and Evaluation
Figure 5 shows the suggested model constructed in this study. The suggested model consists of the input layer which input the acceleration toward a driving direction, angle of slope, and oxygen intake), the hidden layer of the LSTM having 16 units (the activation function is the ReLU) and the output layer which output the prediction heart rate. The LSTM used data up to 1 min ago as past data. Cross validation to each subjects’ sample was performed using both 5 out of 6 subjects’ samples as a training data (of which 20% are validation data) and the remaining 1 subject’ sample as a test data, and six models were constructed. The optimizer was Adam. Batch size was 4. The weights updates were 50 epochs, and the model with the smallest verification error was adopted. A prediction error of the suggested models was the mean absolute error (MAE) between the measurement and prediction values of the heart rate. The estimation of suggested model starts 1 min after from the start to drive a wheel-chair because the data of 1 min before is used for LSTM.
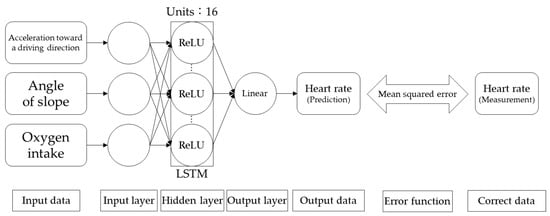
Figure 5.
Model for heart rate estimation.
3. Results and Discussion
Table 1 shows the prediction error (MAE) of each estimation model using each subject as a test data. From Table 3.1, the mean of the MAE was 9.34 bpm (minimum value was 5.20 bpm for A1 and maximum value was 17.07 bpm for C1. A1 means subject A and route 1.). The mean of the MAE of a heart rate estimated in walking for healthy subjects reported is 6.37 bpm [2]. As a preliminary experiment, the mean variation of the heart rate for 24 s using the heart rate sensor in rest-sitting with the same subject in this study was 5.86 bpm. Compared with these, the values estimated by the model in this study has a relatively large prediction error and a slightly low accuracy. However, in excluding C1, D1, and D2, which the MAE is extremely large, the mean is 7.07 bpm, which is close to the accuracy of the estimated model in walking. It is thought that the suggested model to estimates the heart rate in driving a wheel-chair suggested in this study can estimate a heart rate in driving a wheel-chair.

Table 1.
Mean Absolute Error (bpm).
Figure 6 shows the prediction value in driving a wheel-chair of a heart rate estimated by the suggested model in this study and measurement value detected by a wearable heart rate sensor (figure title : a–f is subjects, 1–2 is routes). From Figure 3.1, when MAE is small, the prediction value is close to the measurement value. Furthermore, when MAE is large, the prediction value is far from the measurement value.
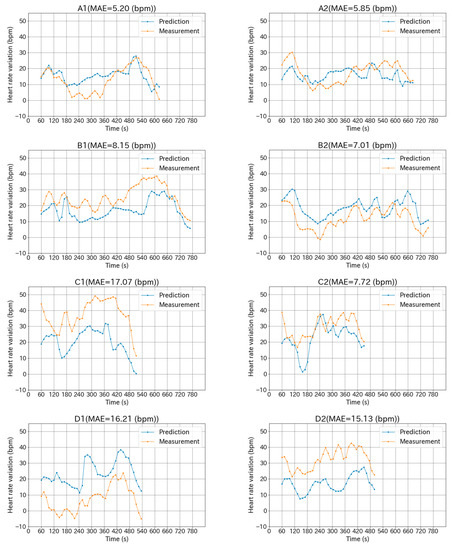
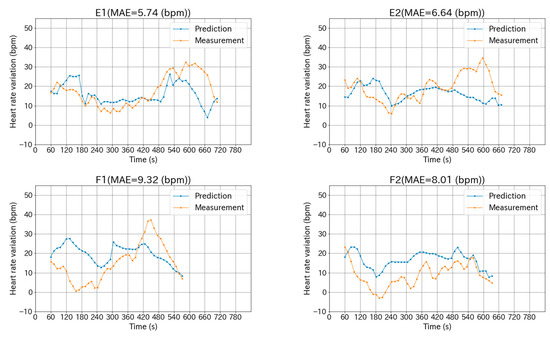
Figure 6.
Prediction and measurement of heart rate variation.
Pay attention to the C1, it is confirmed that the transition trend of the prediction value of a heart rate is close to estimated. Because the prediction value is lower than the measurement value, however, the MAE is larger. This may be because subject C had a lower physical work capacity than other subjects. In driving a wheel-chair, his heart rate increased more than these of other subjects. In other word, if a parameter of the physical work capacity for each subject is adopted, the estimation accuracy of the suggested model to estimate the heart rate in driving a wheel-chair is considered to be improved.
4. Conclusions
The mean MAE of the heart rate in driving a wheel-chair estimated by the suggested model in this study was 9.34 bpm. This is based on the mean compared with other reports, the values estimated by the suggested model in this study has a relatively large prediction error and a slightly low accuracy.
However, in excluding the subjects which the MAE is extremely large, the mean MAE is 7.07 bpm, which is close to the accuracy of the estimated model in walking. It is thought that the suggested model to estimate the heart rate in driving a wheel-chair suggested in this study can estimate a heart rate in driving a wheel-chair.The reasons for the large prediction error are thought as follows; (1) the error in the equation for calculating oxygen intake (2) individual differences in physical work capacity.Regarding to (1), the accuracy of the oxygen intake calculation used has not been sufficiently discussed. It is necessary to derive the calculation formula using additional samples and review the derivation method to confirm the usefulness of the calculation formula.Regarding to (2), the variation tendency of the heart rate is considered to be greatly influenced by the individual physical work capacity Therefore, in addition to the input data used in this study, the prediction error is thought to be reduced by adopting a parameter of the individual’s physical work capacity level, and the estimation accuracy of the suggested model to estimate the heart rate in driving a wheel-chair is considered to be improved. In addition, all the subjects in this study were healthy subjects, however in the future, it is considered necessary to conduct experiments targeting persons with disabilities.
References
- Onishi, K.; Ito, N.; Kobayashi, Y.; Kaji, K.; Naito, K.; Mizuno, T.; Nakajo, N. A Consideration for the Estimation of Momentum Using both Heart Rate Sensor and Acceleration Sensor—Preliminary Experiment for Health Assist System—[Translated from Japanese.]; The Special Interest Group Technical Reports of IPSJ, 2015; Volume 2015-MBL-77, pp. 1–4. [Google Scholar]
- Sumida, M.; Mizumoto, T.; Yasumoto, K. A method for estimating heart rate during walking with smartphone. J. Inf. Process. Soc. Jpn. 2014, 55, 399–412. [Google Scholar]
- Nagamine, K.; Iwasawa, Y.; Matsuo, Y.; Yairi, I. Physical strain evaluation of manual wheelchair driving by accelerometer. IEICE Trans. D 2017, J100-D, 773–782. [Google Scholar]
- American College of Sports Medicine (ACSM). ACSM’s Guidelines for Exercise Testing and Prescription NINTH EDITION, 9th ed.; Lippincott Williams & Wilkins: New York, NY, USA, 2013. [Google Scholar]
- Madgwick, S.O.H. An Efficient Orientation Filter for Inertial and Inertial/Magnetic Sensor Arrays; Report x-io and University of Bristol (UK): Bristol, UK, 2010. [Google Scholar]
- Kamibayashi, Y.; Nagamori, M.; Uchiyama, H.; Shionoya, A. A proposal of model for heart rate estimation while using wheelchair with 6-axis sensor. JSME Symp. Sports Eng. Hum. Dyn. 2019, 2019, C-14. [Google Scholar] [CrossRef]
Publisher’s Note: MDPI stays neutral with regard to jurisdictional claims in published maps and institutional affiliations. |
© 2020 by the authors. Licensee MDPI, Basel, Switzerland. This article is an open access article distributed under the terms and conditions of the Creative Commons Attribution (CC BY) license (https://creativecommons.org/licenses/by/4.0/).