1. Introduction
Ulnar collateral ligament (UCL) ruptures are common in baseball. Among professional players, more than 10% have had a UCL replacement also called a Tommy John Surgery, during their career. Pitchers have a significantly higher prevalence rate of 16% [
1]. The incidences of UCL reconstruction are increasing, especially in young players [
2]. To reduce injuries necessitating a Tommy John surgery, a better understanding of the injury mechanisms is important.
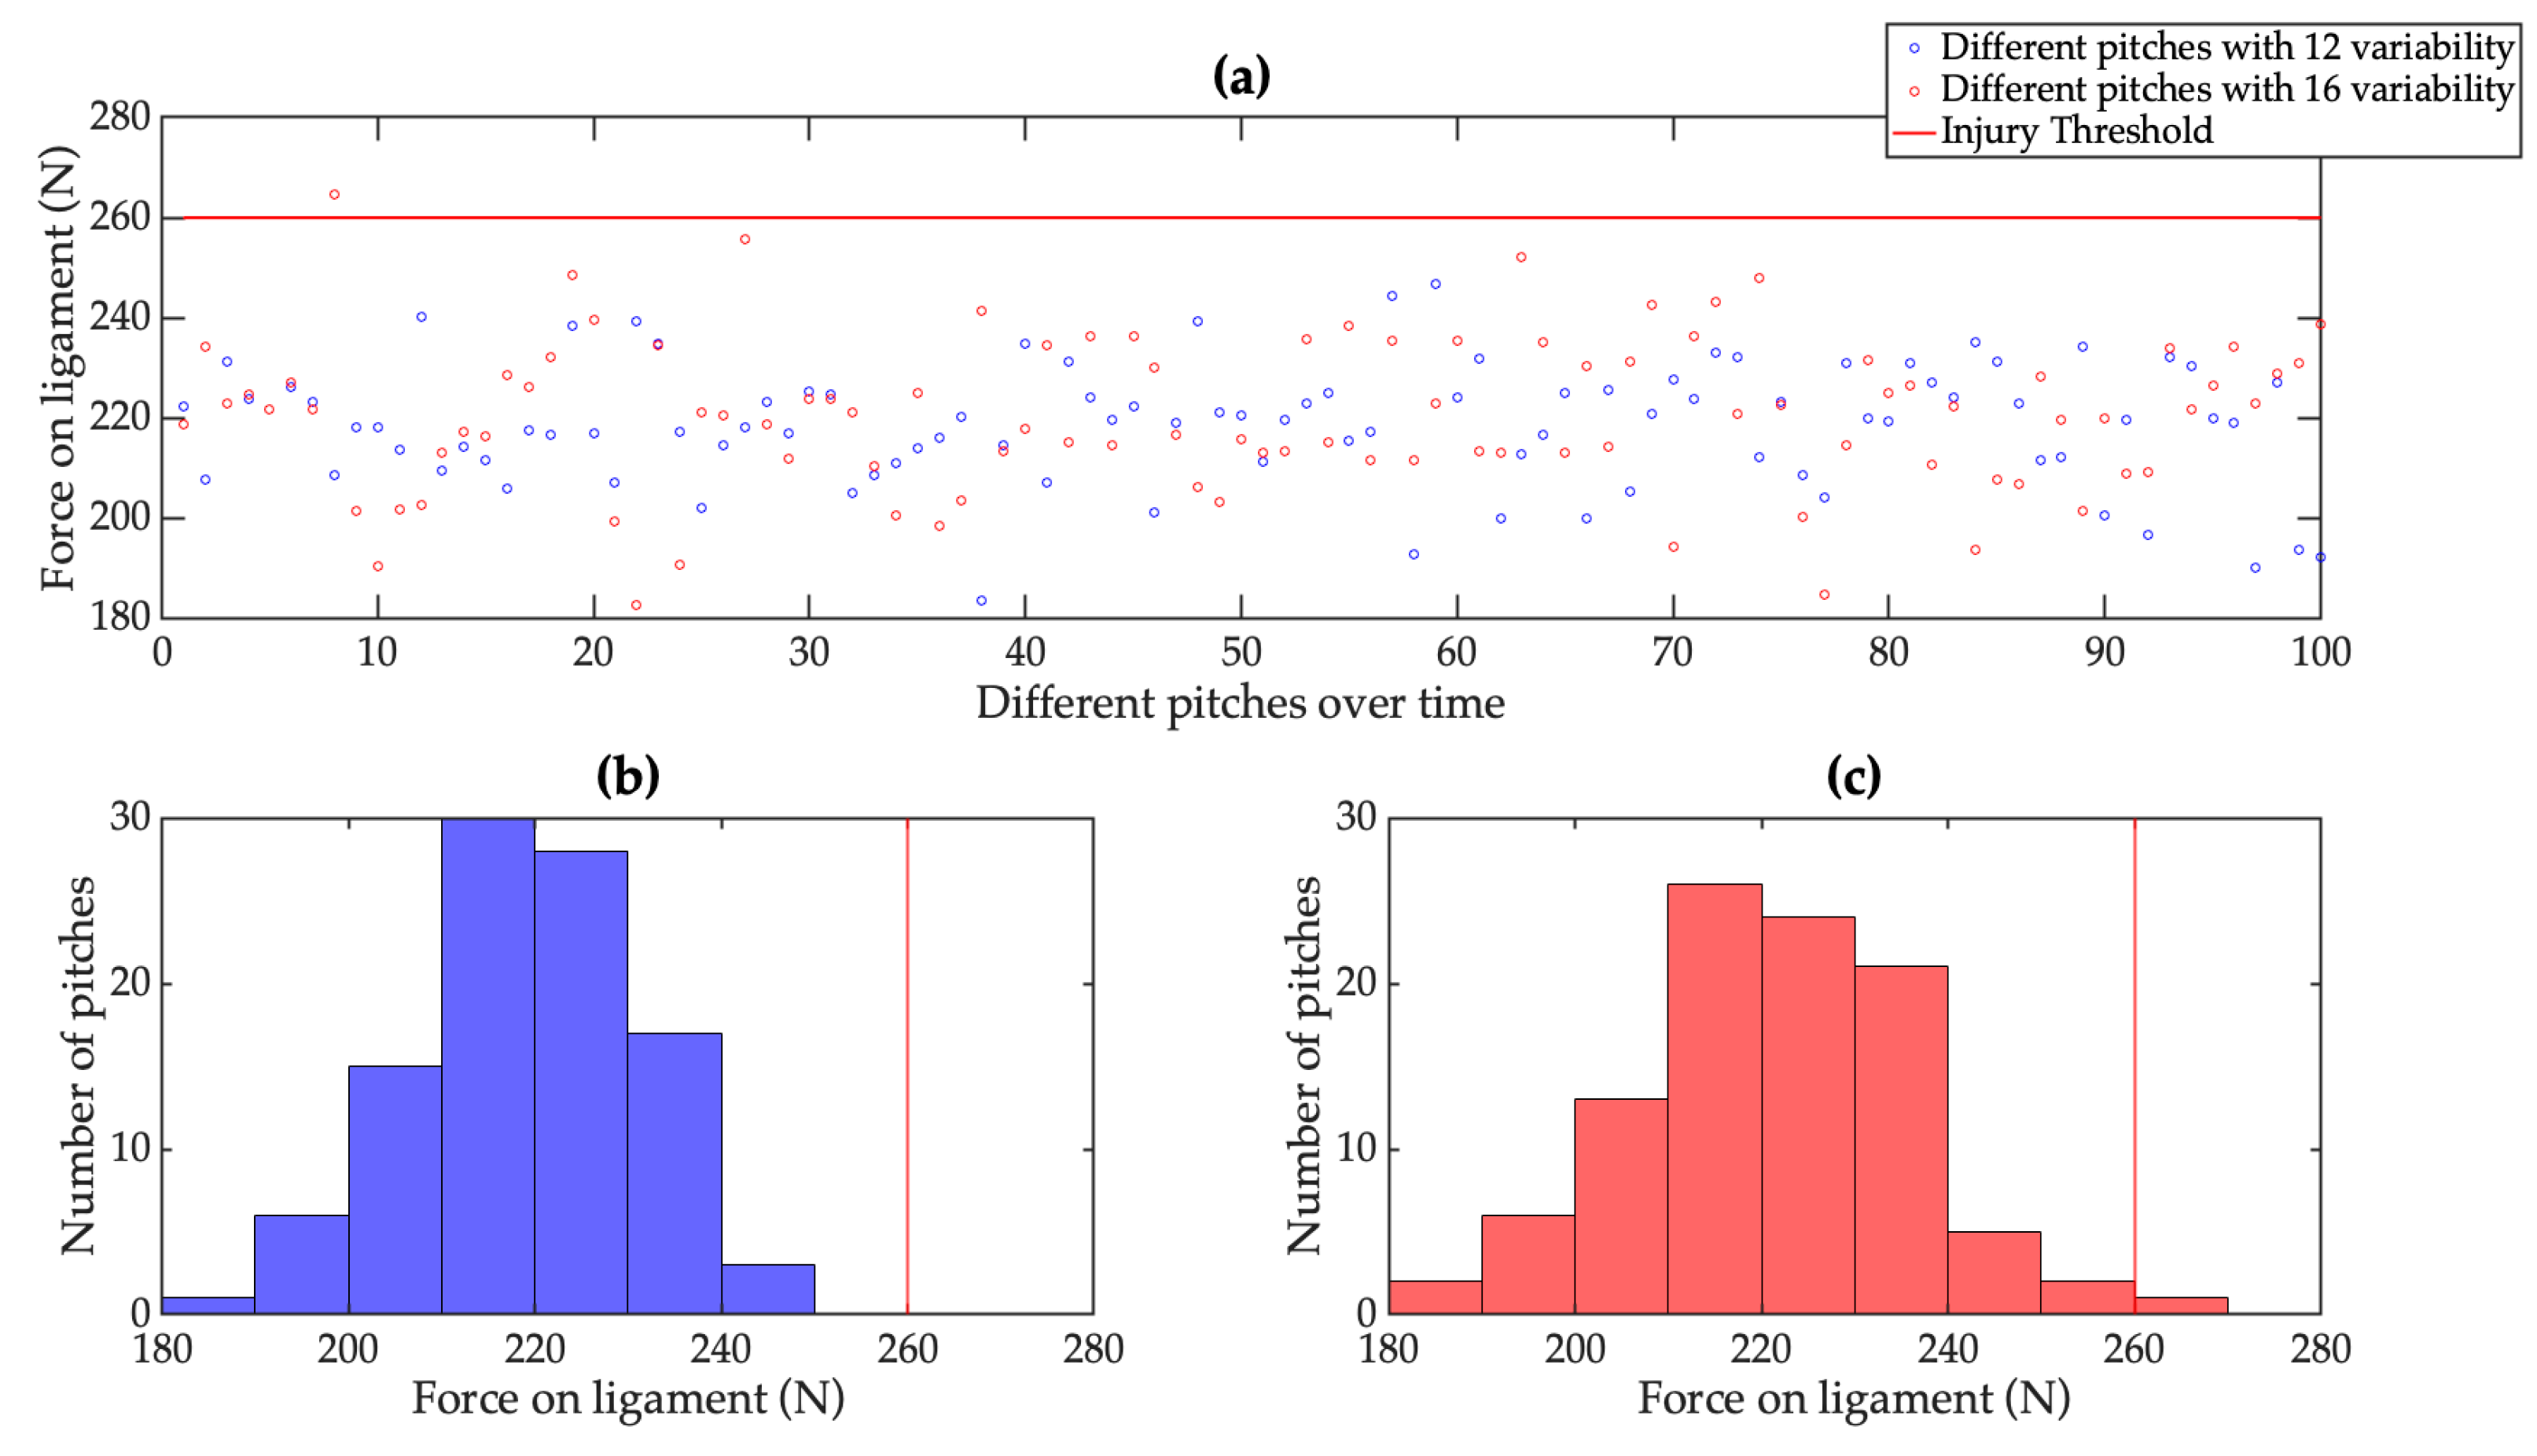
Why do 16% of the pitchers sustain a UCL injury, while others do not? Most studies investigate the group averages of kinematic and kinetic variables in relation with performance or injuries, starting from the assumption that these variables relate to overloading of the UCL. It is, however, probably more relevant to focus on within-pitcher variability as well as the average magnitude of load. This assumes that an injury occurs when a peak load exceeds a certain injury threshold and that a large variability, in combination with a high average magnitude, will increase the risk of reaching that threshold. Based on the magnitude of individual variability, some individuals will have a higher risk compared to others. Individuals with lower load variability are less likely to sustain an injury compared to individuals with a higher load variability (
Figure 1a). Furthermore, this variability is likely influenced by different factors such as fatigue or intersegmental coordination.
The UCL resists an external valgus torque during the baseball pitch. This external valgus torque stresses the UCL, which counteracts this by an internal varus torque. To determine the UCL injury risk, the UCL load needs to be determined. It is, however, not possible to measure UCL loading directly during the baseball pitch. Therefore, researchers have used inverse dynamic analysis to calculate the varus–valgus torque during the baseball pitch [
3], which can be seen as a proxy for UCL loading. At a certain peak load, the UCL will give in or tear; the magnitude of which cannot be concluded from the inverse dynamic analysis. For this reason, researchers have tried to estimate the ultimate peak load and ultimate valgus torques of the UCL with in-vitro studies [
4,
5]. This in-vitro peak load or ultimate valgus torque can be assumed as the injury threshold.
The purpose of this paper is to illustrate the concept of individual pitcher load variability in relation to injury risk.
2. The UCL Ultimate Strength as a Proxy of the Injury Threshold
UCL strength has been estimated with in-vitro studies. Most of the in-vitro studies have investigated the ultimate valgus torque that the UCL could resist by applying a torque around the elbow. They found that the UCL could resist a valgus torque of approximately 30 Nm [
5,
6]. Dividing these torques by the torque arm (the distance between UCL position and the rotation center) indicates the force the UCL has to resist, which unfortunately can be difficult to determine due to unreported or an undefined definition of lever arms. Two other studies used bone-to-bone complexes to investigate the ultimate force, and found values of approximately 260 N to 293 N [
4,
7]. These studies used adult cadavers with a mean age around 54 years and most likely no history in baseball. While short-term repetitive loading might lead to a decrease in strength, long-term regular loading of a ligament will probably increase its load capacity, which would imply that a strength scaling factor for baseball players might be necessary.
The short-term relationship between regular loading and UCL ultimate strength is unknown. None of the in-vitro studies have investigated the influence of fatigue and creep on the UCL ligament. From animal studies, it is known that rabbit ligaments show non-linear viscoelastic behavior over time [
8]. Furthermore, in rabbit ligaments, tensile fatigue loading (cycle- and time-dependent) appeared to be more damaging than creep (time-dependent) [
9]. Future research should investigate the influence of adaptation to understand its effect on UCL strength threshold.
3. Within-Pitcher Load Variability and Fatigue
Gaining insight in the magnitude of within-pitcher load variability and an estimated injury threshold will provide more information about the possibility of the occurrence of UCL injuries. To illustrate the influence of variability, and to lay out the basis for a predictive injury risk model, we constructed a simple explanatory simulation model. In this model, the inputs were the average UCL load (N), the number of balls pitched, the variability of the UCL load (N) (modeled as a Gaussian distribution) and the injury threshold, as well as the influence of time-dependency on the last two variables. We ran this computer simulation model three times to explain the influence of variability and fatigue.
3.1. Within-Pitcher Load Variability in Relation with Injury Risk
Simulation 1: in this simulation (
Figure 1a, blue dots), 100 throws were simulated. The injury threshold was set at 260 N based on the in-vitro studies. The UCL load is unknown during pitching, therefore the average UCL load input was 220 N based on 85% of the injury threshold. The variability factor was modeled as an input factor (in this simulation 12) multiplied with a random number extracted from a Gaussian distribution with a zero-mean. Each blue dot represents the simulated theoretical force on the UCL by one pitch. In this particular case, the injury threshold was not exceeded. This is also represented in the histogram of
Figure 1b.
Simulation 2: This involved running the simulation program again (
Figure 1a, red dots) with the same average UCL load and number of pitches, but with an arbitrarily increased variability of 33.3% (input factor of 16). It was shown that the injury threshold was exceeded once at pitch 8. Increasing the variability of the force on the UCL will increase the likelihood of exceeding the injury threshold. This means that a pitcher who throws with a higher variability (
Figure 1c) will have a higher injury risk when compared to a pitcher with a lower variability (
Figure 1b).
3.2. Influence of Fatigue on Load Variability and Injury Threshold
In the above simulation, program time had not yet been considered. However, it is known that the number of pitches thrown per inning, game or season have frequently been associated with higher injury risks in UCL injuries [
10,
11]. This could mean that fatigue will increase load variability; conversely, it will decrease the injury threshold. Within one training session, pitchers show fatigue during pitching, which can be seen in kinematics and kinetics [
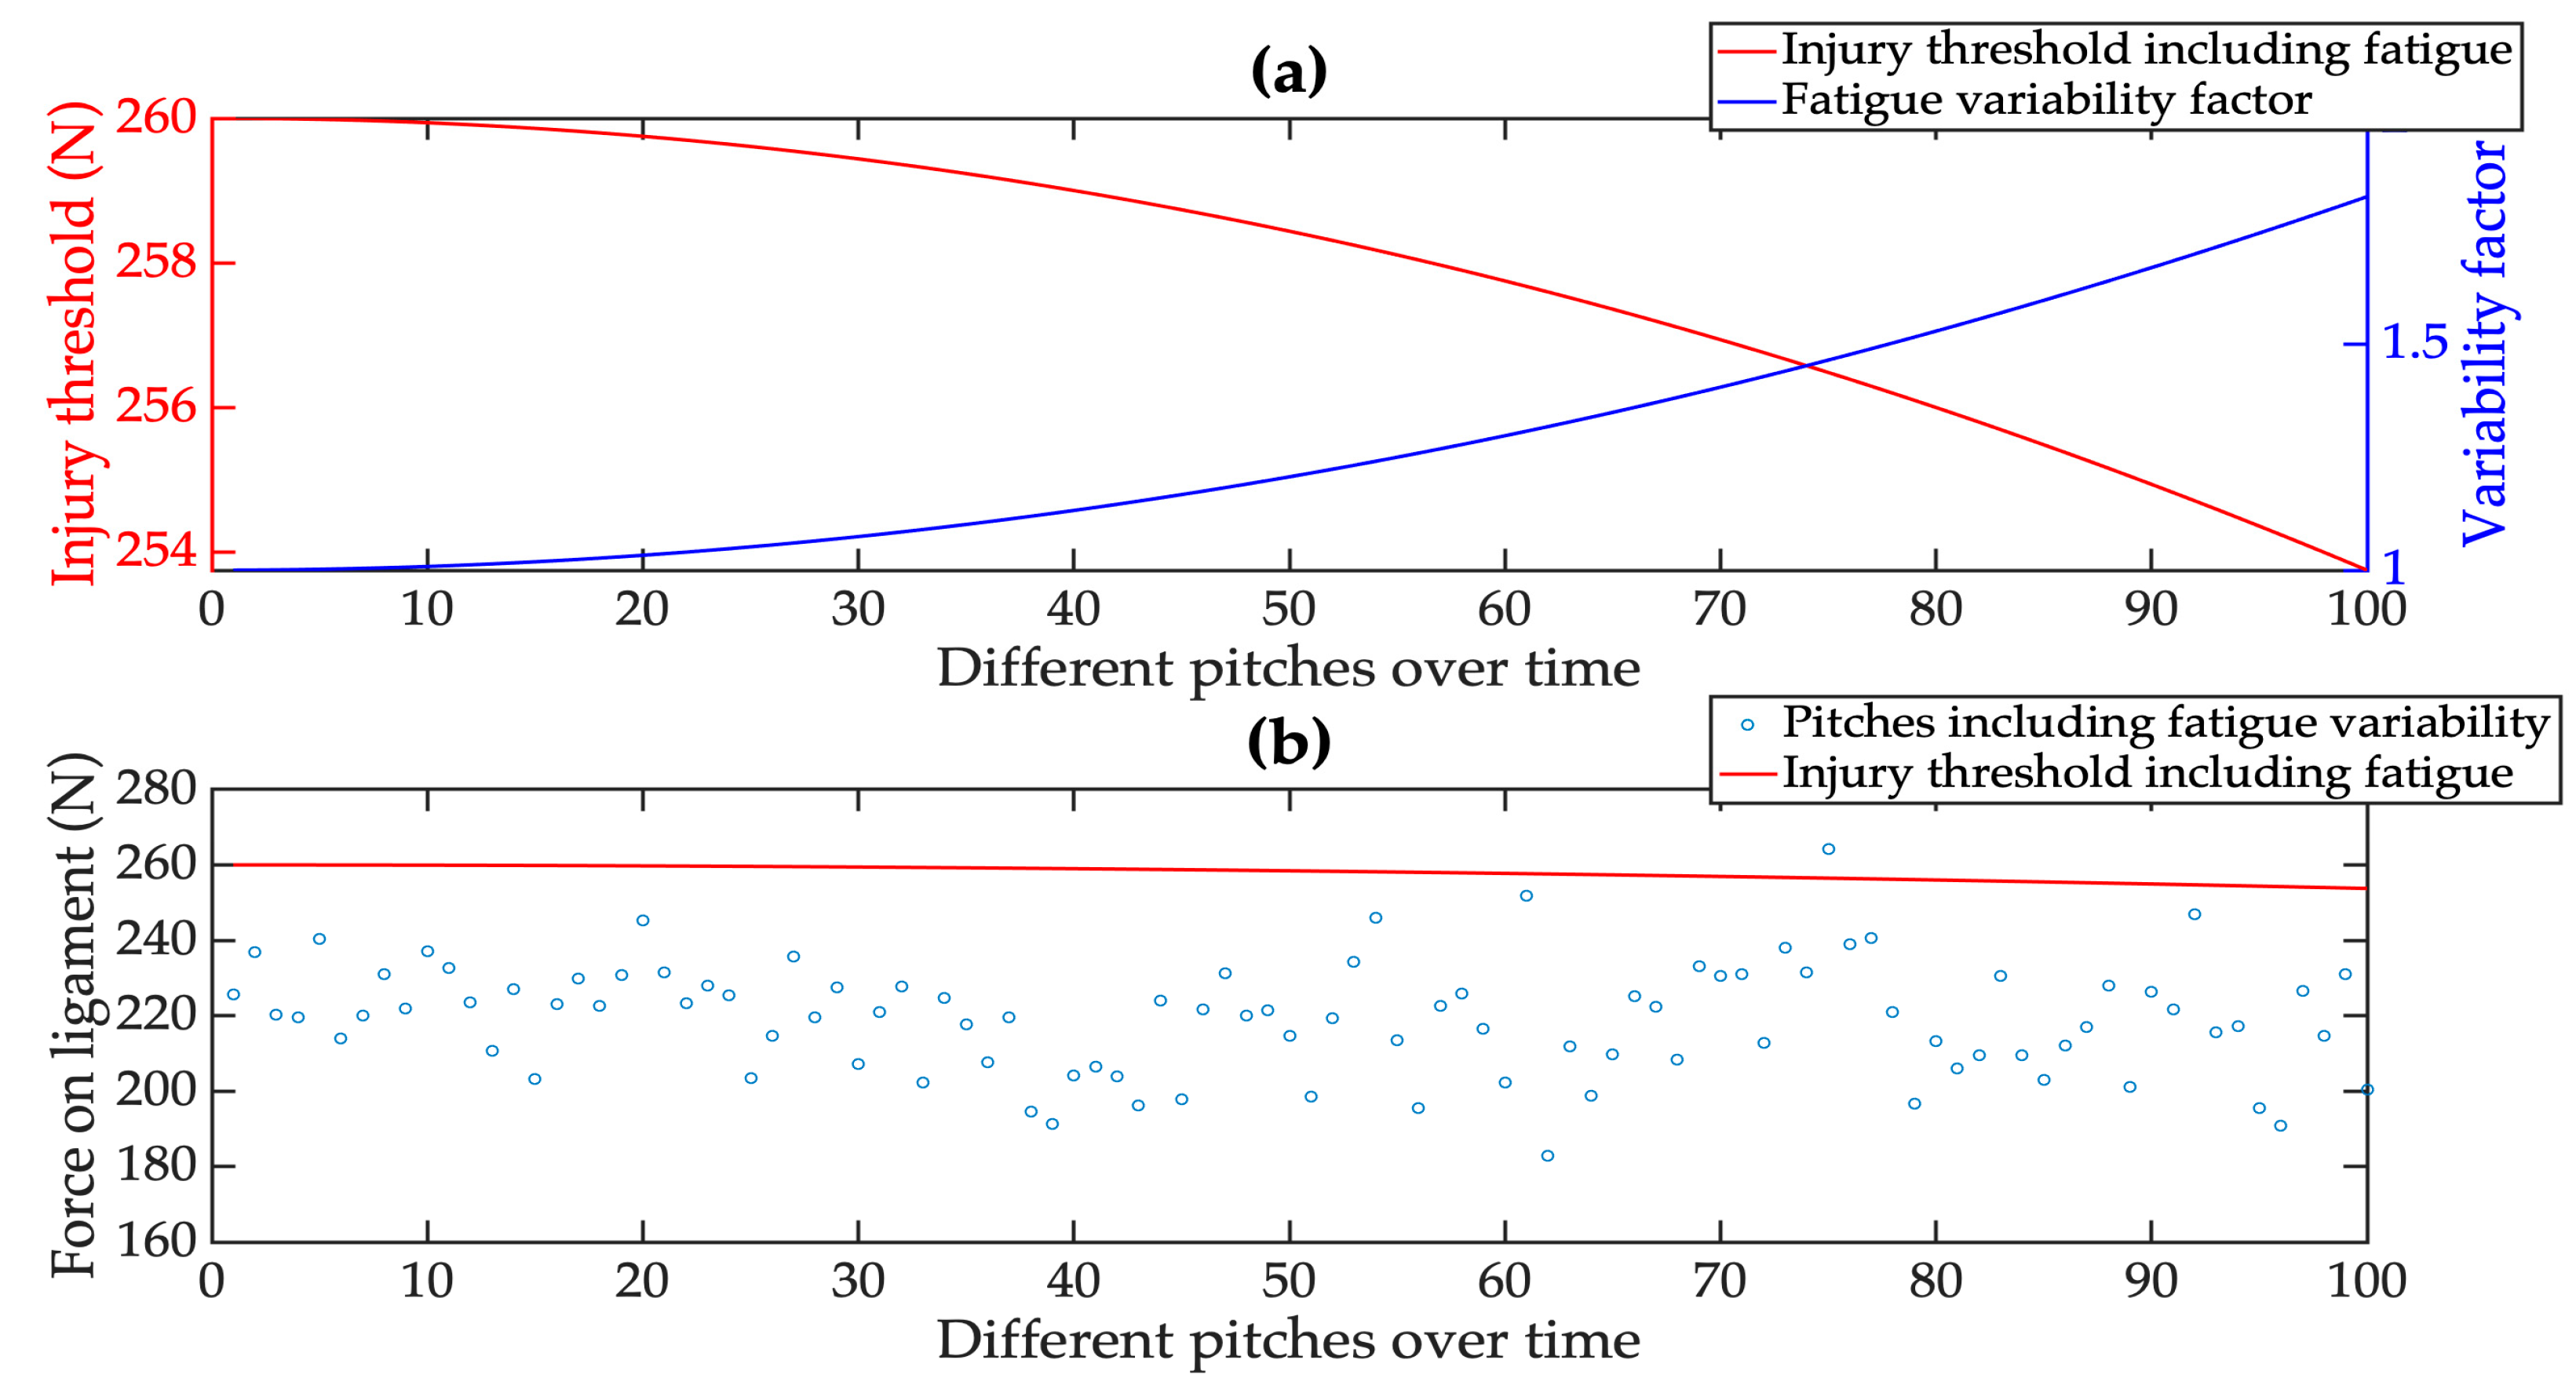
12]. Fatigue could have an influence on the variability of the UCL loading. Unfortunately, the influence of fatigue on load variability has never been investigated by means of experimental studies. Based on the idea of maintaining performance, compensation will occur which will increase the UCL load, although due to a reduced load capacity the UCL load will decrease. Based on this educated estimate, we assume that the relation between load variability and fatigue is non-linear. Therefore, we modeled this as a quadratic function with an intercept of 1 (
Figure 2a, blue line) and multiplied with the variability.
The injury threshold could change over time within a training session or match and between trainings and matches, which will result in a positive or negative adaptation. Within a training session or match, the load capacity of the UCL will probably adapt negatively due to repetitive movement and fatigue. Based on the in-vitro studies discussed in section 2 [
8], we added the non-linear effect of fatigue to the injury threshold. This non-linear effect was modeled as a quadratic function and subtracted from the in-vitro peak injury threshold of 260 N (
Figure 2a, red line).
Simulation 3: In the third simulation the same input as simulation 1 was used, but this time the influence of fatigue was added to the UCL load variability and the injury threshold. The simulation showed an increased variability and a decreased injury threshold over time, which results in a higher chance of sustaining an injury.
This simple explanatory simulation model will be used in the future as the basis for a feedback tool, although the model will of course need more reliable input (and/or output) variables to be useful for prediction purposes. Most important is the input of the UCL loading during every pitch. In the simulations, the average UCL load was estimated based on 85% of the injury threshold. However, to predict the injury risk for an individual pitcher, the UCL load has to be estimated in vivo.
4. UCL Loading during the Baseball Pitch
The UCL force cannot be measured directly during pitching. Therefore, inverse dynamics were used. With the upcoming trend of musculoskeletal modeling, it becomes possible to calculate the UCL loading in more detail, although these models are not well validated for high-end sports applications. As a consequence, many studies on UCL load use the elbow valgus torque as a proxy for UCL load in relation to injuries. In multiple studies, across various levels of pitching and ages of the pitcher, the peak external valgus torque is in a range of 45–120 Nm [
3].
From some recent publications the kinematic variability within pitchers can be estimated [
13]. However, none of these studies have investigated the within-pitcher variability of the UCL loading or an equivalent of UCL loading. For a predictive model on injury risk, it is adamant that the within-variability of the UCL loading is known. There is also a need for more insight into the influence of fatigue on UCL load. Birfer et al. (2019) have shown that fatigue is linked to pain, injuries and kinematics [
14]. However, the influence of fatigue on the variability of the UCL loading is unknown.
5. Discussion
The purpose of this paper is to outline a model for the prediction of injury risk in pitching. The simple explanatory simulation model illustrates the multicausality of injury risk, as well as the time-dependency of this risk.
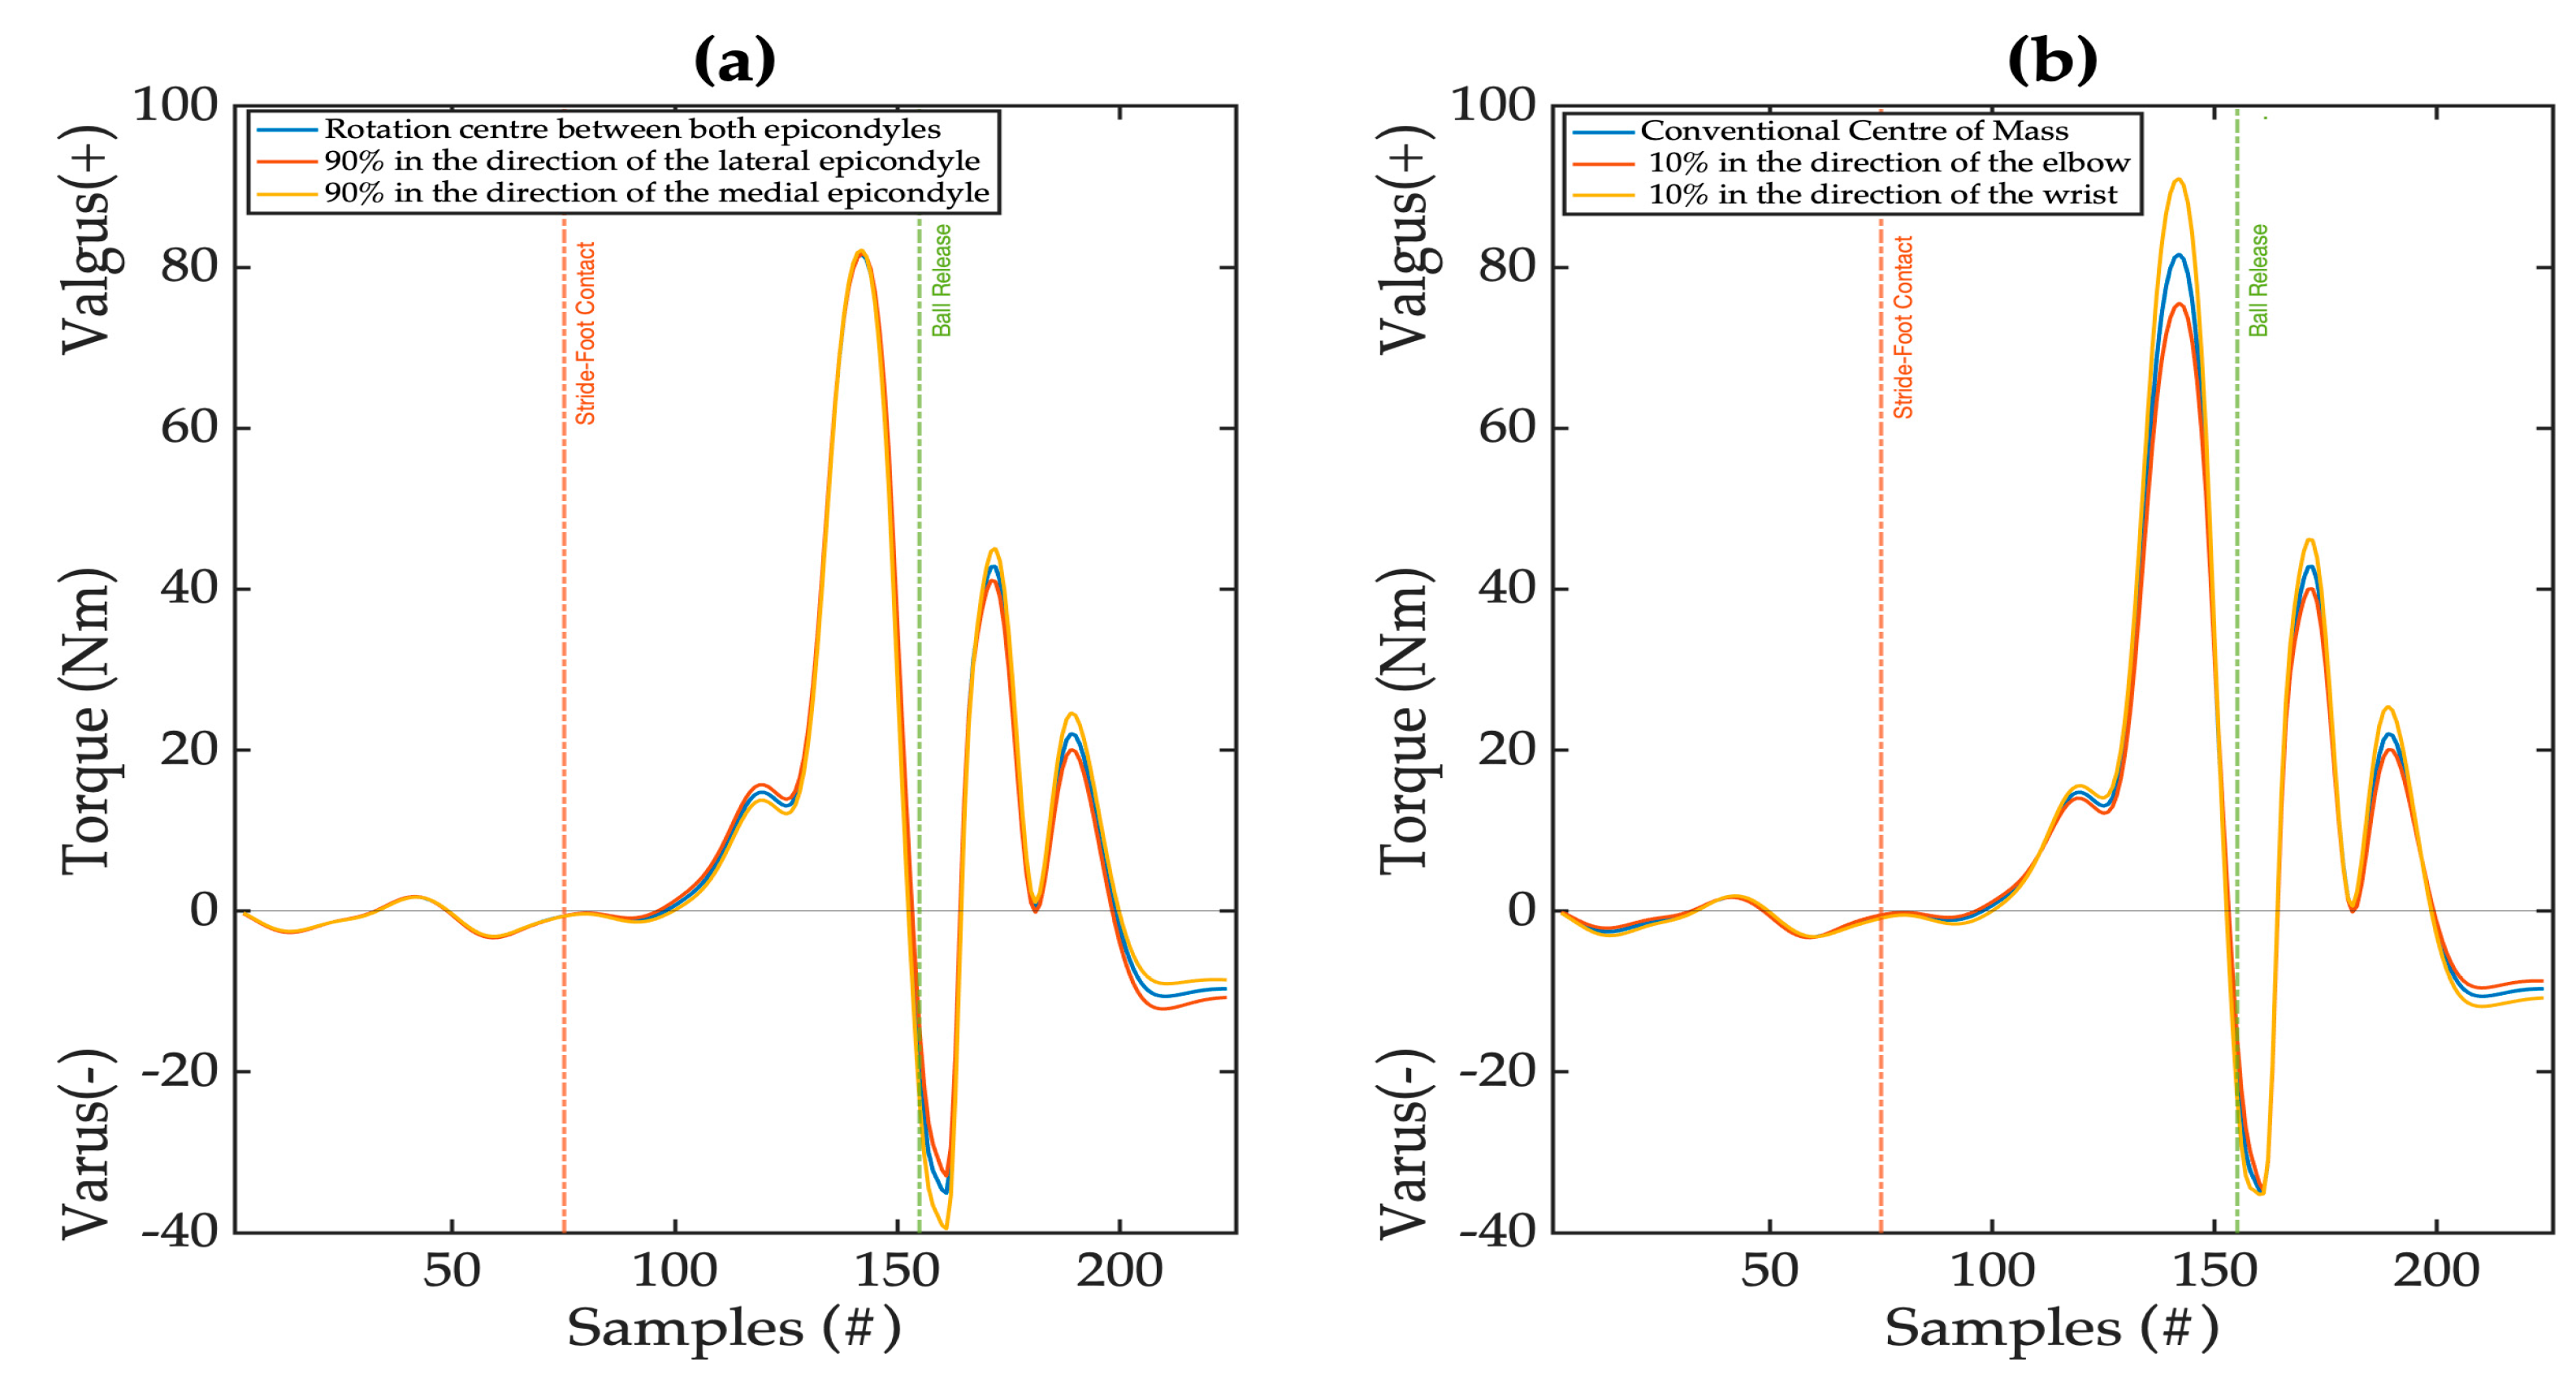
Using the available results of in-vitro studies, educated guesses can be made for the model parameters, while the results from the inverse dynamics in the baseball pitch can be used as indication for the variability on UCL loading. Using the external valgus torque seems practically more achievable than calculating the UCL force. However, this torque exceeds the ultimate valgus torque of the in-vitro studies in every pitch with at least 15 Nm. These differences may be due the assumptions in the inverse dynamic models, which are mainly based on segment fixed three degrees of freedom models. Most studies assume the rotation center in the middle between the lateral and medial humeral epicondyle, although the exact rotation center in the elbow is unknown. To determine the influence of this assumption, the varus–valgus torque was estimated by inverse dynamics with three different simulated rotation centers during a baseball pitch: in the middle between both epicondyles, 90% in the direction of the lateral epicondyle, and 90% in the direction of the medial epicondyle (
Figure 3a). Details of the inverse dynamic method can be found in the study of Leenen et al. [
15]. The results show small differences over time; however, at the instant of the peak external valgus torque it is negligible, which does not explain the torque differences between in-vitro and inverse dynamics. The center of mass position is, for example, more important in terms of peak external valgus torque (
Figure 3b). Joint geometry and/or muscle force are in principle able to resist at least part of the elbow external valgus torque and might explain this difference. Several forearm muscles have the potential to resist the external valgus torque [
16]. The muscle onset of these muscles could influence the load distribution on the UCL. For instance, if the activation is inappropriate, the UCL will be stressed more. However, information about the exact muscle onset in relation to the peak external valgus torque is absent due to the generalization over phases of the pitch cycle. Therefore, future studies should investigate the potential shielding effect of muscles around the elbow during the baseball pitch. In conclusion, the external valgus torque is most practical as an input for the model; however, we need to understand the distibution of this torque over UCL, muscles and joint geometry.
It is generally accepted that fatigue has an influence on load variability. The literature shows that fatigue is associated with injuries, and, therefore, it is likely that fatigue within one training session or match increases the load variability and decreases the injury threshold over time. When fatigue was added to our model, the likeliness of exceeding the injury threshold increased. For now, the influence of fatigue on the injury threshold was modeled as a quadratic non-linear effect based on animal studies. The exact non-linear relation of fatigue to the UCL loading should, however, be investigated in the future. The same should be done for the influence of fatigue on load variability.
6. Conclusions
Investigating the individual load variability of pitchers shows its potential toward injury prevention. All pitchers are at risk of sustaining an injury; a higher load variability, higher magnitude and longer exposure all increase this risk. To develop a predictive model for this risk, more information on all parameters is needed, but probably most importantly are those on the magnitude of the variability component.
Acknowledgments
This work was supported by the NWO Domain Applied and Engineering Sciences (AES) under project number [R/003635]. This NWO-funded project, named Breaking the High Load—Bad Coordination Multiplier in Overhead Sports Injuries part of the Citius Altius Sanius perspective program (Project 7), is a cooperative effort between the Royal Netherlands Baseball and Softball Federation, Vrije Universiteit Amsterdam, Delft University of Technology, Manual Fysion and PLUX.
Conflicts of Interest
The authors declare no conflict of interest.
References
- Conte, S.A.; Fleisig, G.S.; Dines, J.S.; Wilk, K.E.; Aune, K.T.; Patterson-Flynn, N.; ElAttrache, N. Prevalence of Ulnar Collateral Ligament Surgery in Professional Baseball Players. Am. J. Sports Med. 2015, 43, 1764–1769. [Google Scholar] [CrossRef] [PubMed]
- Erickson, B.J.; Nwachukwu, B.U.; Rosas, S.; Schairer, W.W.; Mccormick, F.M.; Bach, B.R., Jr.; Bush-Joseph, C.A.; Romeo, A.A. Trends in Medial Ulnar Collateral Ligament Reconstruction in the United States A Retrospective Review of a Large Private-Payer Database From 2007 to 2011. Am. J. Sports Med. 2015, 200, 1770–1774. [Google Scholar] [CrossRef] [PubMed]
- Chalmers, P.N.; Wimmer, M.A.; Verma, N.N.; Cole, B.J.; Romeo, A.A.; Cvetanovich, G.L.; Pearl, M.L. The Relationship between Pitching Mechanics and Injury: A Review of Current Concepts. Sports Health 2017, 9, 216–221. [Google Scholar] [CrossRef] [PubMed]
- Regan, W.D.; Korinek, S.L.; Morrey, B.F.; An, K.N. Biomechanical study of ligaments around the elbow joint. Clin. Orthop. Relat. Res. 1991, 271, 170–179. [Google Scholar] [CrossRef]
- McGraw, M.A.; Kremchek, T.E.; Hooks, T.R.; Papangelou, C. Biomechanical evaluation of the docking plus ulnar collateral ligament reconstruction technique compared with the docking technique. Am. J. Sports Med. 2013, 41, 313–320. [Google Scholar] [CrossRef] [PubMed]
- Ahmad, C.S.; Lee, T.Q.; Elattrache, N.S. Biomechanical Evaluation of a New Ulnar Collateral Ligament Reconstruction Technique with Interference Screw Fixation. Am. J. Sports Med. 2003, 31, 332–337. [Google Scholar] [CrossRef] [PubMed]
- Jackson, T.J.; Jarrell, S.E.; Adamson, G.J.; Chung, K.C.; Lee, T.Q. Biomechanical differences of the anterior and posterior bands of the ulnar collateral ligament of the elbow. Knee Surgery. Sport Traumatol. Arthrosc. 2016, 24, 2319–2323. [Google Scholar] [CrossRef] [PubMed]
- Hingorani, R.V.; Provenzano, P.P.; Lakes, R.S.; Escarcega, A.; Vanderby, R. Nonlinear viscoelasticity in rabbit medial collateral ligament. Ann. Biomed. Eng. 2004, 32, 306–312. [Google Scholar] [CrossRef] [PubMed]
- Thornton, G.M.; Schwab, T.D.; Oxland, T.R. Fatigue is more damaging than creep in ligament revealed by modulus reduction and residual strength. Ann. Biomed. Eng. 2007, 35, 1713–1721. [Google Scholar] [CrossRef] [PubMed]
- Lyman, S.; Fleisig, G.S.; Waterbor, J.W.; Funkhouser, E.M.; Pulley, L.; Andrews, J.R.; Osinski, E.D.; Roseman, J.M. Longitudinal study of elbow and shoulder pain in youth baseball pitchers. Med. Sci. Sports Exerc. 2001, 33, 1803–1810. [Google Scholar] [CrossRef] [PubMed]
- Fleisig, G.S.; Andrews, J.R.; Cutter, G.R.; Weber, A.; Loftice, J.; McMichael, C.; Hassell, N.; Lyman, S. Risk of serious injury for young baseball pitchers: A 10-year prospective study. Am. J. Sports Med. 2011, 39, 253–257. [Google Scholar] [CrossRef] [PubMed]
- Freeston, J.; Adams, R.; Ferdinands, R.E.D.; Rooney, K. Indicators of Throwing Arm Fatigue in Elite Adolescent Male Baseball Players: A Randomized Crossover Trial. J. Strength Cond Res. 2014, 28, 2115–2120. [Google Scholar] [CrossRef] [PubMed]
- Scarborough, D.M.; Bassett, A.J.; Mayer, L.W.; Berkson, E.M. Kinematic sequence patterns in the overhead baseball pitch. Sport Biomech. 2018, 1–18. [Google Scholar] [CrossRef] [PubMed]
- Birfer, R.; Sonne, M.W.; Holmes, M.W. Manifestations of muscle fatigue in baseball pitchers: A systematic review. PeerJ 2019, 7, e7390. [Google Scholar] [CrossRef] [PubMed]
- Leenen, A.J.R.; van Trigt, B.; Hoozemans, M.J.M.; Veeger, H.E.J. Effects of a disturbed kinetic chain in the fastball pitch on elbow kinetics and ball speed. Procedia Eng. Submitted.
- Lin, F.; Kohli, N.; Perlmutter, S.; Lim, D.; Nuber, G.W.; Makhsous, M. Muscle contribution to elbow joint valgus stability. J. Shoulder Elb Surg. 2007, 16, 795–802. [Google Scholar] [CrossRef] [PubMed]
- Zatsiorsky, V.M. Kinetics of Human Motion; Human Kinetics, 2002; pp. 538–616. [Google Scholar]
| Publisher’s Note: MDPI stays neutral with regard to jurisdictional claims in published maps and institutional affiliations. |
© 2020 by the authors. Licensee MDPI, Basel, Switzerland. This article is an open access article distributed under the terms and conditions of the Creative Commons Attribution (CC BY) license (https://creativecommons.org/licenses/by/4.0/).


 ,
, 
_Veeger.png)


