1. Introduction
Effective stroke play in cricket requires the batsman to execute a combination of a complex body segment movements with high spatial and temporal control. Analysis of cricket batting shot execution is useful for numerous applications including performance evaluation, talent identification, injury prevention, and surveillance. Selection of the correct data capturing systems and methodologies are vital to the success of any sports activity recognition application. The data capturing system should not inconvenience or compromise the performance of the player, and the sensing elements should not disrupt their natural playing techniques. Camera-based, 3D position tracking methods are widely used in biomechanics applications, although the complexity of their use and lengthy post-processing generally limit their use to research studies. Body-worn inertial measuring units (IMUs), typically consisting of accelerometers, gyroscopes, and magnetometers, have been introduced to sports applications to capture movement data of athletes [
1]. The benefits of using IMUs for batting movement data capture includes; the low cost of equipment; the experiments are not limited to laboratory-based setup; the dimensions of IMUs do not restrict body movements of the batsman; and direct measurement of linear acceleration or angular velocity, which eliminates the noise associated with differentiating data collected in a camera-based system [
2]. While having the above-mentioned benefits, the recent innovations in Micro-electromechanical system (MEMS) technology also reduced the power consumption of the sensors [
3], which makes those more suitable to capture batting movement data over extended periods of time.
Experimental designs used in previous research into cricket shot execution have not replicated a real-world batting session [
4]. The limitations of the experimental design and the equipment used to capture movement data are likely to have affected batting style and the data captured. This paper reports a new experimental protocol, which captures both batting movements and routine activities in a simulated cricket batting session using body-worn IMUs that offer minimal obstruction to the wearer. The paper also discusses the potential of the redesigned batting data capturing method to forecast shot execution of the batsmen by applying supervised machine learning models on the captured batting movement data set.
2. Materials and Methods
Ten right-handed cricket batsmen were recruited for the experiment (age = 21.5 ± 1.5). All batsmen were experienced cricket players, playing at least once a week. Nine players were of club standard, and eight were playing in professional county second-tier teams. The experiment was performed indoors at the National Cricket Centre and batsmen were wearing their preferred protective equipment which variously included; helmet, arm guard, chest protector, groin protector, gloves, thigh protector, and pads. A right-arm fast bowler was used to deliver the balls, and a professional cricket coach was used to assist the batting session. Each experiment session lasted for three overs (one over = six deliveries).
2.1. Equipment
Fifteen Shimmer3 IMUs manufactured by Shimmer Sensing (Dublin, Ireland) were attached at key body segments of a batsman using a minimally invasive Velcro strap. Each IMU contained three tri-axial sensors; an accelerometer, a magnetometer, and a gyroscope, which were sampled at a rate of 512 Hz and recorded onto an embedded memory card. Two synchronised high definition GoPro version 4 cameras were used to record the movements of batsman and bowler at 240 fps. The video recording system was synchronised with the IMUs during data annotation.
2.2. Experiment Protocol
The purpose of the experimental protocol to achieve a close representation of a real-world cricket batting scenario successfully. Therefore, it was designed not only to capture the batting shot execution but also to capture the routine movements of the batsman in between deliveries that form part of an innings. The routine movements can be divided into two broad categories as listed in
Table 1. The experiment was designed to capture data for three consecutive overs. The batsman was given the freedom to select shots and, based on the shot executed, the coach decided the runs each batsman should complete by running between the wickets. The coach also instructed the batsman to perform the activities listed in
Table 1 in between the deliveries as well as overs. The bowler was encouraged to bowl unexpected deliveries to the batsman once every over. That was either a “yorker”, which was pitched on the batting crease or a “bouncer”, which was pitched and raised to the chest level of the batsman or higher. The objective was to record responses of a batsman for an unexpected delivery.
2.3. Post-Processing of Data and Supervised Machine Learning
Captured raw IMU data collected from 15 sensors were synchronised with the video recording using ELAN multimedia annotation software [
5]. Once synchronised, the raw data were labelled into two classes using the same software platform:
Batting shot execution (Positive Class):
Start: Release of the ball from the hand of the bowler;
Termination: The end of the shot execution, which can be either bat-ball impact, ball-body impact or the ball passing the plane representing the batsman
Non-Batting execution activities (Negative Class): All the other activities.
The labelled data set (180 batting cycles of 10 players) was divided into; a training and validation data set (first 13 batting cycles for each player) and test data set (last five batting cycles for each player).
The methodology used in this study is based on that used by Putra et al. and Khan et al. [
6,
7]. Two data segmentation techniques: Fixed Overlapping Sliding Window (FOSW) method and Fixed Non-overlapping Sliding Window (FNSW) method were used to construct the dataset for machine learning model training and validation [
6]. The 180 batting cycles were captured for 10 batsmen, and batting shot execution time per batting cycle accounted for a mean of 685.28 ± 80.63 ms with a minimum being 477 ms. Therefore, the raw training data set was segmented using two sliding windows (SW); 0.125 s and 0.25 s. In the FOSW method, 75% was used as the overlapping percentage of the sliding windows. A feature vector was formed to represent the data collected from 15 IMUs (three sensors with nine channels per IMU) for each SW. Mean, maximum, minimum, signal energy, signal entropy, and the total rate of change were calculated for each sensor axis, with root mean square for each sensor to form the feature vector [
7]. The feature vector was limited to 20 highly relevant features using Neighbourhood Component Analysis (NCA) [
8] and then used for classification.
Three different classification algorithms; Support Vector Machine (SVM), k-nearest neighbours (k-NN), and Discriminant Analysis algorithms, available in the statistics and machine learning toolbox of MATLAB R2018a, were used for classification of batting shots. All models were trained and validated using k-fold cross-validation (k = 5) by splitting the dataset into k holdouts and using each fold as a validation set by conducting holdout validation k times. Finally, in the testing stage, every model was used on the unseen dataset containing 50 batting cycles, that was separated in the beginning, to assess the performance of the model. The test data set was also segmented similarly to the corresponding training dataset, which used to train and validate the model.
2.4. Forecasting Batting Shot Execution
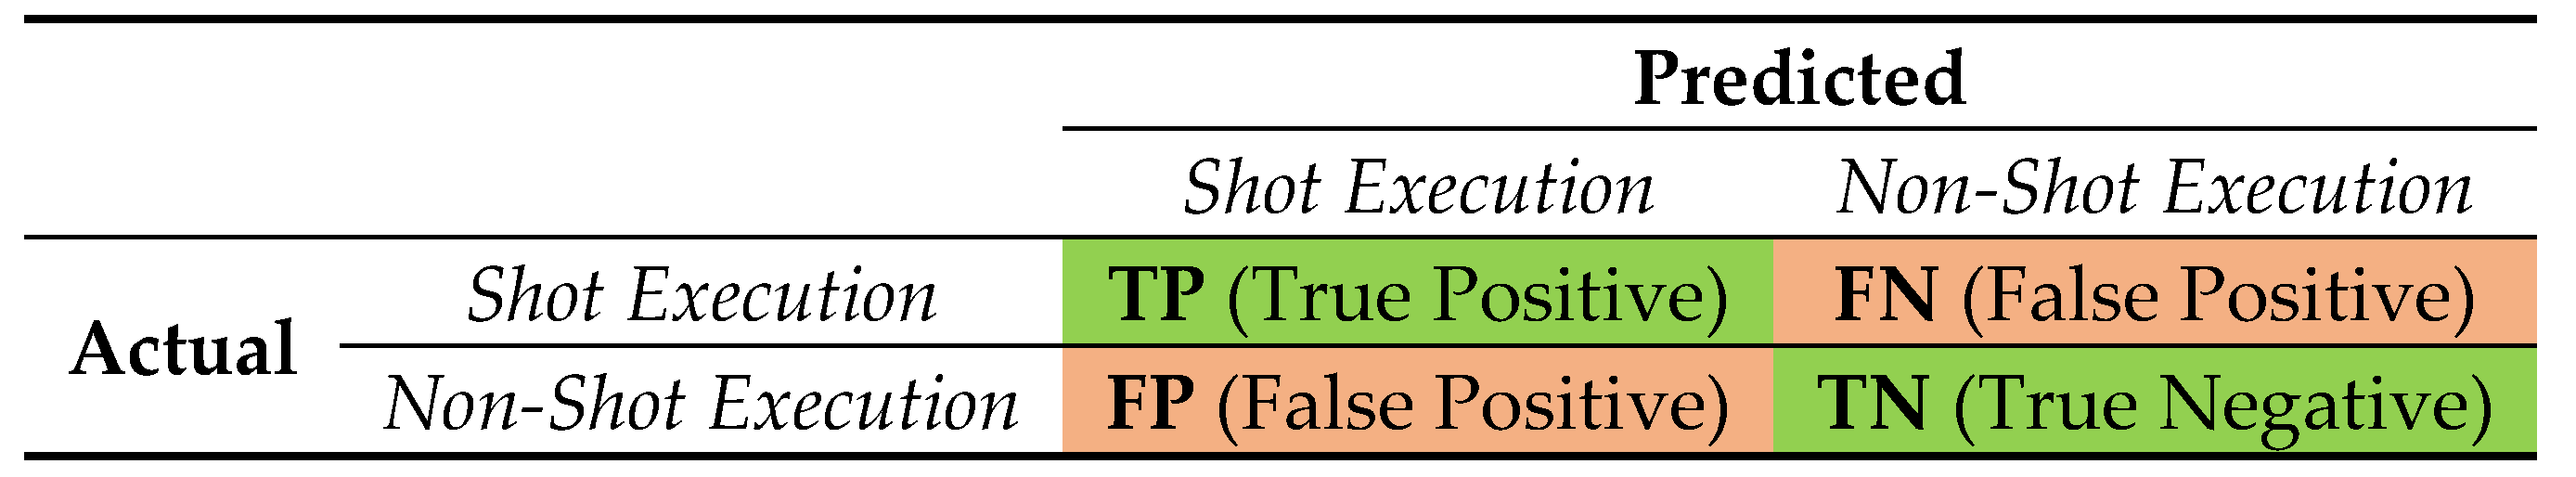
A reliable classifier should be capable of minimising two types of errors; false positives (FP) and false negatives (FN). The assessment method that is used to measure the performance of a supervised machine learning model should reflect the model’s ability to minimise those errors. Most of the widely used model performance assessment criteria in activity monitoring are defined based on a confusion matrix. The confusion matrix for the experiment is shown in
Figure 1, in which cricket batting shot execution is considered as the positive class. When accuracy is used as a performance measure, (Equation (1)) it considers both True Positives (TP) and True Negatives (TN) equally important while minimising FNs and FPs. F-score is another performance measure widely used for the applications with activity class imbalance, in which one activity class consumes significantly more time to the other [
9], and F-score captures the success of minimising FN, FP, and capturing TPs (Equation (2)). Both Accuracy and F-score were computed for each classifier; (i) at the training and validation stage and (ii) at the testing stage.
3. Results
Twenty-eight classifiers were constructed for the experiment as a result of the multiple segmentation techniques and algorithms utilised in the training and validation stage, and
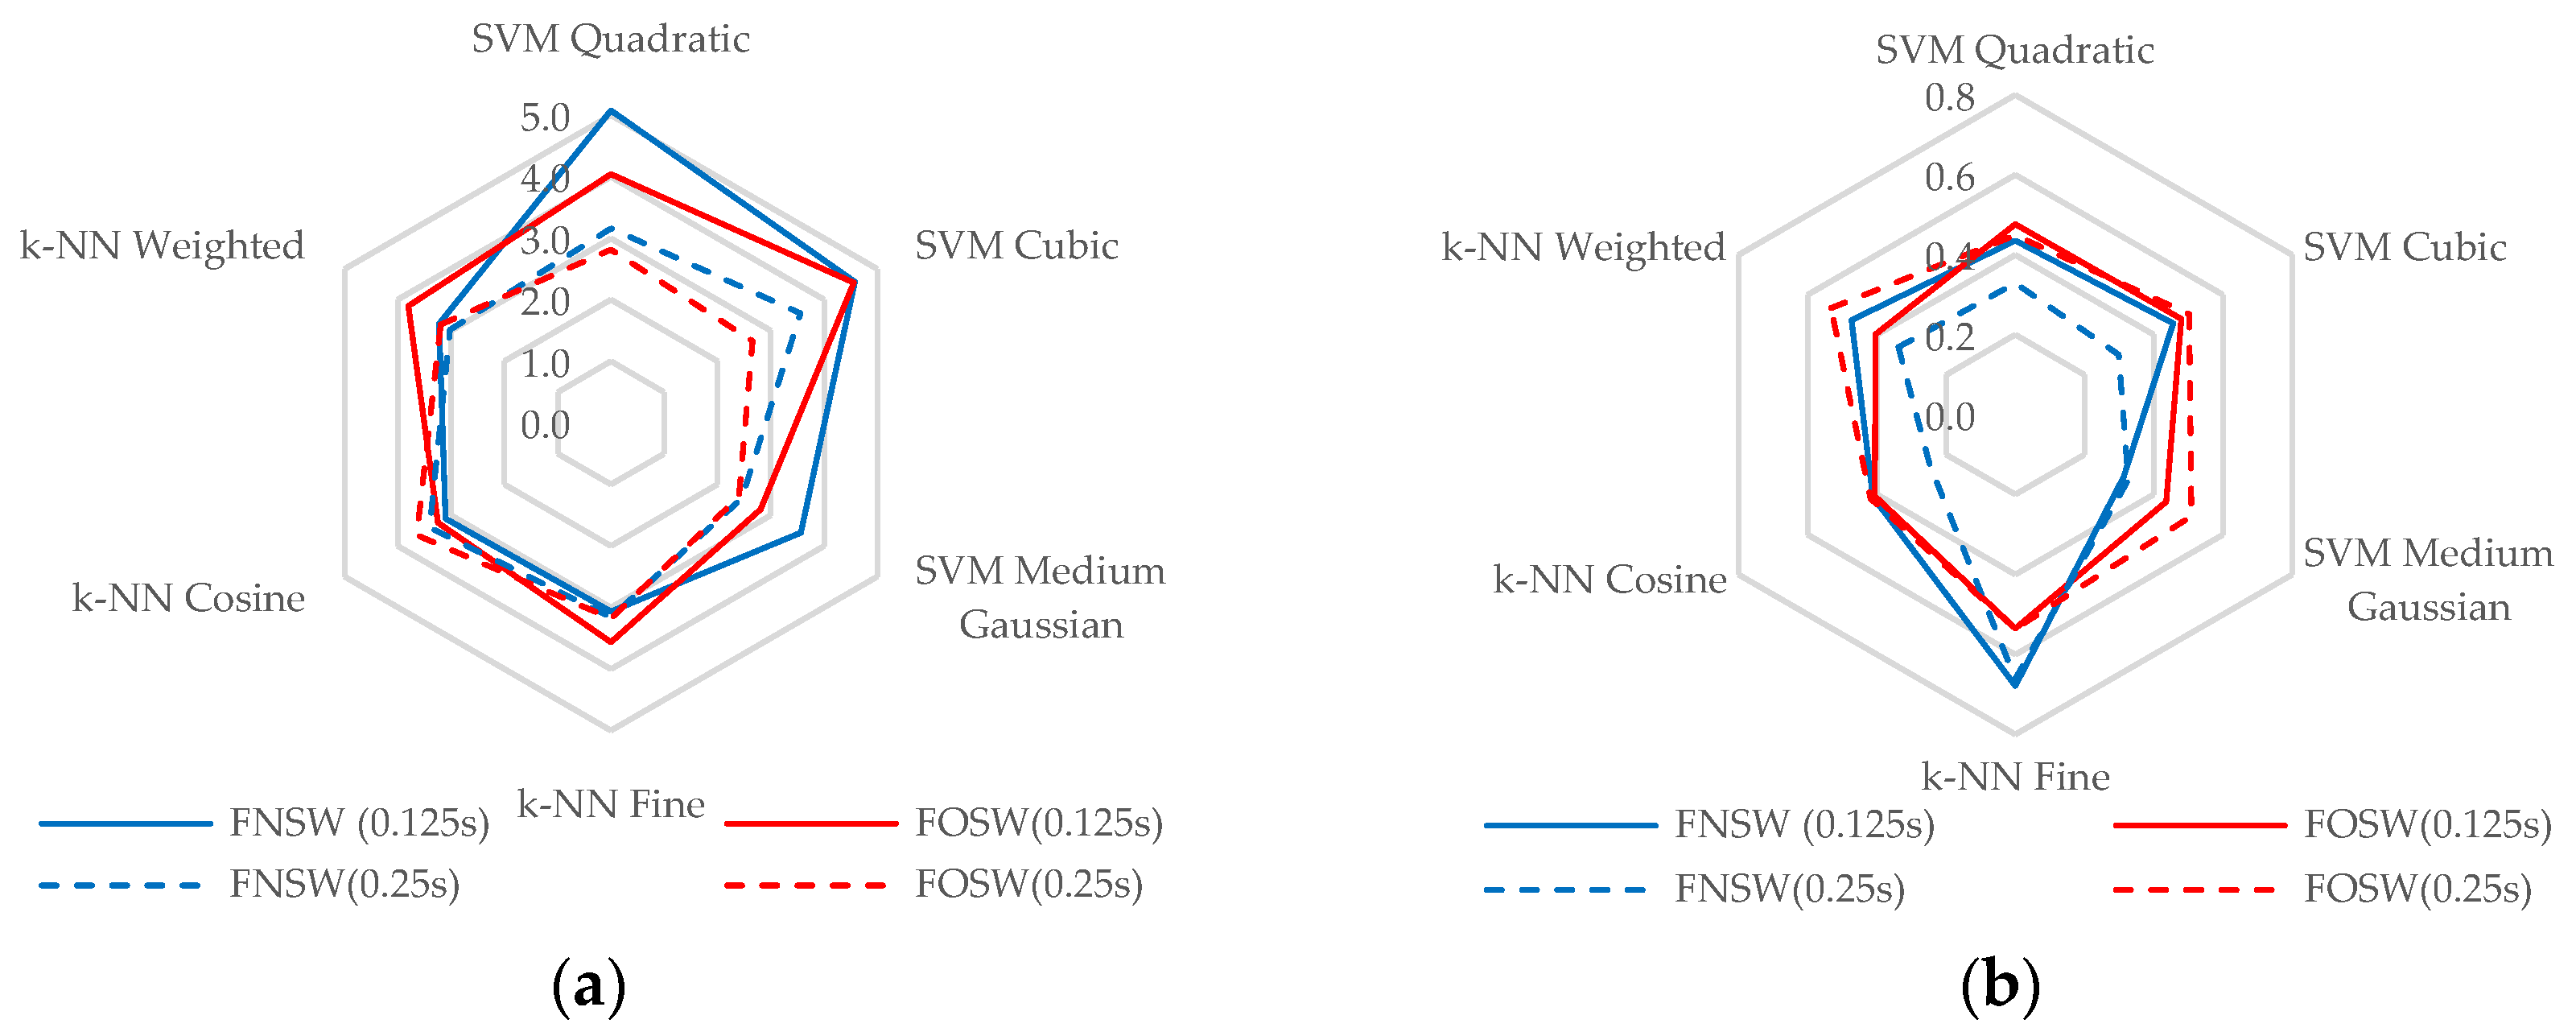
Table 2 lists the computed accuracy and F-score values for every model. All models recorded Accuracy above 95.15% with a maximum of 99.36%. While Medium Gaussian SVM recorded the highest (highlighted in grey), Quadratic Discriminant Analysis recorded the lowest Accuracy values for all segmentation scenarios. According to
Figure 2a, all classifiers except Fine
k-NN recorded an increase in ΔAcc (Equation (3)) for FOSW while FNSW segmentation recorded negative ΔAcc.
When misclassification rates were analysed, the FN percentage was found to be higher than the FP percentage for each model (
Figure 3). The combination of classifiers and segmentation techniques also resulted in different FN and FP percentages. When F-score is calculated, the highest of 97.8% was recorded by a Medium Gaussian SVM classifier and Quadratic Discriminant Analysis classifier recorded the lowest F-score values (<90% across all segmentation scenarios). However, in contrast to accuracy, all SVM models and Cosine
k-NN recorded an increase in ΔFS (Equation (4)) at the testing stage for FOSW and while recording a negative ΔFS for FNSW segmentation.
4. Discussion
The proposed experimental protocol was effectively followed by the batsmen and bowlers who participated in the experiment. Each batting session lasted for approximately 12–15 min. Fifteen IMUs, each sampled at 512 Hz generated a high volume of movement data representing 15 body segments of the batsman. Supervised machine learning was used for the task of predicting a batting shot execution from the collected data set, that cannot be identified using the naked eye. A SW technique was used to construct the training data set and both SWs selected for the segmentation were smaller than the average duration of batting shot execution. The purpose of applying NCA was to extract 20 highly relevant features for every SW to construct the training data set by removing irrelevant and redundant features. A number of validation techniques are available for use in supervised machine learning. Holdout validation is used when a dataset is significantly large, which uses an arbitrary dividing point to separate the dataset into training and validation segments. However,
k-fold cross-validation (
k = 5) was selected as the validation technique for this study to prevent overfitting problem due to a relatively small number of test subjects used in the experiment [
10].
The data set was treated as a binary machine learning problem, and batting shot execution was considered as the positive class. Once trained, each machine learning model was used on the unseen data set and performance assessed based on predicted activity classes. The performance of models was assessed using two widely used measures; Accuracy and F-score. Each measure was calculated twice for every model for the training stage and testing stage. The purpose of computing accuracy and F-score in two stages was to measure the change in performance ΔAcc and ΔFS, which provides a fair assessment on model performance deterioration when it is exposed to an unseen data set.
Medium Gaussian SVM classifier showed the best performance with the highest values for Accuracy and F-score (99.36% and 97.83%), which suggest that the batting shot execution can be forecasted with high prediction accuracy and reliability.
Figure 3 shows that the percentage of FNs are higher than FPs for all classifiers and different classifiers recorded different FP and FN percentages based on the segmentation method used for training and validation. Due to the imbalanced nature of the batting data set, significantly higher data points were available for the negative class, which resulted in the reduction of FP percentage. However, for the prediction of cricket batting shot execution, the priorities were detected shot execution (TP), missed shots (FN), and false alarms (FP), and all three outcomes were considered for F-score calculation except TNs [
6]. Therefore, F-score was deemed to provide a fair assessment of the models used for batting shot execution. An increased length of SW allows for more complex activity detection at a cost of real-time performance [
11]. This is evident in the Medium Gaussian classifiers trained with a data set segmented using FNSW with a larger sliding window, which produced the highest F-score while also increasing the performance on the test data set.
The suggested experimental protocol to collect batting movement data proven to be successful in forecasting batting shot execution in cricket by using IMUs and supervised machine learning. However, as shown in the results, the success of forecasting batting shot execution depends on multiple factors such as the type of classifier used and the type of data segmentation technique used to construct the training data set. Therefore, special attention should be given when selecting those parameters for the experiment.
5. Conclusions
Based on a dataset of cricket batter movements captured throughout a simulated inning, it has been shown to be possible to forecast the batting shot execution using supervised machine learning with high prediction accuracy (Accuracy = 99.36% and F-score = 97.83%). IMUs were shown to be capable of capturing movement data in cricket batting, with minimal preparation time and post-processing while causing minimal disruptions to the movement patterns of the athlete. Based on the data collected, supervised machine learning has been shown to be effective in forecasting batting shot execution in an unlabelled data set. The performance of a machine learning model was analysed using multiple methods and F-score shown to be the most appropriate based on its ability to detect missed shots and false alarms. The prediction performance was affected by many factors such as the type of the classifier, the segmentation technique, size of the sliding window, extracted features, and the volume of data available for training and validation. Therefore, it can be concluded that the cricket batting experimental protocol described here has been shown to be effective in forecasting when a batting shot execution takes place in a cricket batting cycle and is recommended for use in future studies in cricket batting such as performance evaluation, talent identification, injury surveillance, and prevention where real-world representation of cricket batting movement data are important.


