1. Introduction
Drag,
FD, is the force acting in the direction opposing the ball’s trajectory. Lift,
FL, is the force acting perpendicular to the ball’s trajectory [
1]. The drag and lift coefficients,
CD and
CL, are defined by
where
is the density of air,
A is the cross-sectional area of the ball and
V is the speed of the ball [
1]. The cause of the drag force on the ball is related to flow separation from its surface. The drag on a baseball is important to understand when describing long trajectories, such as home runs. Small changes in drag result in large differences in carry distances [
2]. For baseballs, the seams are large, and influence drag and airflow around the ball. Previous studies have found that the drag coefficient of a baseball is not constant, but depends on the seam orientation [
3].
A baseball has two primary components of spin: transverse spin (known as back spin or top spin) and parallel spin (known as gyro spin) [
4]. In this study, two spin axes, back and gyro, and two seam orientations, two-seam and four-seam, were compared (as shown in
Figure 1).
Due to the difficulties of projecting baseballs with gyro spin, few studies have measured the drag and lift coefficient from this spin axis. Yokoyama measured the drag coefficient of gyro spinning baseballs by recording the ball’s trajectory using high-speed cameras [
5]. Himeno compared CFD (Computational fluid dynamics) to a trajectory tracking method to calculate the drag coefficient of a gyro spinning baseball, but did not find good agreement between the two methods [
6]. Nagami used high speed video to track pitches and describe the relationship between lift and spin for different pitch types [
7]. Previous aerodynamic studies have shown that the drag coefficient of a baseball is correlated with seam height [
8]. However, the spin axis was not considered in this work, preventing evaluation of gyro spin.
The aim of this study was twofold: firstly, to measure the drag and lift coefficients of baseballs with different spin orientations in still air; secondly, to characterize the dependence of the seam orientation and spin axis of baseballs on the drag coefficient.
2. Method
This study considered nine MLB baseballs. Each ball was projected with four spin and seam orientations: four-seam back spin, two-seam back spin, four-seam gyro spin and two-seam gyro spin. The drag coefficient was found and compared between each orientation at the same speed and spin rate.
A bespoke, non-wheeled pitching machine was used to project the baseball at the target speed and spin rate without damaging the surface of the ball (shown in
Figure 2). To impart back spin, a flexible tip [
9] was coupled to a pneumatic linear accelerator. High and low friction materials were attached to opposite sides of the tip to generate torque about the center of the ball. Spin was controlled by changing the length and compressive force of the tip on the ball. A separate mechanical link was used to impart gyro spin which applied a torque parallel to the ball trajectory axis, using a tip with equal friction on both sides.
Ball speed and location were measured at three locations
along the flight path, as shown in
Figure 3.
Sensors measured speed from successive pairs (0.41 m apart) of light gates
(Ibeam, ADC). The distance,
d, between the first and third speed sensors
was 8.95 m, while the heights were within 0.025m of each other. Sensors were
placed to maximize the distance between them, while minimizing the change in
trajectory angle (the vertical component of velocity was 1.34 m/s or less) with
respect to the horizontal plane. The ball’s vertical location was measured at
each speed sensor and used to calculate the lift force. A high speed video
camera (Phantom V711 at 2000 fps) was used to record each shot to verify spin
rate, spin axis, and seam orientation. The drag force was
found from
where
V1 and
V3
were the speeds at the first and third sensors, respectively, and
m was
the ball mass. The lift force was found from
where
was the vertical change in ball position between the second and third speed sensors,
was the vertical velocity at the second speed sensor,
was the time for the ball to travel from the second speed sensor to the third speed sensor, and
was gravitational acceleration. The vertical component of velocity at the second sensor,
, was calculated from the known speeds and locations at all three sensors. Details of the lift and drag measurements may be found elsewhere [
10].
The surface profile of the baseballs was measured with a non-contact laser profiler (as shown in
Figure 4). Seam height was taken from the difference of the ball peak radius at the seam and the radius of the panel adjacent to the seam. For each ball, seam height was taken from the average of 32 measurements.
3. Calibration and Uncertainty
The coefficient of lift and drag were calibrated daily, prior to testing. The speed and spin rate of the calibration shots were the same as those used for the test balls. To calibrate drag, a smooth sphere (diameter = 7.59 cm) and a dimpled ball (diameter = 7.18 cm) were projected through the system at the start of each test day. The drag measuring system was considered calibrated when the average CD of three shots was within of its known value. To calibrate lift, a setup baseball was projected with a vertical spin axis to eliminate the Magnus effect in the vertical direction. Lift was considered calibrated when the average CL from three consecutive shots was .
The precision of the speed sensor was 0.025% of the measured speed. Accordingly, the uncertainty of CD and CL for a baseball were 0.003 and 0.0005, respectively. Other factors can affect the uncertainty of the drag and lift measurement, including the error from air properties and position measurement. Random error was analyzed by measuring the variance of 480 balls at 35.7 m/s. Each ball–speed combination consisted of four repeat shots. The average standard deviation of the drag and lift coefficient was 0.007 for a baseball traveling at 35.7 m/s with 2500 rpm.
4. Results
Each baseball was projected at a speed of 35.8 ± 0.9m/s, and a spin rate at 1500 ± 250 rpm. The lift and drag coefficient of each orientation for each ball was calculated from the average of four repeat shots.
4.1. Drag
The average drag coefficient of all nine baseballs was measured to compare the difference between the spin orientations. As is shown in
Figure 5, balls with a two-seam gyro spin showed the lowest average drag, with
CD = 0.29. Balls with a four-seam gyro spin showed the highest average drag, with
CD = 0.37. Balls with a four-seam and two-seam back spin had
CD = 0.33 and
CD = 0.32, respectively. These results indicate that the drag coefficient was sensitive to the ball orientation for gyro spin, but not for back spin.
4.2. Lift
The average lift coefficient of the nine baseballs was measured to compare the difference between the spin orientations. As is shown in
Figure 5, the two-seam and four-seam gyro spin had negligible Magnus force, where the average lift in the gyro orientations were 0.01 and −0.01, respectively. This was expected and agrees with other work [
11]. The lift coefficient for the two-seam and four-seam back spin was 0.17 and 0.18, respectively. These results agreed with the lift coefficients from a previous study involving MLB (Major League Baseball) baseballs [
12].
4.3. Seam Height
A dependence was observed between the seam height and the drag coefficient of back spinning baseballs (
Figure 6). The strongest correlation was observed for baseballs with a four-seam back spin, with
R2 = 0.72. For baseballs with a two-seam back spin,
R2 = 0.51. The drag on baseballs with gyro spin showed little correlation with seam height, where R
2 < 0.1.
5. Discussion
A strong correlation between seam height and the drag coefficient was observed for back spin, but not for gyro spin. For back spin, a high seam will have a greater influence on the separation point (as it passes through the flow separation region) than a low seam, giving rise to a sensitivity of drag to seam height. For gyro spin, the seam is always in the separation region, so the separation point will be fixed for high and low seam balls, giving rise to a low sensitivity of drag to seam height.
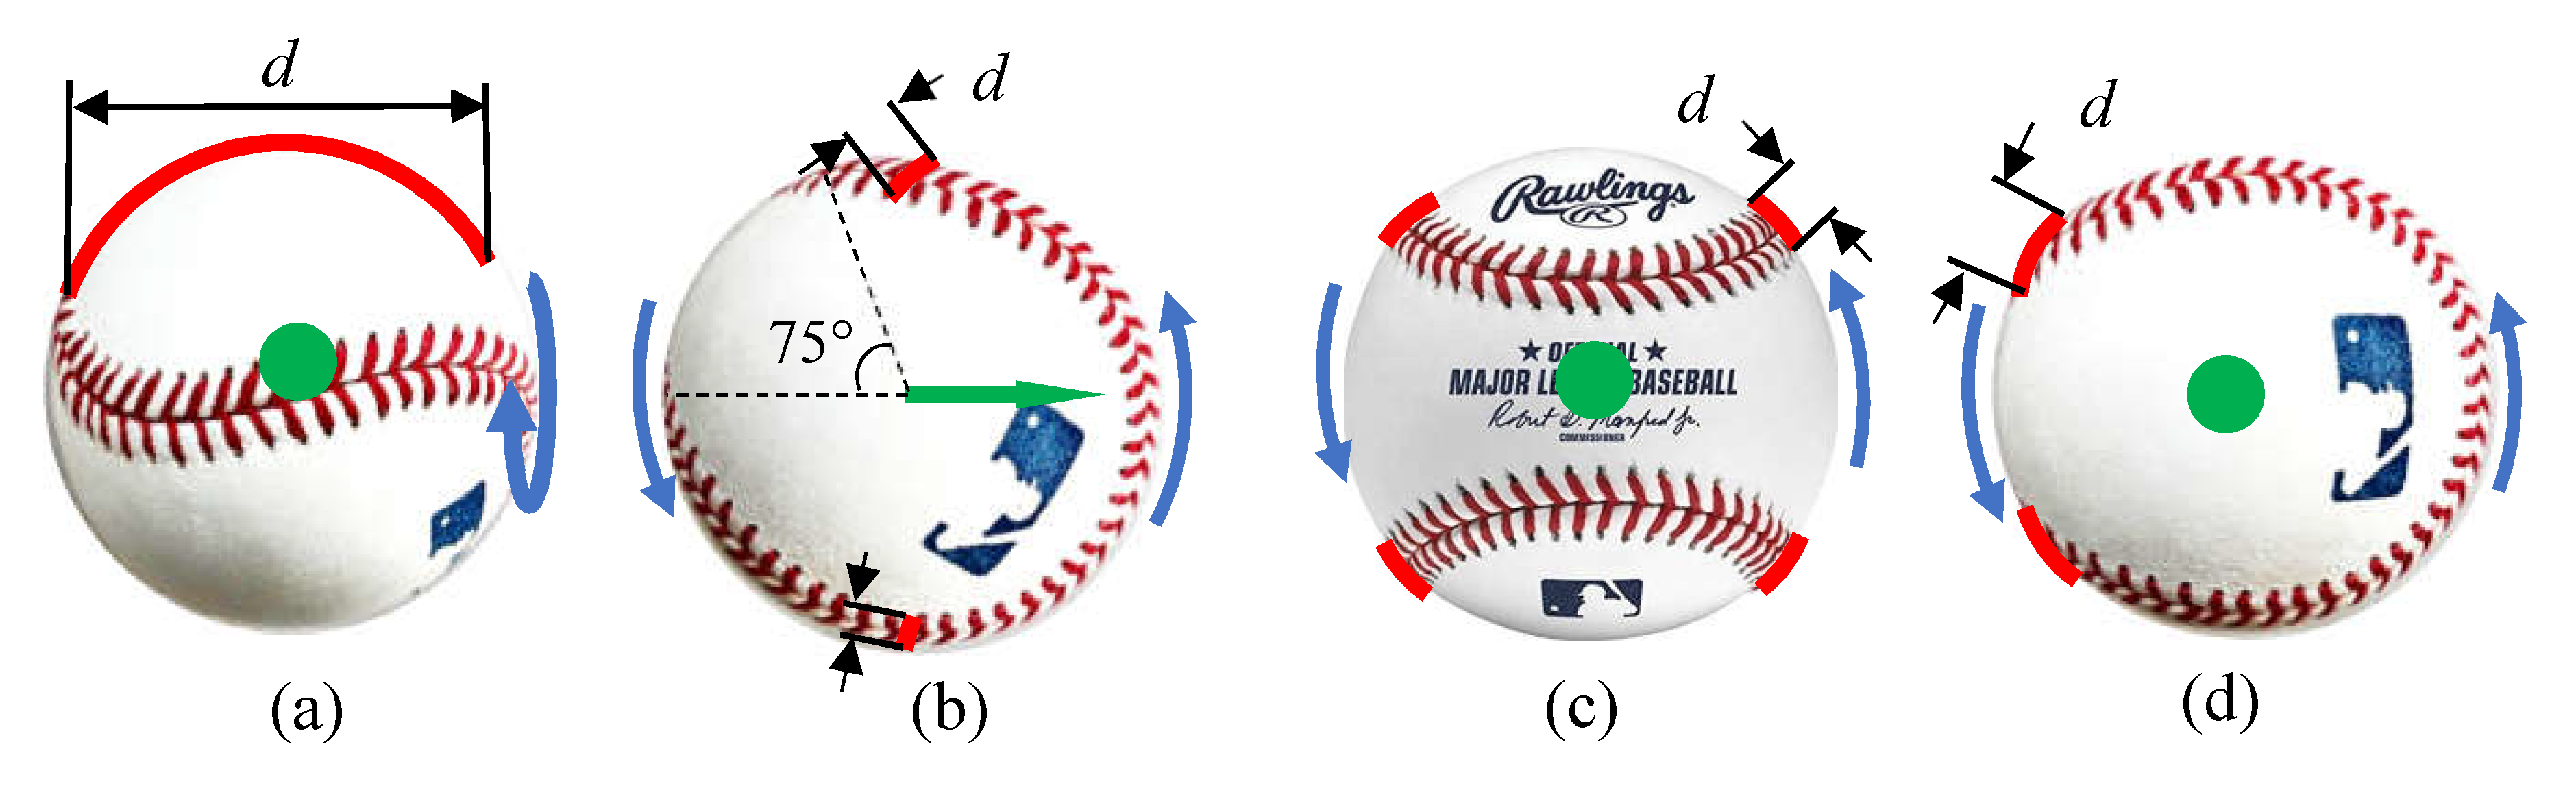
The air flow velocity is highest near the ball surface furthest from the spinning axis; in the following, this will be referred to as the max flow air. The baseball will have a higher drag coefficient when more seams are exposed to the max flow air. A seam exposure index (
Se) can be defined from the amount of seam exposed to max flow air for each spin orientation as
where
d is the length of each seam exposed to the max flow,
n is the number of the seams and
t is the ratio of time for which each seam is exposed for each spin revolution.
The seam exposure index for each orientation is listed in
Table 1. For the four-seam back spin, as shown in
Figure 7a, the length of the exposed seam is highlighted by red lines. Each seam is exposed twice (one on the top, one on the bottom) during each revolution. For the two-seam back spin, as shown in
Figure 7b, the length of the exposed seam is the width of the seams. When the baseball is spinning in this orientation, about
of the max flow air region does not have a seam. When that region is on the top or bottom, n = 2. Otherwise, n = 4. For the four-seam and two-seam gyro spin, as shown in
Figure 7c, d, the length of the exposed seam is the width of the seams.
Figure 8 compares the drag coefficient and seam exposure index for each orientation. A strong correlation was observed between
Se and the average drag coefficient for each spin orientation. The results show that the location of the seam in the airflow plays an important role in understanding its effects on drag.
6. Conclusions
This study considered the lift and drag measurement of baseballs in four different spin orientations. The study found a strong correlation between seam height and the coefficient of drag for balls in the back spin orientation, where drag increased with seam height. A correlation between drag and seam height was not observed for the baseballs with gyro spin, suggesting seam height alone does not influence drag. A new parameter, Se, was defined, which showed that, as more seams are exposed to the max flow air, the drag coefficient increases. The highest and lowest drag coefficients found here were in the four-seam and two-seam gyro spin orientations, respectively. The lift coefficient was also measured, and supported other findings where lift was the greatest in backspin and negligible for gyro spin.


