1. Introduction
As a global trend, the use of artificial surfaces is increasing in many sports that have been traditionally played on natural grass, such as soccer and rugby. For soccer, since the introduction of third generation artificial turf (3-g turf), a number of international and national games and tournaments have been played on these surfaces. In addition, there is another growing trend among elite soccer and rugby clubs to install a hybrid type of natural turf system, in which natural turf is reinforced by artificial fibers (hybrid turf) [
1]. However, the science of the behavior of these turfs has been under-researched, to date [
2].
It is often assumed that specific sports injuries are a direct consequence of surface hardness [
3,
4]. Thus, cushioning ability is, without doubt, considered as one of the most important properties for relevant sports surfaces [
5]. From a human safety perspective, the shock absorbing properties of sports surfaces need to be tested in conditions that represent excessive, severe landing scenarios. Thus, a test which can reproduce a more realistic severe human impact condition is highly beneficial. To date, several papers have focused on shock absorbency of 3-g turf, natural turf and hybrid turf [
6,
7,
8]. However, these turfs were tested in substantially lower loading conditions that only correspond to approximately 1/4 the magnitude of actual human hard landings (2.63 kN vs. 12.10 kN) [
9]. Recently, the differences in shock absorbency among natural and 3-g turfs were quantified in a high loading condition reproduced by a newly developed testing rig [
9,
10]. The rig can be used in a wide range of applications in assessing the shock absorbency of turf-like sports surfaces, even in outdoor conditions like turfs in a soccer stadium and/or 3-g turf grounds used for many years.
Various methods are available to evaluate shock absorbency with stress-strain cycles being one of the most relevant variables to illustrate its characteristics. However, to date, no study has directly compared high-loading shock absorbency between natural, hybrid and 3-g turfs. We aimed to 1) quantify and compare the stress-strain properties of natural and hybrid turfs in varied conditions and 3-g turfs with various infill components, and 2) illustrate aged deterioration of the stress-strain property through a comparison between fresh 3-g turf and an aged 3-g turf with the same infill component.
2. Method
2.1. Testing Rig
A bespoke high-load testing rig designed to reproduce peak magnitudes during severe human landing conditions that likely occur during a football match, was used [
9,
10]. The average (±SD) peak force magnitude produced by this test on the most standard type of 3-g turf with sand/rubber four layered infill of 35 mm thickness was 12.30 ± 0.24 kN, which was within the range of those readings observed in human severe landings (12.10 ± 1.61 kN) [
9]. The rig consisted of an inverse steel pendulum system with a ball-bearing axis. In this test, the impact head was gently released by hand from the pendulum’s topmost position (688 mm height) with its downward motion controlled by gravity. The bottom edge of the impact head was aligned, therefore at the point of impact it produced a flat and wide contact area with the surface (8 × 8 cm). An accelerometer (AS200HA, Kyowa Electronic Instruments Ltd., Chofu, Tokyo, Japan) was attached on the impact head center to measure acceleration during the impact to allow for comparison between the surfaces. To measure loaded deformation from the surface of interest, the testing rig was modified by installing an angle potentiometer (CPP-45B (1 kΩ), MIDORI PRECISIONS Inc., Hamura, Tokyo, Japan) into the axis of the impact arm [
10]. From the change of angle measured by the angle potentiometer, surface deformation was obtained as the product of the length of the impact arm and the change of the angle during impact. From these data, quasi stress-strain curves (qSS curve) were computed as the relationship between acceleration (g) and strain (mm). The initial surface contact was defined as the moment when the upward acceleration exceeded 1 g (9.81 m/s
2), and the end of contact was defined when the upward acceleration was less than 1 g.
2.2. Testing Samples
Tests were conducted on nine different surfaces: a sand base natural turf having daily professional maintenance, used for the top professional league matches and chosen as the best pitch in the league in the year of measurement (N-pro); one sand base natural turf grown in a specially made test field (N-non) without daily maintenance; one sod base natural turf professionally maintained in a sub field of a stadium (N-sub); two types of hybrid turf, one sand base hybrid turf grown in the test field without daily maintenance (H-non) and one sod base hybrid turf professionally maintained in the sub field of a stadium (H-sub); three types of 3-g artificial turf housed in trays (90 × 90 cm), with the same pile texture (62 mm length polyethylene) and with a sand infill of 35 mm thickness (A-sand), a sand/rubber infill of 35 mm thickness (A-sand/rubber) and a rubber infill of 35 mm thickness (A-rubber); and an eight year old 3-g turf field initially designed to have the same pile texture and infill component of A-sand/rubber (A-aged). This artificial turf field has been regularly used in university physical education classes and multiple amateur sports club activities for eight years. For turfs in the stadium, the sub field and the university field, the test was conducted on five different sampling locations used previously for natural turf quality testing. For turfs in the test field and artificial turf samples, the test was repeated five times at different un-touched, “fresh” sections.
2.3. Data Acquisition
The raw, unsmoothed analog data output from the accelerometer and the angle potentiometer were simultaneously obtained through an analog/digital data conversion system (PowerLab, ADInstruments Ltd., Dunedin, New Zealand), sampling at 10 kHz and stored in a laptop computer. Data were smoothed using a 200 Hz fourth order Butterworth filter with the cut-off frequency determined from the frequency profile of the acceleration signal identified using fast Fourier transform (FFT) analysis.
2.4. Statistics
As each variable was normally distributed, one-way analysis of variance (ANOVA) with repeated measures was used for comparisons and statistical significance was set at p < 0.05. The Dunnett test for multiple comparisons using the N-stadium as the first condition was used for post-hoc testing, when the ANOVA returned a significant result.
3. Result
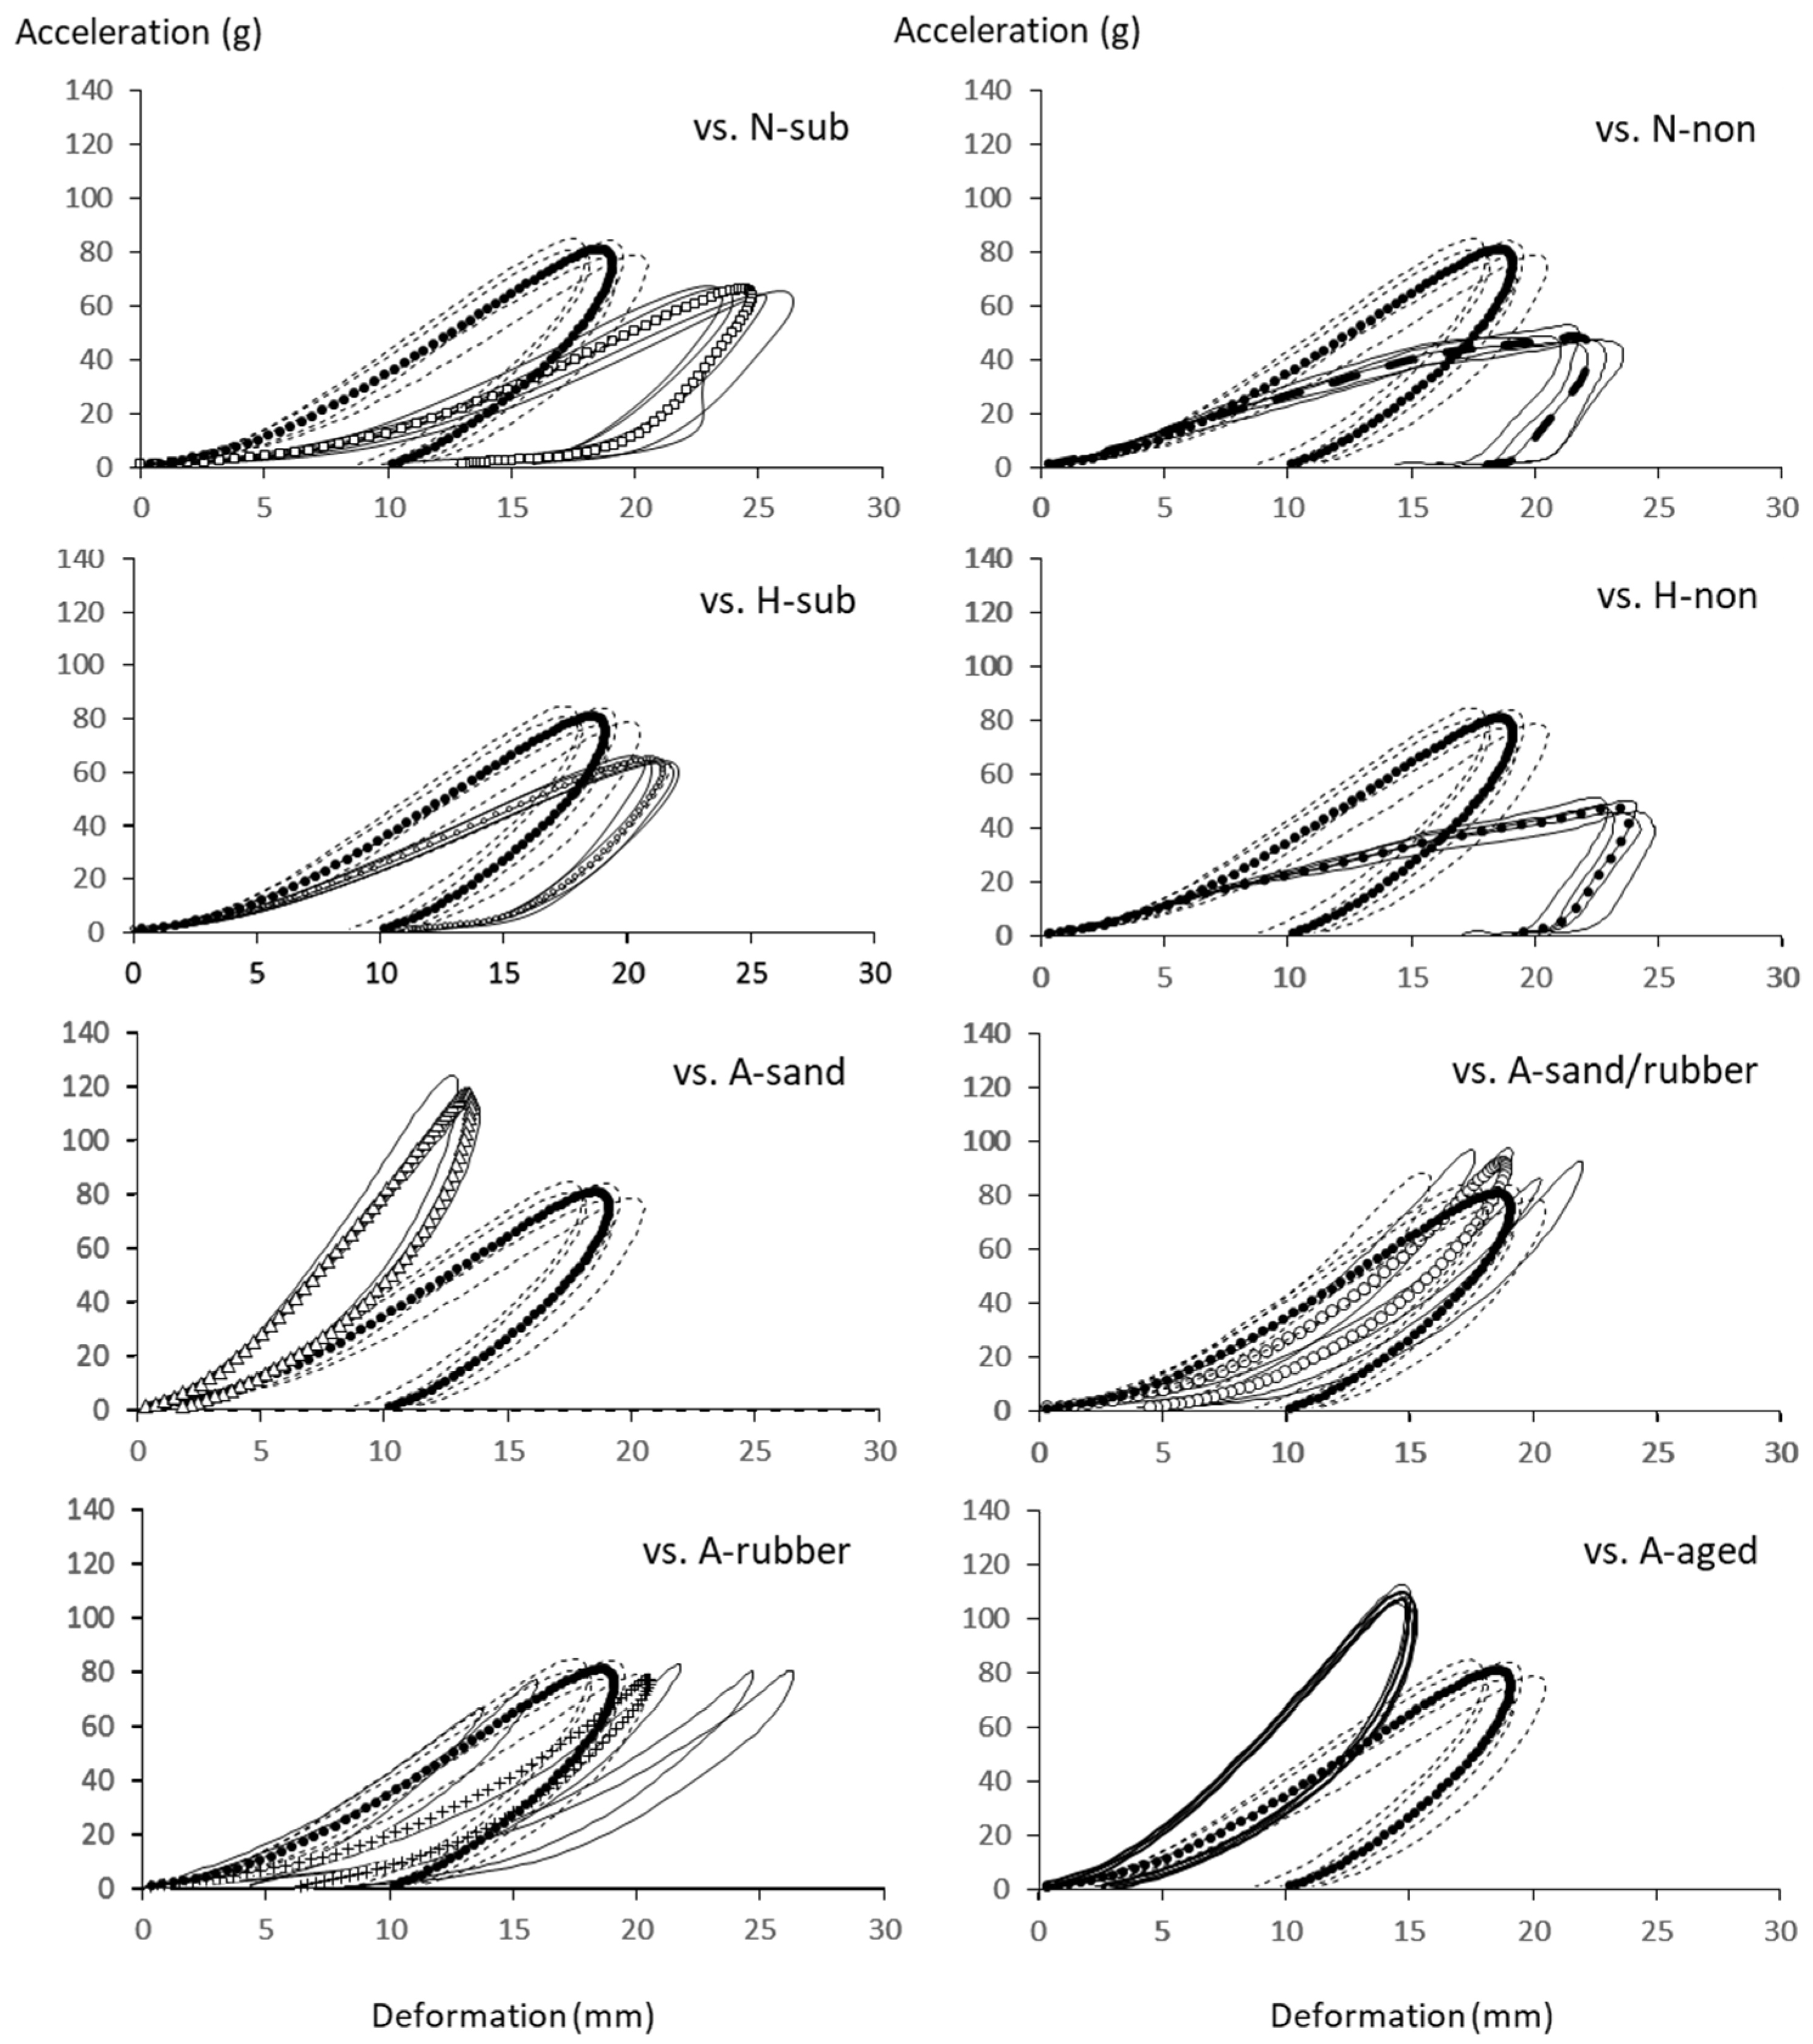
The average qSS curves of N-pro were compared with eight different types of turf (
Figure 1). The curve of N-pro was apparently distinguishable from other surfaces: N-non, N-sub, H-non, H-sub, A-sand and A-aged except for A-sand/rubber and A-rubber. Selected discrete variables of all turfs including peak accelerations, peak deformations, remaining plastic deformation after impact, area of hysteresis and average gradient of qSS curves were graphically compared with N-pro (
Figure 2).
For peak acceleration (g), A-rubber (77.6 ± 6.3 g) was the only one turf that showed a comparable peak acceleration to that of N-pro (81.1 ± 3.2 g). The other artificial turfs, A-sand (117.3 ± 4.0), A-aged (108.6 ± 2.7 g) and A-sand/rubber (92.5 ± 5.0 g) were characterized by significantly higher peak accelerations compared to N-pro, while those of N-sub (66.3 ± 1.4 g), N-non (48.6 ± 2.6 g), H-sub (64.9 ± 0.9 g) and H-non (48.4 ± 2.4 g) were significantly smaller.
For peak deformations (mm), the values of N-sub (24.8 ± 1.1 mm) and H-non (23.9 ± 0.8 mm) were significantly larger than that of N-pro (19.1 ± 1.0 mm) while the values of N-non (22.3 ± 1.0 mm), H-sub (21.5 ± 0.6 mm), A-sand/rubber (19.0 ± 2.4 mm) and A-rubber (20.5 ± 5.4 mm) were not significantly different to N-pro due to apparently larger variations. In contrast, A-sand (13.5 ± 0.3 mm) and A-aged (15.1 ± 0.1 mm) showed a significantly smaller value than that of N-pro.
Consistent trends were observed for the plastic deformations (mm) and area of hysteresis (g·mm), and all three artificial turfs including A-sand/rubber (4.5 ± 0.5 mm; 197.0 ± 13.0 g·mm), A-sand (1.8 ± 0.5 mm; 260.8 ± 18.7 g·mm), A-aged (4.5 ± 0.5 mm; 356.7 ± 18.4 g·mm) and A-rubber (2.7 ± 0.3 mm; 190.0 ± 41.5 g·mm) showed significantly smaller plastic deformations and area of hysteresis than those of N-pro (10.2 ± 1.0 mm; 197.0 ± 13.0 g·mm). In contrast, N-non (16.9 ± 1.9 mm; 543.5 ± 9.2 g·mm) and H-non (19.1 ± 1.4 mm; 538.8 ± 7.3 g·mm) consistently showed significantly larger values than those of N-pro. One inconsistency was found for N-sub: although its plastic deformation was significantly larger than that of N-pro (13.0 ± 2.2 vs. 10.2 ± 1.0 mm), there was no significant difference in the area of hysteresis between the values of N-sub and N-pro (431.2 ± 49.1 vs. 429.1 ± 15.4 g·mm). H-sub (11.1 ± 0.4 mm; 452.3 ± 11.4 g·mm) was the only turf that showed no significant differences for these two variables compared to those of N-pro.
For the gradient (g/mm), all natural and hybrid turfs: N-sub (2.7 ± 0.2 g/mm), N-non (2.3 ± 0.2 g/mm), H-sub (3.1 ± 0.1 g/mm) and H-non (2.1 ± 0.1 g/mm) showed significantly smaller values than that of N-pro (4.4 ± 0.4 g/mm), while A-sand (8.8 ± 0.5 g/mm) and A-aged (7.4 ± 0.2 g/mm) showed significantly larger values than that of N-pro (4.4 ± 0.4 g/mm). The values of A-sand/rubber (5.0 ± 0.7 g/mm) and A-rubber (4.0 ± 0.9 g/mm) were comparable to that of N-pro.
4. Discussion
In the present study, quasi stress-strain properties among selected natural hybrid turfs in varied conditions, 3-g turfs with various infill components and an aged 3-g turf were demonstrated.
4.1. A Natural Turf vs. Natural Turfs
It was highlighted that there are substantial differences in properties between natural turfs (N-pro vs. N-sub & N-non). Compared to N-pro, N-non showed significantly smaller peak accelerations, larger plastic deformations, larger areas of hysteresis and smaller gradients. This might have been due to maintenance work and/or different base compositions. Soil compacting has been found to be an influential factor to increase peak deceleration of impacting hammers and decrease turf deformations [
11]. The present finding supported this previous finding by highlighting clear differences in qSS curves between professionally maintained natural turf and natural turfs in situ, thereby suggesting regular professional maintenance, such as compacting sod, has a substantial impact on the stress-strain property of natural turfs. The difference might also, in some part, be influenced by the composition of turf base (sand vs. sod). Although both N-pro (sand base) and N-sub (sod base) were regularly maintained, their properties are clearly different in many aspects, suggesting the base composition of natural turf also has significant impact on its shock absorbency.
4.2. A natural Turf vs. Hybrid Turfs
A hybrid type of natural turf (hybrid turf), which reinforces the sod with synthetic fibers, is gaining in popularity in elite levels of soccer [
1]. Nowadays, some players and managers have accused this type of hybrid pitch of being too hard and thus contributing to player injuries [
12]. To examine the effect of reinforced fibers on qSS curves, the curves and discrete variables of H-sub and H-non were compared with those of N-sub and N-non, respectively, as post-hoc comparison because these two pairs (H-sub vs. N-sub and H-non vs. N-non) have an identical sod composition and status of regular maintenance. It is interesting to note that the post-hoc analysis revealed there were no significant differences between natural and hybrid turfs without regular maintenance (H-non vs. N-non), however, hybrid turfs with regular maintenance (H-sub) had a significantly smaller peak deformation and a larger gradient of loading than those of N-sub. This finding supported the previous result that a stitched turf reinforce system makes natural turf harder [
8]. Further studies are warranted to determine how regular maintenance work affects the hardness of hybrid turf.
4.3. A Narutal turf vs. Artificial Turfs
Inconsistent deformations against certain loaded forces were observed in artificial turf (3-g turf) samples with most common types of infills (sand/rubber and rubber), suggesting players need to make some adjustments for their steps or actions by adjusting their own lower leg stiffness [
13] when they play on newer 3-g turf. This aspect of 3-g turf might help to explain why players’ perceptions are not consistent with the mechanical property of surfaces [
6,
14]. In addition, the eight-year-old 3-g turf (A-aged) was found to become substantially harder than newer 3-g turf with the same infills (A-sand/rubber), suggesting long-term usage compacted the infill, thereby showing very different but consistent qSS curves in the aged 3-g turf.
5. Conclusions
The four key findings from the present study include the following: (1) professionally maintained natural turf (N-pro) was found to have a significantly larger plastic deformation and area of hysteresis than those of artificial turfs; (2) stress-strain properties of N-pro were significantly different from a natural turf with a different base composition and a natural turf without maintenance, suggesting these factors likely have a substantial impact on the properties of natural turf; (3) little influence of polyethylene pile reinforcement was seen in a hybrid turf without regular maintenance while a hybrid turf with regular maintenance becomes rather stiffer by this reinforcement; and (4) artificial turf with conventional infill becomes substantially stiffer with aging.

