1. Introduction
Underwater acoustic monitoring is essential for the protection of the underwater environment. In recent years, different projects and technologies have been developed for this purpose. Regarding the Marine Strategy Framework Directive (MSFD), Descriptor 11 (D11) addresses the introduction of underwater noise and its effect on the marine environment. Furthermore, Descriptor 1 (D1) tackles biological diversity, including marine mammals whose relationship with underwater noise is relevant both to quantify its impact and to establish populations.
However, one of the main characteristics of the acoustic signal register compared to other environmental variables is its high sampling rate (of the order of tens of kilohertz). This is why the continuous monitoring of the marine environment results in large amounts of data.
Therefore, it is necessary that the recording systems incorporate processing and compression technologies that, on the one hand, optimize the information that is to be extracted from each measurement and, on the other, guarantee the sending of said information with the best efficiency. At this point, the information compression techniques applied to noise signals, whose experimental advance and contrast is the subject of this document, come into play.
In addition, the large wireless sensor networks have a very high consumption that is due, in large part, to the communication between sensors, since a lot of power is needed to transmit the data. Therefore, data compression is unavoidable because this reduces the power consumption and sends a greater amount of information [
1].
2. Compression Techniques
Information compression techniques have played a fundamental role due to their potential to minimize the storage space of information, as well as the necessary bandwidth for transmission between remote equipment. However, although there are numerous digital information compression methods today, only some take advantage of the particularities of typical audio signals, which are the relative short-term predictability and the high degree of redundancy.
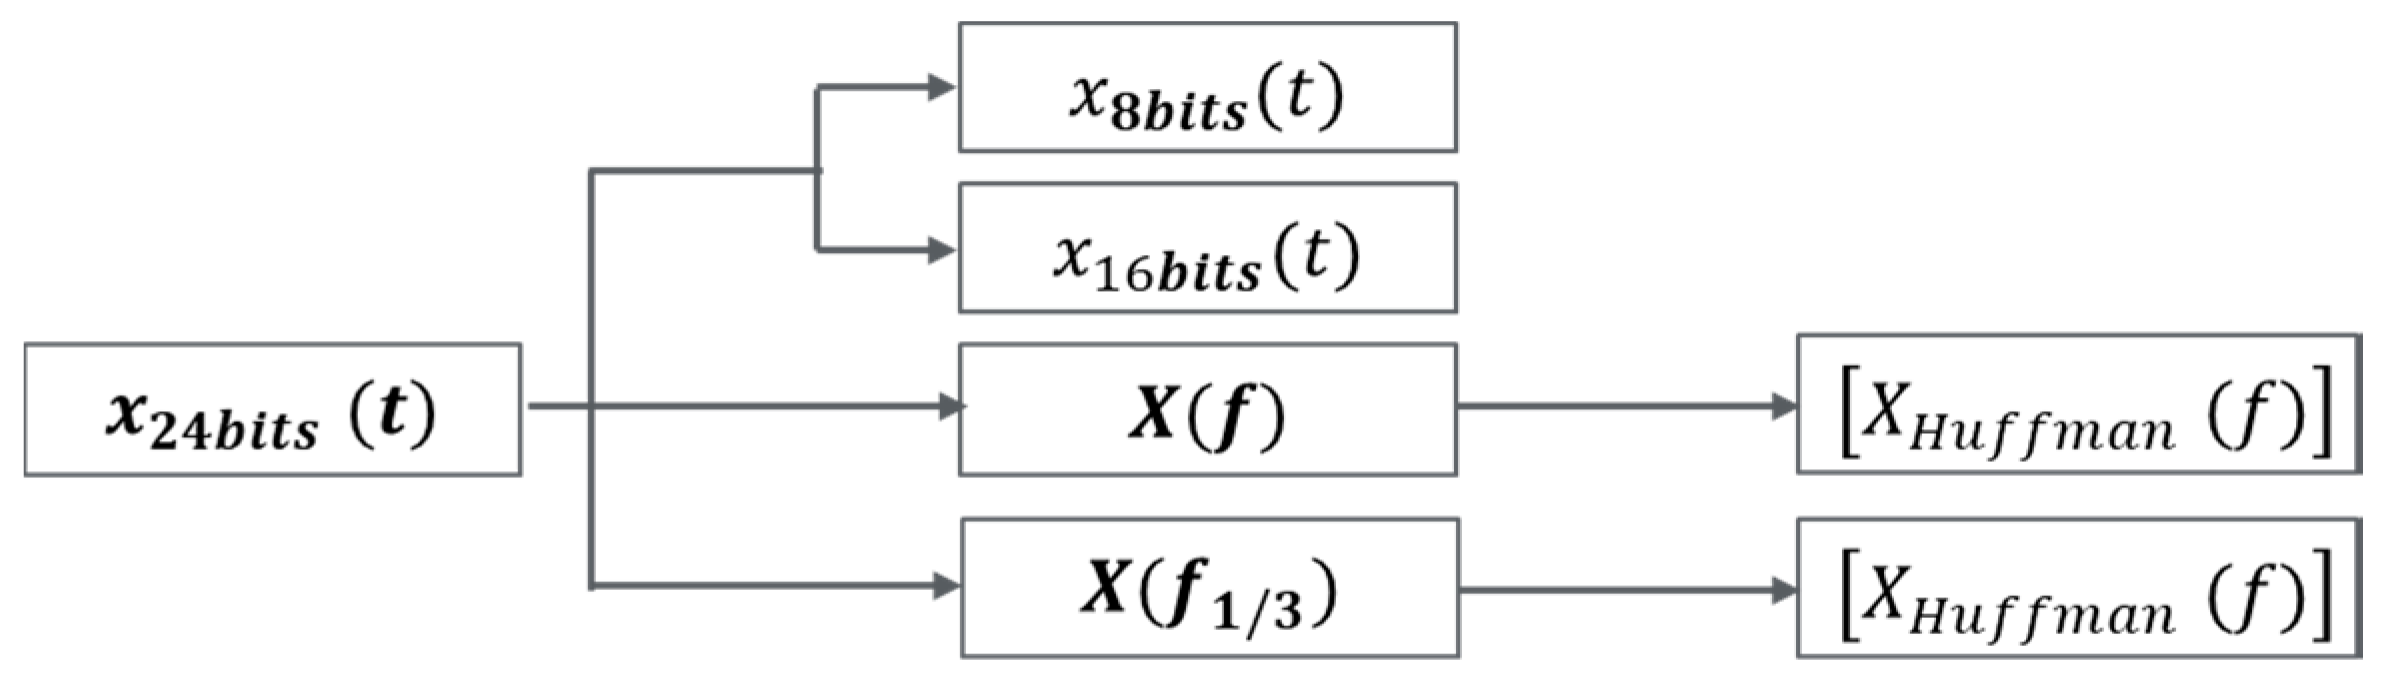
In the present study, as should in
Figure 1, these techniques have been implemented for the reduction of size in the information of underwater noise signals. The following scheme illustrates the relationship between the techniques studied below:
2.1. Bit-Depth Reduction
This consists of the reduction of the quantization bits of the signal. Once the signals were registered, the procedure consisted of decimating the samples between the maximum and the minimum of the signal in 8 and 16 bits, resulting in 28 and 216 samples. It should be noted that this is not a canonical resample bit-rate since, in this application, only the dynamic range of the registered signal was used, and not the entire dynamic range of the acquisition system.
2.2. Magnitude of the Frequency Spectrum
This consists of calculating the frequency spectrum of the signal through the Fast Fourier Transform [
2]. When obtaining the spectrum, two additional actions were carried out that allowed it to decrease in size:
Although the spectrum was composed of complex numbers for calculations related to amplitude, only its spectrum was used. With this, the angular information was lost but the amount of necessary information was reduced.
The calculation of the Fast Fourier Transform (FFT) produced a spectral spill, offering redundant information in half of the resulting spectrum. Therefore, this part can be deleted to reduce the number of data that represents it.
2.3. Spectrum of 1/3 Octave
This method consists of sending the spectral information contained in third octave bands of the original signal. This was one of the methods that most reduced the original signal at the cost of more skewed information.
2.4. Lossless Compressed Spectrum
For wireless communications and sensor networks, the most studied lossless data compression algorithms are the Huffman and Lempel–Ziv Welch (LZW) algorithms [
1,
2,
3]. In the present study, this was implemented in the Huffman algorithm for the compression of the spectrum of underwater noise data. Huffman coding allows—in a simple and optimal way—the mapping of each symbol of the alphabet with an optimal length code. To achieve this optimal assignment, the symbols were represented with codes whose length was inversely proportional to the probability of the symbol. In this way, the least likely symbols were represented with longer codes, and the most likely with shorter symbols.
The process of assigning codes was carried out by building a binary tree from the leaves to the root, so that the leaf nodes were the assigned symbols. In the construction of the tree, the less probable nodes joined successively to form another node of greater probability, so that each of the links added a bit to the code of the symbols that were joined. This process ended when only one node was available, so that it represented the root of the tree [
4,
5,
6,
7,
8]. A representative example of the process carried out from the recording of the noise signal to the assignment of codes and the construction of the decision tree is shown in
Figure 2.
As seen later, with this algorithm, a significant reduction in the size of the spectrum to be sent was achieved at the cost of a longer computational time.
3. Results
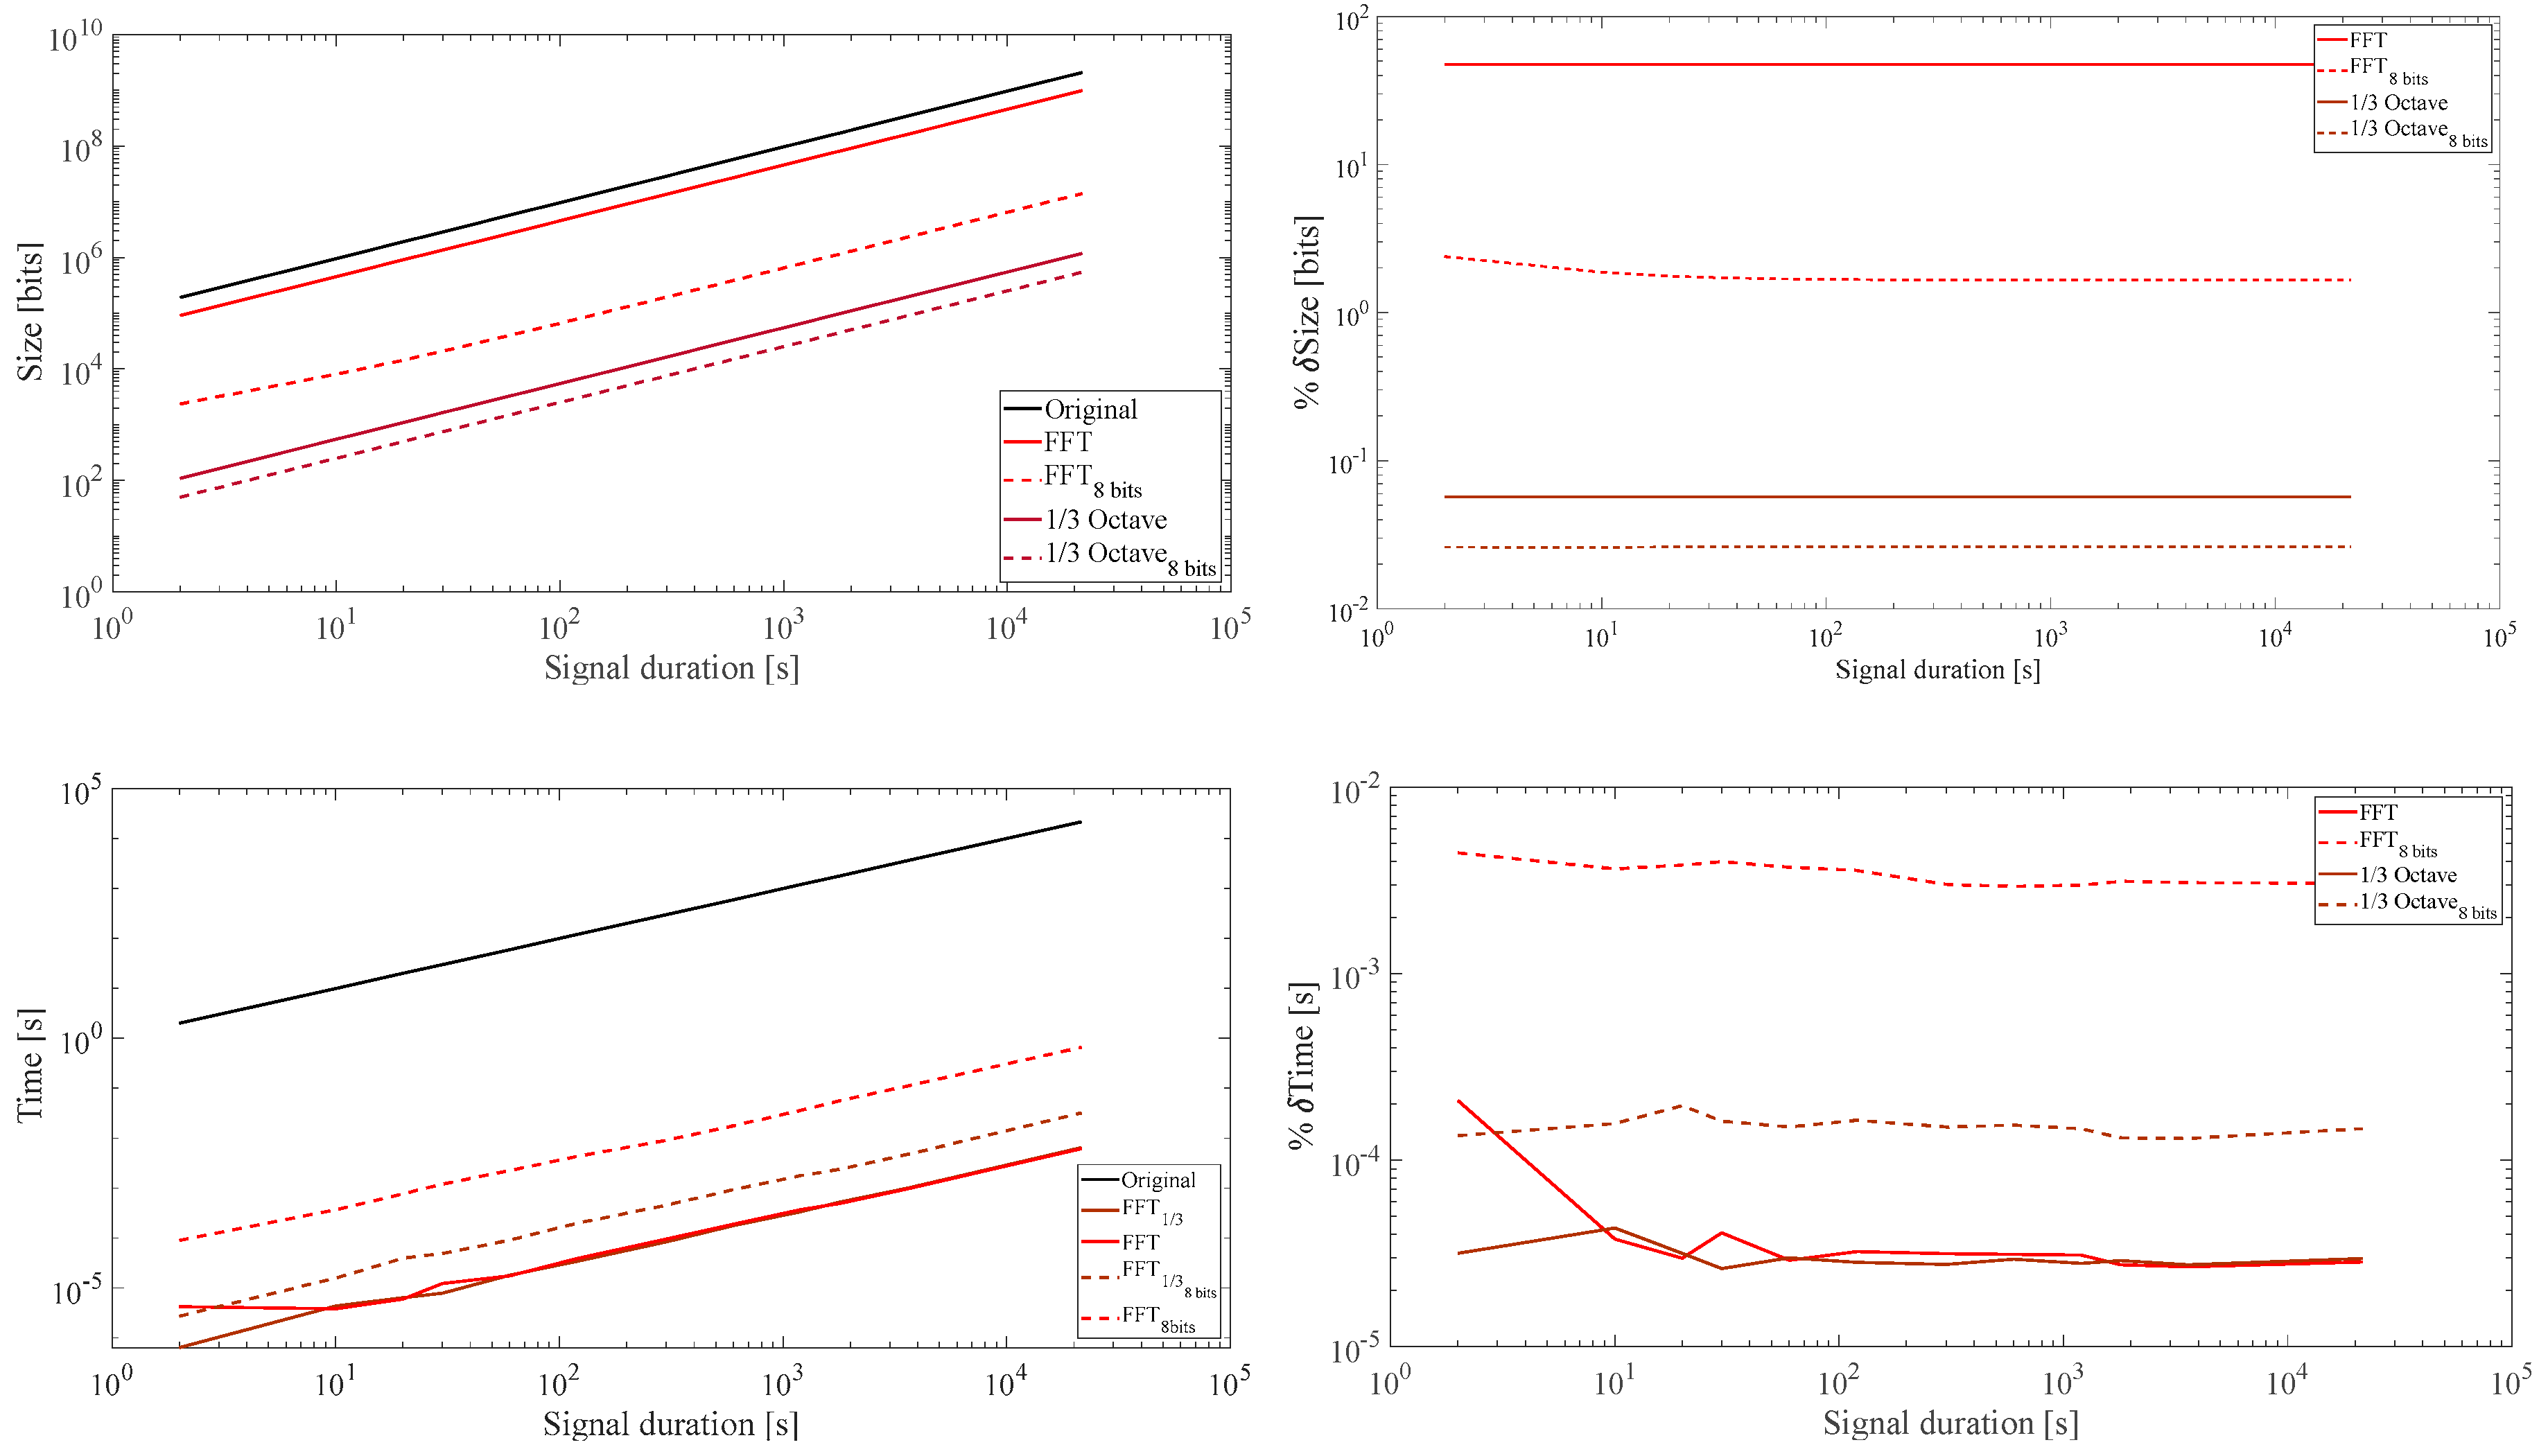
The application results of each of the prior techniques are shown below in terms of the resulting size of the data and the processing time. For each technique implemented, graphs are shown with the dependence on the original signal size of the following parameters:
Size (bits): data size after applying the technique (color line) and size of the original signals (black line).
δ Size (%): percentage ratio between the size of the data once the technique has been applied with respect to the original size.
Time: processing time of application of the technique in question (color line).
δ Time (%): percentage relationship between the processing time and that of the original signal.
In the first place, the following figure 3 shows the results of the bit-depth reduction technique. With respect to the size, it is observed that the signals were reduced to approximately 34% of the original size, except for durations of less than 10 s, where the reduction was somewhat larger (smaller size). With respect to the processing time, this was less than 1 s in all the analyzed signals, which was below 0.1% of the original signal time.
After this, the results of applying the frequency spectrum and spectrum of 1/3 octave are shown in the
Figure 4, without applying any additional compression. Regarding the size, by applying the frequency spectrum to the original signals, these were scarcely reduced, in contrast to applying the same method but to the signals converted into 8 bits, with which the reduction achieved was 1%. On the other hand, by applying the spectrum of 1/3 octave technique both to the original signals and to the signals converted into 8 bits, the reduction achieved was less than 2% and 0.03%, respectively. As for the processing time, regarding both techniques, the results were below 1 s in each case of study, being less than 10
−4% with respect to the original signal for the frequency spectrum and the spectrum of 1/3 octave technique, and being less than 10
−2% and 10
−3% for the signals converted to 8 bits due to this process.
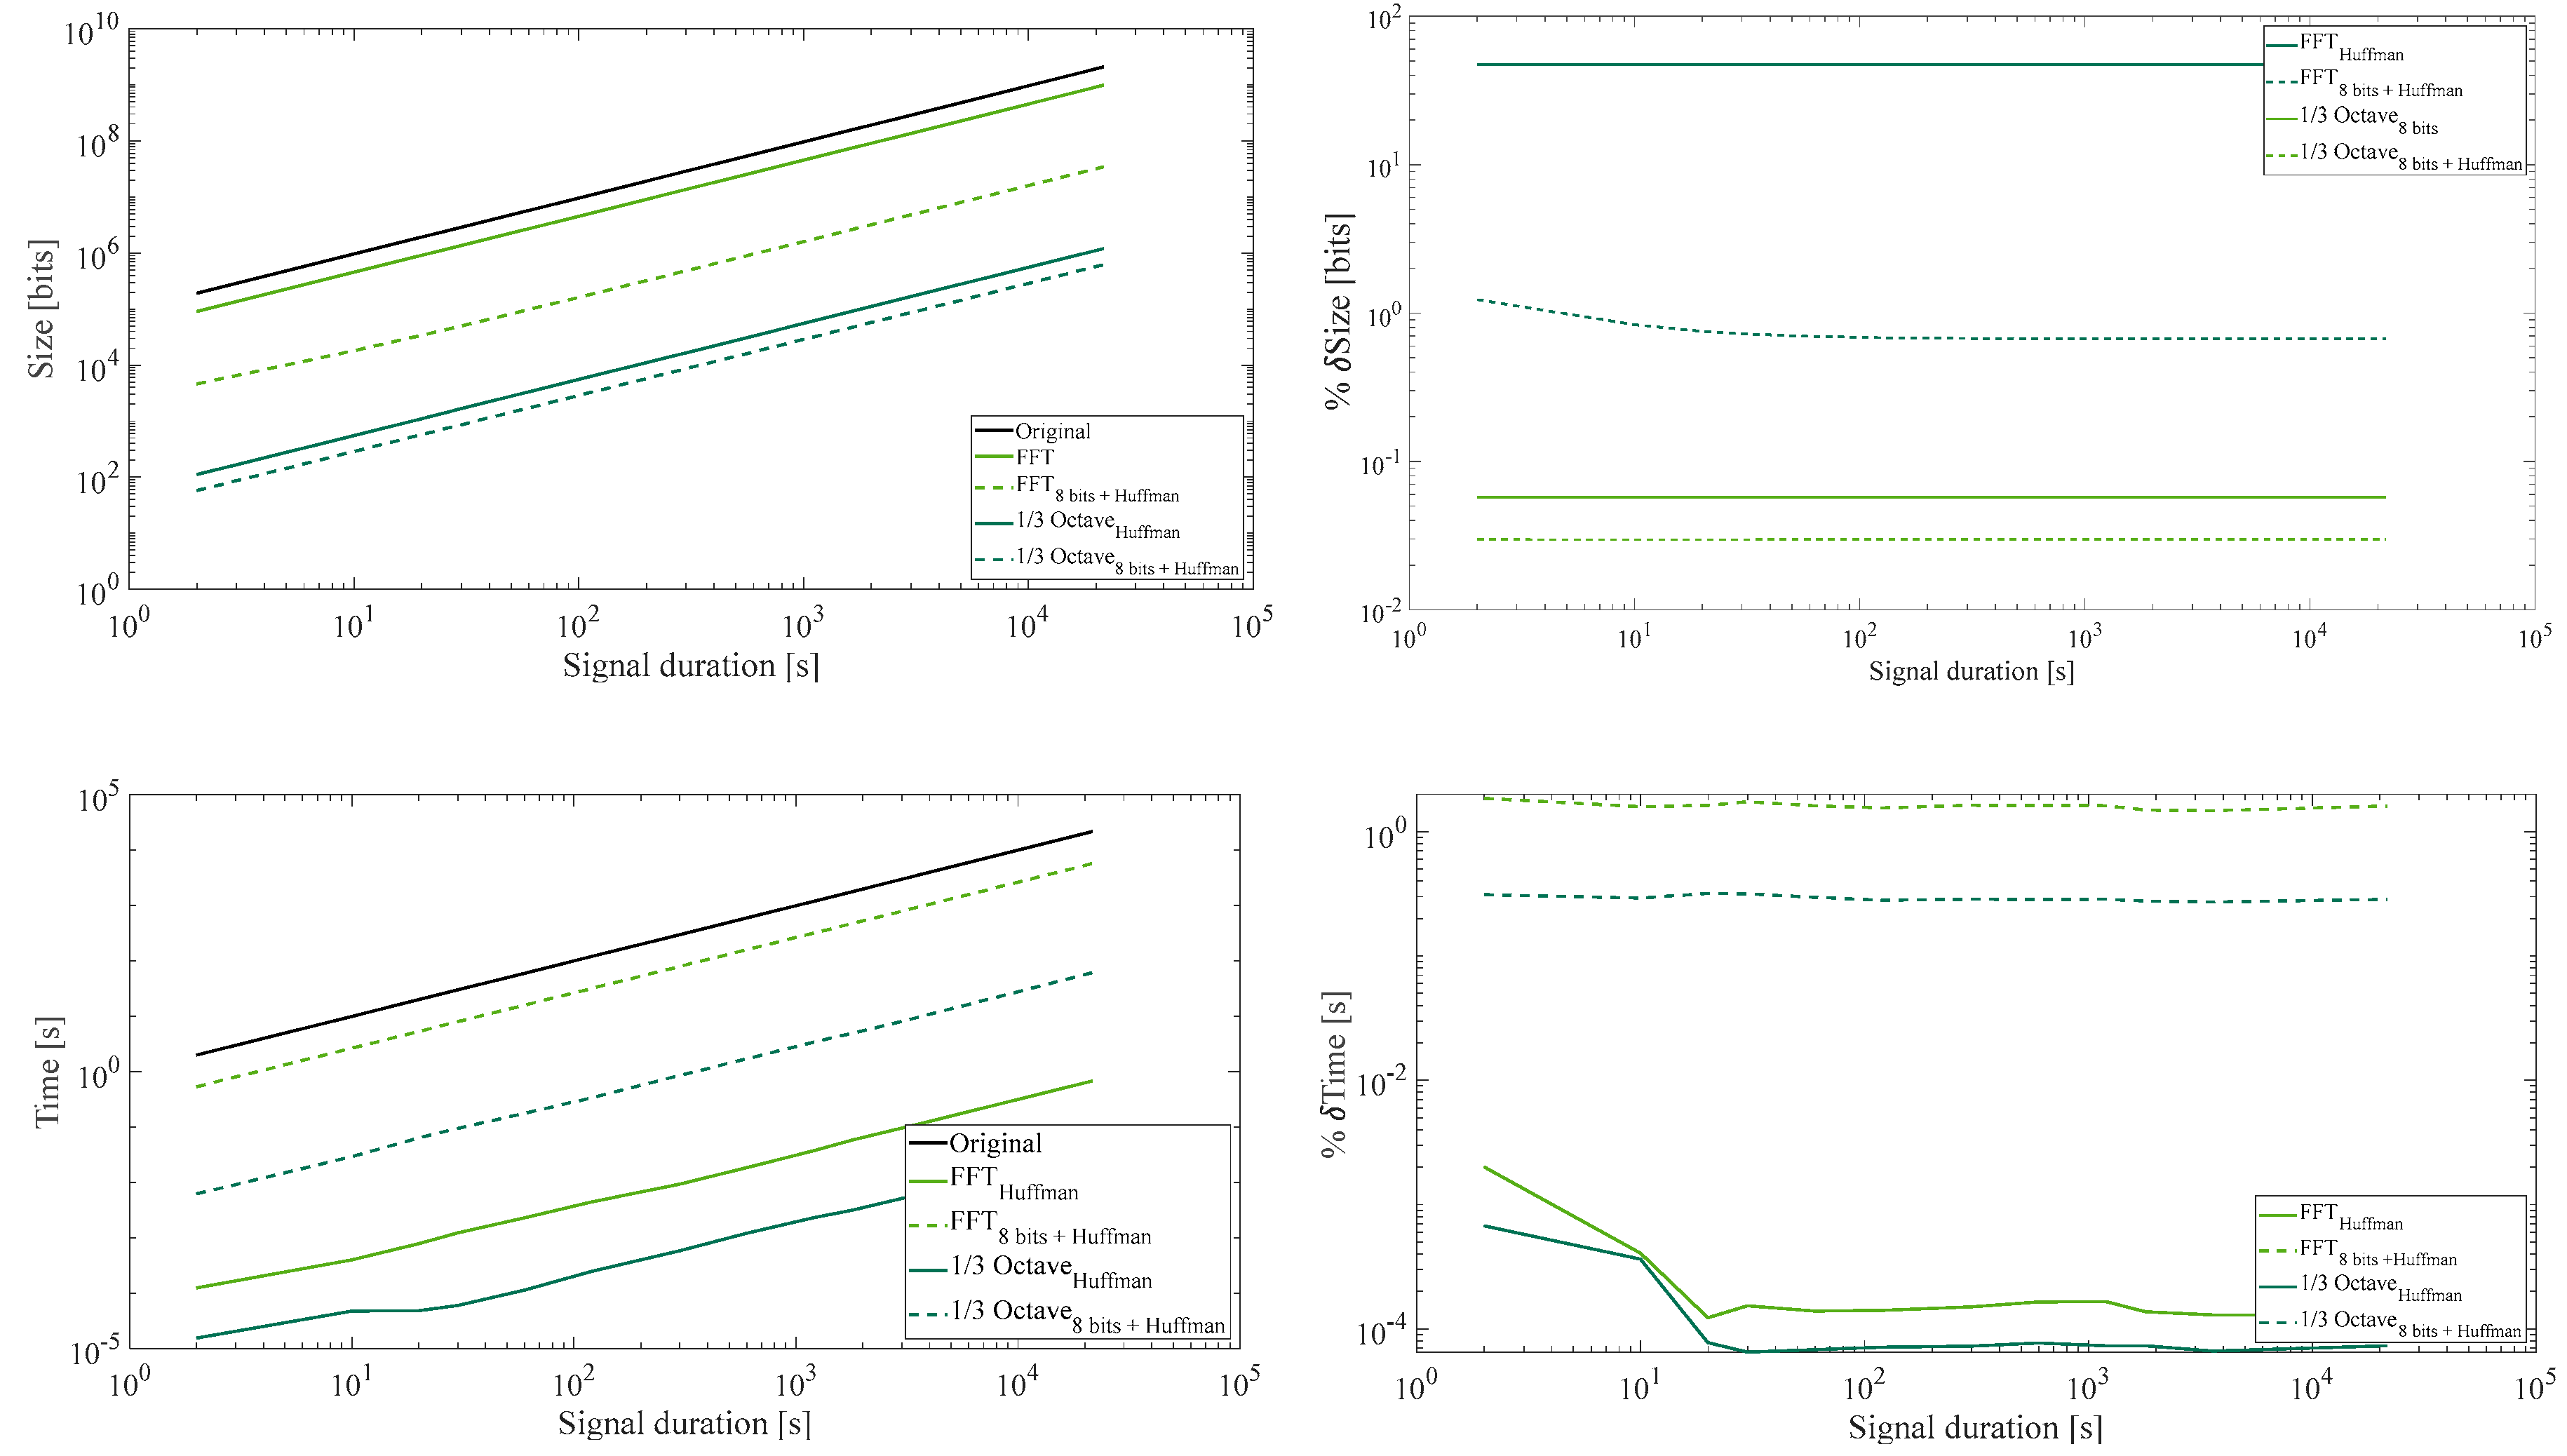
Applying the lossless compression of the Huffman technique to the previous processes, the results showed in
Figure 5 were obtained: in
Figure 5, it can be observed that regarding the size, the result achieved by applying Huffman to the frequency spectrum and the spectrum of 1/3 octave converted into 8 bits was 1% and 0.02%, respectively. Regarding the processing time, applying the compression algorithm to the frequency spectrum and the spectrum of 1/3 octave of the original signal, the processing time achieved was less than 10
−3%, while, when applying Huffman to the signal converted to 8 bits, the processing time was 2% for the frequency spectrum and 0.3% for the spectrum of 1/3 octave.
4. Conclusions
This
Table 1 shows the results of the different compression methods expressed in terms of the final percentage of size and calculation time with respect to the original signals. With respect to the FFT, its obtained size was up to 1% with respect to the original signal, with a processing time of 2%. Considering the 1/3 octave, a reduction of 0.02 was obtained with a procession time of 0.3%.
Applying these results to underwater acoustic monitoring, they allow to find the processing technique to suit the original signal, according to the consumption and transmission needs of the monitoring system.
These results, when combined with previous studies on the transmission efficiency of each of the compressed data set [
11], gives an overview of the optimization possibilities of these sensor networks based on underwater acoustic motorization technologies.
Author Contributions
Conceptualization and methodology, I.F.; field work, R.M. and H.E.-r.; processing R.M. and I.F.; electronic support P.R. and H.E.-r.; formal analysis and data curation, I.F.; writing—review and editing, I.F. and P.R.
Funding
This research was funded by the Instituto de Fomento de la Región de Murcia (INFO) under the Program of grants aimed at Technological Centers of the Region of Murcia for the realization of non-economic R&D activities. Modality 1: Independent R&D Projects, with File No.: 2017.08. CT01.0043 and 2019.08.CT01.0034.
Conflicts of Interest
The authors declare no conflict of interest.
References
- Dekeling, R.P.A.; Tasker, M.L.; Van der Graaf, A.J.; Ainslie, M.A.; Andersson, M.H.; André, M.; Borsani, J.F.; Brensing, K.; Castellote, M.; Cronin, D.; et al. Monitoring Guidance for Underwater Noise in European Seas, Part II: Monitoring Guidance Specifications; JRC Scientific and Policy Report EUR.; Publications Office of the European Union: Luxembourg, 2014; p. 26555. [Google Scholar]
- Proakis, J.G.; Manolakis, D.G. Digital Signal Processing, 3rd ed.; Principles, Algorithms, and Applications; Prentice-Hall, Inc.: Upper Saddle River, NJ, USA, 1996. [Google Scholar]
- 1Khairi, N.A. Performance Comparison of Huffman and LZW Data Compression for Wireless Sensor Node application. Am. J. Appl. Sci. 2014, 11, 119–126. [Google Scholar]
- L. Shaoqiang, Y.Liu, X.Chen, X.Fan, A New Scheme for Evaluation Energy Efficiency of Data Compression in Wireless Sensor Networks (WSN). Int. J. Distrib. Sens. Netw. 2018, 14, 1–11. [Google Scholar]
- Ashida, S.; Kakemizu, H.; Nagahara, M.; Yamamoto, Y. Sampled-Data Audio Signal Compression with Huffman Coding. In Proceedings of the SICE 2004 Annual Conference, Sapporo, Japan, 4–6 August 2004; Volume 2, pp. 972–976. [Google Scholar]
- Vecchio, M. A simple algorithm for data compression in Wireless Sensor Networkds. IEEE Commun. Lett. 2008, 12, 411–413. [Google Scholar]
- Tharini, C.; Ranjan, P.V. Design of Modified Adaptive Huffman Data Compression Algorithm for Wireless Sensor Network. J. Comput. Sci. 2009, 5, 466–470. [Google Scholar] [CrossRef][Green Version]
- Gajre, S.S. Comparative Study of Lossless ECG Signal Compression Techniques for Wireless Networks. Comput. Cardi. 2017, 44, 1–4. [Google Scholar]
- Rhen, Q. Comparison of Huffman ALgorithm and Lempel-Ziv Algorithm for Audio, Image and Text Compression. In Proceedings of the 8th IEEE INternational Conference Humanoid, Nanotechnology, Information Technology, Cebu, Philippines, 9–12 December 2015. [Google Scholar]
- T.Hidayat, M.H.Zakaria, A.N.C.Pee. Lossless Codign Scheeme for Data Audio 2 Channel using Huffman and Shannon-Fano. J. Theor. Appl. Infor. Technol. 2018, 96, 3467–3477.
- Martínez, R.; Felis, I.; Ruiz, P.; Er-rachdi, H.; Cervantes, P. Nuevos Algoritmos de Procesado de Señal Para la Monitorización de Ruido Submarino Tecniacustica; Centro Tecnológico Naval y del Mar (CTN): Cadiz, Spain, 2018. [Google Scholar]
| Publisher’s Note: MDPI stays neutral with regard to jurisdictional claims in published maps and institutional affiliations. |
© 2019 by the authors. Licensee MDPI, Basel, Switzerland. This article is an open access article distributed under the terms and conditions of the Creative Commons Attribution (CC BY) license (https://creativecommons.org/licenses/by/4.0/).


