Proceeding Paper

Performance Evaluation and Interference Characterization of Wireless Sensor Networks for Complex High-Node Density Scenarios †

by
Mikel Celaya-Echarri
1,
Leyre Azpilicueta
1,*,
Peio Lopez-Iturri
2,
Erik Aguirre
2 and
Francisco Falcone
2
1
School of Engineering and Sciences, Tecnologico de Monterrey, 64849 Monterrey, Mexico
2
Electrical and Electronic Engineering Dept, Public University of Navarre, Pamplona, 31006 Navarra, Spain
*
Author to whom correspondence should be addressed.
Presented at the 5th International Electronic Conference on Sensors and Applications, 15–30 November 2018; Available online: https://ecsa-5.sciforum.net.
Proceedings 2019, 4(1), 28; https://doi.org/10.3390/ecsa-5-05729
Published: 14 November 2018
(This article belongs to the Proceedings of 5th International Electronic Conference on Sensors and Applications)

Abstract

:
The uncontainable future development of smart regions, as a set of smart cities’ assembled networks, is directly associated with a growing demand of full interactive and connected ubiquitous smart environments. To achieve this goal of global connection, a large number of transceivers and multiple wireless systems will be involved to provide user services and applications (i.e., Ambient Assisted Living, emergency situations, e-health monitoring, or Intelligent Transportation Systems) anytime and anyplace, regardless of the devices, networks, or systems used. Adequate, efficient, and effective radio wave propagation tools, methodologies, and analyses in complex environments (indoor and outdoor) are crucial to prevent communication limitations such as coverage, capacity, speed, or channel interferences due to nodes’ density or channel restrictions. In this work, radio wave propagation characterization in an urban indoor and outdoor environment, at ISM 2.4 GHZ and 5 GHz Wireless Sensor Networks (WSNs), has been assessed. The selected scenario is an auditorium placed in a free open area surrounded by inhomogeneous vegetation. User density within the scenario, in terms of inherent transceivers density, poses challenges to the overall system operation, given by multiple node operation which increases overall interference levels. By means of an in-house developed 3D ray launching algorithm, the impact of variable density wireless sensor network operation within this complex scenario is presented. This analysis and the proposed simulation methodology can lead in an adequate interference characterization, considering conventional transceivers as well as wearables, which provide suitable information for the overall network performance in complex crowded indoor and outdoor scenarios.

1. Introduction

The notion of a smart world, with the aid of smart devices, smartphones, smart cars, smart homes, smart cities, and the paradigm of “smart everything”, has been a vigorously research topic for many years. This concept holds the view that people and the world itself will be overlaid with sensing and actuation, with the aid of the Internet of Things (IoT). Nowadays, IoT has been used in a large number of fields, such as government, industry, and academia [1], for different applications. For example, sensors placed in buildings in an attempt to save energy [2,3]; wireless sensor networks (WSNs) in vehicular communications to improve safety and transportation [4]; home automation [5]; industry [6] or e-Health services which rely on increased home sensing to support remote medicine and wellness [7].
In the present day, more than half of the world’s population lives in cities [8] with more than six devices per person connected to the Internet [9]. That means that billions of devices will be connected by 2020 to build a smart city, which can range from end-user devices or wearables to vehicular communication systems, water and gas monitoring, smart lightning, structural monitoring, or smart healthcare systems, among others [10].
These solutions require a high density of nodes, which, in turn, require smaller outdoor and indoor cells, leading to Heterogeneous Networks (HetNet). For the successful implementation of such dense deployments, reliable and accurate radio frequency channel models are necessary, addressing the different topologies and radio links to get reliable service coverage and capacity, as well as interference management. Furthermore, hot spots have a non-uniform traffic demand, so it is necessary to have three-dimensional (3D) realistic environments to achieve precise models in order to improve network performance. In this work, we present a deterministic technique to model electromagnetic propagation in a high-node density scenario, specifically an in-house developed 3D Ray-Launching (3D-RL) algorithm, based on Geometrical Optics (GO), Geometrical Theory of Diffraction (GTD), and its extension, the Uniform Theory of Diffraction (UTD). The detailed operating mode of the algorithm has been previously published [11] and validated in complex urban environments [12].
The remaining parts of the paper are outlined as follows: in Section 2, the scenario description with the modeling and simulation approach is explained. Section 3 presents the wireless network performance analysis for the high-node density considered scenario through the Received Signal Strength (RSS), Signal to Noise Ratio (SNR), and constellation plots results, at ISM 2.4 GHz and 5 GHz frequency bands. Conclusions and future work are summarized in Section 4.

2. Scenario Description

This section describes the modeled urban scenario, which is an auditorium placed in a free open area surrounded by inhomogeneous vegetation. This recently built infrastructure is part of Tecnologico de Monterrey’s campus in Monterrey, Mexico. Figure 1a presents the real view of the auditorium and Figure 1b shows the rendered view of the corresponding scenario for simulation.
User density within the scenario, in terms of inherent transceivers density, has been performed by simulation. The considered scenario has a user capacity of 150 persons within the auditorium, and approximately 40 more when all the tables around the building are occupied. Thus, for a high-node density within the complete scenario, it has been considered that one in four people have a wearable that can increase overall interference levels, which leads to a sensor network of 75 wearables. A medium node density case has been considered for 38 wearables (one in eight people), and a low node density study case for 19 wearables (one in 16 people). All the wearables have been analyzed at 1.2 m height, emulating smart glasses in the case of seated people, or smart watches in standing people. Two frequencies have been selected for this analysis, 2.4 GHz and 5.8 GHz, which correspond with the most currently used frequencies for IoT solutions. Simulation parameters are summarized in Table 1.

3. Results

3.1. Received Signal Strength (RSS)

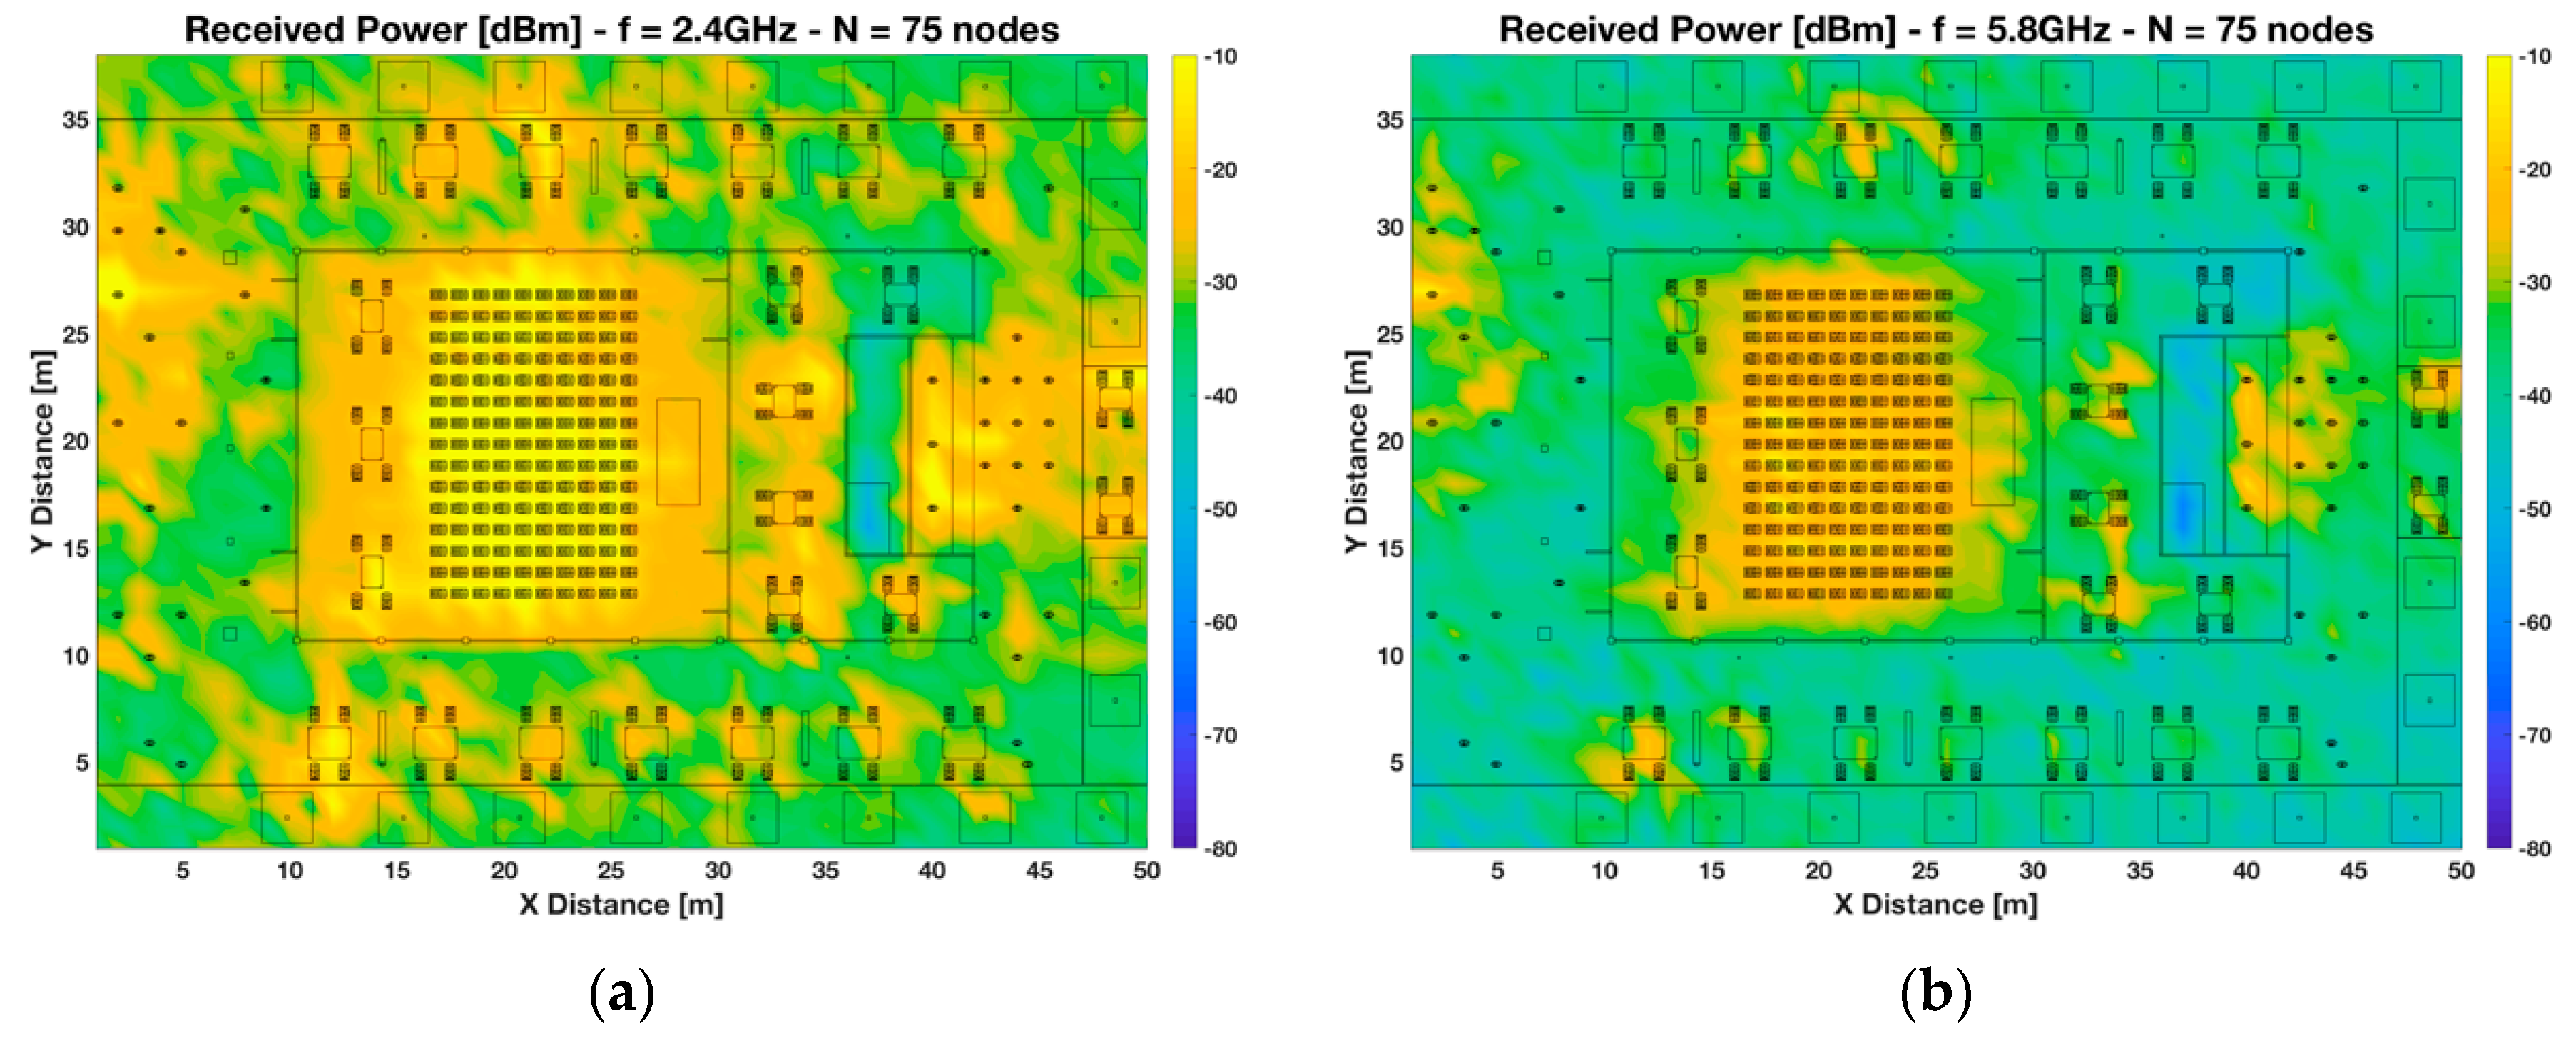
First, the received power for all the spatial points within the scenario has been analyzed. Hence, the Received Signal Strength (RSS) for the complete volume of the scenario has been calculated by means of the proposed 3D-RL tool. Figure 2 shows the received power bi-dimensional planes for the high-node density case, at both frequencies. It can be seen that the morphology and topology of the scenario has a great impact on radio wave propagation. The auditorium area where a higher concentration of people are present, has also a higher concentration of received power, being more remarkable in the case of 2.4 GHz frequency. The higher intensity in this area is given by the body shielding, which block and concentrate the signal in the people’s proximity inside the auditorium. Thus, crowded areas tend to increase the body shielding effect, and at the same time, the signal concentration. It is also noticeable in the outdoor–indoor propagation, showing that in both cases, radio wave propagation in the outdoor area reaches higher levels. Frequency also plays an important role in a high-density WSN, showing that higher power levels are received at lower frequencies.

3.2. Signal to Noise Ratio (SNR)

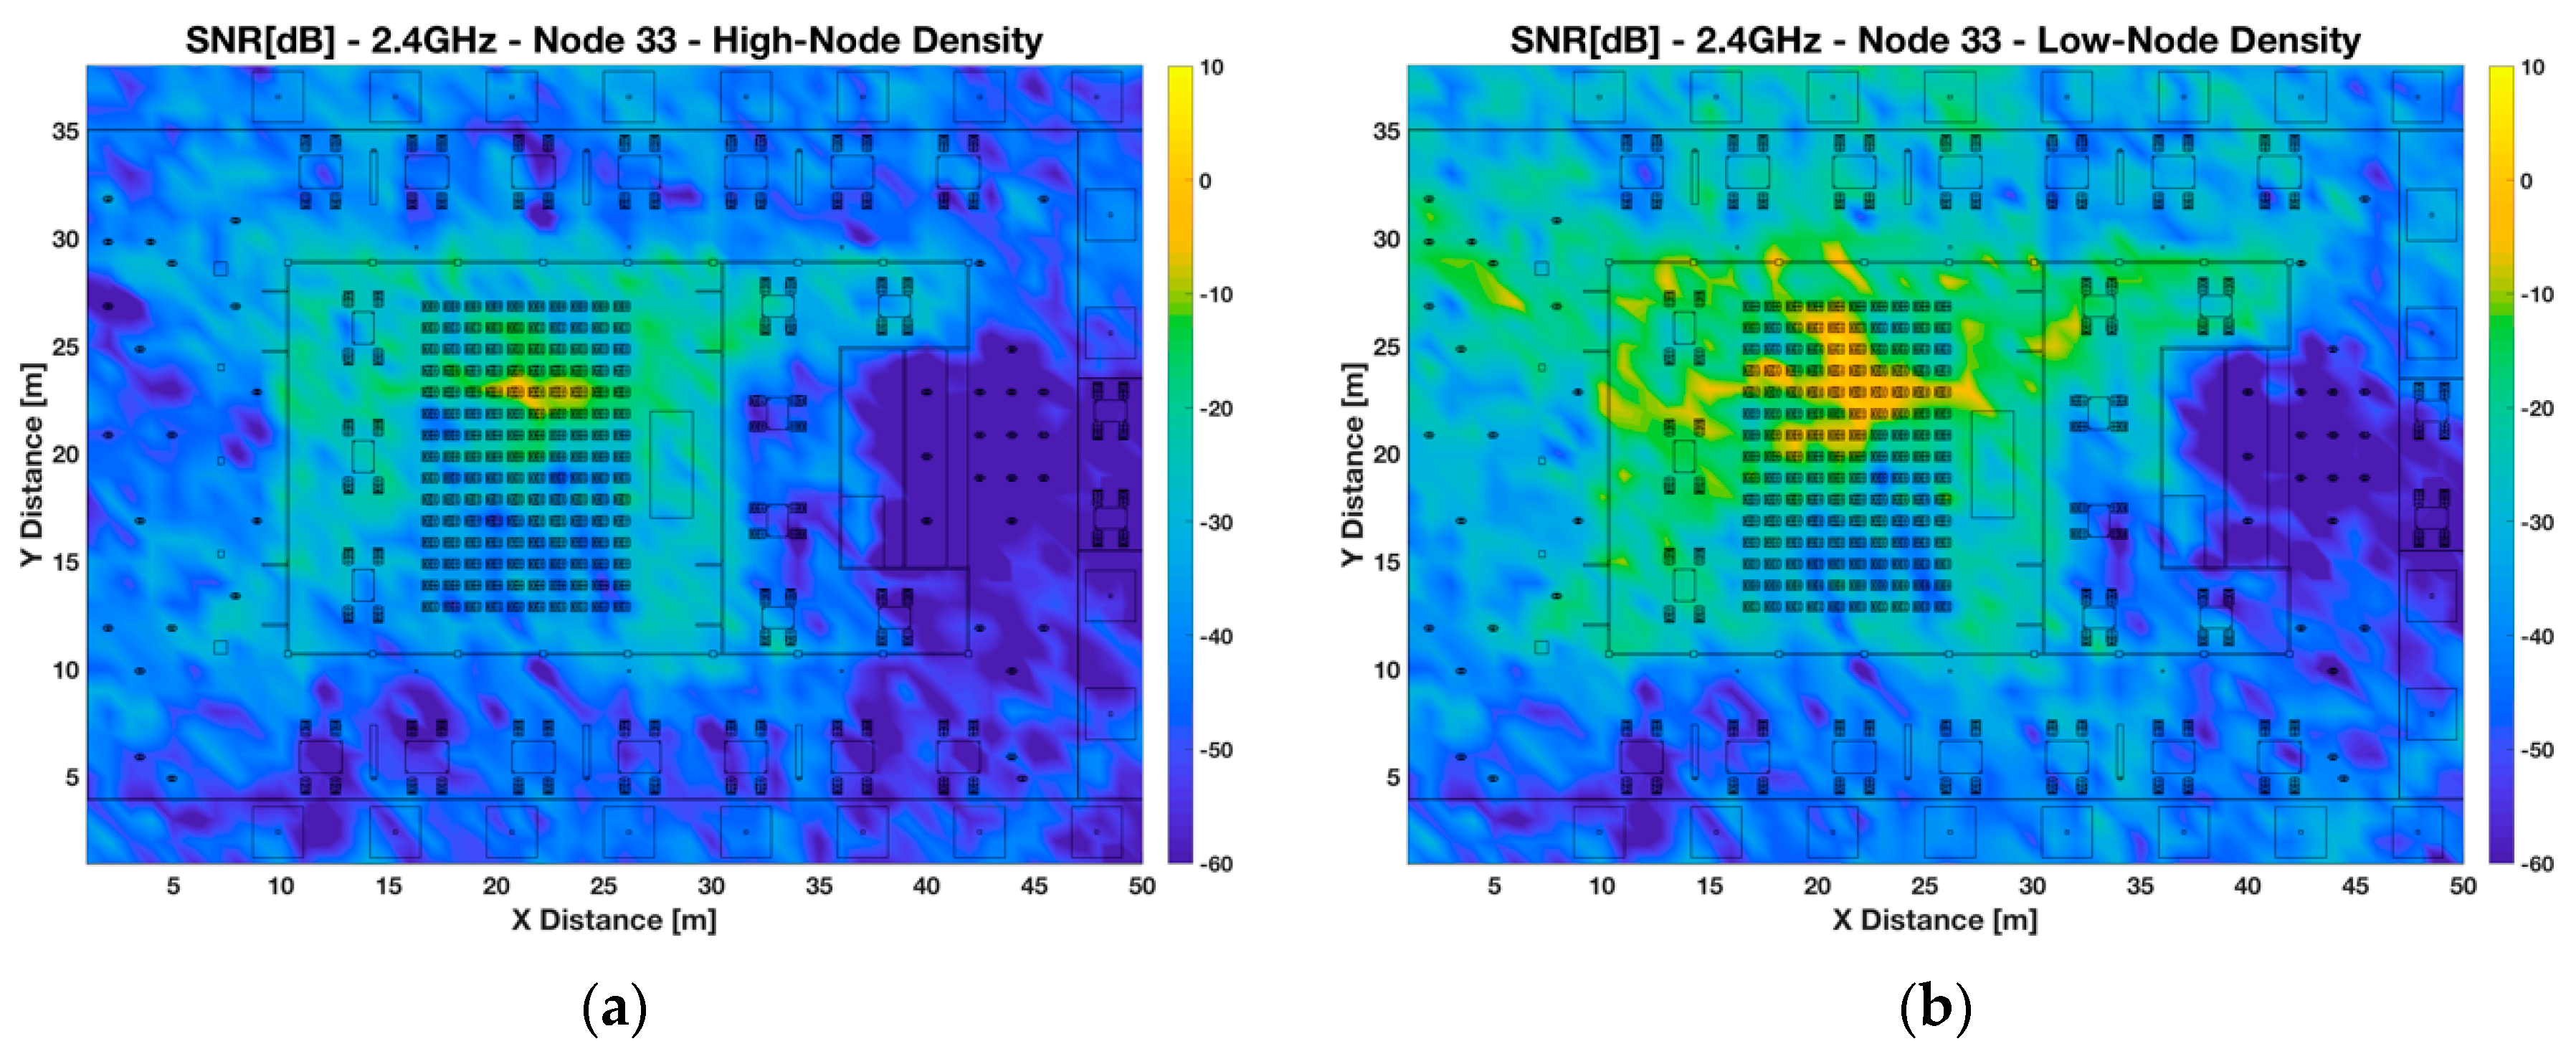
In order to have insight into the interference levels in the proposed sensor network, Signal to Noise Ratio (SNR) volumetric estimations have been obtained considering ZigBee devices, at 2.4 GHz frequency and 3 MHz bandwidth. Figure 3 shows the SNR distribution comparison, represented by bi-dimensional plots at 1.2 m, for a transmitter placed inside the auditorium, considering a high-sensors density (75 nodes) and a low-sensors density (19 nodes), non-uniformly distributed in the scenario, as interferers. These plots represent an upper bound in terms of quality degradation due to simultaneous operation of other transceivers (i.e., the SNR results show the worst case, when all considered interferers are transmitting at the same time). The provided SNR values can be mapped afterwards to Eb/No ratios, where modulation scheme as well as transmission bit rate can be explicitly considered.

3.3. Performance Analysis

Coverage estimations can aid in the estimation of indoor and outdoor coverage in the simulation scenario. However, since coverage and capacity are linked, it is mandatory to analyze the influence of modulation in order to determine system performance. As stated before, a ZigBee sensor network has been considered, which uses Offset-Quadrature-Phase-Shift-Keying (O-QPSK) modulation, with a bit rate of 250 Kbps. Figure 4 presents the constellation plots for the same previously analyzed transmitter (placed inside the auditorium), considering high-node and low-node density. As was expected, it can be clearly seen that the symbols are more disperse in the high-node density case. To have insight into the total interference, the Error Vector Magnitude (EVM) is directly linked to the percentage of error that is tolerable as a function of modulation complexity. Thus, the EVM has been calculated for this specific position, throwing values of 43% for the high-node density case and 35% for the low-node density case. As an expected conclusion, higher density of nodes produces higher interference levels, and therefore, the performance of the system decreases. These performance results can predict in advance the network challenges, showing general and specific trends, which can lead to better knowledge and design of wireless communication systems.

4. Conclusions and Future Work

In this work, a preliminary evaluation of a high-node density mesh network has been addressed. An in-house developed deterministic 3D-RL algorithm has been used to analyze the behavior of the wireless system. An urban micro environment has been selected, which corresponds with an auditorium placed in a free open area in the city surrounded by inhomogeneous vegetation. Received signal power as well as the behavior of the O-QPSK modulation constellation of a ZigBee system have been calculated, showing the effect of degradation when increasing interference in the system. The placement of the sensors, individually as well as mesh set, is a fundamental parameter in order to evaluate the coverage levels as well as the quality evaluation as a function of SNR. The use of coverage and system information provides useful knowledge of the network performance, especially when the number of sensors increases in a high-nodes density scenario. This analysis and the proposed simulation methodology can lead in an adequate interference characterization, considering conventional transceivers as well as wearables, which provide suitable information for the overall network performance in complex crowded indoor and outdoor scenarios. Future work will consist in a deeper analysis of the network parameters as well as coverage/capacity analysis for different wireless systems, presenting a comparison between 2.4 GHz and 5.8 GHz frequencies. The Quality of Service can also be characterized, as well as outage probability.

Author Contributions

M.C.-E. and L.A. conducted the simulation and analysis of wireless propagation phenomena and scenario impact. P.L.-I., E.A. and F.F. conceived and prepared the wireless sensor network design and performance analysis. M.C.-E. and L.A. prepared the manuscript.

Acknowledgments

The authors would like to acknowledge the support and collaboration of the Focus Group of Telecommunications and Networks at Tecnológico de Monterrey.

Conflicts of Interest

The authors declare no conflict of interest. The statements made herein are solely the responsibility of the authors.

References

  1. Stankovic, J.A. Research Directions for the Internet of Things. IEEE Internet Things J. 2014, 1, 3–9. [Google Scholar] [CrossRef]
  2. Bradshaw, V. The Building Environment: Active and Passive Control Systems; Wiley: River Street, NJ, USA, 2006. [Google Scholar]
  3. Zeiler, W.; Houten, R.; Boxem, G.; Vissers, D.; Maaijen, R. Indoor air quality and thermal comfort strategies: The human-in-the-loop approach. In Proceedings of the Eleventh International Conference Enhanced Building Operations, New York, NY, USA, 18–20 October 2011. [Google Scholar]
  4. Burnham, G.; Seo, J.; Bekey, G.A. Identification of human driver models in car following. IEEE Trans. Autom. Control 1974, 19, 911–915. [Google Scholar] [CrossRef]
  5. Control4 Home Automation and Control. Available online: http://www.control4.com (accessed on 23 January 2019).
  6. M1 Security and Automation Controls. Available online: http://www.elkproducts.com/m1_controls.html (accessed on 23 January 2019).
  7. Dickerson, R.; Gorlin, E.; Stankovic, J. Empath: A continuous remote emotional health monitoring system for depressive illness. In Proceedings of the 2nd Conference on Wireless Health, San Diego, CA, USA, 10–13 October 2011. [Google Scholar]
  8. World’s Population Increasingly Urban with More Than Half Living in Urban Areas, United Nat., New York, NY, USA, 2014. Available online: http://www.un.org/en/development/desa/news/population/world-urbanization-prospects-2014.html (accessed on 23 January 2019).
  9. Evans, D. The Internet of Things: How the Next Evolution of the Internet Is Changing Everything. 2011. Available online: http://www.cisco.com/c/dam/en_us/about/ac79/docs/innov/IoT_IBSG_0411FINAL.pdf (accessed on 23 January 2019).
  10. Gharaibeh, A.; Salahuddin, M.A.; Hussini, S.J.; Khreishah, A.; Khalil, I.; Guizani, M.; Al-Fuqaha, A. Smart Cities: A Survey on Data Management, Security, and Enabling Technologies. IEEE Commun. Surv. Tutor. 2017, 19, 2456–2501. [Google Scholar] [CrossRef]
  11. Azpilicueta, L.; Rawat, M.; Rawat, K.; Ghannouchi, F.; Falcone, F. Convergence analysis in deterministic 3D ray launching radio channel estimation in complex environments. Appl. Comput. Electromagn. Soc. J. 2014, 29, 256–271. [Google Scholar]
  12. Azpilicueta, L.; Vargas-Rosales, C.; Falcone, F. Deterministic Propagation Prediction in Transportation Systems. IEEE Veh. Technol. Mag. 2016, 11, 29–37. [Google Scholar] [CrossRef]
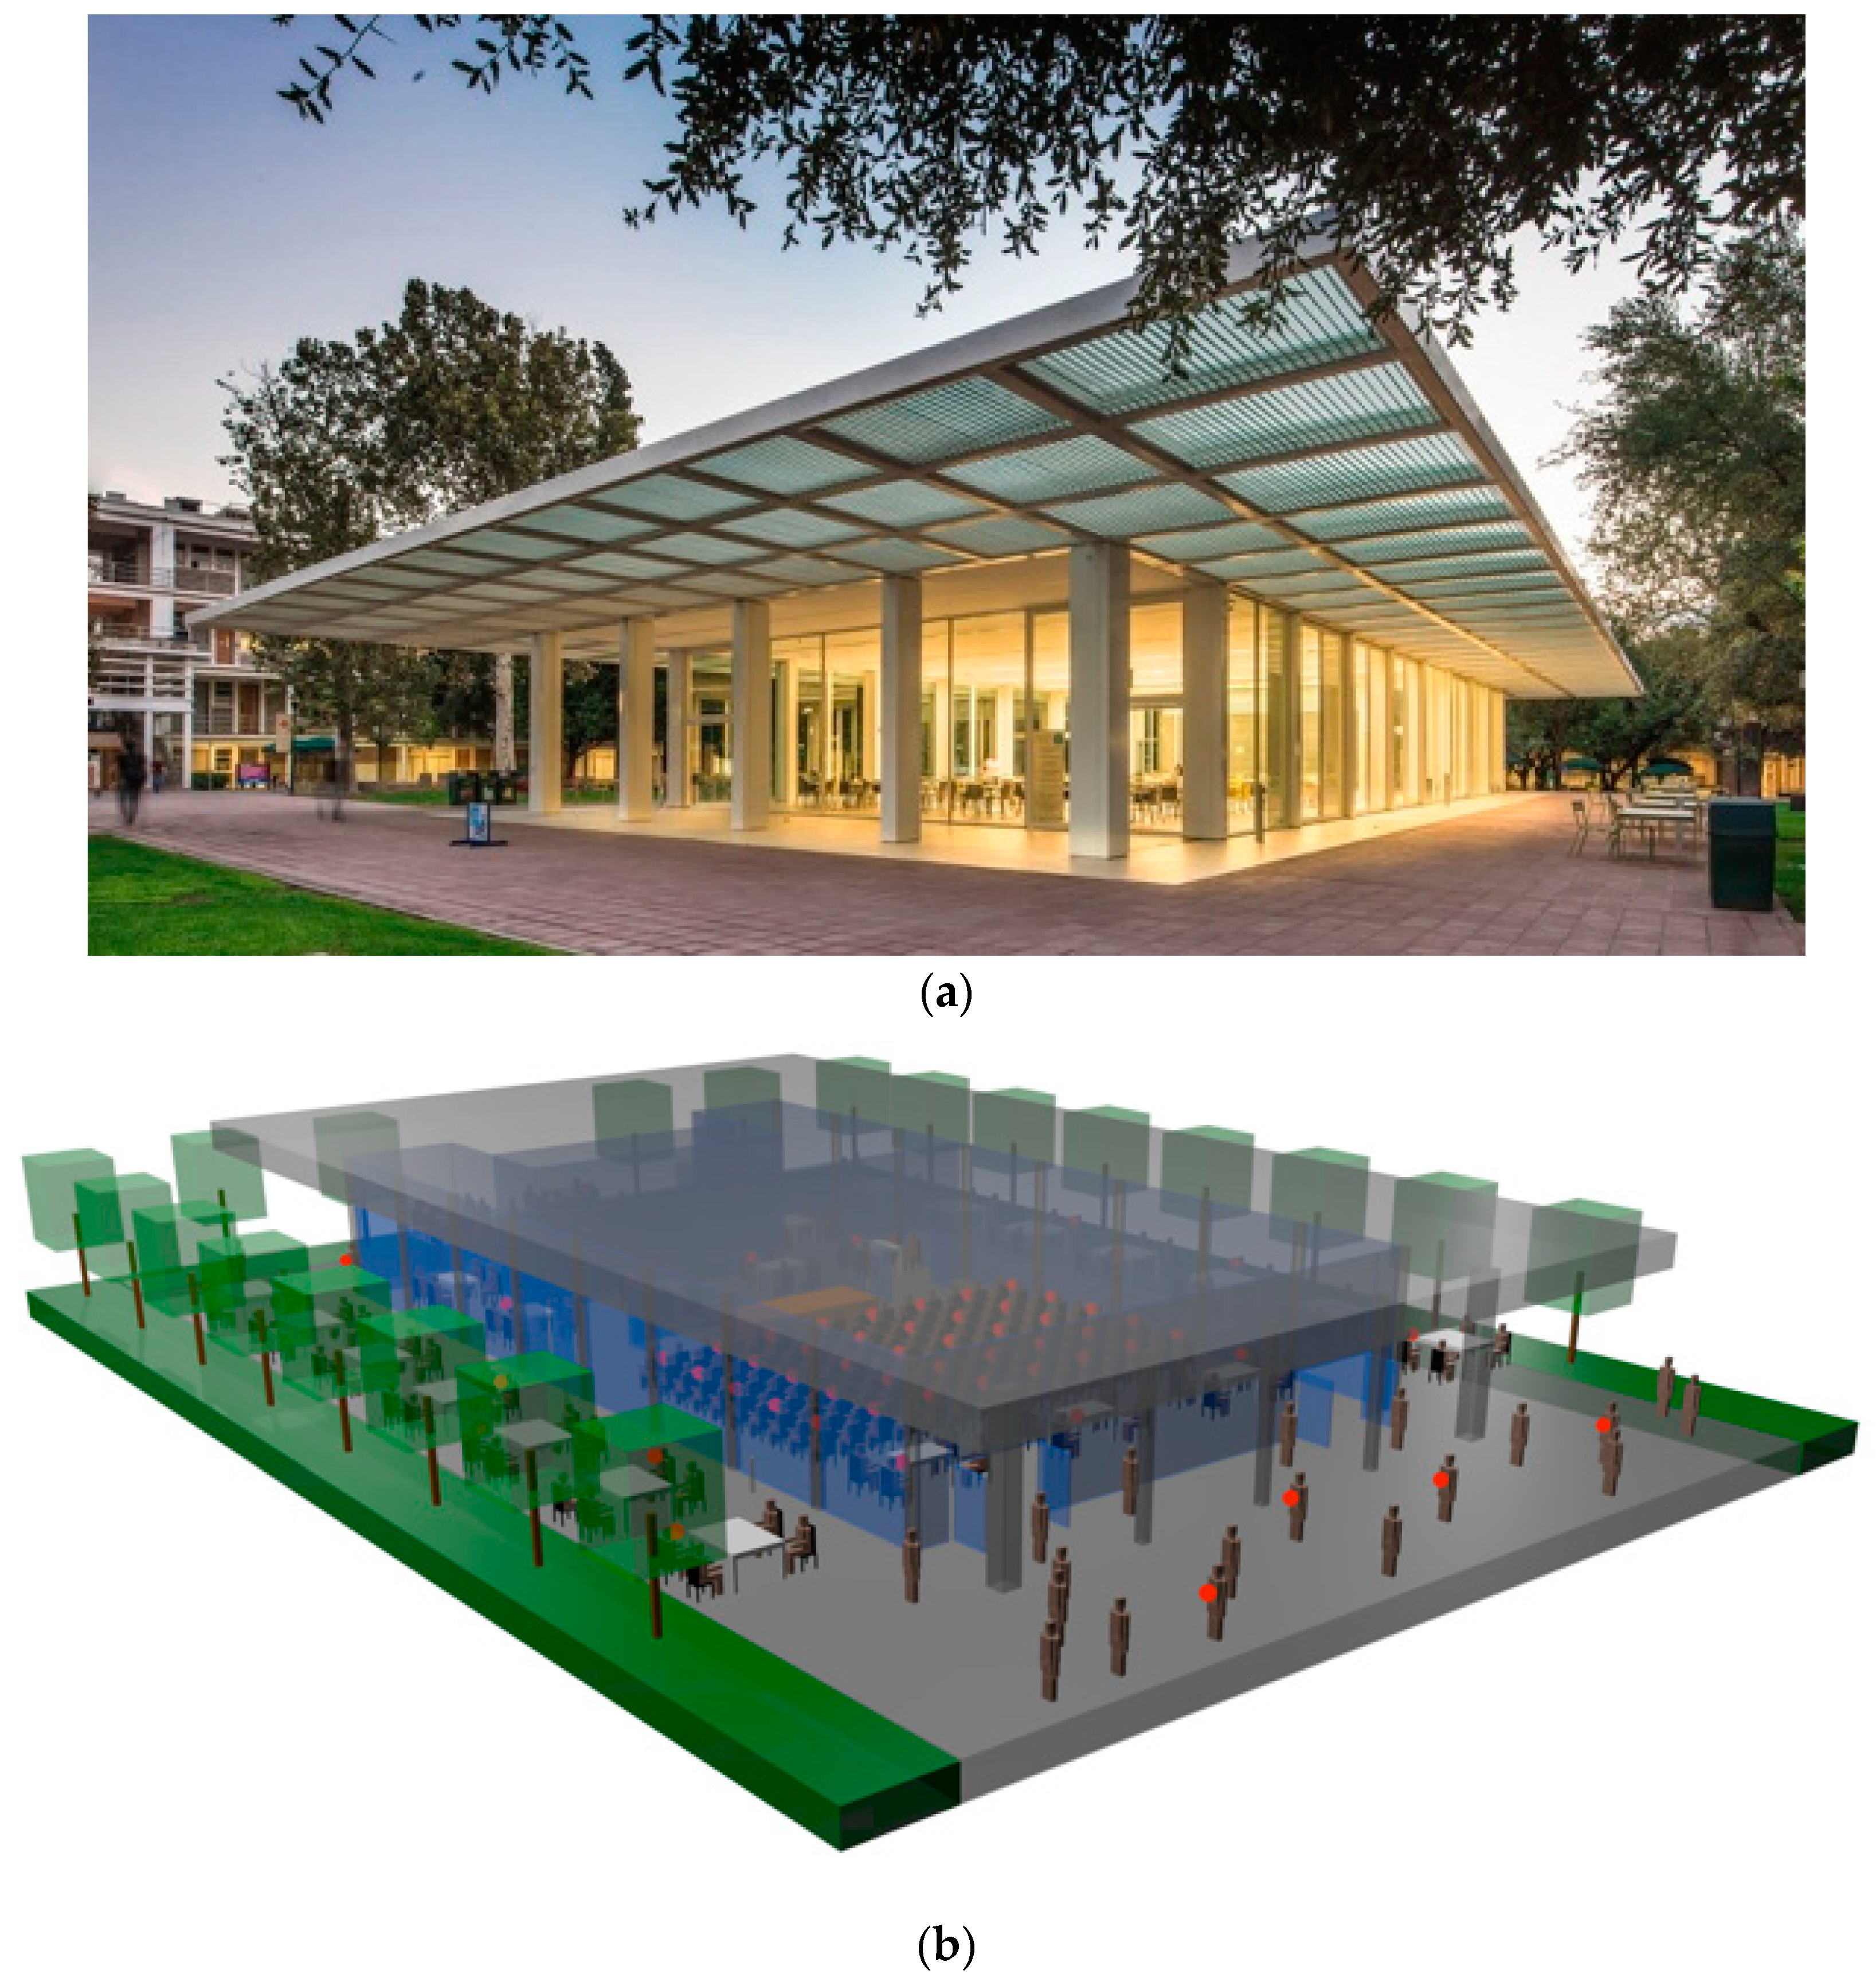
Figure 1. Urban considered scenario, where (a) is the real view of the auditorium placed in Campus Monterrey, Tecnologico de Monterrey (retrieved from: http://www.rdlparquitectos.com/es/proyectos/pabellon-la-carreta/), and (b) is the 3D aerial rendered view for simulation.
Proceedings 04 00028 g001
Figure 2. Bi-dimensional planes of Received Power (dBm) for 1.2 m height for the high-node density scenario, (a) 2.4 GHz frequency, (b) 5.8 GHz frequency.
Proceedings 04 00028 g002
Figure 3. Bi-dimensional planes of Signal to Noise Ratio (SNR) (dB) for 1.2 m height for 2.4 GHz ZigBee sensor network, (a) high-node density scenario, (b) low-node density scenario.
Proceedings 04 00028 g003
Figure 4. In Phase and Quadrature representation for a node within the auditorium for Offset-Quadrature-Phase-Shift-Keying (O-QPSK) modulation, (a) high-node density scenario, (b) low-node density scenario.
Proceedings 04 00028 g004
Table 1. Simulation parameters.
ParametersValues
Wearable TX Power4 dBm
Frequency2.4 GHz/5.8 GHz
Bit Rate250 Kbps/1 Mbps
Antenna Type (RX, TX)/GainMonopole/0 dB
3D Ray Tracing: antenna resolution/Rebounds1 degree/6
Scenario size/Unitary volume analysis(50 × 37 × 8) m/1 m3 (1 × 1 × 1) m
Publisher’s Note: MDPI stays neutral with regard to jurisdictional claims in published maps and institutional affiliations.