1. Introduction
The Coquimbo region in Chile, some
north of the capital, has been repeatedly struck by earthquakes and swept by tsunamis in the last decades, and it is expected to continue being affected in the future [
1]. In the aftermath of severe seismic events, outages in both mobile and wired communication networks are likely and expected to appear, either because of the infrastructure is damaged, or due to power outages. This poses additional challenges to emergency units that have to work in a coordinated, fast, and efficient manner in order to reduce the impact of the extreme event on civilians, and also prevent the population to communicate with their relatives to learn about their status.
This paper proposes a communication system that provides citizens with a mechanism to report their status to emergency units and public authorities, by means of predefined messages and a straightforward user interaction. The system is based on the LoRaWAN architecture, and uses the LoRa radio technology to transmit information between the users’ nodes in their homes and workplaces, and an application hosted in-the-premises. Given our interest to analyze the system performance and capabilities to provide service in scenarios such as a district in the harbor town of Coquimbo, Chile, we created a realistic environment model with the OMNet++ simulator and the FLoRa framework on which to execute diverse network experiments. Our analysis considers a baseline scenario and several system configurations that serve as the departure point to explore its scalability, communication capability and limitations, and also to understand the effect that different parameters pose on the overall performance. The next section presents the background about LoRa communication technology.
Section 3 discusses the related work.
Section 4 describes the proposed communication system.
Section 5 explains the settings used in the simulations that allowed us to evaluate the performance of the system and the methodology used to conduct these simulations.
Section 6 presents and discusses the obtained results.
Section 7 highlights the conclusions and future work.
2. Background
In the aftermath of an earthquake, regular communication infrastructures such as mobile telephony networks and wired Internet connections and landlines (either fibre- or copper-based) have a high probability of suffering service outages. There are two main reasons that cause them: the destruction of the infrastructure and the lack of power to operate them. Seismic events can affect infrastructures in diverse ways, for instance: fibres and cables can break due to excessive tension, base station towers can crumble, and precisely-aligned antennas can become misaligned and cease operation. In addition to hardware breakdowns, lack of electrical power can render most equipment unusable until power is restored. This, in turn, can happen as a consequence of the destruction of utility infrastructures, but also as a preventive mechanism to avoid risks.
2.1. On the Need for an Radio-Based and Fully-Owned Infrastructure
Given the considerations above, an emergency communication system aimed at the aftermath of an earthquake should use wireless technologies rather than cables to overcome eventual infrastructure breakdowns and shutdowns, and should be able to operate solely powered by independent energy sources such as batteries, to not be dependent on the electricity grid (at least for some hours until service is restored). These technical boundaries have a direct impact on the design of the system, in aspects such as its communication range, the operating band, the transmission power, the type of antennae, and the throughput.
Beyond the technical restrictions, in our system design, we set as a requirement that the whole infrastructure must be fully accessible, owned, and maintained by the operator. The rationale behind this decision is the fact that any infrastructure managed by third parties may not be dependable or usable at all in the event of a natural disaster, or service might be downgraded. Because of these limitations in the infrastructure availability, accessibility, and flexibility, we consider the LoRa radio technology to be a good candidate on which to build our proposed system upon.
2.2. The LoRa Radio Technology
LoRa, which stands for long range, is a wireless communication technology owned by Semtech [
2] that operates in the sub-gigahertz range of the radio spectrum. It employs Chirp Spread Spectrum, a proprietary modulation technique resistant to multi-path fading and suitable for noisy environments, aiming to provide low throughput communication with links of more than 10 km—outdoors, in rural areas—while maintaining low power consumption [
3].
Several parameters of the LoRa physical layer can be configured in order to optimize communications for a given scenario or application: radio band and frequency, channel bandwidth, transmission power, Forward Error Connection rate, and Spreading Factor. Different license-exempt Industrial, Scientific, and Medical bands are commonly used in Internet of Things (IoT) deployments, depending on the geographic area, and diverse LoRa transceivers are available to operate in any of them.
Particularly, LoRaWAN is an open standard promoted by the LoRa Alliance [
4] that adds the Medium Access Control (MAC) layer and specifies a Low Power, Wide Area Network (LPWAN) protocol on top of LoRa. It is designed to provide secure wireless bi-directional communication between the end nodes (e.g., battery-operated IoT devices that collect data) and the application that processes the data.
LoRaWAN-based systems are built with a star-of-stars topology, where a number of end-nodes upload data wirelessly to one or more gateways in single-hop transmissions. Gateways have an IP connection through which, in turn, the messages received are relayed from the end-nodes to a network server, where the IoT application resides. Very often, these applications are hosted in the cloud, so gateways actually need a connection to the Internet (via a cable, WiFi access point, or 3G/4G modem). In the network server, information is centrally managed and accessed by the specific IoT application components.
3. Related Work
In the recent years, several research publications have analyzed different aspects of the LoRa technology and the LoRaWAN architecture, such as coverage extension, scalability, and future use cases [
5]. Next, we highlight several works that build on the same topic considering scenarios comparable to first responses after earthquakes, and also those reporting findings that have been used to support the proposed system proposal.
Particularly, Sciullo et al. [
6] introduce the Emergency Communication system Emergency Communication System (ECS), which operates over infrastructure-less phone-based networks, and guarantees long-range Device-to-Device (D2D) communication thanks to the LoRa technology. The system, named LOCATE, includes a mobile application, through which users can convey minimal yet vital emergency-related data, and a dissemination protocol, spreading the emergency requests over multi-hop LoRa links.
Georgiou and Raza [
7] analyze the LoRa technology through simulations. It is shown that the standard coverage probability drops exponentially as the number of end-devices grows; this is due to interfering signals using the same spreading sequence. It is concluded that this fundamental limiting factor is perhaps more significant toward LoRa scalability than for instance spectrum restrictions.
Magrin et al. [
8] simulate a LoRa network with a new ns-3 module to study the performance of a LoRa-based IoT network in a typical urban scenario. Simulation results show that a LoRa network can scale well, achieving packet success rates above 95% in the presence of a number of end-devices in the order of
.
With respect to applications, it is important to mention that LoRaWAN is specially useful in those applications that have communication asymmetry. Apart from a static deployment of sensors, in some cases, sensor networks might employ mobile sensor nodes too. The impact of nodes mobility on the performance of LoRaWAN has also been studied by Patel and Won [
9], and two key findings have been reported: (i) LoRaWAN is susceptible to mobility; and (ii) the effect of mobility worsens the performance for end-nodes in case of bad reception conditions (indoor systems or far from gateway).
4. System Description
The design of our system closely matches the LoRaWAN architecture specifications [
4].
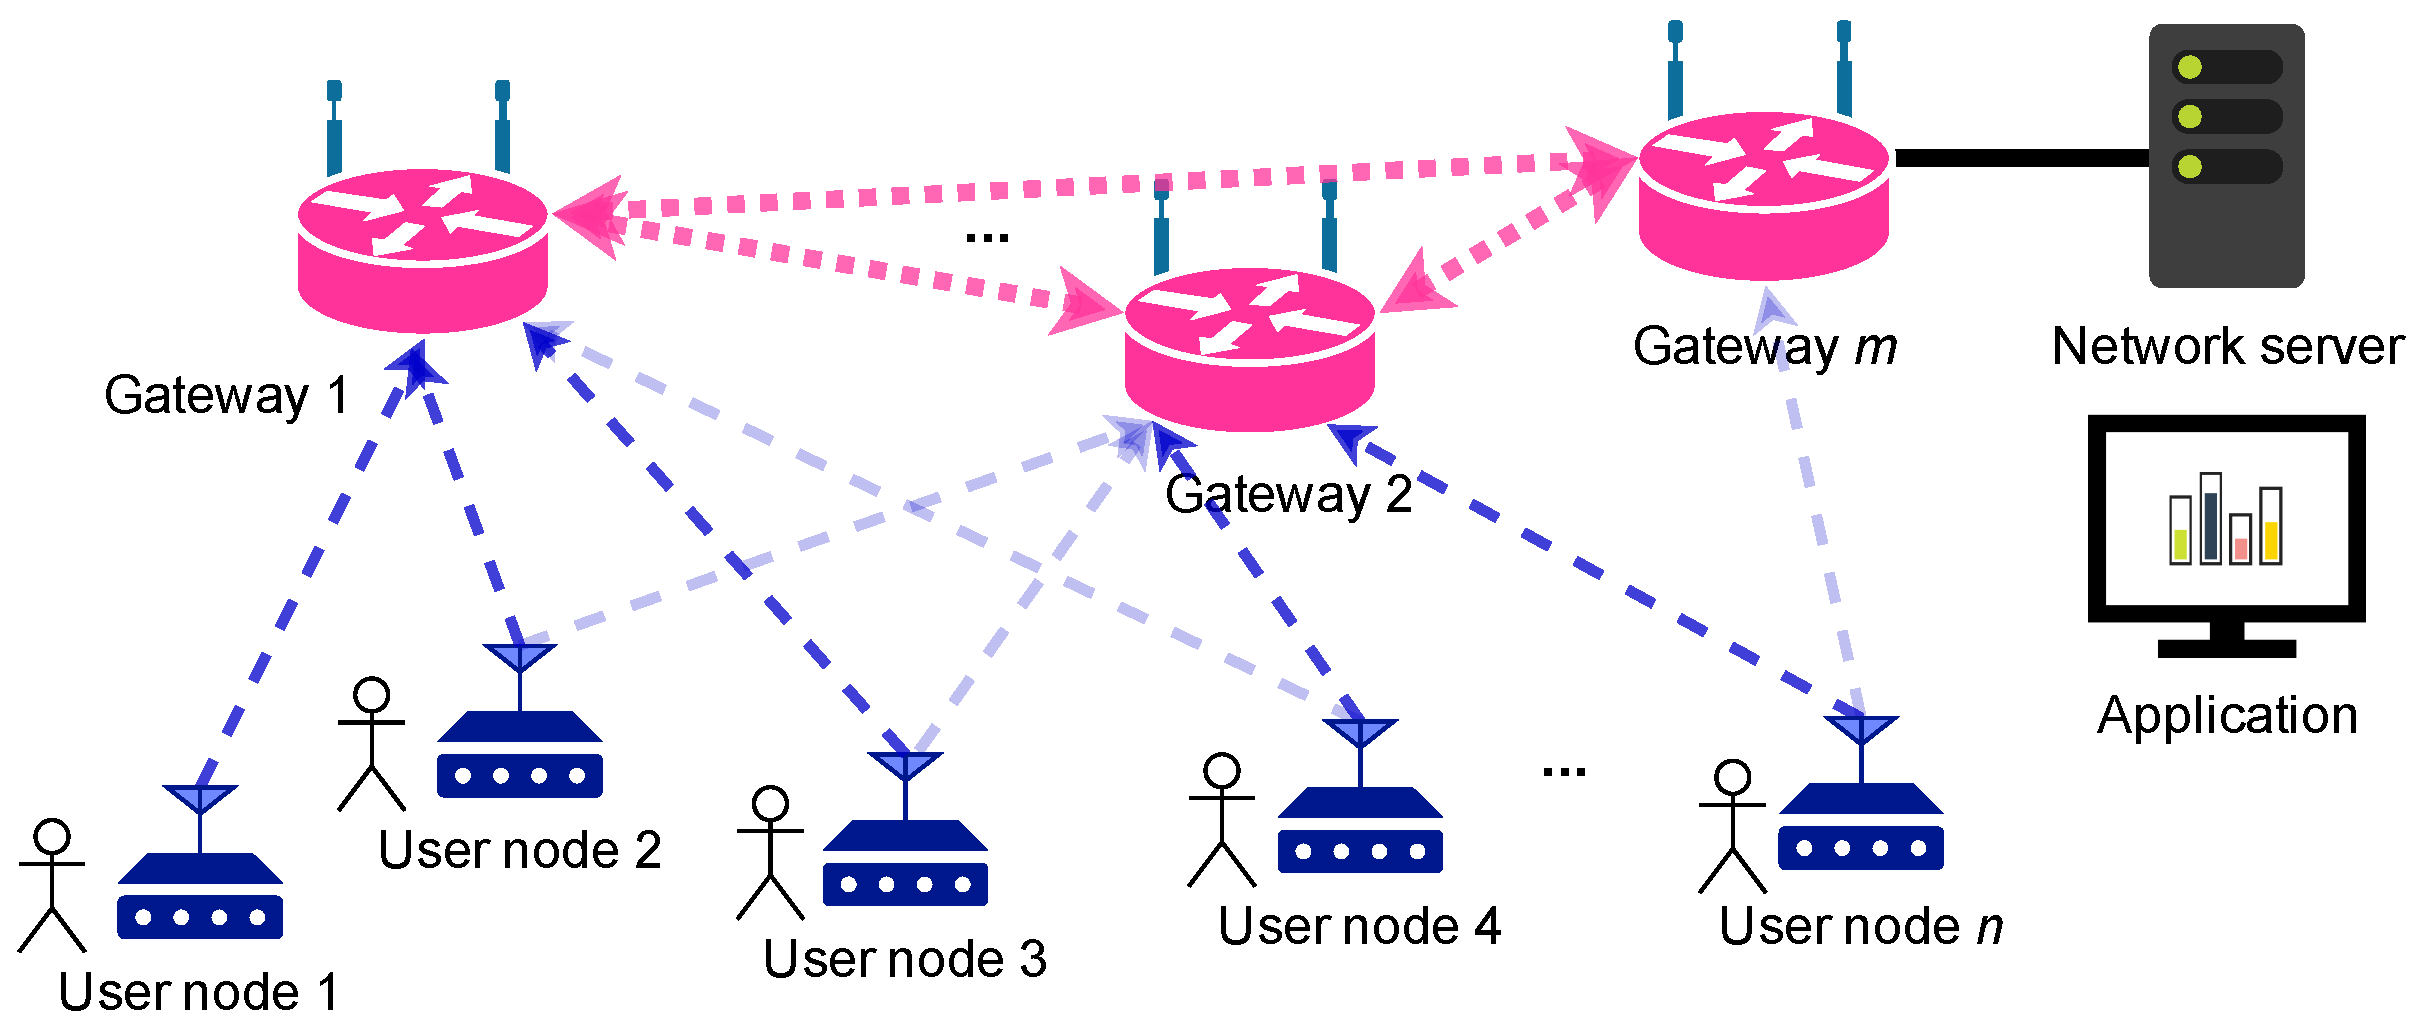
Figure 1 on page 4 depicts its main components from a high level perspective. At the bottom, several end-nodes, called
user nodes or
nodes, provide citizens with the means to interact with the system. The devices are placed at the users’ homes and workplaces, and allow reporting a predefined set of messages upwards to the application. Additionally, these nodes may be able to receive down-link messages and display notifications. The nodes, therefore, correspond to class A devices, as per the LoRaWAN architecture.
The gateways in
Figure 1 relay the messages from user nodes to the network server. Since a transmission from a given node may be received by more than a gateway, they generate a star-of-stars network topology as specified by the LoRaWAN architecture. Very often, gateways use an Internet connection at their location (e.g., via a 4G modem or an Ethernet cable) to relay packets between the nodes and the network server. In our envisioned system, these gateways can communicate between them by means of an IEEE
-based wireless mesh network in order to reach the network server. This part of the system is independent from the LoRaWAN architecture; therefore, it is not addressed in this work. In order to simplify the system, we therefore assume that the gateways have a good and direct connection to the network server.
The network server receives all the messages from the nodes that the gateways successfully demodulate, and processes them (e.g., to remove duplicates). Typically, this component is run in the cloud, but it can also be executed in the premises, as in this scenario. The server hosts the actual application that manages the messages received from the nodes, processes data, and takes actions (e.g., triggering alarms, or sending down-link messages). In the envisioned system, the application would provide meaningful information to emergency teams to help them assist the population (e.g., charts, heat maps). For the current simulation environment, the application takes charge of storing the received messages and the packets’ metadata to generate metrics and statistics.
5. Simulation Scenario
5.1. Environment Modelling
In order to analyze the behavior of the proposed system in a realistic environment, we modelled a representative part of Coquimbo area, a harbor town with a population of 240,000 inhabitants. Based on the data provided by the Chilean National Statistics Institute (INE), last updated in 2017 [
10], we observe that the area under consideration comprises two census districts (In Spanish,
distritos censales): DC-1 and DC-2. These districts account for a total of 27,794 people living in 7515 homes, which are distributed in an area of
. The population of DC-1 and DC-2 is concentrated in a smaller area of
, while the remaining space mostly holds no buildings. We estimate this area from the data available for the smaller neighborhood units (In Spanish,
unidades vecinales) inside DC-1 and DC-2. In particular, we considered UV001, UV002, UV003, UV004, UV005, UV024, UV025, UV033 and UV034, which cover altogether almost completely the populated area of DC-1 and DC-2.
In order to simplify the figures and numbers for the simulation, we approximated the area under consideration by a rectangle of
, and we slightly reduced the number of homes to 7500. This leads to a very small deviation in the number of homes taken into account and their spatial density, as detailed in
Table 1. We also consider that homes are uniformly distributed all over the area and they all have the same elevation.
Figure 2 (left) shows census districts DC-1 and DC-2 layered over the satellite image of the Coquimbo Peninsula, as well as the size of the area considered for the simulation for comparison purposes. Note that, for example, the populated areas of DC-2 left outside the white rectangular area could very well fit in the not populated areas at the top left corner DC-1, inside the white rectangle.
Figure 2 (right) shows the components of the LoRaWAN architecture in the simulator, placed over the area under study. Eventual real deployments, however, should take into account more accurately the population distribution, with a more precise model.
5.2. Simulation Framework
We simulate the system under consideration with OMNeT++ [
11], an extensible, modular, component-based C++ simulation library and framework, in combination with FLoRa [
12], a simulation framework to carry out end-to-end simulations for LoRa networks. OMNeT++ is a well-known discrete event simulator framework used by a lively academic community. Moreover, the FLoRa framework provides a complete implementation of the LoRaWAN architecture [
13] and an accurate model of the LoRa radio physical layer derived from previous experimental findings [
14].
5.3. Simulation Scope
Given our interest to evaluate the system’s performance when handling a massive user interaction in the aftermath of an earthquake, the experiments discussed here specifically focus on this period and leave other aspects such as the bootstrapping of the gateways and the user nodes.
The simulations started with a short setup process, during which all the devices (end-nodes, gateways, network servers, etc.) performed their initialization routines. This setup was followed by an idle period during which no packets are transmitted over the air, which would correspond to the normal system operation before an earthquake. This procedure is common for all simulations reported in this work.
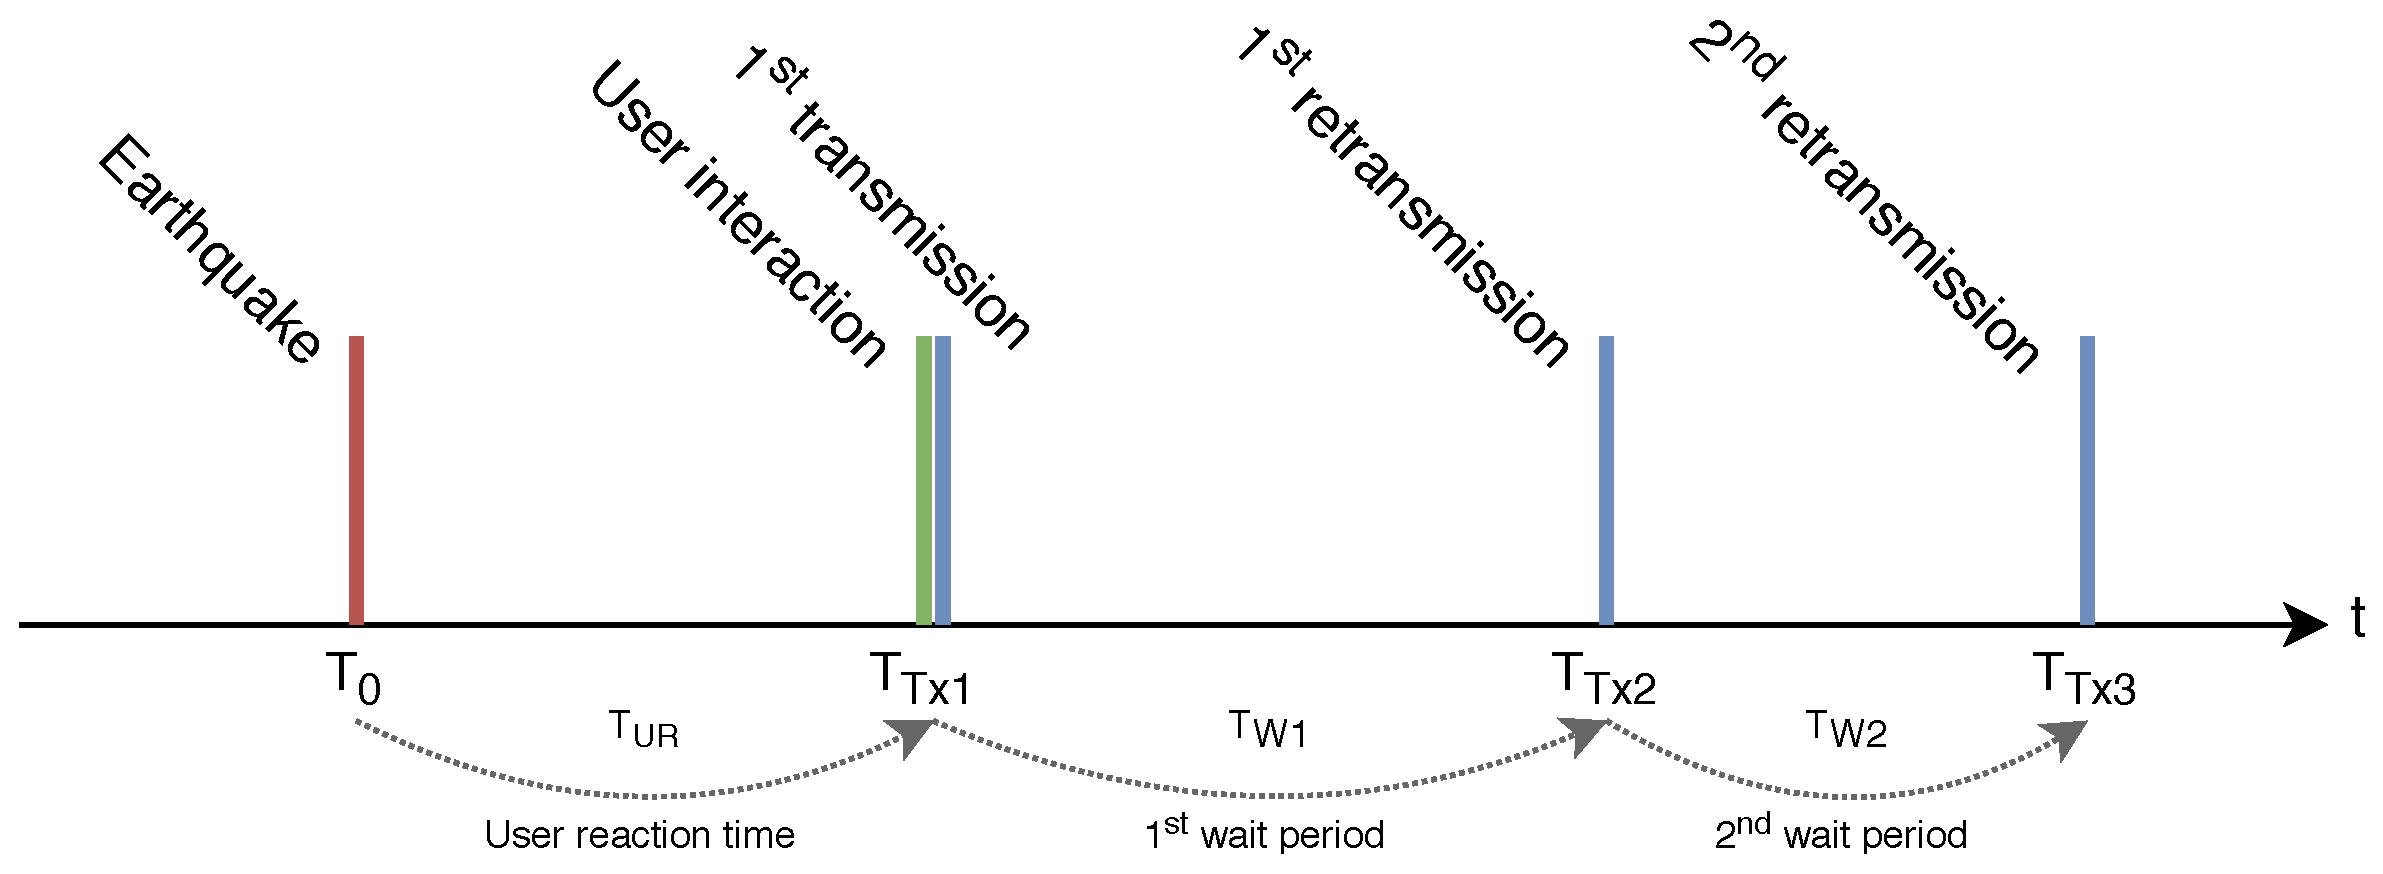
Figure 3 shows the schedule of the events and actions occurring at one of the user nodes. We consider that, at time
, an earthquake takes place, and the previous idle period finishes. From that moment on, users proceed to interact with their nodes. The interaction will happen within a certain user reaction time,
. We model
as a continuous uniform variable between 0 and
. The user interaction with the node immediately triggers the transmission of the first packet, at
.
After the first transmission (regardless if it is successful or not), a user node will wait for some seconds before proceeding with a second transmission, scheduled at , and later, also a third one, at . Waiting times between transmissions and are modeled as continuous uniform variables between 0 and . Therefore, user nodes’ transmissions take place during a 12-min period starting at the earthquake event: . Since the system is meant to help emergency units provide a fast response in the aftermath of an earthquake, all the simulations finish one hour after the triggering event, regardless of any pending transmission. These timing and operations are common to all the simulations performed, except where otherwise noted. Since some aspects of the simulations depend on random numbers (e.g., the position of the gateways on the map), there is a certain probability for components not being evenly distributed all over the area under study. To overcome this effect, the presented results correspond to the average of executing 10 times each of the experiments, but using different seeds for the random numbers generator (cRNG Class).
6. Simulation Results
This section discusses simulation with different dimensions and settings. We specifically focus on two performance parameters: the average Packet Delivery Ratio (PDR) of a simulation run, and the ratio of nodes that successfully send a given number of packets to the application ( packets, exactly 1 or 2 packets, etc.). We first defined a baseline scenario, by setting a series of parameters to fixed values, and simulate it to obtain the performance characteristics of the system. Afterwards, we modified specific parameters of the system and the model one by one, simulated the resulting scenarios, and compared them with the baseline to obtain a better understanding of their influence in the system performance. In particular, we analyzed the scalability of the system (by modifying the number of user nodes and the number of gateways) and the characterization of different parameters (e.g., the number of retransmissions allowed per node, specific LoRa Chirp Spread Spectrum (CSS) modulation settings) to try to understand which configuration can better suit a given scenario.
6.1. Baseline Scenario
The baseline scenario considers a realistic approach to the environment modelled in
Section 5.1, in which 7500 user nodes are deployed over a rectangular area of
, following a uniform random distribution. There are 10 gateways providing coverage to the area, which are distributed using the same uniform random distribution. Other authors have concluded that areas similar to ours—and bigger—can be correctly serviced by fewer gateways [
7]. However, the particularity of our scenario, where transmissions by thousands of nodes are going to occur in a short period of time, suggests that a higher gateways density than in other environments should be considered beforehand. Therefore, the number of 10 gateways is taken as a departure value, to be later analyzed in
Section 6.3.
Table 2 summarizes the main results of the baseline simulation. Based on these numbers, the system does not provide a working communication channel after a disaster for about two thirds of the nodes, as only 35.87% of them are able to successfully deliver at least one message to the application. This is a direct consequence of the low PDR that barely reaches
(averaged for all nodes).
It is worth mentioning that 11.14% of the nodes can only transmit a single packet successfully, while 14.19% are able to transmit three packets. This means that the reliability of the system does not equally affect all of them and, while most () nodes do not achieve to transmit a single packet correctly, a minority make it three times. Since a node sends the same information in each packet, the system globally makes a very inefficient usage of the radio spectrum: the time-on-air being occupied by redundant transmissions could be left free for other nodes transmitting, hence avoiding packet collisions to a certain extent. Therefore, unnecessary retransmissions from certain nodes should not be triggered, leaving room for other nodes. This feature should be implemented in the application component to improve the system performance.
6.2. Number of User Nodes
The number of user nodes in the system is the most important aspect of the scalability figure. According to the environment modelling discussed in
Section 5.1, a ratio of one user node per home would give a total number of 7500 nodes. However, other scenarios in the same region of interest could be more—or less—densely populated, most probably leading to different performance figures. In this section, we investigate on the system scalability by simulating it with different numbers of user nodes, while keeping the dimensions (i.e., the geographical area) and the rest of parameters equal to the baseline scenario (number of gateways, LoRa modulation settings, etc.). With this, we want to understand how the architecture scales with the number of nodes and its limits, to be able in the future to apply different optimization strategies that improve specific performance aspects.
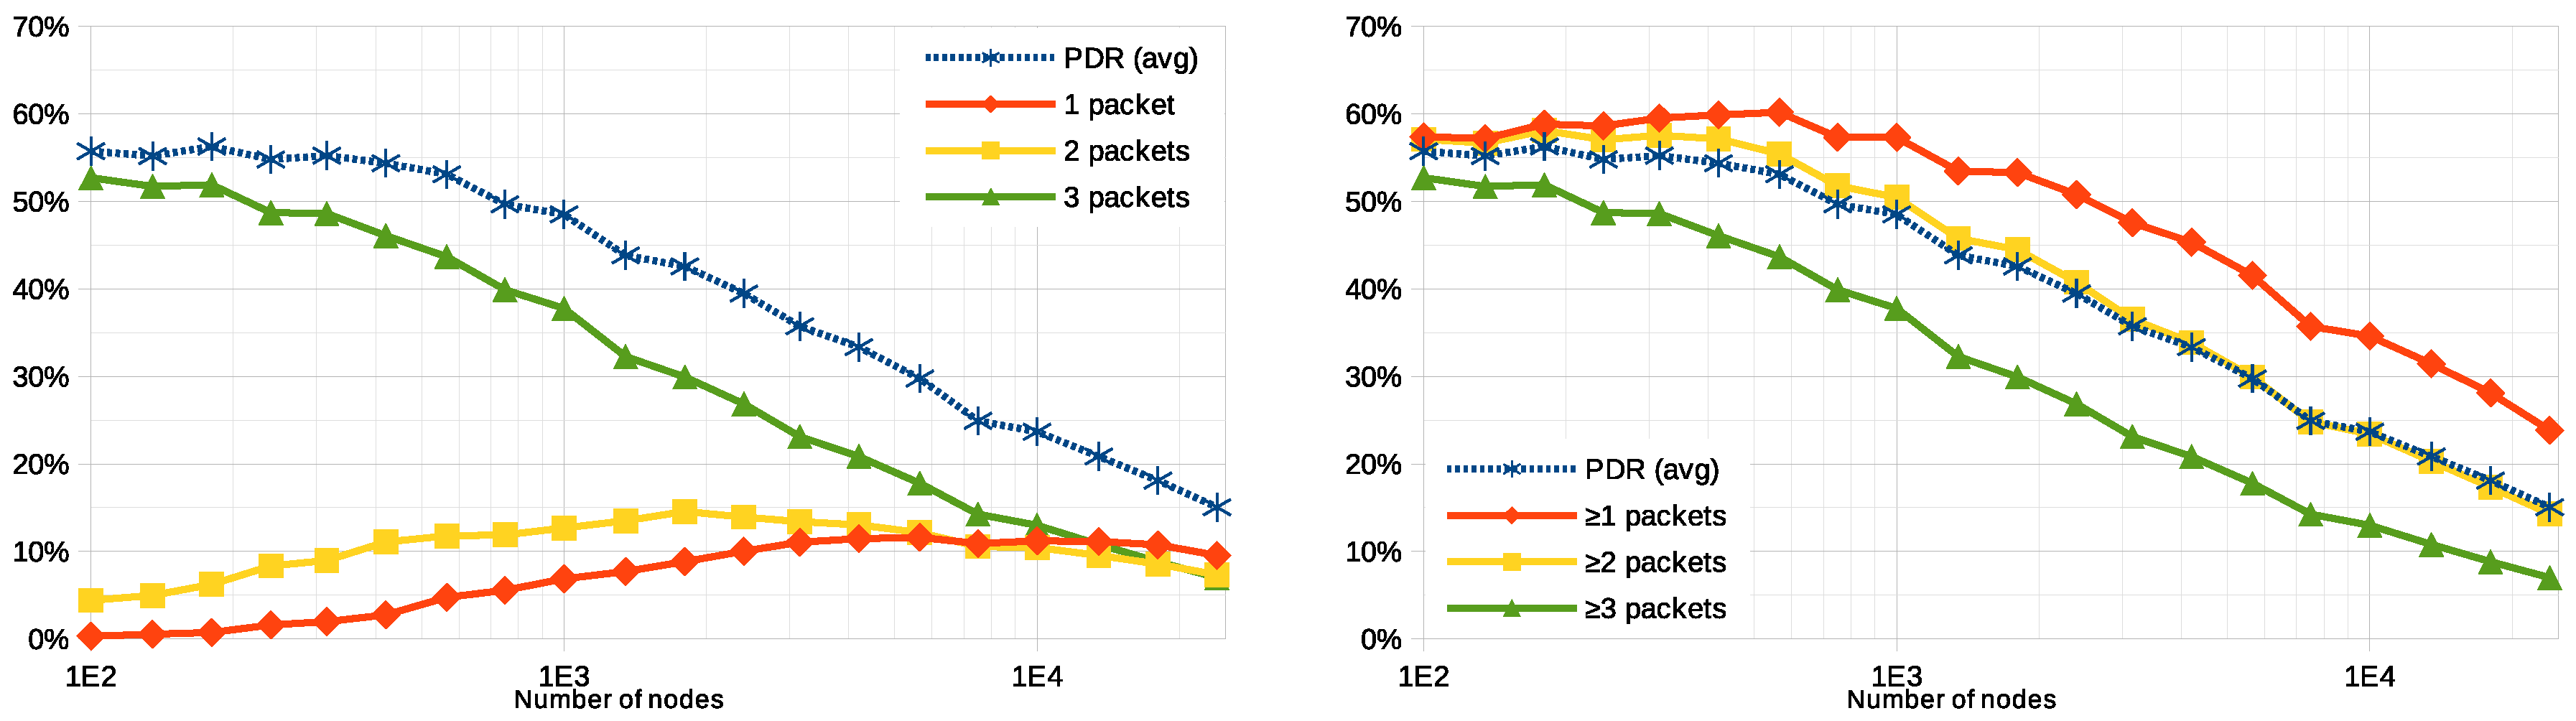
Figure 4 plots the average PDR, for different numbers of nodes, as well as the ratio of nodes that are able to successfully deliver different numbers of packets to the application. The graphs outline three main behaviors regarding the system’s scalability. First, to the left half, between 100 and 750 user nodes, the PDR stays approximately the same—around
—most of the nodes are able to successfully transmit all three packets to the application, while some others (between 5 and
) can do it twice, and just a few (less than
) can make it only once. This means that the gateways provide very good coverage to about
of the nodes, while the rest of them are not covered at all. Second, in the middle-right of the graphs, when the system is simulated between 750 and
user nodes, PDR decays to a half per decade; beyond the thousand of nodes, the transmissions start generating too many collisions, which make the performance figures drop: those nodes that were able to deliver the three packets successfully before can now only do it once or twice. Third, past the
user nodes, the average PDR figure drops more steeply, below
. When 24,000 user nodes are simulated, which is just over three times the nodes in baseline scenario, not even
of the nodes achieve a single successful transmission.
The trends in
Figure 4 suggest that 10 gateways are not sufficient to cover the whole area under study—at least if they are placed randomly—since more than
of the nodes are unable to transmit a single successful packet to the application way before collisions start to saturate the system. Both more gateways and a careful deployment would be required in a real deployment to properly cover the whole area. According to the figures, the system scales correctly for up to 1000 user nodes. This turning point could possibly be pushed to a larger value by placing more gateways: more densely placed receivers should improve the chances to properly decode more packets (e.g., thanks to LoRa’s capture effect [
15]), improving the system’s scalability.
6.3. Number of Gateways
In the LoRaWAN architecture, all the user nodes must send their messages to the application server through one—or more than one—of the gateways available in the system. A priori, the intuition says that increasing the number of gateways in an area should have an impact in the overall PDR, as that would increase the chances for one of them to receive a message with a Signal-to-Noise Ratio (SNR) good enough to successfully demodulate it and relay it. In this section, we modify the baseline scenario and analyze the impact of the gateways density by simulating the system with a wide range of number of gateways (starting from 1, up to 1000). By comparing the results with the baseline scenario, we want to understand how the gateway density affects overall performance, and to determine what is a reasonable required minimum amount to improve the baseline scenario.
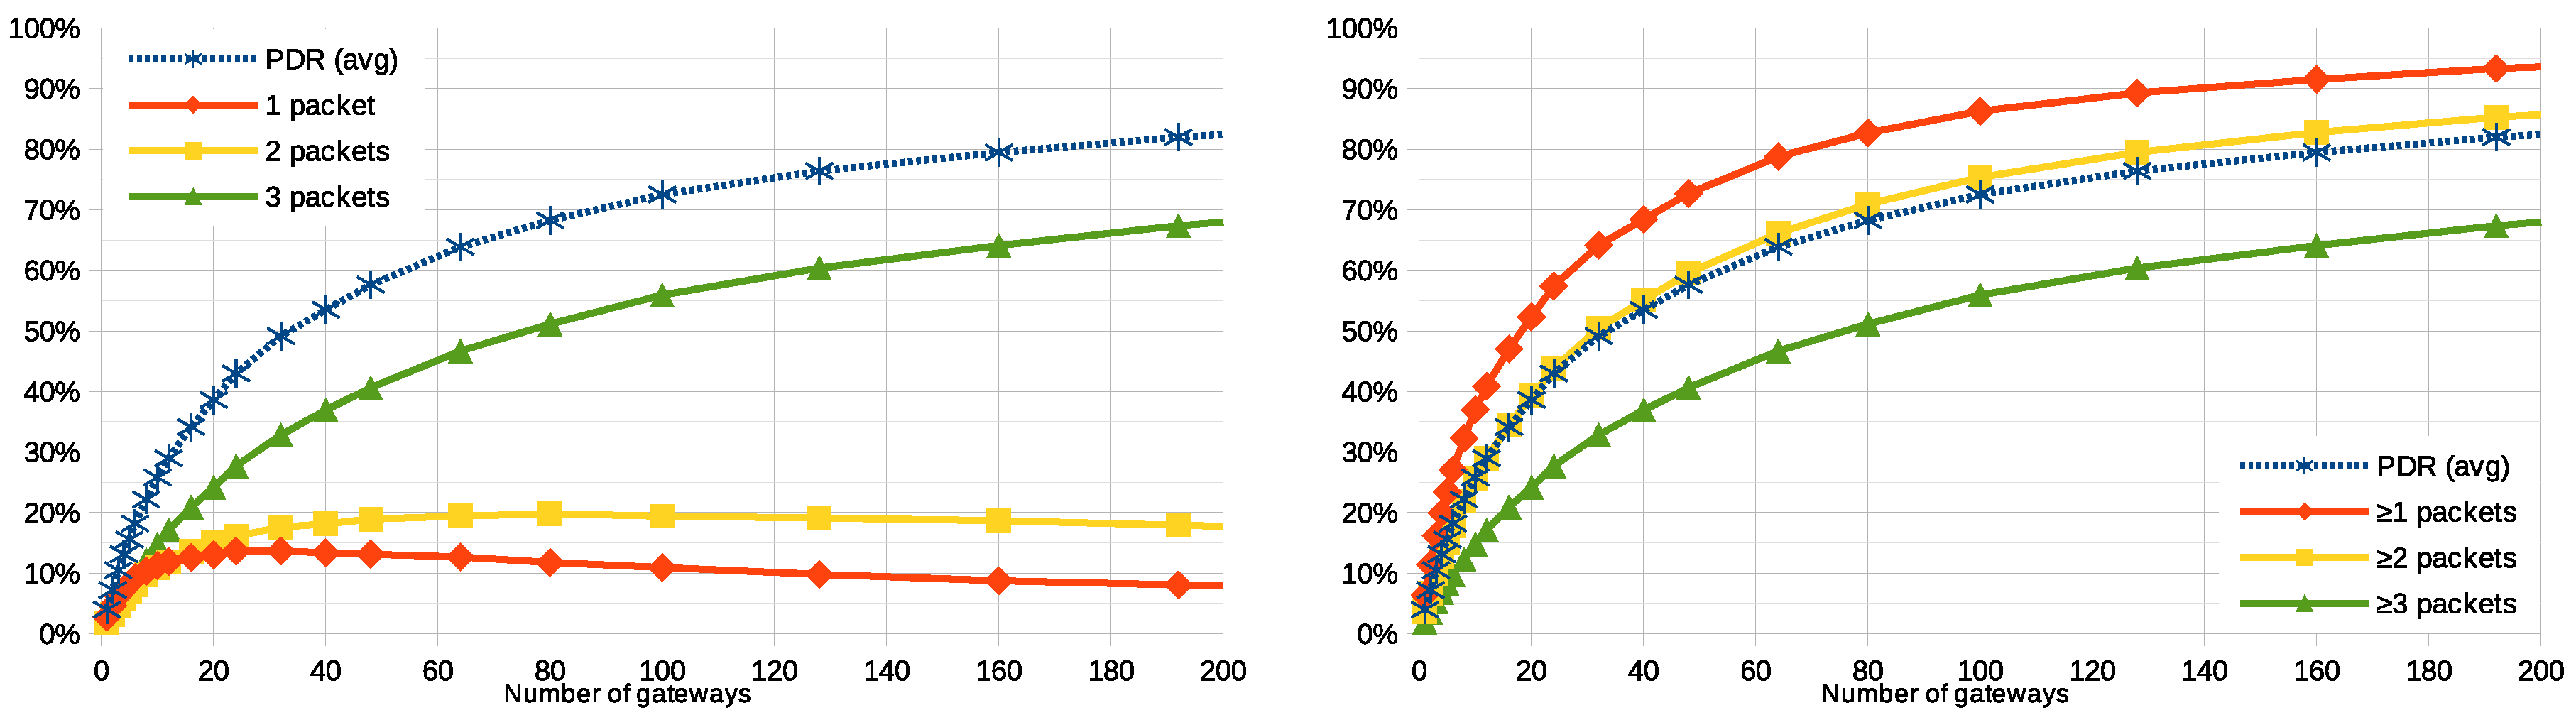
Figure 5 plot the average PDR and the ratio of user nodes that are able to successfully communicate with the application, in a function of the number of gateways deployed to receive their packets. This number ranges from a single gateway up to 1000. The graph shows, as it was predicted that the higher the number of gateways, the better PDR and hence higher the number of user nodes transmitting at least one packet to the application. However, it is worth noting that, while a PDR of
is reached with 32 or more gateways, a simulation with 1000 gateways (not in the graph) provides a PDR of
(this is below
of successful packet delivery).
The trend in
Figure 5 suggests that increasing the number of gateways in the deployment (for example, beyond the 10 gateways of the baseline scenario, up to a few tens) has a positive impact on the PDR (and, therefore, also on the ratio of nodes successfully communicating to the application). However, the effectiveness of this strategy is limited by two factors: (i) as more gateways are added (hundreds, even up to a thousand), the PDR only approaches to
asymptotically; (ii) the economic cost of a gateway is an order of magnitude higher than that of a user node.
It is difficult to determine an optimal number of gateways (the economic factor may play an important role in this decision), but certain statistical criteria could be considered. For example, in the baseline scenario with 10 gateways, an average PDR of is achieved. According to the simulations, in order to reach a PDR of (that is, half of the packets are successfully processed, the other half are not), 32 gateways would be needed (PDR would be ). This number would provide a reasonable ratio between the quantity of user nodes and gateways but still roughly one third () of the nodes would not be able to successfully transmit any message. To improve this figure, other strategies to modify the system are in the following.
6.4. Number of Retransmissions
As detailed in
Section 6.1, after the user interaction, an user node transmits its message three times. The first transmission begins right after the interaction and the two retransmissions occur after random waiting periods (i.e.,
and
, as depicted in
Figure 3 on page 6. Retransmissions have a positive impact in the system, as outlined in the numeric results in
Table 2 from the baseline scenario: while user nodes have average PDR of
, almost
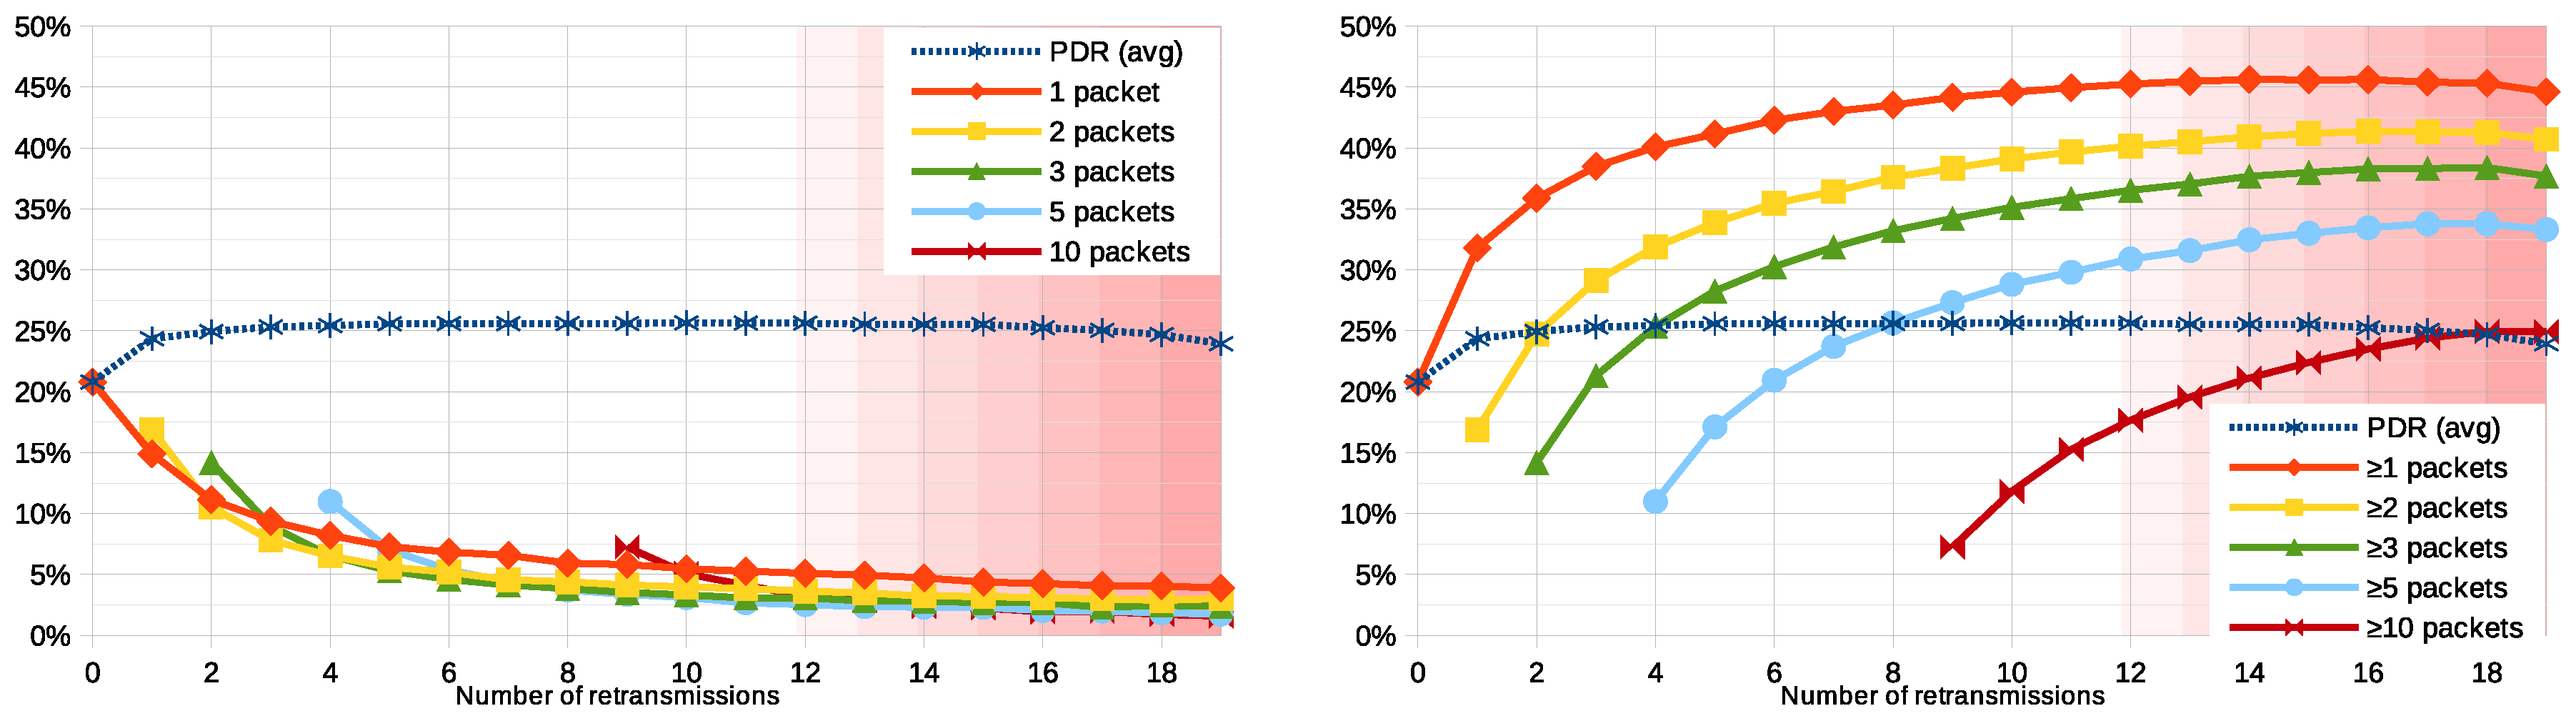
of them are able to transmit at least one packet correctly. However, the way the system is designed, all retransmissions will occur regardless if a node has been able to successfully communicate with the application. This implementation allows keeping things simple (e.g., there is no need for down-link messages to be sent to the user nodes), but comes at the price of an inefficient usage of the spectrum: unnecessary retransmissions will occupy the spectrum and create further collisions without reporting any new information. In this section, we modify number of retransmissions user nodes perform, in order to investigate which is the trend as more—or less—of them are allowed. We simulate the system with all the nodes retransmitting their packets from 0 to 19 times.
Figure 6 plots the ratio of user nodes that are able to successfully communicate with the application, in a function of the number of retransmissions allowed for each node. The graph shows that, beyond one retransmissions, the average PDR does not significantly improve and stays constant just above
. This behavior is explained by the fact that all the nodes perform their initial transmission at a random moment during a
, but the next ones are distributed over a longer period of
, reducing the collision probability. Regarding the number the packets successfully transmitted per node, it is interesting to see that most of them belong to a minority of nodes that always succeed: for example, when four retransmissions are allowed,
of the nodes succeed in delivering
all of their packets, while fewer achieve it once, twice, or three times. Similarly to the baseline, this means that these nodes are misusing the available time-on-air, and allowing more retransmissions does not help balancing this usage.
By design, the system is aimed at providing all the results in the lapse of one hour after the earthquake. After that time, the simulations are finished regardless of any pending packet transmission. Therefore, if retransmissions are scheduled at random intervals between 0 and
, since
, it is then possible that, when more than 12 retransmissions are allowed, the simulation is terminated while some nodes may still have not sent all their packets. This can be seen in the right part of the plots in
Figure 6, where the trends suggest a decrease in the performance.
6.5. Spreading Factor
The Spreading Factor (SF) is a key parameter of the LoRa technology, since it determines the CSS modulation density. Higher SFs mean higher range and better sensitivity, at the expense of a lower data rate. In the baseline scenario (
Section 6.1), user nodes are configured to randomly use SFs 7 to 12 (these are common values in LoRaWAN deployments), following a uniform distribution. This way, an important property of the CSS is exploited: concurrent transmissions using different SFs can coexist and be successfully demodulated by a gateway. Therefore, the SF has a significant impact not only on the transmissions of a single node but also on the global system. For example, a node using a high SF can extend its communication range and reach more distant gateways, hence increasing the chances for its packets to be successfully received. However, a longer range can increase the collision probability with other nodes’ transmissions using the same SF, causing a negative impact on the overall system. Furthermore, since higher SFs require longer air time, collision probability is further increased, which also has a negative impact from the system’s global perspective.
We modify the SFs the user nodes use to transmit data to the gateways, in order to investigate which value (or which combination of them) is more suitable for the given system. We first simulate the system with all the nodes using the same SF (from SF7 to SF12). Then, we define all the possible SF ranges (SFs 7 to 12, 7 to 11, 7 to 10, etc.), and we simulate the system with nodes randomly choosing the SF from the given range.
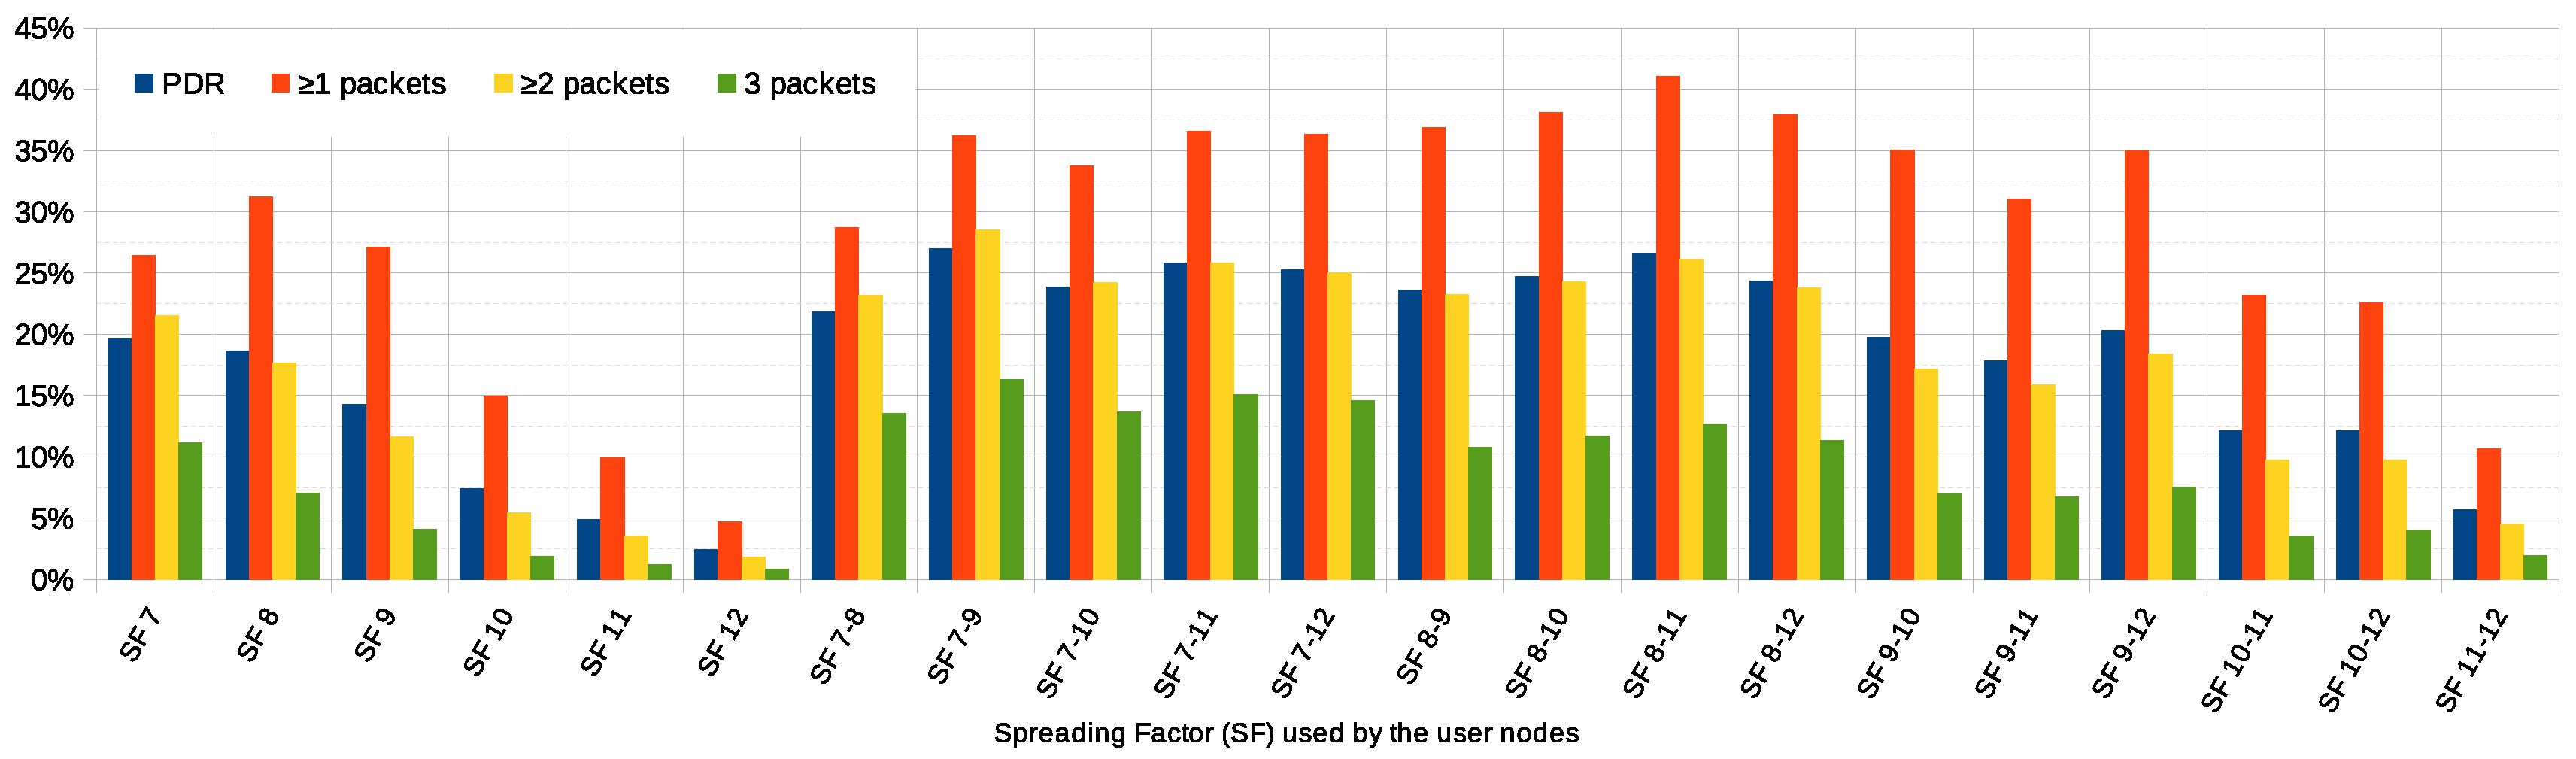
Figure 7 plots, to the left, the average PDR and the ratio of user nodes that are able to successfully communicate with the application
,
or 3 times, when all of them use the same SF. According to the data in
Figure 7 on page 11, smaller SFs 7 to 9 (which shorten the transmission range and the time-on-air, and give faster data rates) provide a better average PDR than the bigger ones, as shorter time-on-air of smaller SFs leads to smaller collision probabilities. As the SF is increased, the PDR gradually decreases (from almost
with SF7 to barely
with SF12). Slower transmissions with longer ranges and time-on-air increase the collisions probability and, on average, make the system have worse average PDR. It is worth noting that the best PDR is achieved with SF7, but employing SF8 allows more nodes to communicate with the application at least once—which is desirable. Here, the shorter transmission range and time-on-air reduces the collision probability, but most likely makes some of the nodes unable to reach any of the gateways.
To the right,
Figure 7 plots the simulations where user nodes choose from a set of different SF values. The widest range, SF7 to 12, corresponds to the baseline scenario in
Section 6.1. The goal here is to assess the positive impact of using more than one SF simultaneously, benefiting from the fact that a gateway can successfully receive and demodulate two or more packets from different nodes concurrently if they all employ different SFs. Just above, we have determined that SFs 7 to 9 provide the best overall results, while SFs 11 and 12 perform significantly worse. Here, the results show that the best figures correspond to the combinations using the smaller SFs and a wide range of them. Regarding the PDR, for instance, the simulation employing SFs 7 to 9 provides the best performance (
). However, the optimal SF selection in terms of the number of nodes able to communicate at least once corresponds to SFs 8 to 11. In this case,
of the nodes reach the application at least once, compared to
of the baseline scenario.
7. Conclusions and Future Work
This work presents a communication system to support the first response activities after a large extreme event like an earthquake. The system is built on the LoRa radio technology and the LoRaWAN architecture. In order to determine its scalability and the effect of its parameters on the overall performance, we conducted several simulations.
We started analyzing its scalability by running a batch of simulations with different numbers of user nodes, ranging from 100 to and observed that, up to approximately 1000 nodes, the system performs consistently and the average PDR stays between 50 and . Beyond this tipping point, as more user nodes are added to the system, performance is drastically reduced. With nodes, less than of the nodes successfully communicate to the application. To improve the previous figures, we investigated the effect gateways’ density has on them. We observed that adding a few more gateways to the baseline scenario radically improves the system performance, but the PDR only reaches with the nonsensical number of 1000 gateways, so other strategies must be followed.
We also simulated the system with different numbers of message retransmissions per node, ranging from 0 to 19, and we find that, even if the average PDR does not substantially change, they have a positive impact on the number of nodes being able to communicate with the application at least once.
Finally, the analysis of the effect of the SF in the system performance revealed that a scenario densely populated by nodes and gateways, like ours, benefits from smaller SFs with reduced range and shorter time-on-air than longer range ones, which produce many collisions and render the system almost inoperable. Furthermore, the concurrent usage of different SFs provides the best results, as the LoRa CSS modulation specially takes advantage of their orthogonality.
Throughout the simulations, we observed a clear unbalance between nodes that can successfully deliver their messages to the application many times and those that cannot make it even once. This clearly calls for a more complex system implementation that avoids unnecessary transmissions and coordinates nodes to use their time-on-air efficiently, by means of down-link messages from the application. Additionally, we would like to explore how node-to-node communication can be exploited to improve the system performance without increasing the number of gateways or, eventually, bypassing them.

 ,
, 


