Proceeding Paper

Design and Feasibility Evaluation of Self-Reporting Application for Indoor Air Quality and Health Measures †

1
VTT Technical Research Centre of Finland Ltd., Kaitoväylä 1, FI-90571 Oulu, Finland
2
VTT Technical Research Centre of Finland Ltd., Vuorimiehentie 3, FI-02150 Espoo, Finland
*
Author to whom correspondence should be addressed.
Presented at the 13th International Conference on Ubiquitous Computing and Ambient ‪Intelligence UCAmI 2019, Toledo, Spain, 2–5 December 2019.‬‬‬‬‬‬‬‬‬‬
Proceedings 2019, 31(1), 47; https://doi.org/10.3390/proceedings2019031047
Published: 20 November 2019

Abstract

:
Indoor air quality (IAQ) plays an important role in human health as people spend the majority of their time indoors. A self-reporting application was developed to collect long-term perceived IAQ data and symptoms caused by poor IAQ immediately at the onset of symptoms. The feasibility of the application was tested in a real-world environment by four teachers in two school buildings for 18 weeks. The participants received two questionnaire notifications per day to answer IAQ, symptoms, productivity, stress, sleep, and pupil concentration/restlessness related questions. They were also able to report those issues any other time. During the pilot, the participants answered 569 questionnaires in the application. They found the application to be usable and useful, however, the frequency of questionnaire notifications became heavy, because the perceived IAQ did not change much. The feasibility study showed the potential of the self-reporting application to capture perceived IAQ and symptoms, promptly enabling fast reaction to possible problems in IAQ.

1. Introduction

The World Health Organization (WHO) has recognized various problems in indoor air quality (IAQ) as major risk factors for human health [1]. Knowing the fact that people spend most of their time indoors (ca. 90%) and children spend a large portion of it at school, indoor environments should support health and promote learning [1,2]. However, quite often, the indoor environments are not optimal.
Poor IAQ is shown to be associated with several adverse health effects, such as allergic reactions, asthma, or neurological symptoms [3]. The likelihood of the effects caused by the contaminants in the air depends on the individual’s sensitivity, contaminant concentration, and the duration and frequency of exposure, although actual exposures are often difficult to quantify [4]. In addition, the current state of the individual’s psychological and physical health affect the response to poor IAQ. Sick-building syndrome (SBS) is a term that refers to non-specific symptoms, which people complain about while spending time in a particular building. The symptoms include, for example, upper-respiratory irritation symptoms, headaches, fatigue, and rash [5]. Adequate ventilation with outdoor air can remove pollutants in the indoor air, and higher ventilation rates in offices have been shown to be associated with reduced prevalence of SBS symptoms and sick leave [6]. Thermal conditions and IAQ have also been found to affect the productivity and performance of pupils [7]. Previous studies have shown that increased ventilation rates in schools are associated with improved test performance among school children [8,9,10].
IAQ can be assessed either by real time monitors utilizing sensor technology or by samples analyzed in a laboratory, but both methods have some drawbacks. Despite recent improvements in sensor technology, it is possible to measure only a limited number of compounds and not complex mixtures of pollutants with low-cost sensors [11], but machine learning methods may detect characterizing variance in redundant sensor data to identify multiple pollutants more precisely [12]. In addition, IAQ sensor equipment requires regular calibration and other maintenance activities. Laboratory analysis can provide information on the total exposure level of a certain pollutant, but the analysis takes time and is not cost-efficient. Thus, human perception is still a considerable method to assess IAQ [13].
Perceived IAQ is typically assessed retrospectively by questionnaires over the past 1 to 12 months. In the work of [14], a more real-time inquiry of perceived IAQ factors was pursued by developing an online questionnaire to asses IAQ and symptoms once per hour by teachers and pupils at school. They tested the usability of the questionnaire in six schools, receiving answers from 105 teachers and 1268 pupils (aged 11–15 years) over the two-week study period. They received a total of 719 answers from the teachers and 6322 answers from the pupils. The respondents were asked to fill in the questionnaire after each lesson in specific classrooms. The questionnaire was delivered as an email link or through a school online communication channel. However, opening the questionnaire link proved to lead to technical problems and 5%–40% of answers were received via traditional paper format.
So far, there has not been an easy-to-use tool to capture perceived IAQ in real time as experienced by the facility users, and thus an IAQ self-reporting application for mobile phone was developed. The aim of this study was to evaluate the feasibility of the application for long-term use in the real-world environment. Four teachers in two school buildings tested the application for 18 weeks as part of a larger IAQ pilot and evaluated its usability, usefulness, and user satisfaction. This paper introduces the features of the developed self-reporting application and presents the questionnaires compiled for collecting perceived IAQ, symptoms, productivity, stress, sleep, and pupil concentration/restlessness data via the application. This paper also presents initial analyses of the IAQ data collected via the application.

2. Materials and Methods

2.1. Self-Reporting Application

An Android self-reporting application was developed to collect perceived IAQ and possible health symptoms. The application facilitates the collection of data via time-triggered questionnaires and user-triggered reports. The first login on the application is done with a user specific personal identification number (PIN) code. The user’s answers are tagged with a pseudo-anonymization code that the application gets during the first login. Figure 1 illustrates the user interface of the application.
The structure of both data entry methods—questionnaires and reports—can be tailored to suit a variety of purposes. Both methods support conditional sections, that is, the structure and content of the forms may change based on the user’s prior answers on the same report or questionnaire. Also, it enables clarifying the choice made with conditionally appearing fields (either open text or checkboxes). The client application buffers the filled questionnaires or reports in case a server connection is unavailable.
The application utilizes Android notifications to remind the user of when she/he has to answer a scheduled questionnaire. The active time (both the start time and duration) for the questionnaire is individually configurable. If the user misses the active time window, the questionnaire is no longer available for that day, and it is marked as unanswered in the user interface. Scheduled questionnaires are activated on specific weekdays only, whereas spontaneous reports can be filled in by the user at all times. At the end of the questionnaire or report, the user provides his/her location, for example, “Room A123”. There are no predefined locations, but each new location the user enters manually becomes available for that user in a drop-down list. Room codes are pseudo-anonymized via data encryption standard (DES).
The application user interface texts, data entry forms, and questionnaire schedules (referred to as “assets”) are fetched from an application server that also receives and stores the user’s answers. By default, the application queries the server for new or changed assets once at login and then every night, making it possible to fine-tune the questionnaires even during the survey. The application server gets the assets from a Google Sheets document, which is also where the survey organizer specifies the user PIN/pseudonym pairs, as well as the structure and content of the assets. The assets can be tailored separately for each user, or the same assets can be used for multiple users. The application server is typically run on a virtual machine. It consists of a remote procedure call server (gRPC) for client communications; an Hypertext Transfer Protocol/Representational State Transfer (HTTP/REST) server for Google Sheets requests and service monitoring requests; and a MongoDB document database for storing the assets, the users’ reports, and questionnaire answers. The answers are stored in one document question by question. The answers pertaining to one questionnaire share a common timestamp.
Answers can be monitored via the REST Application Programming Interface (API) in order to detect any issues as soon as possible. In the pilot, the API was protected from unauthorized access via Internet Protocol (IP) address whitelisting at the virtual machine firewall. Furthermore, as the participant and room codes are pseudonymized, the data are not as such directly associable with actual persons or locations, even when accessed from whitelisted IP addresses. The same API was also used for fetching the answers data for further analysis. The fetched data were converted to comma-separated records via a Python script.

2.2. Feasibility Pilot

The feasibility of the self-reporting application was tested as part of a larger pilot study that also included the following elements: (1) IAQ monitoring with environmental sensors, (2) visualization of sensor data for the participants, (3) physiological data collection with wearable wrist sensor, (4) pupils’ concentration evaluation with regular performance tests, and (5) portable indoor air purifiers. The participants were four teachers, referred here with letters A–D (all females, 26–59 years, average age of 43.5 years) in two school buildings in Finland. The buildings were within the same yard and each teacher was working in their own classroom. Two teachers (A and B) worked in building 1 and two teachers (C and D) in building 2. The four classes had 83 pupils in total (8–11 years, average age of 8.6 years, 39.8% girls, 60.2% boys). All classrooms had a mechanical ventilation system, but school personnel could not control ventilation in the classrooms.
The pilot lasted 18 weeks and included an installation phase and four pilot phases. At the beginning of the pilot, the self-reporting application was installed into each teachers’ personal work mobile phone and they were able to start reporting the perceived air quality and possible symptoms. Notifications for predefined morning and afternoon questionnaires were timed individually according to the school timetable. The first one was to appear when the teacher came to the school and the afternoon questionnaire a couple of hours before leaving the school. When teachers were not in the classrooms, they were not expected to answer the questionnaires, but they were able to use the “Report here” function whenever they wanted (see Figure 1). In addition, the teachers received a Polar M600 wrist device (www.polar.fi) for collecting their activity and heart rate data. They were not able to see these data themselves during the pilot.
In phase 1, the classrooms were installed with an IAQ monitoring system consisting of commercial sensor equipment and a cloud platform. MCF-LW12CO2 was used to measure temperature, relative humidity, carbon dioxide (CO2), air pressure, total volatile organic compounds (tVOC), and ambient light sensors. Moreover, sound level was monitored with PeakTech PT8500 devices and the number of people in the classroom was detected using Orbbec Astra 3D cameras. All collected data were stored in MS Azure Table storage via Message Queue Telemetry Transport (MQTT) interface. However, the collected sensor data were not included in the data analysis conducted in this paper.
In phase 2, the teachers were provided with visualizations of the environmental sensor measurements via Power BI web interface. In phase 3, air purifiers (UniqAir, www.uniqair.fi) were brought into the classrooms (two real, two mock-ups). With a mock-up, we mean a purifier that only circulated the air in the classroom and did not actually purify the air. In phase 4, the air purifiers were cross-changed so that all classrooms had both real and mock-up air purifiers during the pilot. In phase 3, the air purifiers were with teachers B and C, and in phase 4, they were with teachers A and D. The teachers did not know that some of the purifiers were mock-ups. The self-reporting application was in use the entire time and this paper focuses on the evaluation of its feasibility, although a description of the whole pilot is given to understand the context of use. The study protocol was approved by VTT Technical Research Centre of Finland Ltd ethical committee and the participants signed an informed consent.

2.3. Application Questionnaires

The pilot participants reported perceived IAQ or symptoms via timed questionnaires (morning and afternoon questionnaires) or on-demand whenever teacher noticed something in the IAQ. Questions on self-reporting application were specified based on validated questionnaires MM-40 [15], Office Environment Survey [16], Single-item measure of stress [17], and prior IAQ studies [18,19]. Many standard questionnaires consider the air quality retrospectively from a period of several months, thus, for the application, the answer scales had to be adapted for measuring short-term perceptions repeatedly. Table 1. lists the questions asked in the morning questionnaire and Table 2. lists those in the afternoon questionnaire.
In general, the morning questionnaire included items on rest/sleep and air quality (general evaluation and details on indoor air quality, seven items in total). The afternoon questionnaire was longer (including 8 to 21 items depending on the answers). The afternoon questionnaire included items about stress, productivity, air quality, symptoms, actions during the day for improving air quality, pupil restfulness, and pupil concentration. In addition, there were text fields after questions (M1)–(M3), (M5)–(M7), (A1–A3), and (A6–A8), where the user was able to write additional details if they wanted. Questions M4 and A5 were followed with a possibility to select additional options describing odors or symptoms in more detail. When using the “Report here” function, the person could choose a specific parameter to report on, that is, air quality, symptoms, stress, productivity, pupil restlessness, or pupil concentration. Each questionnaire had additional questions on the location, time spent in that location, and number of people.

2.4. Application User Experience

User experience of the self-reporting application was inquired with four online questionnaires sent to the teachers as an email link at the end of each pilot phase. Teachers were asked about their satisfaction with the self-reporting application with the net promoter score (NPS) [20]. Usability of the application was asked with selected items from the system usability scale (SUS) [21], along with additional questions on perceived usefulness, intention to use, robustness, and open feedback. The user experience related questions are presented in Table 3.

3. Results

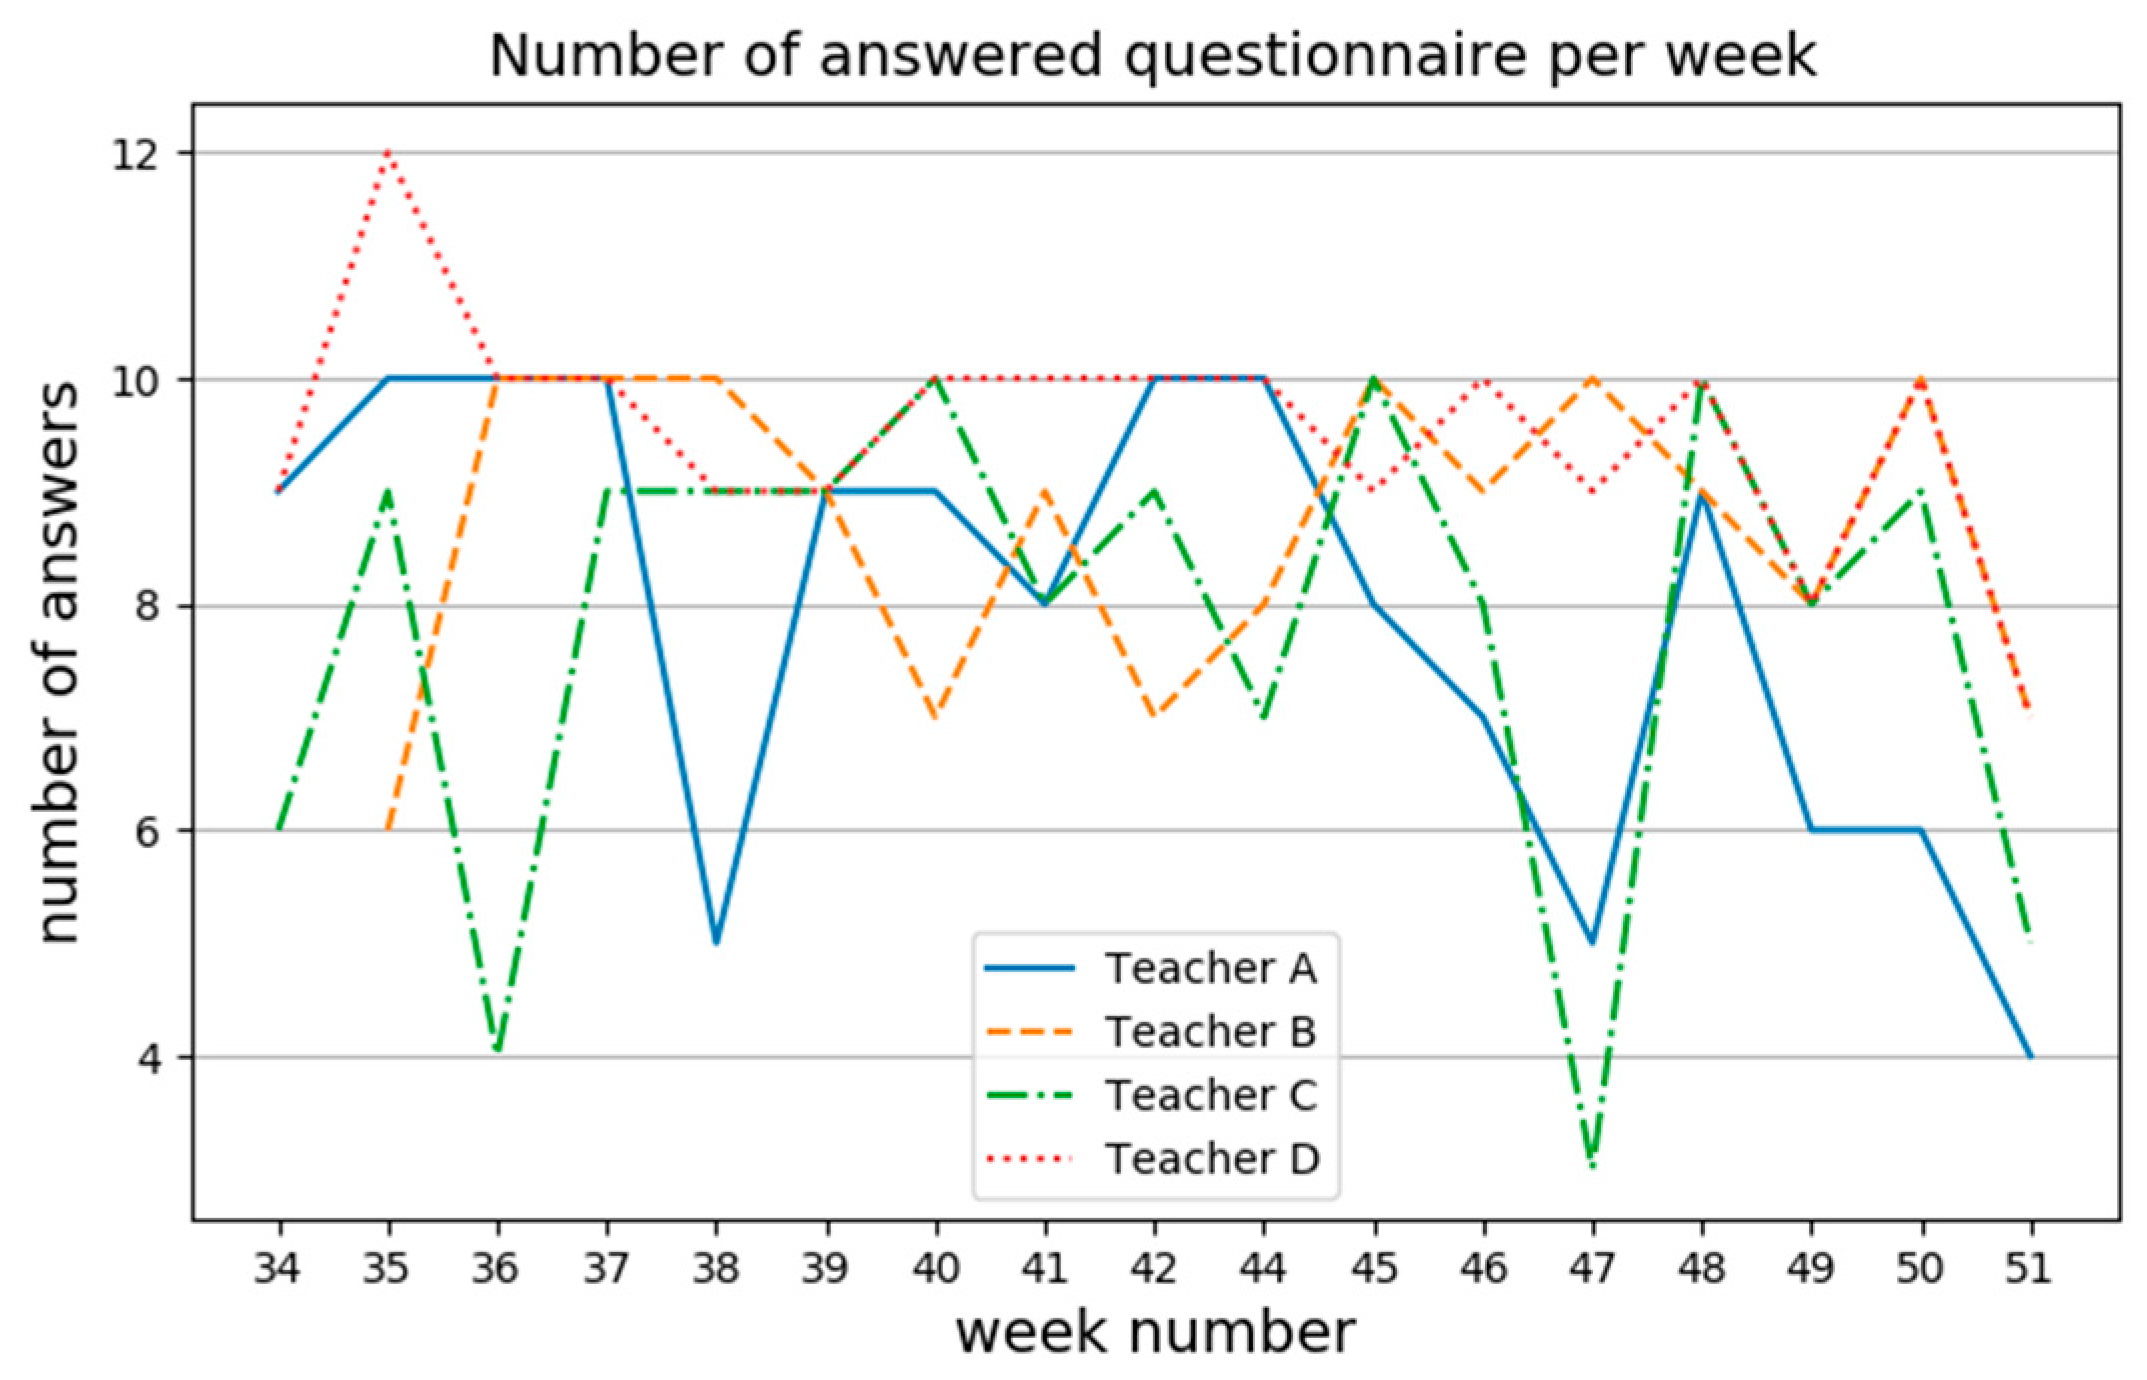
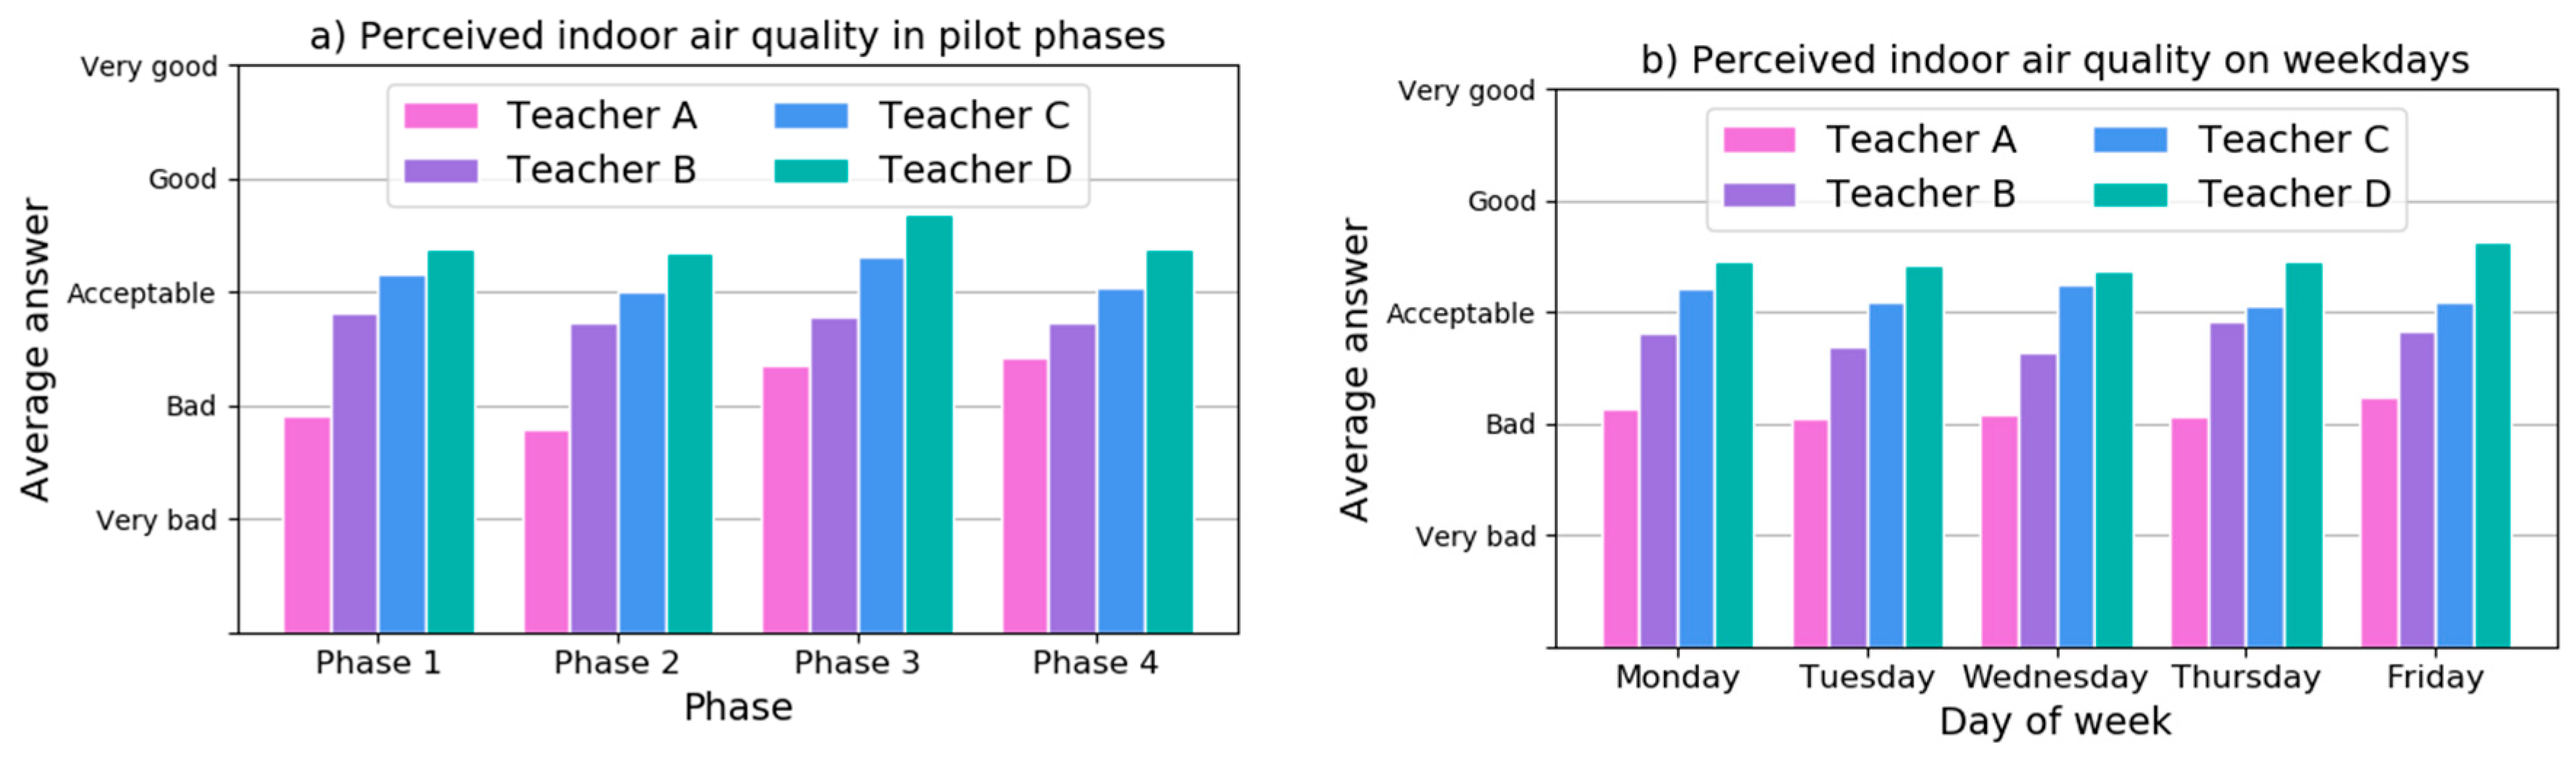
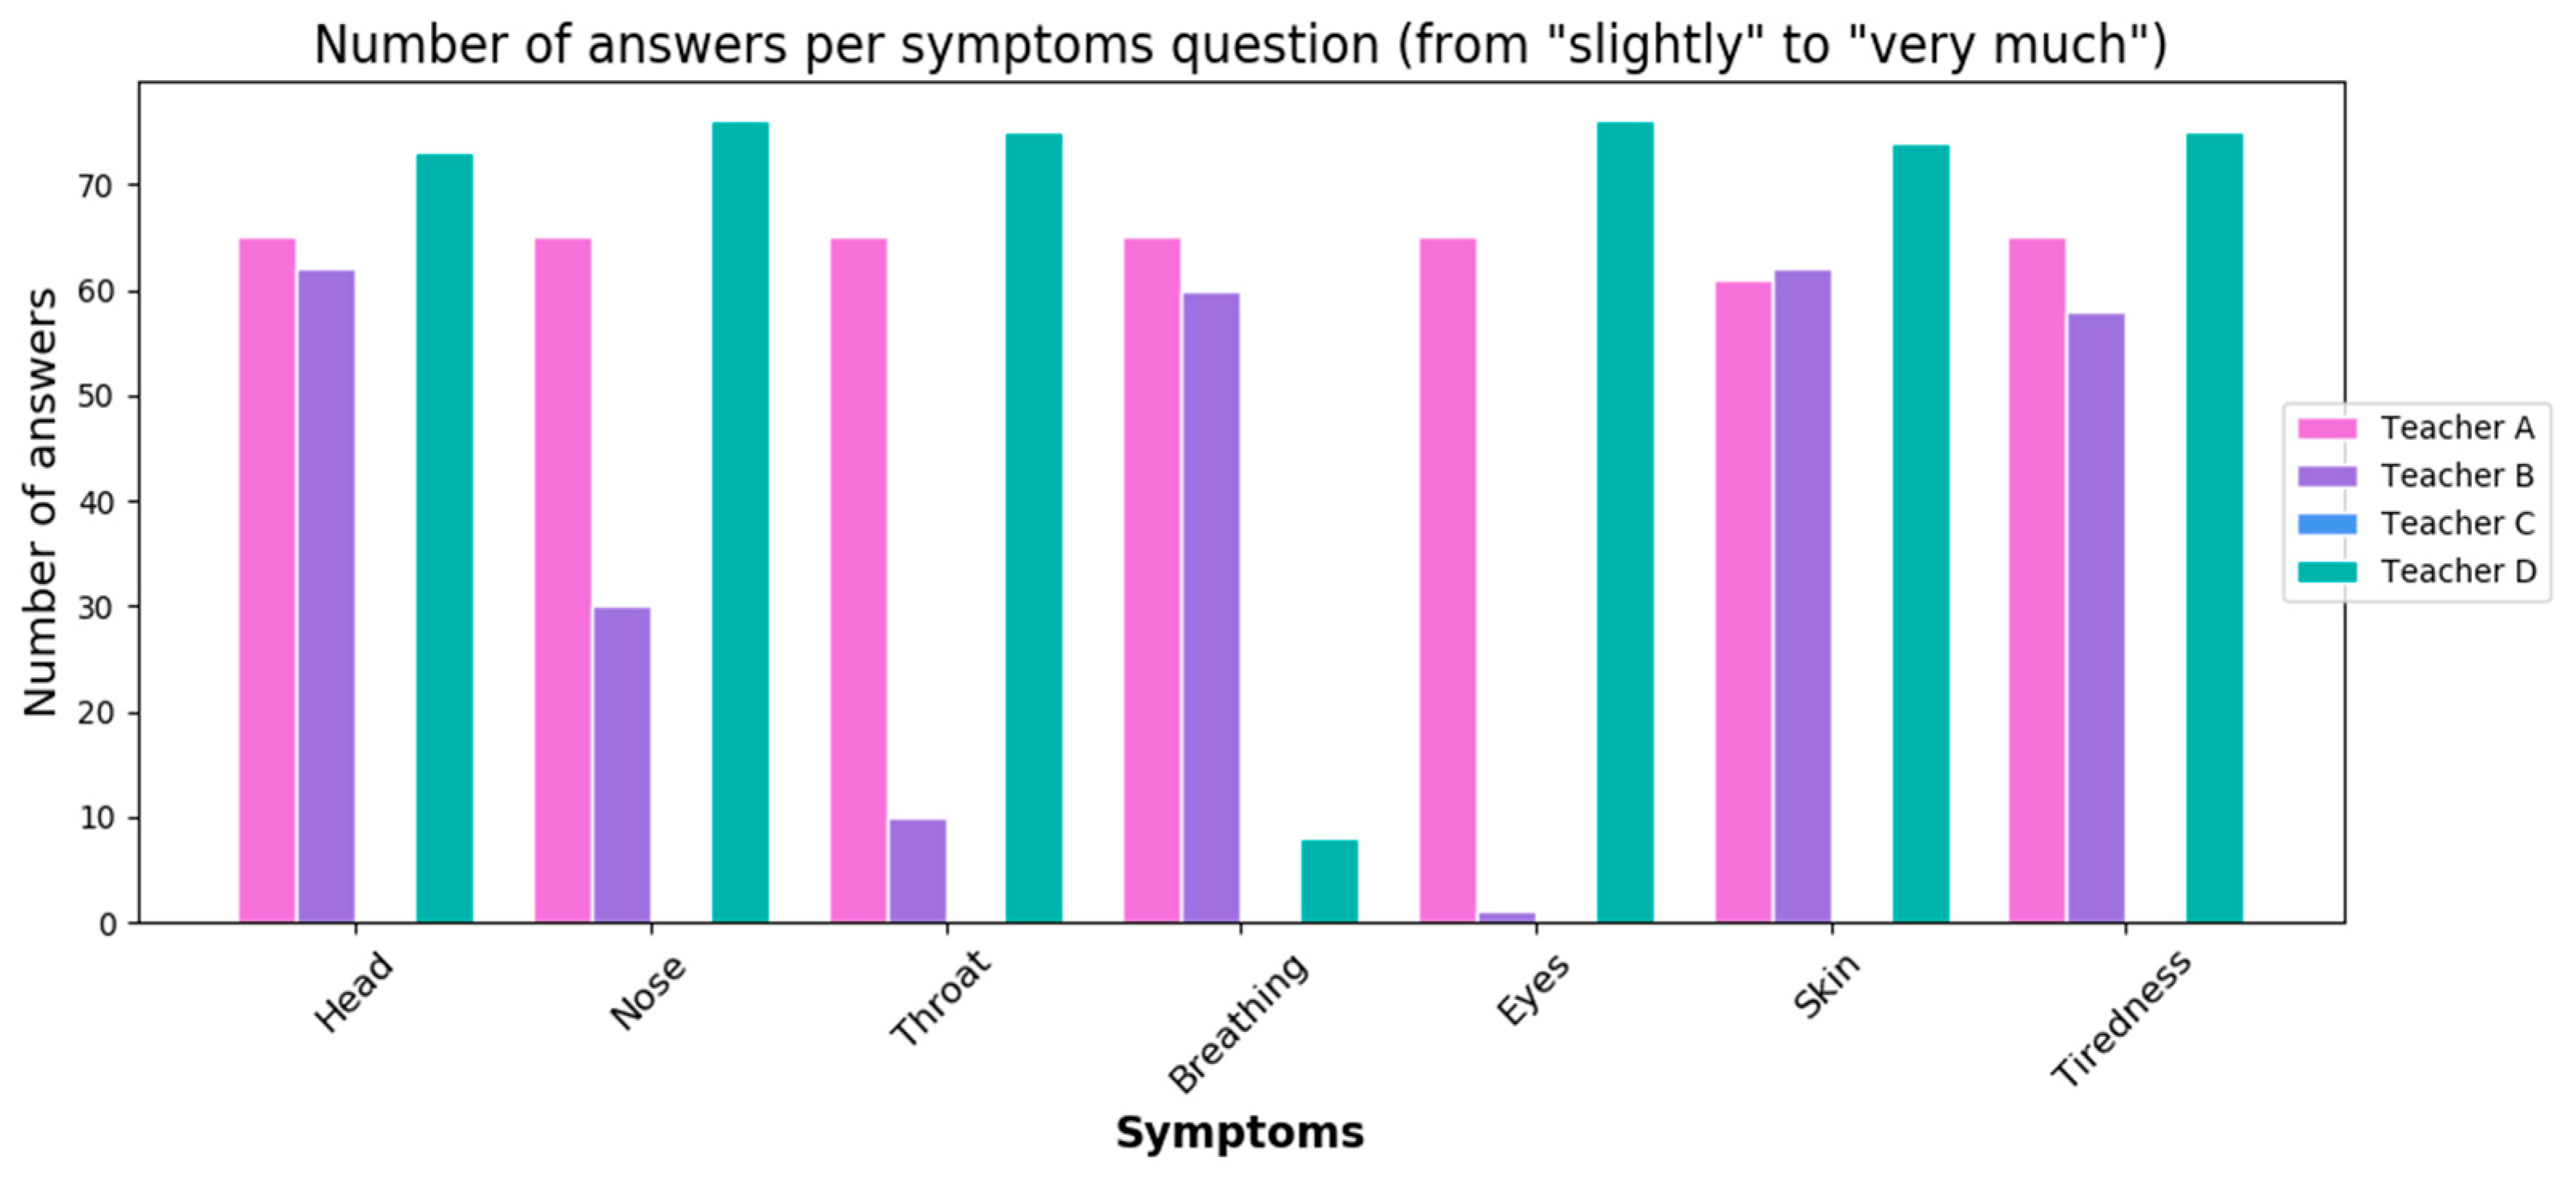
3.1. Self-Reporting Application Answers

The four teachers participating in the study answered 569 questionnaires during the 18-week pilot. The number of questionnaire notifications was 10 per week for each teacher (five days a week, morning and afternoon questionnaire each day). Figure 2 presents the number of answered questionnaires per week per teacher. On average, we got eight answers per teacher each week. The minimum number of answered questionnaires was 3 and the maximum number was 12 within one week. The numbers in Figure 2 include both answers for the timed questionnaires through notifications and those reported through the “Report here” functionality.
The average answers to the question on perceived IAQ during different phases of the pilot are presented in Figure 3a. Teachers in building 1 (A and B) seem to have given consistently lower ratings for the IAQ compared with teachers in building 2 (C and D). However, the average answer of teacher A was increased during phases 3 and 4 compared with the previous pilot phases. In phase 1, teacher A experienced the IAQ as bad, when the other teachers described it to be closer to acceptable or over the acceptable level. Seeing the visualizations of the measured air quality did not significantly affect perceived air quality in phase 2. In phase 3, the air purifiers were with teachers B and C. Teacher C reported more acceptable air quality compared with the previous phase, but teacher B did not find any improvement. Both teachers A and D reported improved air quality even if they had mock-up purifiers in their classrooms. In phase 4, teachers A and D did not report any improvement in air quality even if they had the real purifiers. However, teachers B and C reported a decrease in the air quality in their classrooms when the purifiers were changed from the real ones to mock-up purifiers.
The average answers to question on perceived indoor air quality on different weekdays during the whole pilot are presented in Figure 3b. Teachers seemed to answer the question similarly, independent from the day of the week.
The most notable difference between the two buildings was in perceived air humidity. Teachers in building 1 (A and B) both considered the indoor air as dry during the whole pilot, whereas teachers in building 2 (C and D) considered the air humidity to be neutral. Visualizations (phase 2) or purifiers (phases 3 and 4) did not change the perceived air humidity.
Figure 4 presents the number of reported symptoms (answer values from “slightly” to “very much”) during the whole pilot. Teacher C did not report any symptoms and teacher A reported most consistently different types of symptoms on the head, nose, throat, breathing, eyes, skin, and tiredness. Teacher D had the highest number of reported symptoms in all the other categories, except breathing.
Table 4 presents the average and standard deviation values for the questions (presented in Table 1 and Table 2) during the whole pilot for each teacher. In general, the lowest values were from teacher A. For example, she reported being quite tired in the mornings on average. She perceived the air quality as bad, stuffy, and dry. She also experienced more negative stress than the other teachers. On the contrary, teacher D answered most positively to the questions on average. The teachers complained the least about the odors and dry air seemed to bother them the most in building 1.

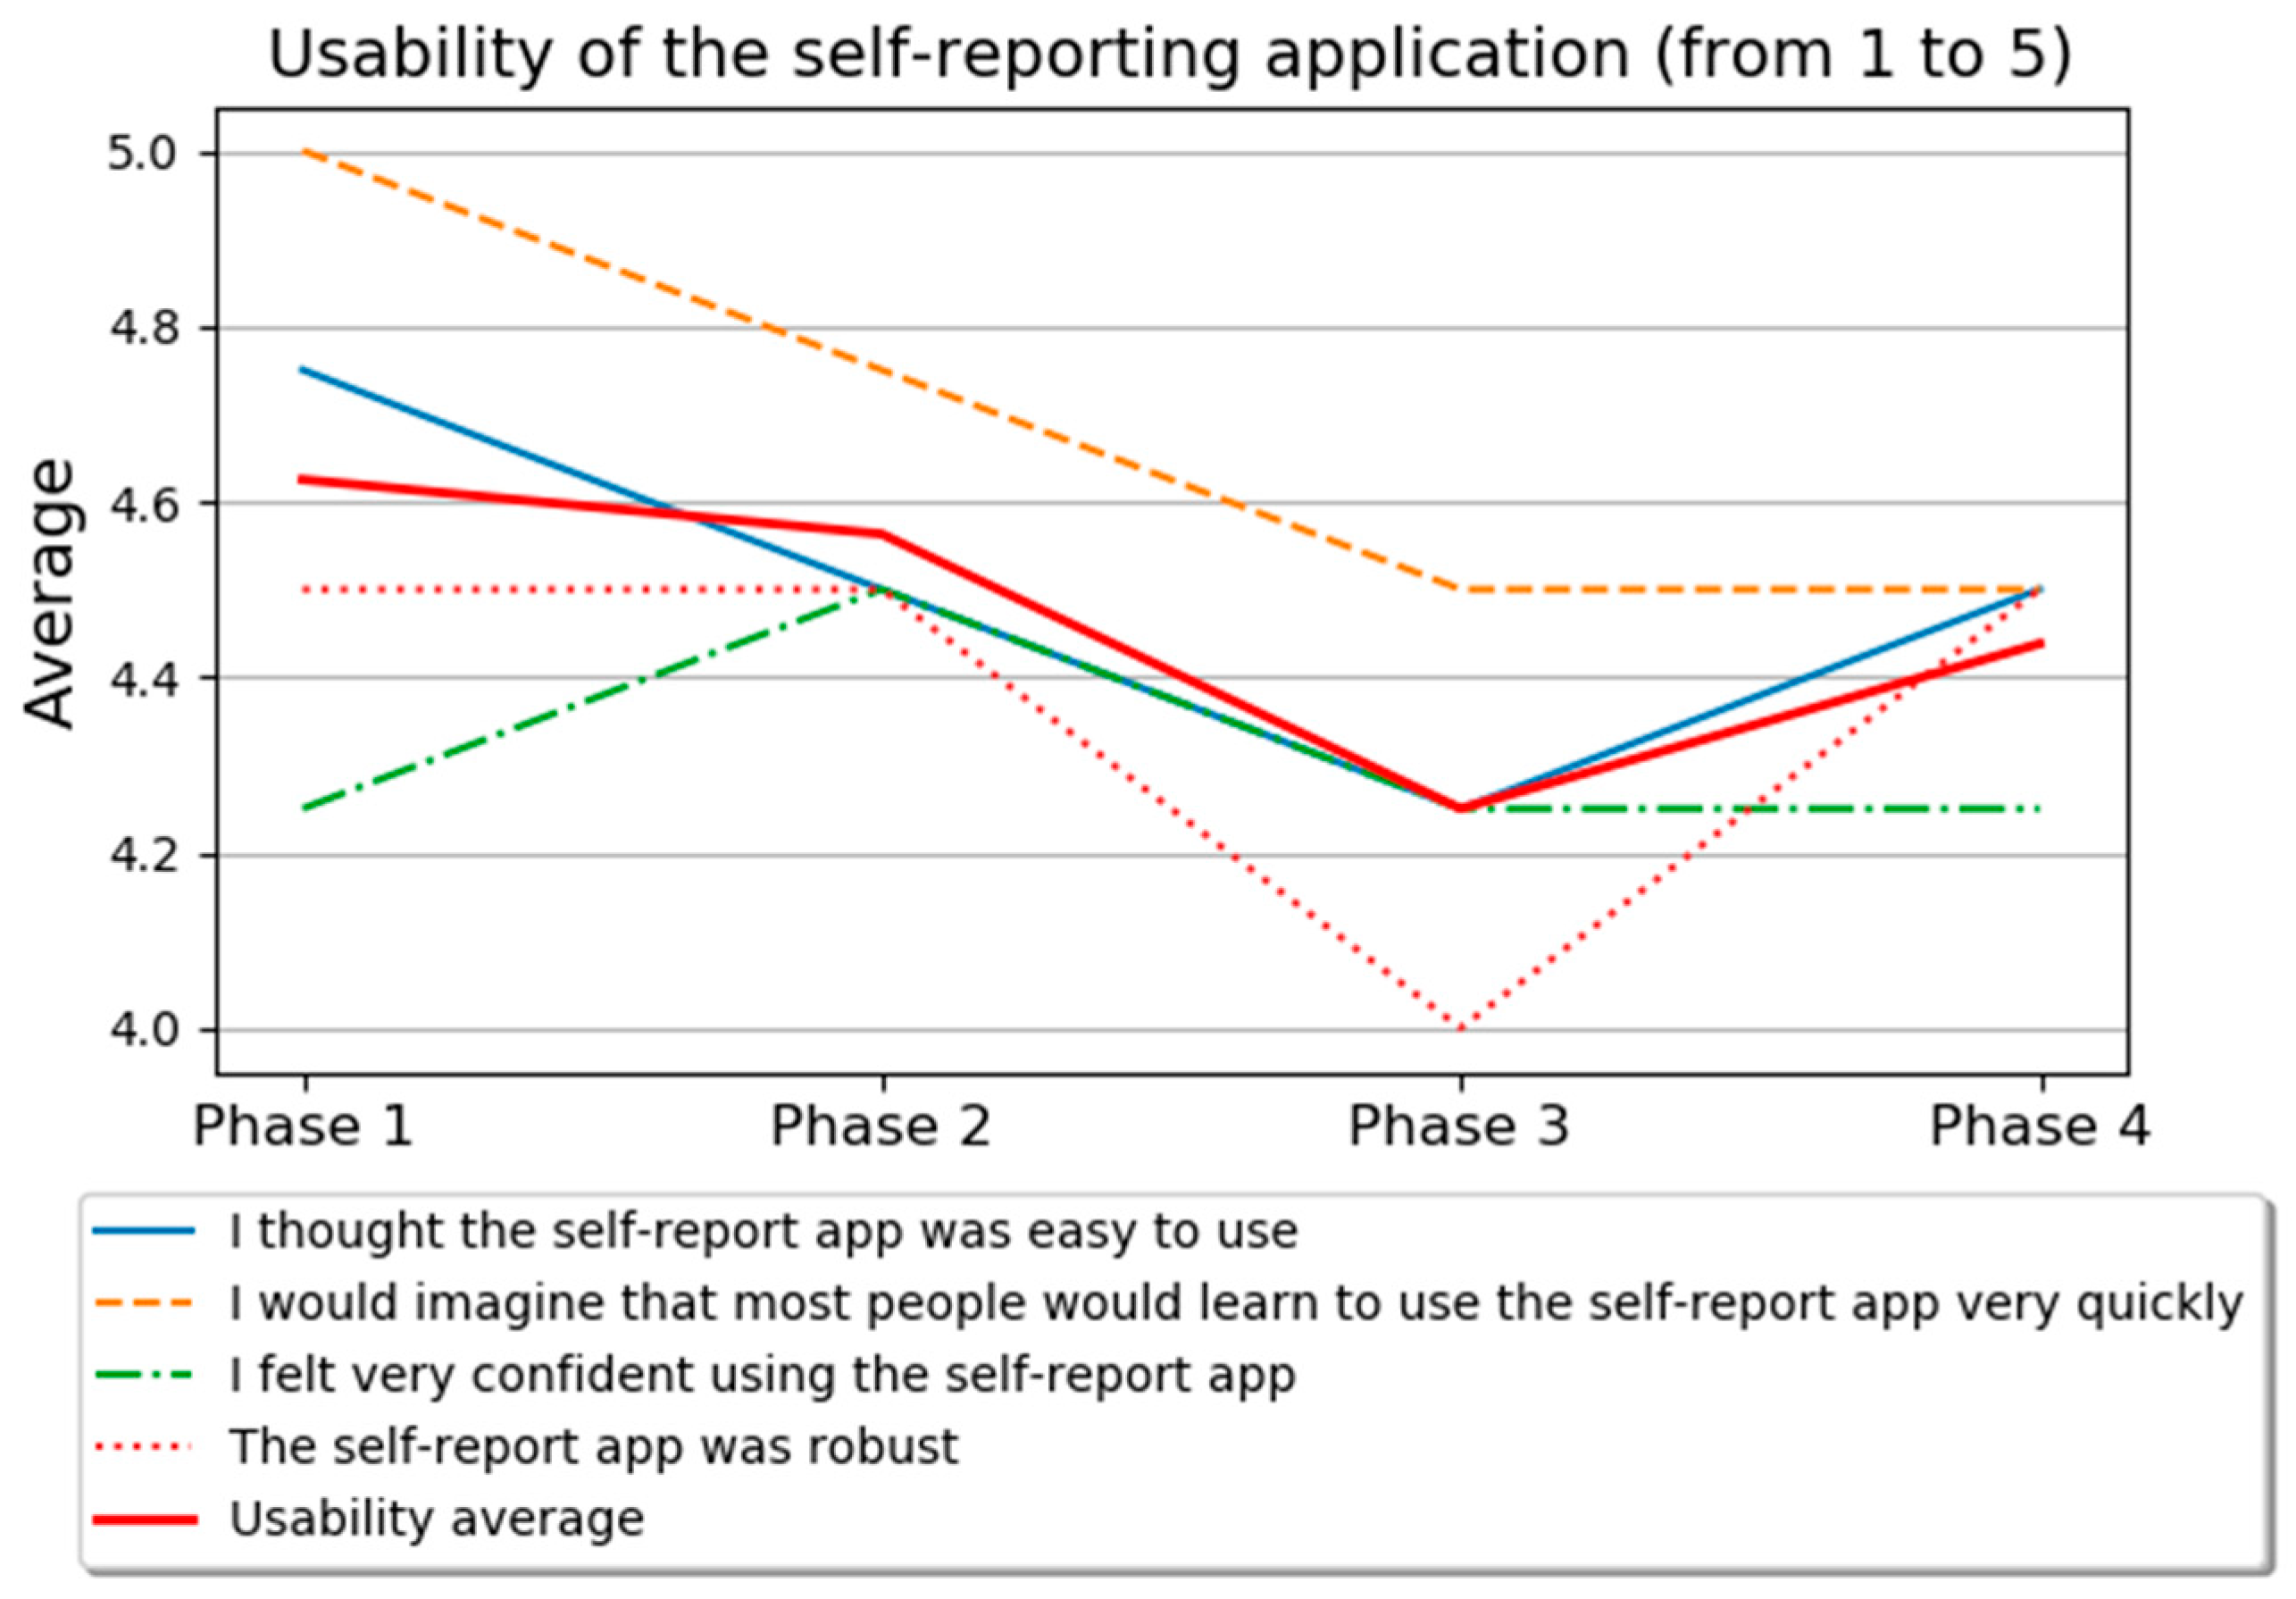
3.2. User Experience Results

User experience related to the self-reporting app was received from all the participant teachers (N = 4). Four usability items were tracked at each pilot phase and their averages are illustrated in Figure 5. The average of usability items remains quite good throughout the pilot, above 4.2, even though, after phase 3, there is a slight decrease in all of the items. Already, in the beginning of phase 1, teachers felt that most people would learn to use the self-reporting application very quickly—it was easy to use, they were confident using it, and it was robust. At the end of the pilot, usability was measured with a more extensive questionnaire, the system usability scale (SUS). The scores are calculated according to the work of [21] and range between 0 and 100. The average SUS score was 78.1.
The usefulness at the end of the pilot was evaluated to be mediocre, 6.75 in the scale from 1 to 10. The intention to use at the end was also mediocre, 3.25 in the scale 1 to 5. Teachers’ satisfaction towards the self-reporting application was measured at every phase with the net promoter score (NPS). It decreased towards the end of the pilot. NPS was formed based on the percentage of promoters (answer 9 or 10) minus the percentage of detractors (answer 6 or less) scale ranging from −100 to 100 and was measured at each phase [20]. In the beginning of the pilot, at phase 1, the average satisfaction was on a very good level of 50. At phase 2, the NPS was 25, and at phase 3 and phase 4, the NPS ended up at a mediocre level of 0.
In their open feedback at the end of phase 1, the teachers considered the application as clear and easy to use. They appreciated that there were a lot of answer alternatives for the questions and the possibility to elaborate on the answers further. However, one participant would have wanted a longer time window for the questionnaire to be available. One of the participants felt the answers were repeating themselves and she was answering similarly all the time. In phase 2, this issue was brought up by all the respondents. They said that the answers were almost always the same and they repeating themselves, which made answering heavy and boring. The frustration continued in phases 3 and 4, as they felt their answers still stayed almost the same. One of the participants suggested that there could be a button for reporting “situation has not changed” and previous answers would be copied. The busy afternoons, when there was, for instance, a meeting after the class, were the most difficult times to remember to answer the questionnaires.

4. Discussion

In this study, the self-reporting application was developed to capture perceived IAQ as experienced by the facility users. The application was tested and evaluated in an 18-week pilot in a school environment by four teachers. During the long-term pilot, adherence was on a very good level; teachers participated actively by answering on average eight of ten questionnaires each week. Usability of the self-reporting application was evaluated to be good. The application was easy to learn to use, easy to use, and robust. In addition, satisfaction was very good at the beginning. The drop of satisfaction to a mediocre level at the end of the pilot might be because of the pilot setting, where reporting was requested twice a day even when the respondents perceived no changes in the situation. An advantage of our application was that the teachers participating in the study did not report any technical problems and, as can be seen from the response rates, the teachers answered the questions consistently throughout the study. Mobile phone as a channel for reporting seems to have great potential, as it is usually close by and easily available. Furthermore, it enables a reminder functionality that diminishes the possibility of forgetting the reporting. A strength in our approach was that we asked the perceived IAQ continuously from the same respondents over several months, enabling inspection of long-term trends and possible slow changes in the conditions. This kind of study has not been reported previously.
The application questions seem to be able to detect differences in IAQ conditions. In general, teachers in building 1 gave lower ratings for IAQ compared with teachers in building 2, and they also reported dry air. The day of the week did not affect perceived IAQ. In both buildings, the ventilation is usually turned off during the weekends, but the perceived IAQ did not differ on Monday compared with other week days. This study investigated whether seeing objective IAQ measurement results would change how the facility users perceive IAQ, but the provided visualizations did not affect the perceived IAQ of the pilot participants. The effect of the air purifier on perceived IAQ was, however, contradictory. There was an increase in perceived IAQ with both the real and mock-up purifiers, but also a decrease with the real one. In this case, however, each of the respondents were in different rooms and reported their perceptions regarding that. Another consideration is that the school environment is complex, and many physical, physiological, and psychological factors can influence the perceived IAQ [22]. In the future, the effect of air purifiers should be studied with several people in the same room. The cross-over setup used in this study enables investigation into whether expectations alter how the person is perceiving the IAQ, that is, whether bringing mock-up purifiers falsely increases the perception of better air quality.
In the work of [14], dry or stuffy air were the most commonly reported IAQ problems, and sore throat, hoarseness, headache, eye symptoms, and stuffiness were the most common symptoms. Tiredness was also reported by pupils [14]. In our study, teacher C did not report any head, nose, throat, breathing, eyes, skin, or tiredness symptoms during the pilot, and she felt that the IAQ was on an acceptable level. Teacher D in the same building reported the highest number of symptoms in most of the categories, but also the most positive perceived IAQ. So, the perceived IAQ did not explain her symptoms. Teacher A in another building reported most consistently different types of symptoms and she evaluated the IAQ on the lowest level. There seem to be notable differences in how different people perceive IAQ.
These findings cannot be generalized widely, especially because of the rather small number of participants. Participants tended to have only little variety with their answers and reported that answering was heavy and boring when the answers were almost the same during the long pilot. However, it is not clear whether people would actually answer on-demand with the application if it is not reminded. This kind of practice was needed to implement the pilot. In the future, in commercial solutions, it would be valuable to adapt the application so that it, for example, sends invitations for questionnaires when the IAQ sensors sense changing IAQ values. The advantage of this kind of application is, for example, real-time reporting of perceived IAQ conditions for the facility owners, enabling a fast reaction to changes in IAQ or problems in ventilation.

5. Conclusions

This paper introduced a novel self-reporting application for collecting perceived IAQ data and symptoms caused by poor IAQ in a frequent manner from facility users. The four school teachers participating in the 18-week feasibility study evaluated the application as useful and usable. The questionnaires designed for the application seem to be able to detect differences in perceived IAQ between facility users. Adherence was on very good level during the pilot, although the reporting frequency of twice a day became heavy over the long term. The application should be adapted in the future and possibly include sensor information for the dynamic timing of the questionnaires.

Author Contributions

Conceptualization, all authors; writing—original draft preparation, visualization, H.S.; formal analysis, H.S. and S.M.; investigation, S.M.; software, data curation, J.R.; writing—review & editing, all authors; project administration, K.V.; funding acquisition, J.K. and K.V.

Funding

This research was conducted as part of ESTABLISH ITEA3 project by funded by Business Finland and VTT Technical Research Centre of Finland Ltd., grant number 15008.

Acknowledgments

The authors would like to thank the pilot participants for their active and significant role in the pilot. Special thanks to our former colleague, Dan Bendas, for implementing the first version of the self-reporting application software. The pilot was designed and implemented in collaboration with UniqAir, CGI, and InspectorSec.

Conflicts of Interest

The authors declare no conflict of interest.

References

  1. WHO. Evolution of WHO Air Quality Guidelines: Past, Present and Future; Copenhagen: WHO Regional Office for Europe: København, Denmark, 2017. [Google Scholar]
  2. Brasche, S.; Bischof, W. Daily time spent indoors in German homes—Baseline data for the assessment of indoor exposure of German occupants. Int. J. Hyg. Environ. Health 2005, 208, 247–253. [Google Scholar] [CrossRef] [PubMed]
  3. Annesi-Maesano, I.; Baiz, N.; Banerjee, S.; Rudnai, P.; Rive, S.; The SINPHONIE Group. Indoor Air Quality and Sources in Schools and Related Health Effects. J. Toxicol. Environ. Health Part B 2013, 16, 491–550. [Google Scholar] [CrossRef] [PubMed]
  4. Jones, A.P. Indoor air quality and health. Atmos. Environ. 1999, 33, 4535–4564. [Google Scholar] [CrossRef]
  5. Redlich, C.A.; Sparer, J.; Cullen, M.R. Sick-building syndrome. Lancet 1997, 349, 1013–1016. [Google Scholar] [CrossRef] [PubMed]
  6. Sundell, J.; Levin, H.; Nazaroff, W.W.; Cain, W.S.; Fisk, W.J.; Grimsrud, D.T.; Gyntelberg, F.; Li, Y.; Persily, A.K.; Pickering, A.C.; et al. Ventilation rates and health: Multidisciplinary review of the scientific literature. Indoor Air 2011, 21, 191–204. [Google Scholar] [CrossRef] [PubMed]
  7. Wargocki, P.; Wyon, D.P. Ten questions concerning thermal and indoor air quality effects on the performance of office work and schoolwork. Build. Environ. 2017, 112, 359–366. [Google Scholar] [CrossRef]
  8. Bakó-Biró, Z.; Clements-Croome, D.J.; Kochhar, N.; Awbi, H.B.; Williams, M.J. Ventilation rates in schools and pupils’ performance. Build. Environ. 2012, 48, 215–223. [Google Scholar] [CrossRef]
  9. Haverinen-Shaughnessy, U.; Shaughnessy, R.J. Effects of Classroom Ventilation Rate and Temperature on Students’ Test Scores. PLoS ONE 2015, 10, e0136165. [Google Scholar] [CrossRef] [PubMed]
  10. Wyon, D.P.; Wargocki, P. How Indoor Environment Affects Performance. ASHRAE J. 2013, 55, 46–48, 50, 52. [Google Scholar]
  11. Spinelle, L.; Gerboles, M.; Kok, G.; Persijn, S.; Sauerwald, T.; Spinelle, L.; Gerboles, M.; Kok, G.; Persijn, S.; Sauerwald, T. Review of Portable and Low-Cost Sensors for the Ambient Air Monitoring of Benzene and Other Volatile Organic Compounds. Sensors 2017, 17, 1520. [Google Scholar] [CrossRef] [PubMed]
  12. Aguilera, T.; Lozano, J.; Paredes, J.A.; Álvarez, F.J.; Suárez, J.I.; Aguilera, T.; Lozano, J.; Paredes, J.A.; Álvarez, F.J.; Suárez, J.I. Electronic Nose Based on Independent Component Analysis Combined with Partial Least Squares and Artificial Neural Networks for Wine Prediction. Sensors 2012, 12, 8055–8072. [Google Scholar] [CrossRef] [PubMed]
  13. Langer, S.; Ramalho, O.; Le Ponner, E.; Derbez, M.; Kirchner, S.; Mandin, C. Perceived indoor air quality and its relationship to air pollutants in French dwellings. Indoor Air 2017, 27, 1168–1176. [Google Scholar] [CrossRef] [PubMed]
  14. Järvi, K.; Vornanen-Winqvist, C.; Mikkola, R.; Kurnitski, J.; Salonen, H. Online Questionnaire as a Tool to Assess Symptoms and Perceived Indoor Air Quality in a School Environment. Atmosphere 2018, 9, 270. [Google Scholar] [CrossRef]
  15. Andersson, K. Epidemiological Approach to Indoor Air Problems. Indoor Air 1998, 8, 32–39. [Google Scholar] [CrossRef]
  16. Raw, G.J.; Roys, M.S.; Whitehead, C.; Tong, D. Questionnaire design for sick building syndrome: An empirical comparison of options. Environ. Int. 1996, 22, 61–72. [Google Scholar] [CrossRef]
  17. Elo, A.-L.; Leppänen, A.; Jahkola, A. Validity of a single-item measure of stress symptoms. Scand. J. Work Environ. Health 2003, 29, 444–451. [Google Scholar] [CrossRef] [PubMed]
  18. Wargocki, P.; Wyon, D.P.; Baik, Y.K.; Clausen, G.; Fanger, P.O. Perceived Air Quality, Sick Building Syndrome (SBS) Symptoms and Productivity in an Office with Two Different Pollution Loads. Indoor Air 1999, 9, 165–179. [Google Scholar] [CrossRef] [PubMed]
  19. Maula, H.; Hongisto, V.; Naatula, V.; Haapakangas, A.; Koskela, H. The effect of low ventilation rate with elevated bioeffluent concentration on work performance, perceived indoor air quality, and health symptoms. Indoor Air 2017, 27, 1141–1153. [Google Scholar] [CrossRef] [PubMed]
  20. Reichheld, F.F. The One Number You Need to Grow. Harv. Bus. Rev. 2003, 81, 46–55. [Google Scholar] [PubMed]
  21. Brooke, J. System Usability Scale; Digital Equipment Corporation: Reading, UK, 1986. [Google Scholar]
  22. Finell, E.; Haverinen-Shaughnessy, U.; Tolvanen, A.; Laaksonen, S.; Karvonen, S.; Sund, R.; Saaristo, V.; Luopa, P.; Ståhl, T.; Putus, T.; et al. The associations of indoor environment and psychosocial factors on the subjective evaluation of Indoor Air Quality among lower secondary school students: A multilevel analysis. Indoor Air 2017, 27, 329–337. [Google Scholar] [CrossRef] [PubMed]
Figure 1. Screenshots from the self-reporting application.
Proceedings 31 00047 g001
Figure 2. Number of answered questionnaires per week for each teachers A–D.
Proceedings 31 00047 g002
Figure 3. (a) Average answers for perceived indoor air quality question during different pilot phases. (b) Average answers for perceived indoor air quality question on different weekdays.
Proceedings 31 00047 g003
Figure 4. Number of reported symptoms per teacher during the pilot.
Proceedings 31 00047 g004
Figure 5. Usability items related to self-report application by phase.
Proceedings 31 00047 g005
Table 1. Questions in the morning questionnaire.
QuestionAnswer Alternatives
(M1) How rested you felt in the morning?Very tiredQuite tiredNot rested nor tiredQuite restedVery rested
(M2) How would you estimate at the moment the indoor air quality ? *Very badBadAcceptableGoodVery good
(M3) How would you estimate at the moment the freshness of air?Extremely stuffyStuffyNeutralFreshExtremely fresh
(M4) How would you estimate at the moment the odor intensity?Unbearable odor Strong odorModerate odorSlight odorNo odor
(M5) How would you estimate at the moment the temperature?HotWarmNeutralCoolCold
(M6) How would you estimate at the moment the air humidity?Extremely dryDryNeutralHumidExtremely humid
(M7) How would you estimate at the moment the noise level?Extremely noisyNoisyNeutralquietExtremely quiet
* Indoor air quality is affected by oxygen level, odors, temperature, noise, and humidity.
Table 2. Questions in the afternoon questionnaire.
QuestionAnswer Alternatives
(A1) There is positive and negative stress. What kind of stress you felt today? * Strong negative stressNegative stressNeutralPositive stressStrong positive stress
(A2) How productively did you work today?Much less productively than usually Less productively than usually As usuallyMore productively than usuallyMuch more productively than usually
(A3) How would you estimate at the moment the indoor air quality? **Very badBadAcceptableGoodVery good
(A4) Are you bothered at the moment by the indoor air quality of your office? (Indoor air quality is affected by odour, temperature, air humidity and noise for example).NoYes (If answer = YES, questions M3–M7 from the morning questionnaire are repeated)
(A5) Do you have at the moment indoor air quality related symptoms? (Symptoms can be headache, nausea, breathing problems etc.)NoYes (If answer = YES, eight follow-up questions: Do you have at the moment X symptoms?) Answer alternatives: not at all, slightly, to some extent, quite a lot, very much X = head/nose/throat/breathing/eye/skin/nausea/tiredness
(A6) Which of the following actions did you do during the day for improving indoor air quality?Nothing, Opened a window, Opened a door, Adjusted air condition, Adjusted thermostat, Something else
(A7) How would you estimate calmness/restlessness of the pupils today?Extremely restlessRestlessNeutralCalmExtremely calm
(A8) How would you estimate the concentration of the pupils today?Extremely non-concentratedNon-concentratedNeutralConcentratedExtremely concentrated
* Positive stress = enthusiasm, excitement, determination, or inspiration due to a current or recent challenge (e.g., the feeling when you successfully solve a difficult problem). Negative stress = distress, nervousness, or anxiety due to the current or recent challenge (e.g., fear of failure). ** Indoor air quality is affected by the oxygen level, carbon dioxide level, odours, temperature, noise, and humidity, for example.
Table 3. User experience questions asked in phases 1–4 (marked as P1–P4).
QuestionP1P2P3P4Scale
Self-report app was robust.xxxx5-point Likert
I thought the self-report app was easy to use.xxxx5-point Likert
I would imagine that most people would learn to use the self-report app very quickly.xxxx5-point Likert
I felt very confident using the self-report app.xxxx5-point Likert
How likely is it that you would recommend self-report app to a friend or colleague?xxxx11-Point
I think that I would like to use the self-report app frequently. x5-point Likert
I found the self-report app unnecessarily complex. x5-point Likert
I think that I would need the support of a technical person to be able to use the self-report app. x5-point Likert
I found the various functions in the self-report app were well integrated. x5-point Likert
I thought there was too much inconsistency in the self-report app. x5-point Likert
I found the self-report app very cumbersome to use. x5-point Likert
I needed to learn a lot of things before I could get going with the self-report app. x5-point Likert
How useful did you perceive the self-report app? x10-point
I would use self-report app in the future. x5-point Likert
Open feedback (“What did you think about the self-report app? What was good/bad about it?”, “Tell, what kind of thoughts or comments related to self-report app you have?”)xxxxOpen
What kind of feedback you would like to give about the usability of the self-report app?x Open
Table 4. Average and standard deviation of answer values on a scale of 1 to 5 during the whole pilot *.
Teacher ATeacher BTeacher CTeacher D
QuestionAveragestdAveragestdAveragestdAveragestd
M11.720.512.740.822.470.943.310.78
M2/A32.110.522.770.493.150.493.460.64
M32.130.632.700.522.860.482.970.70
M44.740.504.140.864.640.614.840.37
M52.390.803.490.813.050.283.090.34
M61.970.302.040.203.000.002.990.18
M73.400.613.860.564.010.923.930.32
A12.150.502.610.522.880.523.010.50
A22.420.533.000.393.080.413.000.40
A72.700.552.850.592.560.562.940.47
A82.770.582.860.582.980.283.010.55
* Value 1 represents negative/low values, e.g., “very bad air quality” or “extremely dry air”, and 5 represents positive/high values, such as “very good air quality” or “extremely humid air”. The questions behind these answers can be found in Table 1 and Table 2.
Publisher’s Note: MDPI stays neutral with regard to jurisdictional claims in published maps and institutional affiliations.

