Proceeding Paper

People-as-a-Service Dilemma: Humanizing Computing Solutions in High-Efficiency Applications †

1
Department of Telematics Systems Engineering, Universidad Politécnica de Madrid, Madrid 28040, Spain
2
Department of Geospatial Engineering, Universidad Politécnica de Madrid, 28031 Madrid, Spain
*
Author to whom correspondence should be addressed.
To be presented at 13th International Conference on Ubiquitous Computing and Ambient Intelligence UCAmI 2019, Toledo, Spain, 2–5 December 2019. ‬‬‬‬‬‬‬‬‬‬‬‬‬‬‬‬‬‬‬‬‬‬‬‬‬‬‬‬‬‬
Proceedings 2019, 31(1), 39; https://doi.org/10.3390/proceedings2019031039
Published: 20 November 2019

Abstract

:
Next-generation computing solutions, such as cyber-physical systems or Industry 4.0, are focused on increasing efficiency in process execution as much as possible. Removing unproductive delays or keeping infrastructures operating at their total capacity are typical objectives in these future systems. Decoupling infrastructure providers and service providers using Anything-as-a-Service (XaaS) paradigms is one of the most common approaches to address this challenge. However, many real scenarios not only include machines or controllers but also people and workers. In this case, deploying process execution algorithms and XaaS solutions degenerates in a People-as-a-Service scenario, which poses a critical dilemma: Can highly efficient production scenarios guarantee people’s wellbeing? In this paper, we address this problem and propose a new process execution algorithm based on a novel understanding of efficiency. In this case, a humanized efficiency definition combining traditional efficiency ratios and wellbeing indicators is used to allocate tasks and assign them to different existing workers. In order to evaluate the proposed solution, a simulation scenario including social and physical elements was built. Using this scenario, a first experimental validation was carried out.

1. Introduction

Many innovative computing solutions have been reported in the last 15 years: cyber-physical systems (CPS) [1], edge computing [2], Industry 4.0 [3], and so forth. All of them, nevertheless, share some common characteristics. First, all of them are distributed solutions, where many different physical agents support the execution of high-level services [4]. These agents may be very heterogenous, including resource-constrained controllers, legacy systems, traditional hosts, and even people. Second, they are all service-oriented mechanisms [5]. Usually, these solutions define high-level services through the coordination of low-level agents with very heterogenous behavior, so end users are not aware of how services are finally provided. Third, they are all focused on providing services with the highest possible efficiency [6]. Process and task allocation and execution algorithms are deployed at a high level to ensure services have the lowest cost and highest quality. Typical unproductive factors, such as delays, oversized infrastructures, or defective executions, are avoided and removed, maintaining the workload of physical agents as high as possible in a continuous manner.
This purpose is very interesting from an economic and engineering point of view, and it is the basis of new concepts such as digitalization [7] and circular economy [8]. In fact, in order to achieve greater levels of specialization and economic efficiency, traditional businesses have been divided into smaller units, which are much more profitable. Typically, service providers and infrastructure providers have broken down their traditional integrated supply chains and have created different and independent businesses. To increase the profitability of this new approach, Anything-as-a-Service (XaaS) paradigms [9] are usually employed. In a XaaS model, infrastructure providers do not sell or rent physical agents but offer their execution capacity as a service, commonly through the Internet. With this technique, physical infrastructures may operate continuously at their full capacity, with no delays, as different slices (rented by different service providers) may be assembled to reach this objective. Thus, fixed costs (boot procedures, configuration delays, etc.) decrease and economic (energetic, operative, etc.) efficiency increases.
However, as previously stated, physical agents are very heterogeneous and, in particular, people may be involved [10]. In this case, people are put under a XaaS work model, which degenerates (in the end) into a People-as-a-Service approach. People, contrary to engineered solutions, tend to preserve their wellbeing instead of system efficiency. Rest periods, human errors, holidays, regulatory limitations, and so forth, are (from the sociological point of view) the most important aspects to be considered when people are working. Nevertheless, efficient process execution algorithms are not aware of how services are supported or provided, and they may penalize tasks performed by humans due to their low efficiency. As a reaction in a People-as-a-Service scenario, work conditions tend to decrease (as well as people’s wellbeing), and workers are treated and managed in a very dehumanizing and alienating manner.
In that way, a dilemma arises: Can highly efficient production scenarios guarantee people’s wellbeing? In a trivial approach, people will be removed from processes, but some procedures must be performed by humans or (such as in handmade products) humans are the critical added value. On the other hand, in the most popular current trend, people are forced to behave as machines, that being the ideal of perfection. Nevertheless, the consequences of this unnatural manner of managing people have some critical long-term consequences (depression, unproductivity, etc.) that are now strongly arising. The authors argue in this work that the solution is to adapt process execution algorithms to humanized scenarios through new and innovative mechanisms looking for a balance between efficiency and wellbeing.
Therefore, this paper proposes a new humanized process execution algorithm. The algorithm is high level, so it is compatible with any other existing task execution solution, low-level infrastructure, or business. In this work, a new indicator is proposed (named “wellbiciency”) that represents a combination of process execution efficiency and people’s wellbeing. Using this new indicator as a reference, the proposed algorithm tries to optimize its value dynamically according to the system situation. As a result, the obtained system behavior should preserve both economic profitability and people’s wellbeing.
The rest of the paper is organized as follows: Section 2 describes the state of the art on humanized computing, especially process execution solutions. Section 3 presents the proposed technological contribution, including the mathematical formalization of the wellbiciency indicator and the final humanized algorithm. Section 4 describes the experimental validation and its results, which was employed to evaluate the performance of the proposed solution. Section 5 concludes the paper.

2. State of the Art

Works on humanized computing, although a very relevant pending challenge, are still rare nowadays. Most works on this topic actually focus on innovate manners of managing and performing human–computer interactions (HCIs).
The first time the idea of humanizing computing systems appeared was in approximately 2000. Classic computer theory considers a central process unit connected to a set of peripheral devices, through which users can “ask for” actions that should be performed by the processor [11]. In that way, it could be said that computers and people establish a dialogue at a certain level of abstraction. This traditional manner of interaction with computers is called “explicit interactions”, as (at every moment) users are aware of the expected behavior from the computer when they explicitly trigger a task or an action execution. However, in 2000, Albrecht Schmidt proposed a new paradigm called “implicit human–computer interactions” [12]. An implicit interaction is any user action that is not primarily focused on obtaining a response from computers, but to which processing devices respond as they are programmed to understand that stimulus. In this way, Schmidt proposed that processing devices should be aware of an environment’s evolution and its inhabitants, collecting information about them though sensors and actuators and obtaining some understanding of events in the physical world. The final objective of this new approach is to humanize computing systems, devices, and solutions. To date, thousands of works have analyzed how to support implicit HCIs. For example, recently, wearable devices have proved to be a valid interface between humans and hosts [13]. Systems using commercial sensors [14], transparent solutions based on super senses [15], and high-tech mechanisms based on, for example, leap motion [16] have been proposed. From a theoretical point of view, other ideas such as people-oriented interfaces [17] have been also reported.
On the other hand, some works have proposed mathematical frameworks to extract hidden information from people and, thus, feed algorithms in CPS, Industry 4.0, or ambient intelligence solutions. Specifically, emotional interfaces [18], where people’s emotions are analyzed, have been defined. Other proposals based on brain signals have also been reported [19], and works discussing how to apply psychology to humanize computing [20] and software [21] are also common. Initial applications of physiological theories to Industry 4.0 have also been reported that consider human motivation and Maslow’s proposals [22]. A very large group within this area is human task recognition. Many works based on artificial intelligence [23,24] of pattern recognition [25,26] techniques may be found.
Finally, a small group of heterogenous works on humanizing computing have been reported. For example, there are articles about how to humanize process models and definitions [10]. Moreover, self-configuration technologies for humanized systems [27] may also be found.
The proposed solution in this paper belongs to this last group, as it may be integrated with previous humanized technologies to build a real humanized computing scenario.

3. Wellbiciency: Humanizing Next-Generation Computing Solutions

In this section, we present a new humanized computing solution based on the innovative idea of wellbiciency, which includes a generalized σ (mean of efficiency) and wellbeing indicators. In the next subsection, we present a mathematical formalization and a practical algorithm for process execution considering this new parameter.

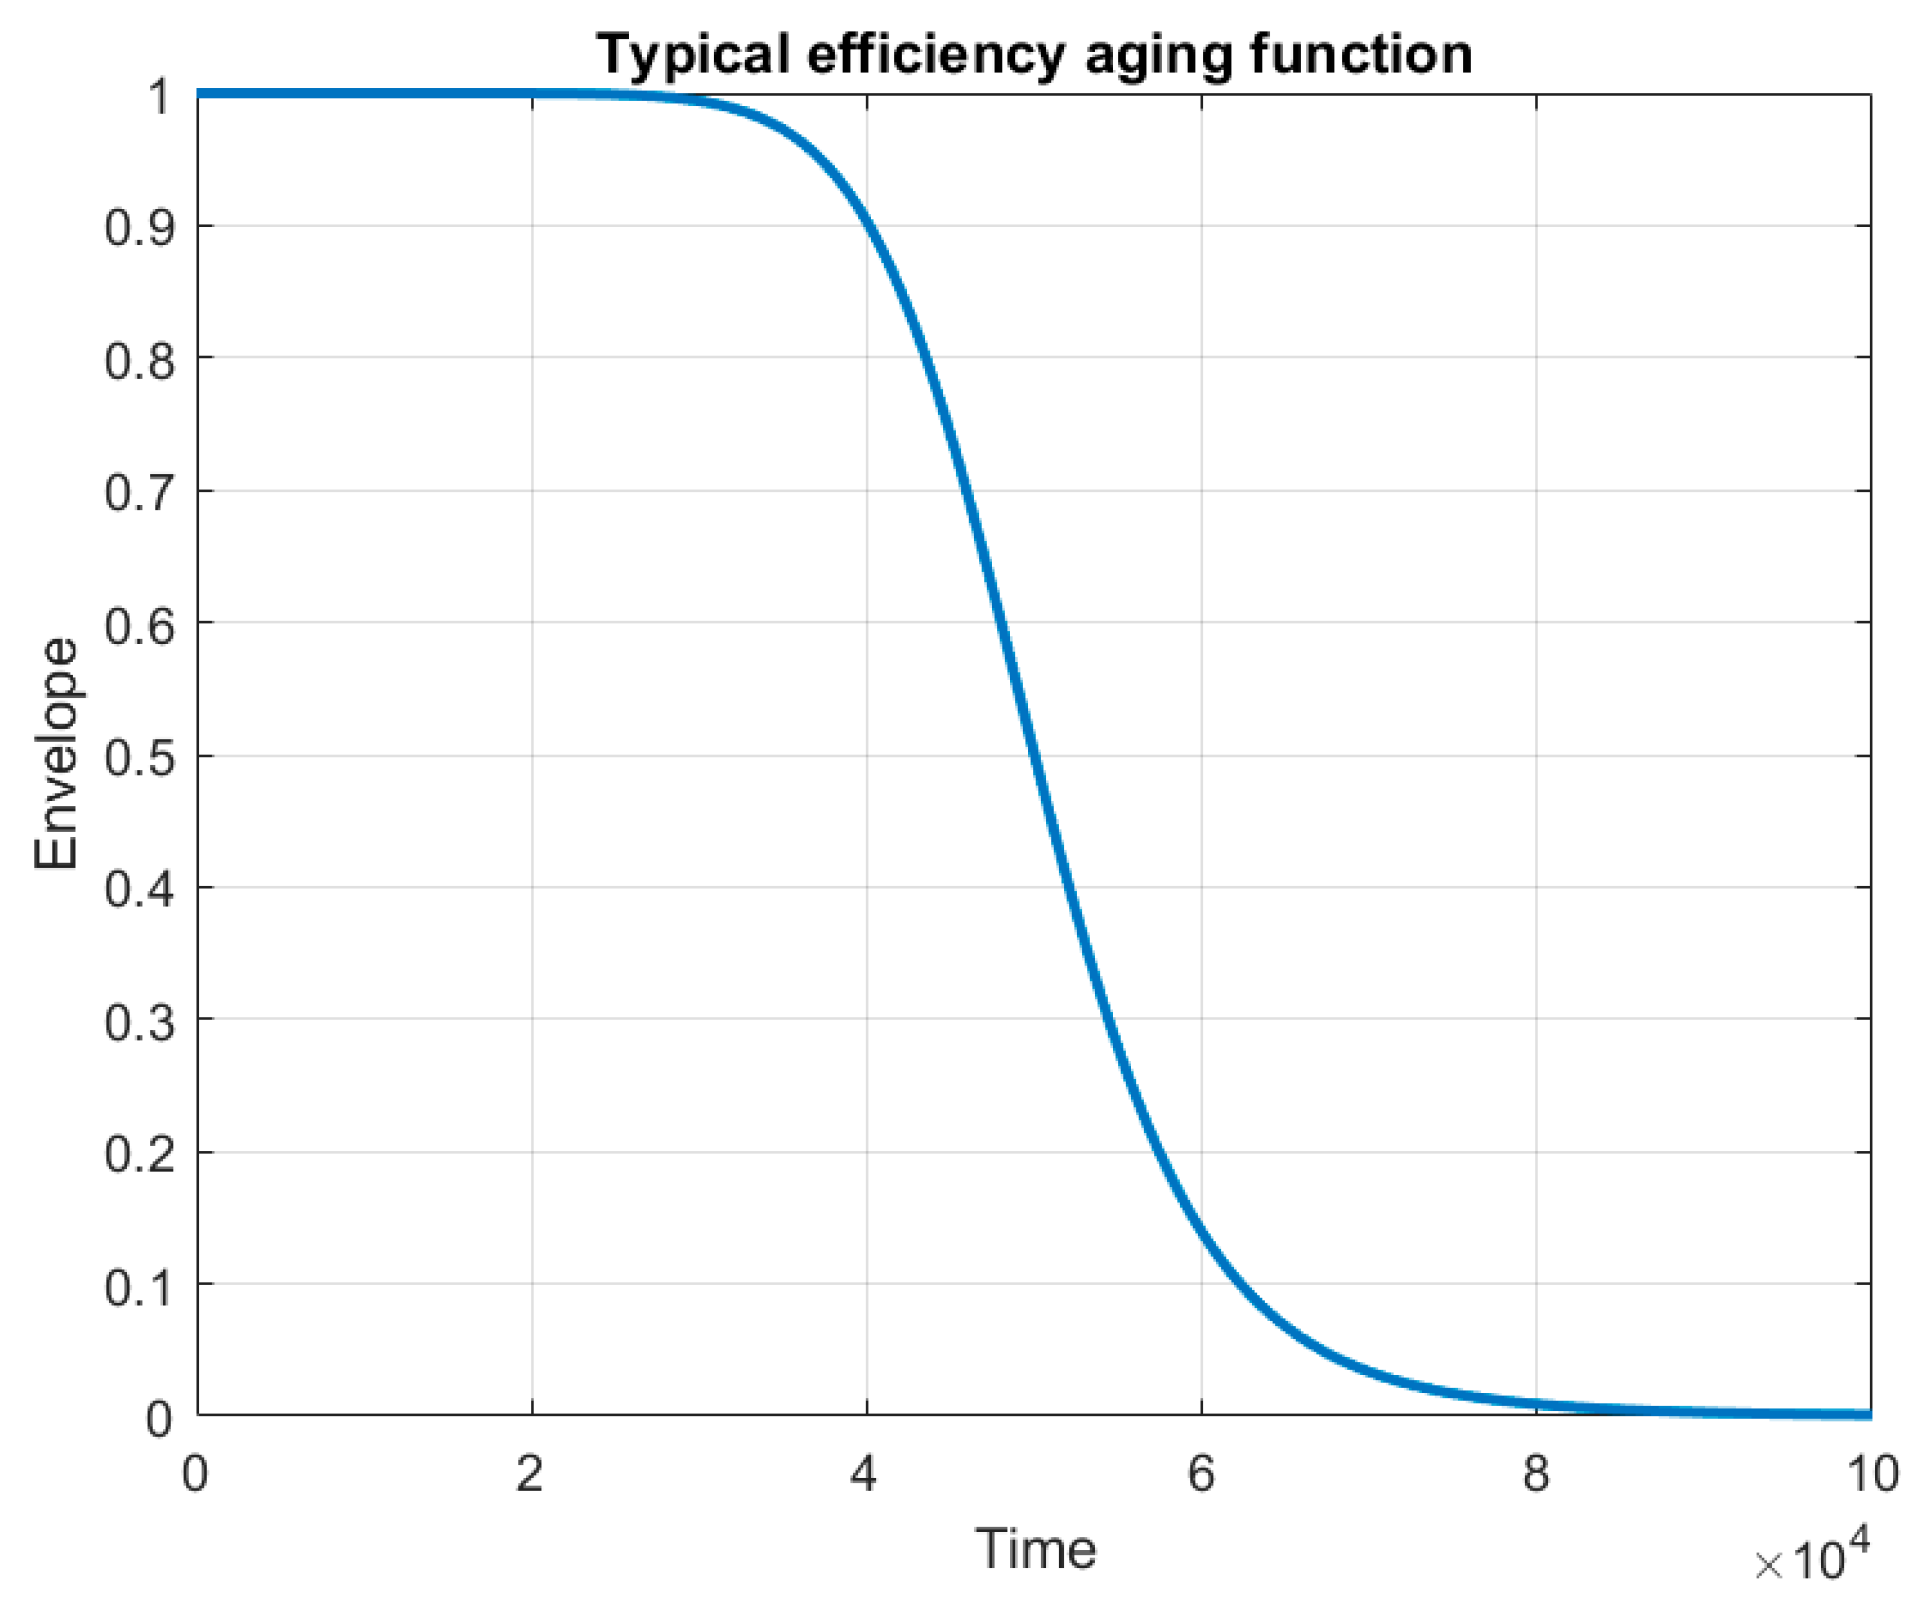
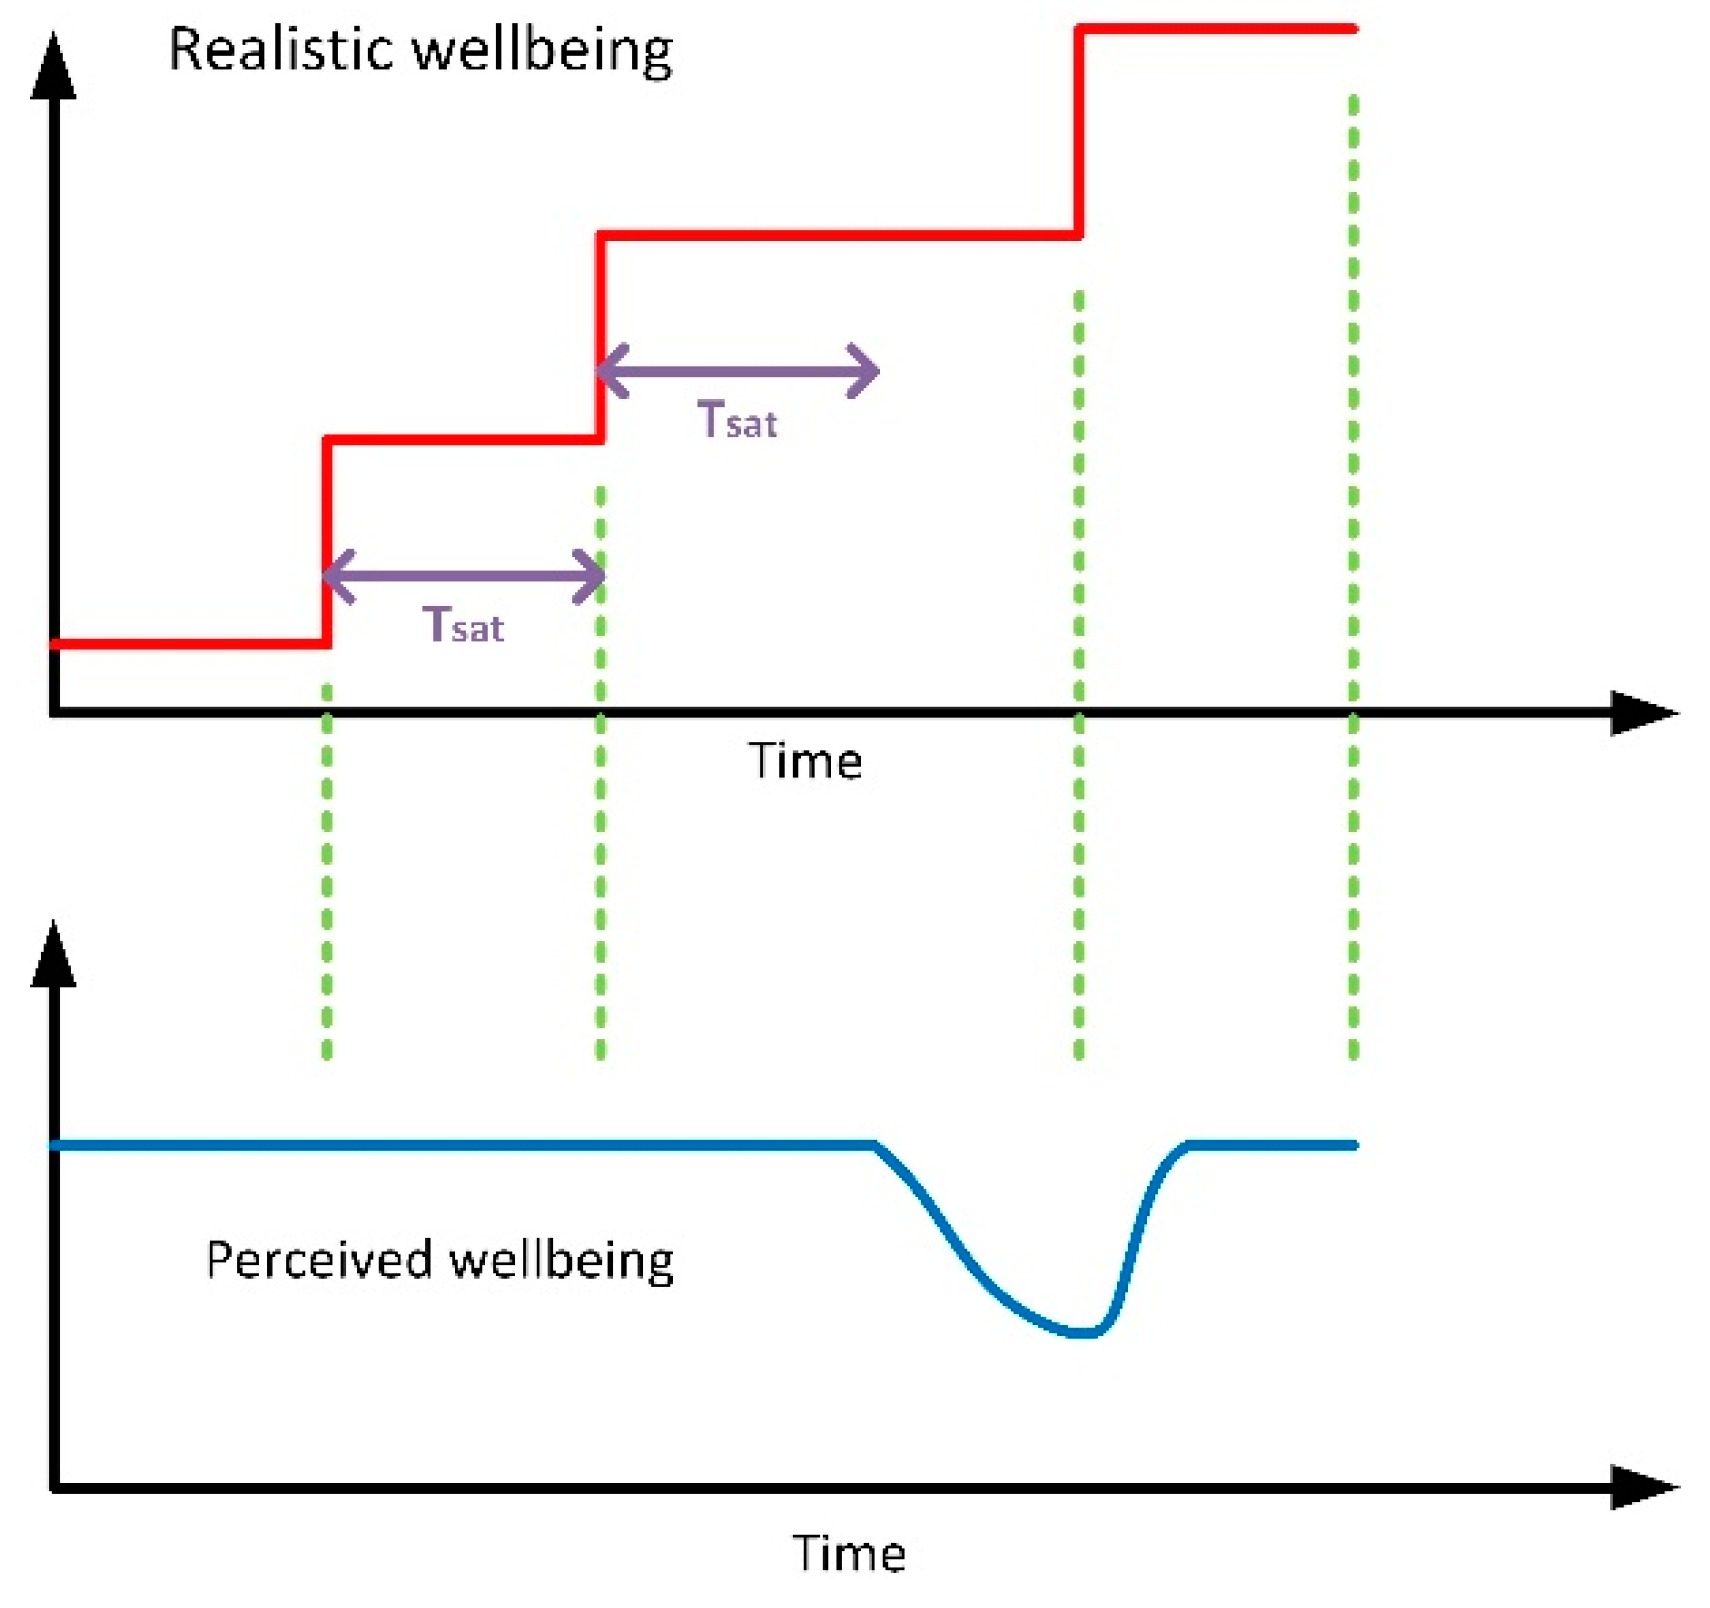
3.1. Mathematical Formalization

An application scenario A , where a process execution system is deployed and running, may be understood as the group of N people p i (workers) and M independent technological domains d i (1):
A = { P ,   T } = {   { p 1 ,   p 2 , , p i , , p N } , { d 1 ,   d 2 , , d i , , d M } } .
Each independent technological domain d i is represented in the process execution system by a set of K d i technical variables v d i j (2). With this set V d i , a partition Π V d i may be defined (3). Two subsets are included in this partition. The first subset, V d i o u t , includes all variables describing the (amount of) valid results obtained from the execution system. The second subset, V d i i n , includes all variables describing the invested resources to generate the obtained results:
V d i = {   v d i j           j = 1 , , K d i }
  Π V d i = { V d i o u t ,   V d i i n   } .  
If both subsets in the partition Π V t i are nonempty, then it is possible to define an efficiency function ε d i (4) describing the behavior of the technological domain d i :
ε d i = f ( V d i , t ) .
As can be seen, this efficiency function depends on the set of technical variables V d i but also on time. In fact, as time passes, technological solutions get older, and for identical configurations and variable values, the global efficiency is lower. These two effects are independent and, so, may be expressed as the product of two different functions (5). Function f e   ( · ) is named “formal efficiency”, and it represents the efficiency as defined by technological providers (or users) from the state variables v d i j . On the other hand, function f t   ( · ) is named the “aging function” and behaves as an envelope, modulating the real obtained efficiency according to time:
ε d i = f ( V d i , t ) = f e   ( V d i ) · f t   ( t ) .
This aging function (see Figure 1) presents two different areas. The first part in the function represents the product life of the technological domain, where aging may be considered negligible (the envelope is closer to the unit). The second part is the aging zone, where system efficiency goes down, even when state parameters are maintained. This zone, typically, follows a rational function (6). In this function, T c represents the moment in the system lifetime when effective aging starts, and Q indicates the speed at which the system gets older: as Q grows, the aging speed also increases.
f t   ( · ) = 1 1 + ( t T c ) 2 Q
On the other hand, each person p i is represented in the process execution system by a set of K p i wellbeing indicators s p i j (7). Using these indicators and a weight function g ( · )   , it is possible to obtain a realistic human wellbeing measure, ω p i r e a l (8). The employed weight function may be selected by system managers or physiologists according to their needs and studies, as well as the specific application scenario:
S p i = { s p i j           j = 1 , , K p i   }
  ω p i r e a l = g ( S p i ) .  
However, human wellbeing is not stable and, in general, people’s needs grow over time. Thus, in order to maintain a constant level of wellbeing, these needs must be satisfied in a continuous and increasing manner. Many works on human motivation, wellbeing, and behavior, such as Maslow’s proposals [22], describe human needs as a stair or pyramid (see Figure 2). After a certain time at the same “level”, people’s wellbeing starts to diminish. Then, people must be promoted to the next level to update and keep them with the same perception of wellbeing as before.
The previously described realistic human wellbeing measure ω p i r e a l does not consider people’s perceptions and the impact of time. So, we must define a new wellbeing measure, the perceived wellbeing ω p i p e r c i v , where these effects are included (9).
This new measure is calculated from the realistic human wellbeing measure using a mapping function h ( · ) , which also considers time. This function may present different mathematical expressions, but usually, it is calculated using numerical algorithms and branched functions (see Algorithm 1). In these numerical functions, it is considered that the human saturation time, T s a t , determines when people perceive a decrease in wellbeing, even though their realistic wellbeing has remained constant.
ω p i p e r c i v = h ( ω p i r e a l ,   t )
Algorithm 1. Mapping function for perceived wellbeing, h ( · )  
Input: Realistic wellbeing ω p i r e a l  
Output: Perceived wellbeing ω p i p e r c i v  
Create a circular array C of T s a t positions
Insert ω p i r e a l in C  
if all elements in C are equal then
     ω p i p e r c i v = ω p i r e a l   · e t  
else
    if  ω p i p e r c i v is lower than ω p i r e a l then
      ω p i p e r c i v = ω p i r e a l   · ( 1 e t )  
    end if
end if
Then, the wellbiciency Φ A of the application A is defined as the generalized σ   (mean of all efficiency functions) and the perceived wellbeing measures defined in the application, for all technological domains and people (10). This mean, also named the Kolmogorov mean, considers a function σ ( · ) called (in this work) the “aggregation function”. This function represents the weight and impact of each indicator in the resulting wellbiciency, as well as the relation between efficiency and wellbeing measures:
Φ A = σ 1 ( 1 M + N ( i = 1 N σ ( ω p i p e r c i v ) + i = 1 M σ ( ε d i ) ) ) .
In order to guarantee the existence of inverse function σ 1 ( · ) , the aggregation function must be continuous and injective. Many different functions may be considered. Table 1 shows and describes some examples, indicating the characteristics inherited by the resulting wellbiciency if each one is selected.
Once wellbiciency is built, it is important to note that it is a time function Φ A ( t ) . Then, noise, fluctuations, interferences, numerical errors, and so forth, may affect the instantaneous value of this parameter. To remove all these effects, final values of wellbiciency are obtained after a smooth process using a Chebyshev type II filter, H ( Ω ) (11). Chebyshev type II filters are flat in the passband (so no distortion is introduced in wellbiciency), attenuate variations faster than Ω c Hz, and remove all components which vary faster than Ω s Hz. Z and ϵ are parameters controlling the attenuation of removed components:
| H ( Ω ) | 2 = 1 1 + ϵ 2 T Z 2 ( Ω s Ω c ) T Z 2 ( Ω s Ω )   Being   0     ϵ   1   T Z ( x ) the Chebyshev polynomial with   Z   order T Z + 1 ( x ) = 2 · x · T Z ( x ) T Z 1 ( x ) T 0 ( x ) = 1 T 1 ( x ) = x .

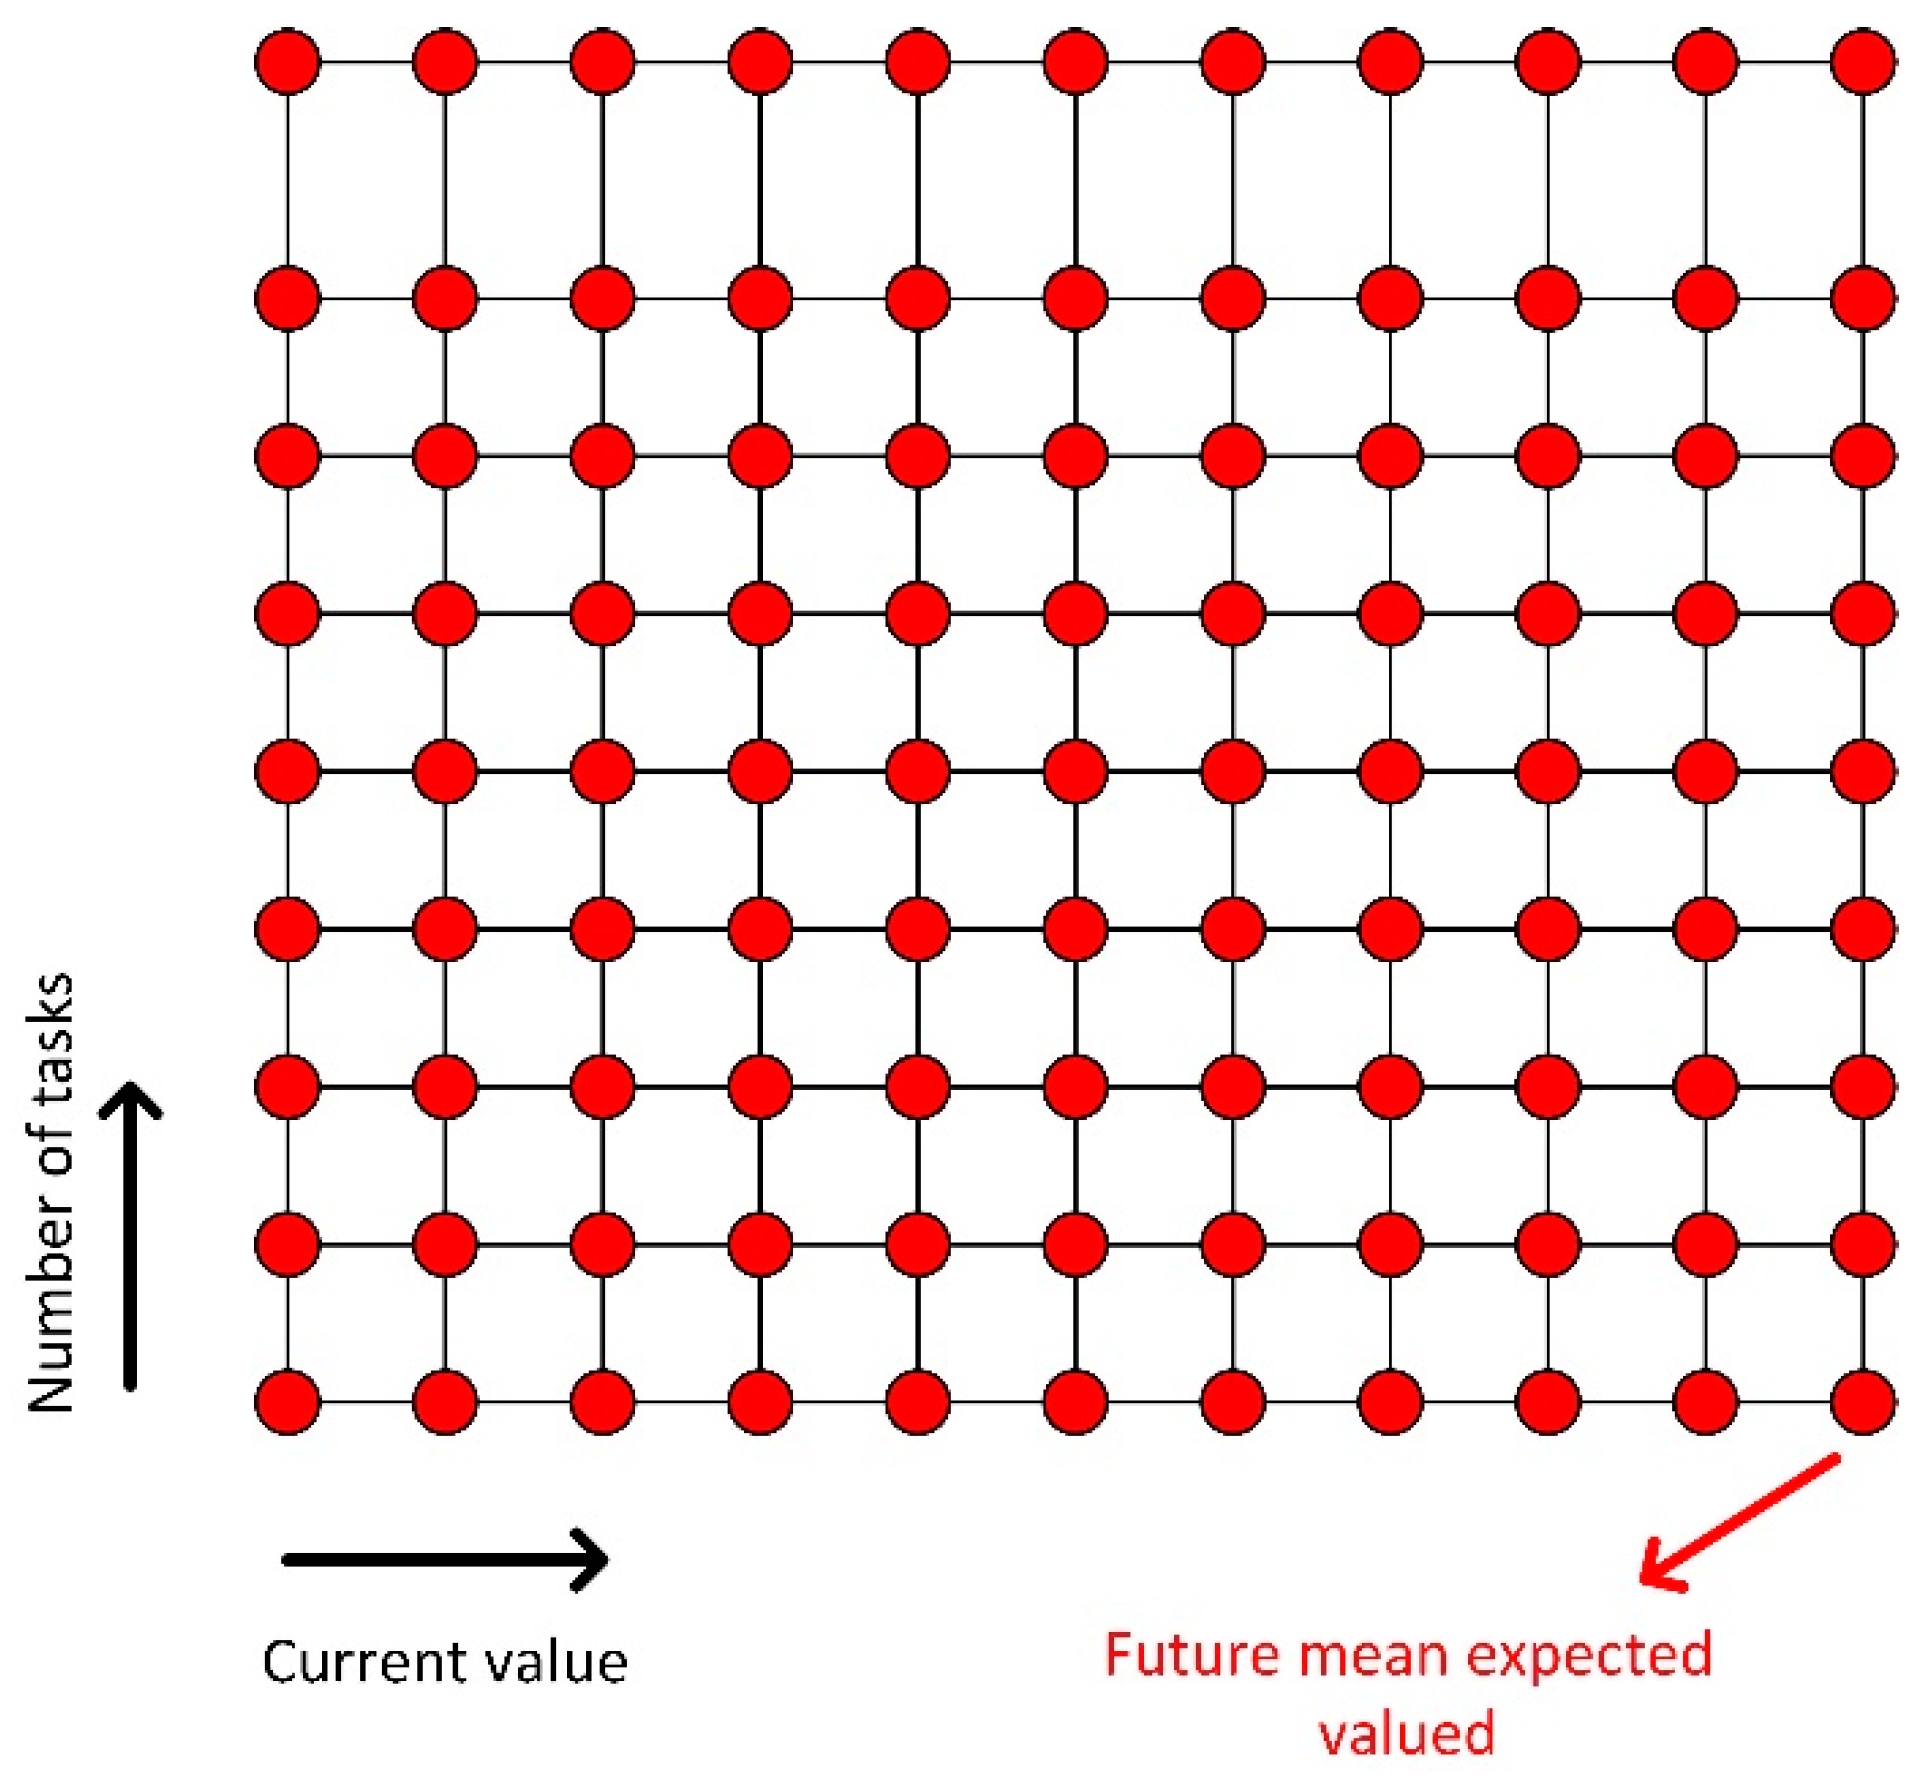
3.2. Proposed Algorithm

In a typical process execution system, where M + N locations may execute each one of the tasks in the workflow, the number of possible variations to execute the process increases exponentially with the number of tasks, L (12). Thus, obtaining the optimum execution scheme is a poorly scalable problem if no additional instrument is employed:
L M + N .
On the other hand, in order to predict the future wellbiciency of a system, depending on the selected execution scheme, some predictive technologies should be considered.
At this point, we must consider that wellbiciency, as the generalized σ   (mean), meets the central limit theorem (13). Further, it is well known that in Gaussian distributions, the most probable values and the mean value are the same. Thus, for a sufficiently large system, the most probable value for wellbiciency may be calculated as the expected value of the joint distributions of all wellbeing and efficiency indicators (14):
M + N · ( Φ A σ 1 ( E σ [ ε d i ,   ω p j p e r c i v         i = 1 , . . , M   ;     j = 1 , , N ] ) )   N o r m a l   d i s t r i b u t i o n
  E [ ε d i ,   ω p j p e r c i v         i = 1 , . . , M   ;     j = 1 , , N ] = σ 1 ( E σ [ ε d i ,   ω p j p e r c i v         i = 1 , . . , M   ;     j = 1 , , N ] ) .  
However, technological domains and people are totally independent of each other. Thus, joint probability may be decomposed as the product of different unidimensional probabilities, and finally, the global expected value as the addition of several different unidimensal expected values (15):
E σ [ ε d i ,   ω p j p e r c i v         i = 1 , . . , M   ;     j = 1 , , N ] = = 1 M + N   k 1 k i k M r 1 r j r N ( σ ( x 1 k 1   ) + + σ ( x M k M   ) + σ ( y 1 r 1   ) + + σ ( y N r N   ) ) · p ( ε d 1 = x 1 k 1   ; ; ω p N p e r c i v = y N r N   ) = = 1 M + N   k 1 k i k M r 1 r j r N ( σ ( x 1 k 1   ) + + σ ( x M k M   ) + σ ( y 1 r 1   ) + + σ ( y N r N   ) ) · p ( ε d 1 = x 1 k 1   ) · · p ( ω p N p e r c i v = y N r N   ) = = 1 M + N   [ k 1 σ ( x 1 k 1   ) · p ( ε d 1 = x 1 k 1   ) + + r N σ ( y N r N   )   · p ( ω p N p e r c i v = y N r N   ) ] = = 1 M + N ( i = 1 M E σ [ ε d i ] + j = 1 N E σ [ ω p j p e r c i v ] ) .
At this point, for each technological domain and person, the following information is acquired: A discrete grid is created. In one dimension, the current values of the corresponding indicator are represented. In the other dimension, the number of tasks to be assigned to the agent under study is represented. Each vertex in the grid contains the expected value of the studied indicator in those conditions (see Figure 3). This information may be easily measured before system operation, so system performance is not affected.
Using these grids, connected as three-dimensional cubes, it is easy to find the optimal process execution sceme using a dynamic time warping algorithm [26]. The cost to be optimized, of course, is the future wellbiciency, represented by its most probable value and calculated as the aggregated value of all nodes that are crossed by the algorithm. Algorithm 2 describes the resulting mechanism.
Algorithm 2. Proposed process execution algorithm
Input: Collection of M + N grids, G i  
    Current values of ω p i p e r c i v and ε d i  
Output: Execution scheme S C  
      Future expect wellbiciency Φ A ˜  
Obtain M + N vectors A i from grids. A i     G i ( ω p i p e r c i v , ε d i   )  
for all combinations of ( r 1 , , r M + N )  do
  Obtain H m = m i n { H [ r 1 1 , , r M + N ] ,   , H [ r 1 , , r M + N 1 ] , , H [ r 1 1 , , r M + N 1 ] }  
  Obtain cost hypermatrix H [ r 1 , , r M + N ] = H m + A r 1 + + A r M + N  
  Add to S C the indexes of H m  
end for
  Φ A ˜ is equal to the value of the last element in H  
Order de execution of S C  

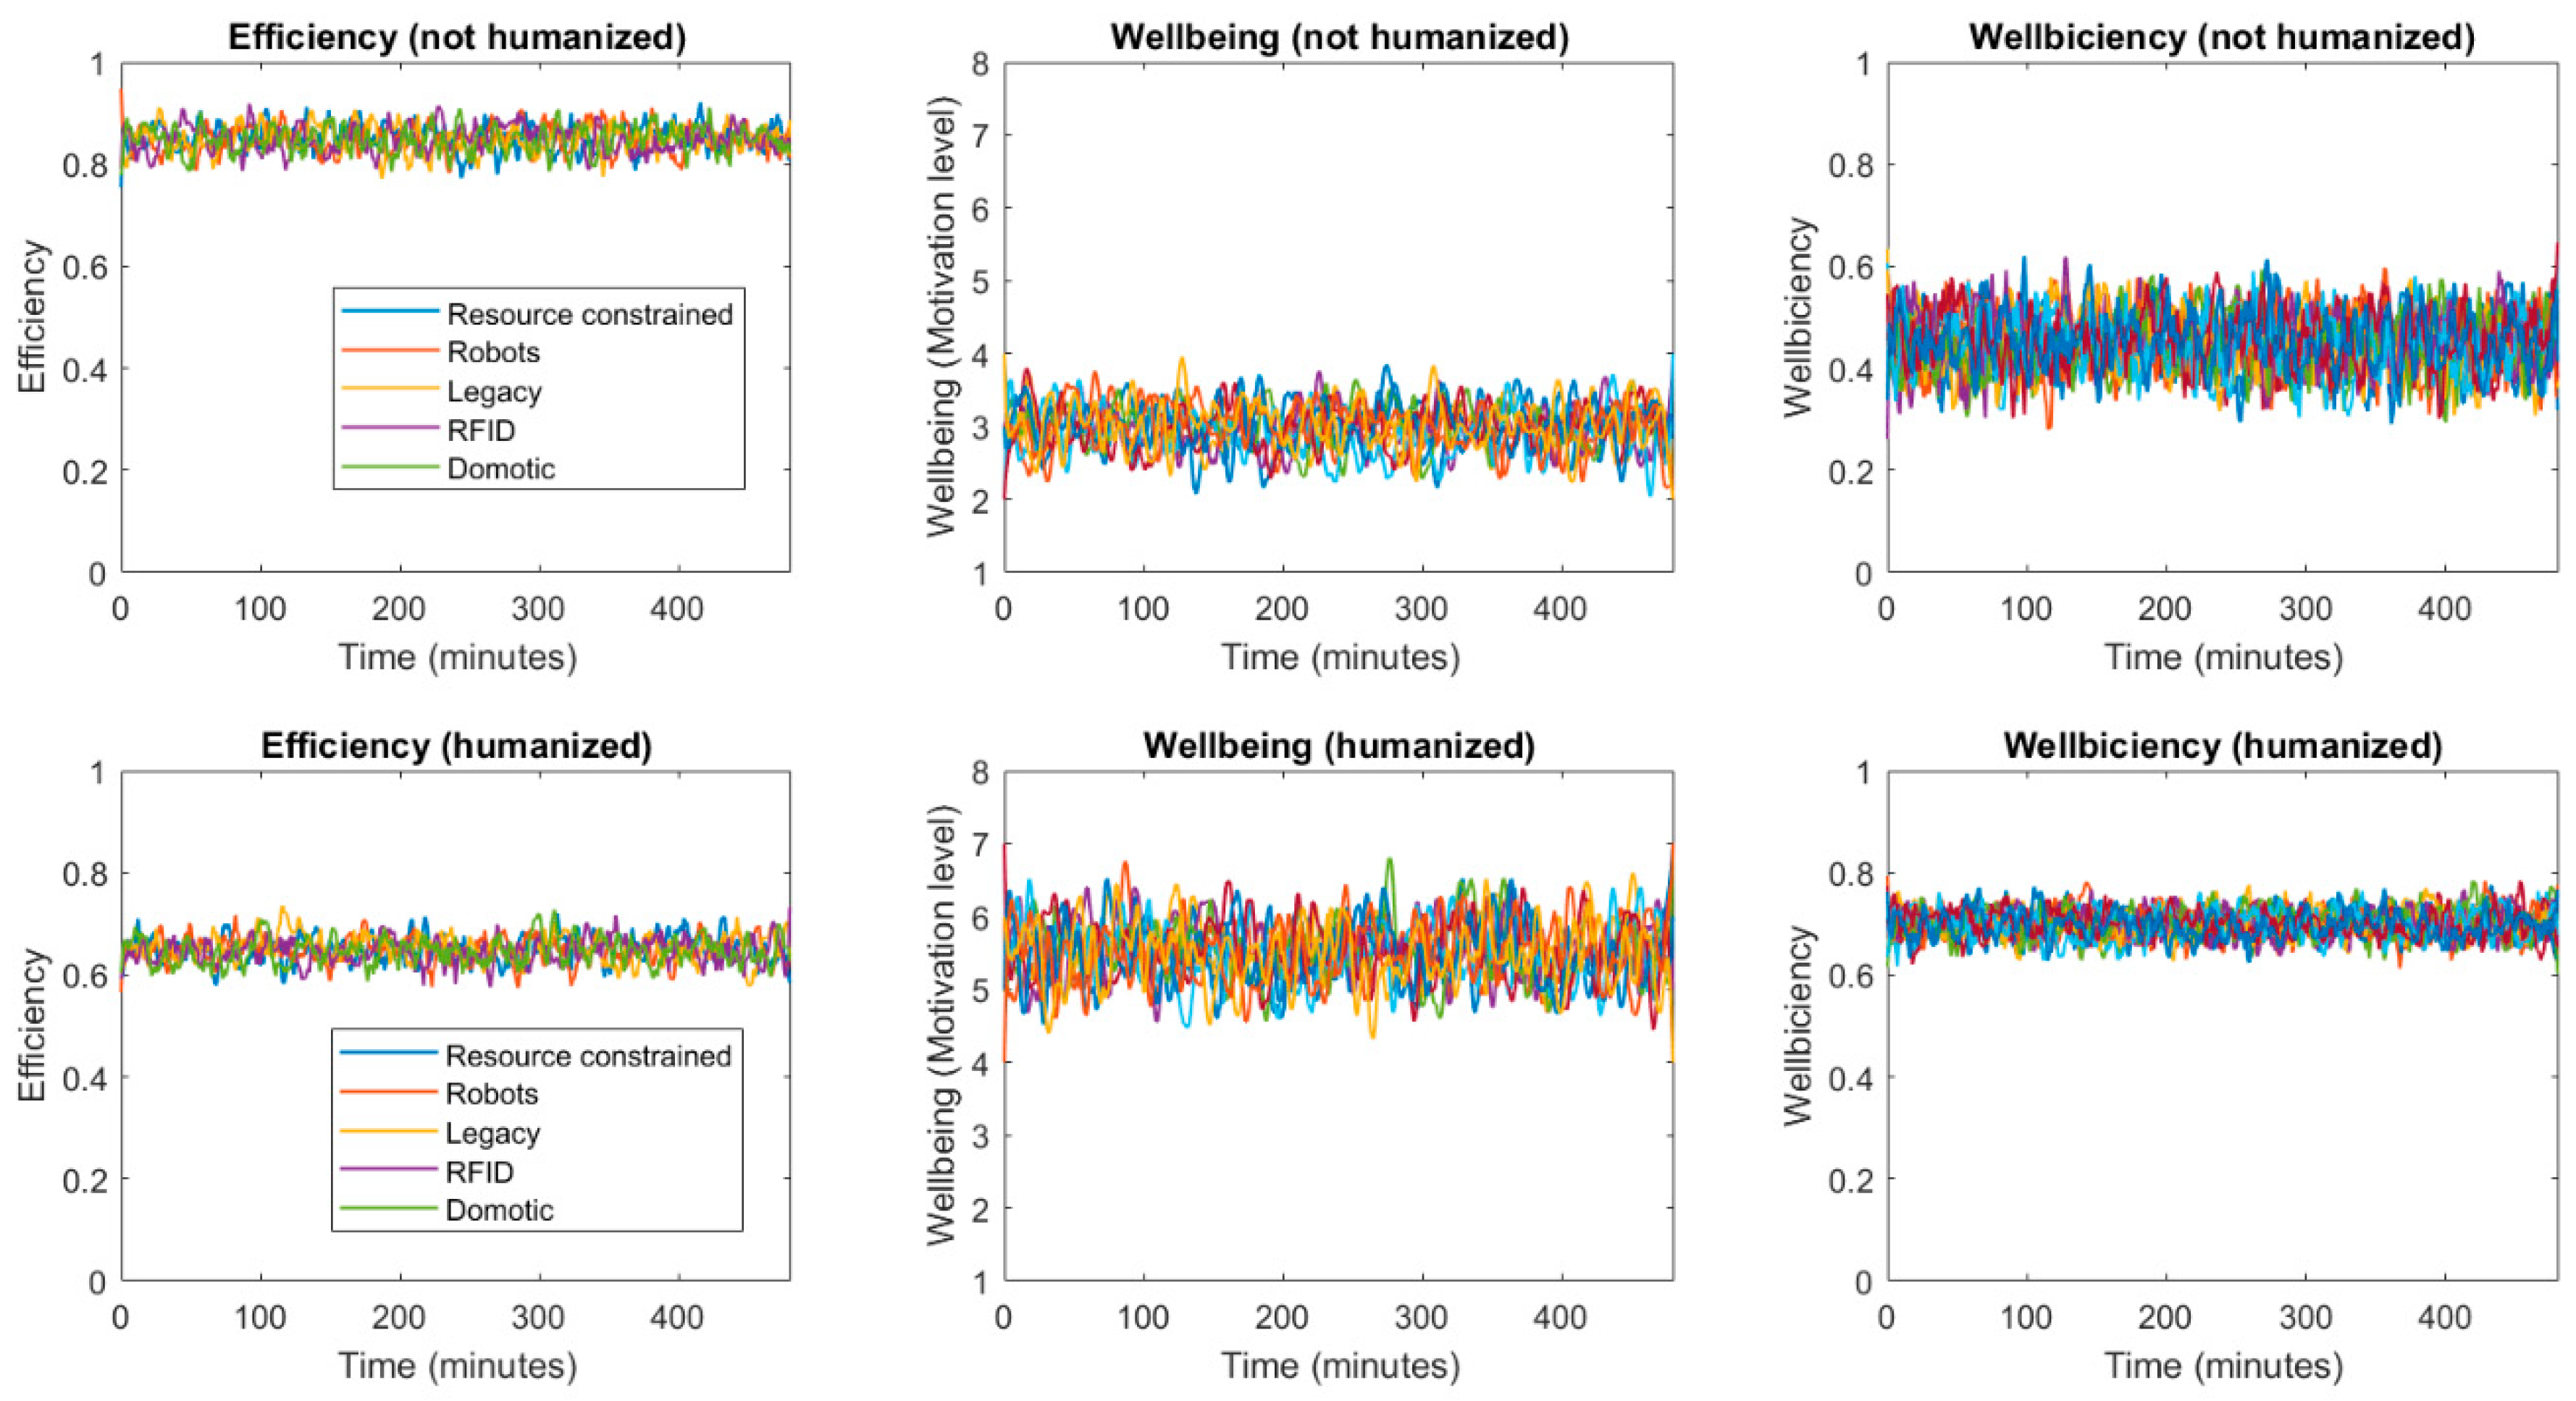
4. Experimental Validation

In order to evaluate the performance of the proposed solution, an experimental validation based on simulation scenarios was performed.
The simulation scenario was built using a cosimulator, combining both the social and network (physical) simulations [28]. Specifically, this simulator was based on two well-known commercial simulators: MASON and NS3. MASON (Multi-Agent Simulator of Neighborhoods) is a fast discrete-event multiagent simulation library core in JAVA. NS3 (Network Simulator 3) is also a discrete-event network simulator for Internet systems. Both simulators were connected through a specific engine.
Simulations were carried out using a Linux system; both MASON and NS3 may be easily deployed using Linux systems. To perform the proposed experiment, we used a 64-bit 1570 Linux Ubuntu 16 operating system, with an Intel i5 processor and 8 GB of RAM.
The simulation scenario consisted of five different technological domains, representing various production systems. One domain was composed of 50 resource-constrained devices (microcontrollers), the second domain was composed of mobile robots, the third domain was built using legacy systems, the fourth domain presented a traceability solution based on RFID (Radio Frequency Identification) tags and readers, and finally, the fifth domain was a domotic solution composed of Raspberry Pi nodes. Moreover, in this scenario, 10 people were simulated. All of them were presumed, in the first experiment, to have stable behavior. Agents representing people in our simulation were provided with a Java algorithm representing the evolution of motivation in humans [22].
Two different simulations were performed during the experiment using this scenario. In the first one, a standard process execution solution [10] was deployed in a Linux Container (supported by LXC technologies), connected to the simulation scenario through a TAP (Test Access Point) node and a ghost node in the NS3 simulator. In the second simulation, the proposed humanizing mechanism was added to the process execution system. Data were collected to analyze the wellbeing of each person and the efficiency of each technological domain in the simulations. Then, these data were processed using MATLAB software to evaluate all indicators in both simulations, as well as the global wellbiciency.
Each simulation represented 24 h of continuous operation, where processes were continuously being received and executed (so we could analyze the results when the application scenario had stable behavior).
In order to remove random effects, each simulation was repeated 12 times, and the final results were obtained as the mean value of all these simulations.
Figure 4 shows the obtained results for both simulations and all indicators, people, and technological domains.
As can be seen, using the proposed humanized mechanism, the wellbiciency value increased up to 50%, mainly because people’s motivation and wellbeing increased in approximately the same manner. On the other hand, efficiency reduced by 25%, but it still retained acceptable values (around 70%). In any case, if the observed decrease in efficiency is not acceptable in certain scenarios, this situation may be easily corrected using a different aggregation function.

5. Conclusions and Future Work

In this paper, we proposed a new mechanism to humanize next-generation computing solutions for process execution. This proposal addressed the People-as-a-Service dilemma, for scenarios characterized by very high efficiency that do not meet people’s requirements for wellbeing.
To address this challenge, we proposed a new parameter called wellbiciency, which includes a generalized σ   (mean of efficiency) and wellbeing indicators. This humanized efficiency definition is used to allocate tasks and assign them to different existing workers and nodes in a more respectful manner, considering economic and wellbeing objectives.
In order to evaluate the proposed solution, a simulation scenario including social and physical elements was built. The results showed that the humanization level grew and people’s wellbeing increased up to 50%.
Future works will consider more exhaustive experimental validations and real deployments to validate the proposed mechanism.

Author Contributions

The authors’ contributions to this work are as follows: B.B. proposed and developed the paper’s idea, R.A. and T.R. contributed to the theoretical formalization and paper redaction, and M.H. implemented algorithms and experimental validation.

Funding

The research leading to these results received funding from the Ministry of Economy and Competitiveness through the SEMOLA project (TEC2015-68284-R).

Conflicts of Interest

The authors declare no conflict of interest.

References

  1. Bordel, B.; Alcarria, R.; Robles, T.; Martín, D. Cyber–physical systems: Extending pervasive sensing from control theory to the Internet of Things. Pervasive Mob. Comput. 2017, 40, 156–184. [Google Scholar] [CrossRef]
  2. Shi, W.; Cao, J.; Zhang, Q.; Li, Y.; Xu, L. Edge computing: Vision and challenges. IEEE Internet Things J. 2016, 3, 637–646. [Google Scholar] [CrossRef]
  3. Bordel, B.; de Rivera, D.S.; Sánchez-Picot, Á.; Robles, T. Physical processes control in industry 4.0-based systems: A focus on cyber-physical systems. In Ubiquitous Computing and Ambient Intelligence; Springer: Cham, Switzerland, 2016; pp. 257–262. [Google Scholar]
  4. Bordel, B.; Alcarria, R.; de Rivera, D.S.; Robles, T. Process execution in Cyber-Physical Systems using cloud and Cyber-Physical Internet services. J. Supercomput. 2018, 74, 4127–4169. [Google Scholar] [CrossRef]
  5. Bordel, B.; Alcarria, R.; Sanchez de Rivera, D.; Martín, D.; Robles, T. Fast self-configuration in service-oriented Smart Environments for real-time applications. J. Ambient Intell. Smart Environ. 2018, 10, 143–167. [Google Scholar] [CrossRef]
  6. Sánchez-de-Rivera, D.; Bordel, B.; Alcarria, R.; Robles, T. Enabling Efficient Communications with Resource Constrained Information Endpoints in Smart Homes. Sensors 2019, 19, 1779. [Google Scholar] [CrossRef] [PubMed]
  7. Legner, C.; Eymann, T.; Hess, T.; Matt, C.; Böhmann, T.; Drews, P.; Mädche, A.; Urbach, N.; Ahlemann, F. Digitalization: Opportunity and challenge for the business and information systems engineering community. Bus. Inf. Syst. Eng. 2017, 59, 301–308. [Google Scholar] [CrossRef]
  8. Geissdoerfer, M.; Savaget, P.; Bocken, N.M.; Hultink, E.J. The Circular Economy—A new sustainability paradigm? J. Clean. Prod. 2017, 143, 757–768. [Google Scholar] [CrossRef]
  9. Duan, Y.; Fu, G.; Zhou, N.; Sun, X.; Narendra, N.C.; Hu, B. Everything as a service (XaaS) on the cloud: Origins, current and future trends. In Proceedings of the 2015 IEEE 8th International Conference on Cloud Computing, New York, NY, USA, 27 June–2 July 2015; pp. 621–628. [Google Scholar]
  10. Bordel, B.; Alcarria, R.; Jara, A. Process execution in humanized Cyber-physical systems: Soft processes. In Proceedings of the 2017 12th Iberian Conference on Information Systems and Technologies (CISTI), Lisbon, Portugal, 21–24 June 2017; pp. 1–7. [Google Scholar]
  11. Cohen, D.I.; Cohen, D.I. Introduction to Computer Theory; Wiley: New York, NY, USA, 1991; Volume 2. [Google Scholar]
  12. Schmidt, A. Implicit human computer interaction through context. Pers. Technol. 2000, 4, 191–199. [Google Scholar] [CrossRef]
  13. Chen, M.; Ma, Y.; Li, Y.; Wu, D.; Zhang, Y.; Youn, C.H. Wearable 2.0: Enabling human-cloud integration in next generation healthcare systems. IEEE Commun. Mag. 2017, 55, 54–61. [Google Scholar] [CrossRef]
  14. Rechy-Ramirez, E.J.; Marin-Hernandez, A.; Rios-Figueroa, H.V. Impact of commercial sensors in human computer interaction: A review. J. Ambient Intell. Humaniz. Comput. 2018, 9, 1479–1496. [Google Scholar] [CrossRef]
  15. Hui, T.K.; Sherratt, R.S. Towards disappearing user interfaces for ubiquitous computing: Human enhancement from sixth sense to super senses. J. Ambient Intell. Humaniz. Comput. 2017, 8, 449–465. [Google Scholar] [CrossRef]
  16. Du, G.; Zhang, P.; Liu, X. Markerless human–manipulator interface using leap motion with interval Kalman filter and improved particle filter. IEEE Trans. Ind. Inform. 2016, 12, 694–704. [Google Scholar] [CrossRef]
  17. Hong-juan, S.U.N. People-oriented User Interface Design. Packag. Eng. 2015, 4, 113–116. [Google Scholar]
  18. Lockner, D.; Bonnardel, N. Towards the evaluation of emotional interfaces. In International Conference on Human-Computer Interaction; Springer: Cham, Switzerland, 2015; pp. 500–511. [Google Scholar]
  19. Vasiljevic, G.A.M.; de Miranda, L.C. Brain–Computer Interface Games Based on Consumer-Grade EEG Devices: A Systematic Literature Review. Int. J. Hum. Comput. Interact. 2019, 1–38. [Google Scholar] [CrossRef]
  20. Shi, Y. The Application of Psychology in Human-computer Interaction. In Proceedings of the 2017 3rd International Conference on Management Science and Innovative Education, Jinan, China, 14–15 October 2017. [Google Scholar]
  21. Poore, J.; Vincent, E.; Mariano, L. Software as a Medium for Understanding Human Behavior. In International Conference on Human-Computer Interaction; Springer: Cham, Switzerland, 2017; pp. 60–73. [Google Scholar]
  22. Bordel, B.; Alcarria, R. Assessment of human motivation through analysis of physiological and emotional signals in Industry 4.0 scenarios. J. Ambient Intell. Humaniz. Comput. 2017, 1–21. [Google Scholar] [CrossRef]
  23. Mabrouk, A.B.; Zagrouba, E. Abnormal behavior recognition for intelligent video surveillance systems: A review. Expert Syst. Appl. 2018, 91, 480–491. [Google Scholar] [CrossRef]
  24. Liu, Y.; Nie, L.; Liu, L.; Rosenblum, D.S. From action to activity: Sensor-based activity recognition. Neurocomputing 2016, 181, 108–115. [Google Scholar] [CrossRef]
  25. Wang, J.; Chen, Y.; Hao, S.; Peng, X.; Hu, L. Deep learning for sensor-based activity recognition: A survey. Pattern Recognit. Lett. 2019, 119, 3–11. [Google Scholar] [CrossRef]
  26. Bordel, B.; Alcarria, R.; Sánchez-de-Rivera, D. A Two-Phase Algorithm for Recognizing Human Activities in the Context of Industry 4.0 and Human-Driven Processes. In World Conference on Information Systems and Technologies; Springer: Cham, Switzerland, 2019; pp. 175–185. [Google Scholar]
  27. Bordel, B.; Alcarria, R.; Martín, D.; Robles, T.; de Rivera, D.S. Self-configuration in humanized cyber-physical systems. J. Ambient Intell. Humaniz. Comput. 2017, 8, 485–496. [Google Scholar] [CrossRef]
  28. Sánchez, B.B.; Alcarria, R.; Sánchez-Picot, Á.; Sánchez-de-Rivera, D. A methodology for the design of application-specific cyber-physical social sensing co-simulators. Sensors 2017, 17, 2177. [Google Scholar] [CrossRef] [PubMed]
Figure 1. Typical efficiency aging function. Displayed values are only examples and may vary depending on the particular selected function.
Proceedings 31 00039 g001
Figure 2. Relationship between realistic and perceived wellbeing.
Proceedings 31 00039 g002
Figure 3. Grid for future wellbiciency evaluation.
Proceedings 31 00039 g003
Figure 4. Results.
Figure 4. Results.
Proceedings 31 00039 g004
Table 1. Most relevant aggregation functions.
σ ( · ) NameDescription and Comments
  σ ( x ) = x   Linear function. Arithmetic mean.This function considers the same weight for all components, and small values in any component may be compensated by other indicators.
  σ ( x ) = 1 x   Rational function. Harmonic mean.This function is greatly affected by small values, which are hardly compensated by high values in other indicators.
  σ ( x ) = x m    
m > 1
Polynomial function. Hölder mean.This function considers the same weight for all components, and small values in any component may be compensated by other indicators. However, as m goes up, this compensation process becomes more difficult.
  σ ( x ) = ln ( x )   Logarithm function. Geometric mean.This function is affected in the same manner by high values and small values. Null values cannot be compensated for, but very high values may compensate small measures in other indicators
Publisher’s Note: MDPI stays neutral with regard to jurisdictional claims in published maps and institutional affiliations.

