1. Introduction
Mapping of soil properties, especially electrical resistivity measurements that provide integrative information of the physical and chemical properties at different depths, is a key issue in precision farming [
1]. Such imaging technique needs to be combined with soil-core samples to gain insight on the delivered signal and to map various parameters: Soluble salts, clay content and mineralogy, soil water content, or organic matter [
2]. This description of soil variability at the intra-field scale appears useful for effective management of agricultural fields, delineating areas with similar characteristics that serve as a basis for the modulation of cultural practices [
3]. Nevertheless, the cost of such a technology may limit its implementation, and complementary or even substitution methods must be identified.
In this context, the on-going Sentinel-2 satellite mission, that provides regular surface observations at a decametric resolution, constitutes a substitute opportunity for the monitoring of sub-surface parameters. Indeed, the sensors onboard the satellite operate in the visible, near infra-red, and short wavelength infra-red, delivering reflectance that offer interesting predictive capacities regarding several topsoil properties [
4,
5]. Such satellite signals appear thus useful for the mapping of the texture fractions, the soil organic carbon content, or the cation exchange capacity that is similar soil descriptors than those targeted by using electrical resistivity measurements.
The objective of this study is twofold: (i) To estimate the electrical resistivity at different depths using satellite images and (ii) to analyze the contribution of optical reflectance on the targeted electrical resistivity. Main characteristics of the monitored field are described in
Section 2, together with an overview of ground and satellite data. The approach is based on optical reflectances which constitute the input variables of random forest, alone or in combination with parameters derived from a digital elevation model (
Section 3). The ability to reproduce intra-plot variability of soil is first analyzed, followed by a focus on the importance of Sentinel-2 reflectances (
Section 4).
2. Materials
2.1. Study Site
The study was conducted in a ~31 hectares large field dedicated to the cultivation of seasonal crops (mainly wheat and sunflower), located in southwestern France in the Gers County. Surrounded by valleys, the territory is characterized by a great diversity of landscapes and types of soil with ustic luvisols, limestone, clay-limestone, or more sandy soils. The texture of the monitored field was dominated by the content in silt (44%), followed by the fraction of clay (32.6%), and sand (23.4%), characteristic of a clay loam soil type (according to the USDA classification). The field is located on a gently sloped landscape with a maximum difference in elevation of ~40 m.
2.2. Intra-Plot Electrical Resistivity Measurements
The measurements of electrical resistivity were performed in December 2014 by Goecarta (
http://www.geocarta.net). A total of 69,811 geo-referenced intra-field soil samples were collected at three depths (representing the following soil layers: 0–50, 0–100, and 0–170 cm,
Figure 1), by a towed automatic resistivity profiler and equipped with a GPS system. The values of soil resistivity were finally aggregated at a spatial resolution of 20 m, to be consistent with the pixel size of satellite images. The values of electrical resistivity were on average lower on the 0–50 cm layer than those collected on the 0–100 or 0–170 cm layers (17.3 Ohm.m compared to 24.5 or 22.0 Ohm.m). The variability, characterized by the coefficients of variation (i.e., CV = 100 × standard deviation/mean), was close to 34% for the 0–50 cm layer, and slightly lower for the two other layers with 26 and 27%.
2.3. Satellite Data
The Sentinel-2 image was provided by the Theia land data center (freely available following the link:
https://www.theia-land.fr/en). The image was processed using the software developed by [
6], delivering level 2A products characterized by ortho-rectified surface reflectance. The data were first corrected from atmospheric effects and provided with a mask of clouds and their shadows on the ground (using a multi-temporal algorithm). In the present study, focus is on the reflectance acquired on 22 March 2016 at a spatial resolution of 10 m for four wavelengths (490, 560, 665, and 842 nm), and of 20 m for six wavelengths (705, 740, 783, 865, 1610, and 2190 nm). The soil surface was perfectly visible at that time in the absence of vegetation cover following tillage to prepare the seedlings of sunflower.
2.4. Morphologic Parameters Derived from the Digital Elevation Model
The morphologic parameters were derived from data (i.e., BD ALTI) provided by the IGN (National Institute of Geographical and Forest Information). The BD ALTI is a mesh digital elevation model (DEM) that describes the relief of the French territory, accessible at a spatial resolution of 25 m. The morphologic parameters were computed using QGIS open source software, by considering DEM as input variable. Among the wide range of morphological parameters that can be derived from a DEM, the following have been retained in the present study: The altitude, the orientation, the slope, the length of the slope, three indices describing the curvature, the upstream contributory area (considering unidirectional or multidirectional flow layout), and the topographic position index.
3. Methodology
The reflectances were first resized at the same spatial resolution of 20 m. The ten spectral bands constitute the input variables of random forest, considering two cases: (i) The only use of optical image for soil electrical resistivity estimates and (ii) the combined use of satellite data and morphologic parameters derived from the DEM.
The statistical approach proposed by [
7] was used to estimate the electrical resistivity. Such algorithm presents several advantages, that is: A reduced over fitting, a low influence of noise on the data, and a high stability of the results, which mainly come out of the bootstrap aggregating procedure (also called bagging). An ensemble of independent trees is constructed on a subset of bootstrap samples derived from the original dataset and aggregated through the weighted mean of the ensemble of estimations, providing an estimate of the targeted variable. This non-parametric approach is particularly appropriate in multi-factorial context to model non-linear relationships. Furthermore, random forest provides a measure of the relative importance of the predictive variables, which can be used to rank, to select, or to understand the influence of the considered input variables.
The statistical algorithm is trained and validated on independent sets of data, by repeating the procedure for each soil layer with different numbers of predictive variables. A random selection of samples is used to partition the ground and satellite data in two equivalent groups. The statistical parameters presented hereinafter (i.e., the coefficient of determination (R²) and the root mean square error (RMSE)) are finally derived from the comparison between the observed and estimated soil electrical resistivity, focusing on the 50% of independent testing set of data.
4. Results and Discussion
4.1. Mapping of the Soil Variability from Sentinel-2 Images
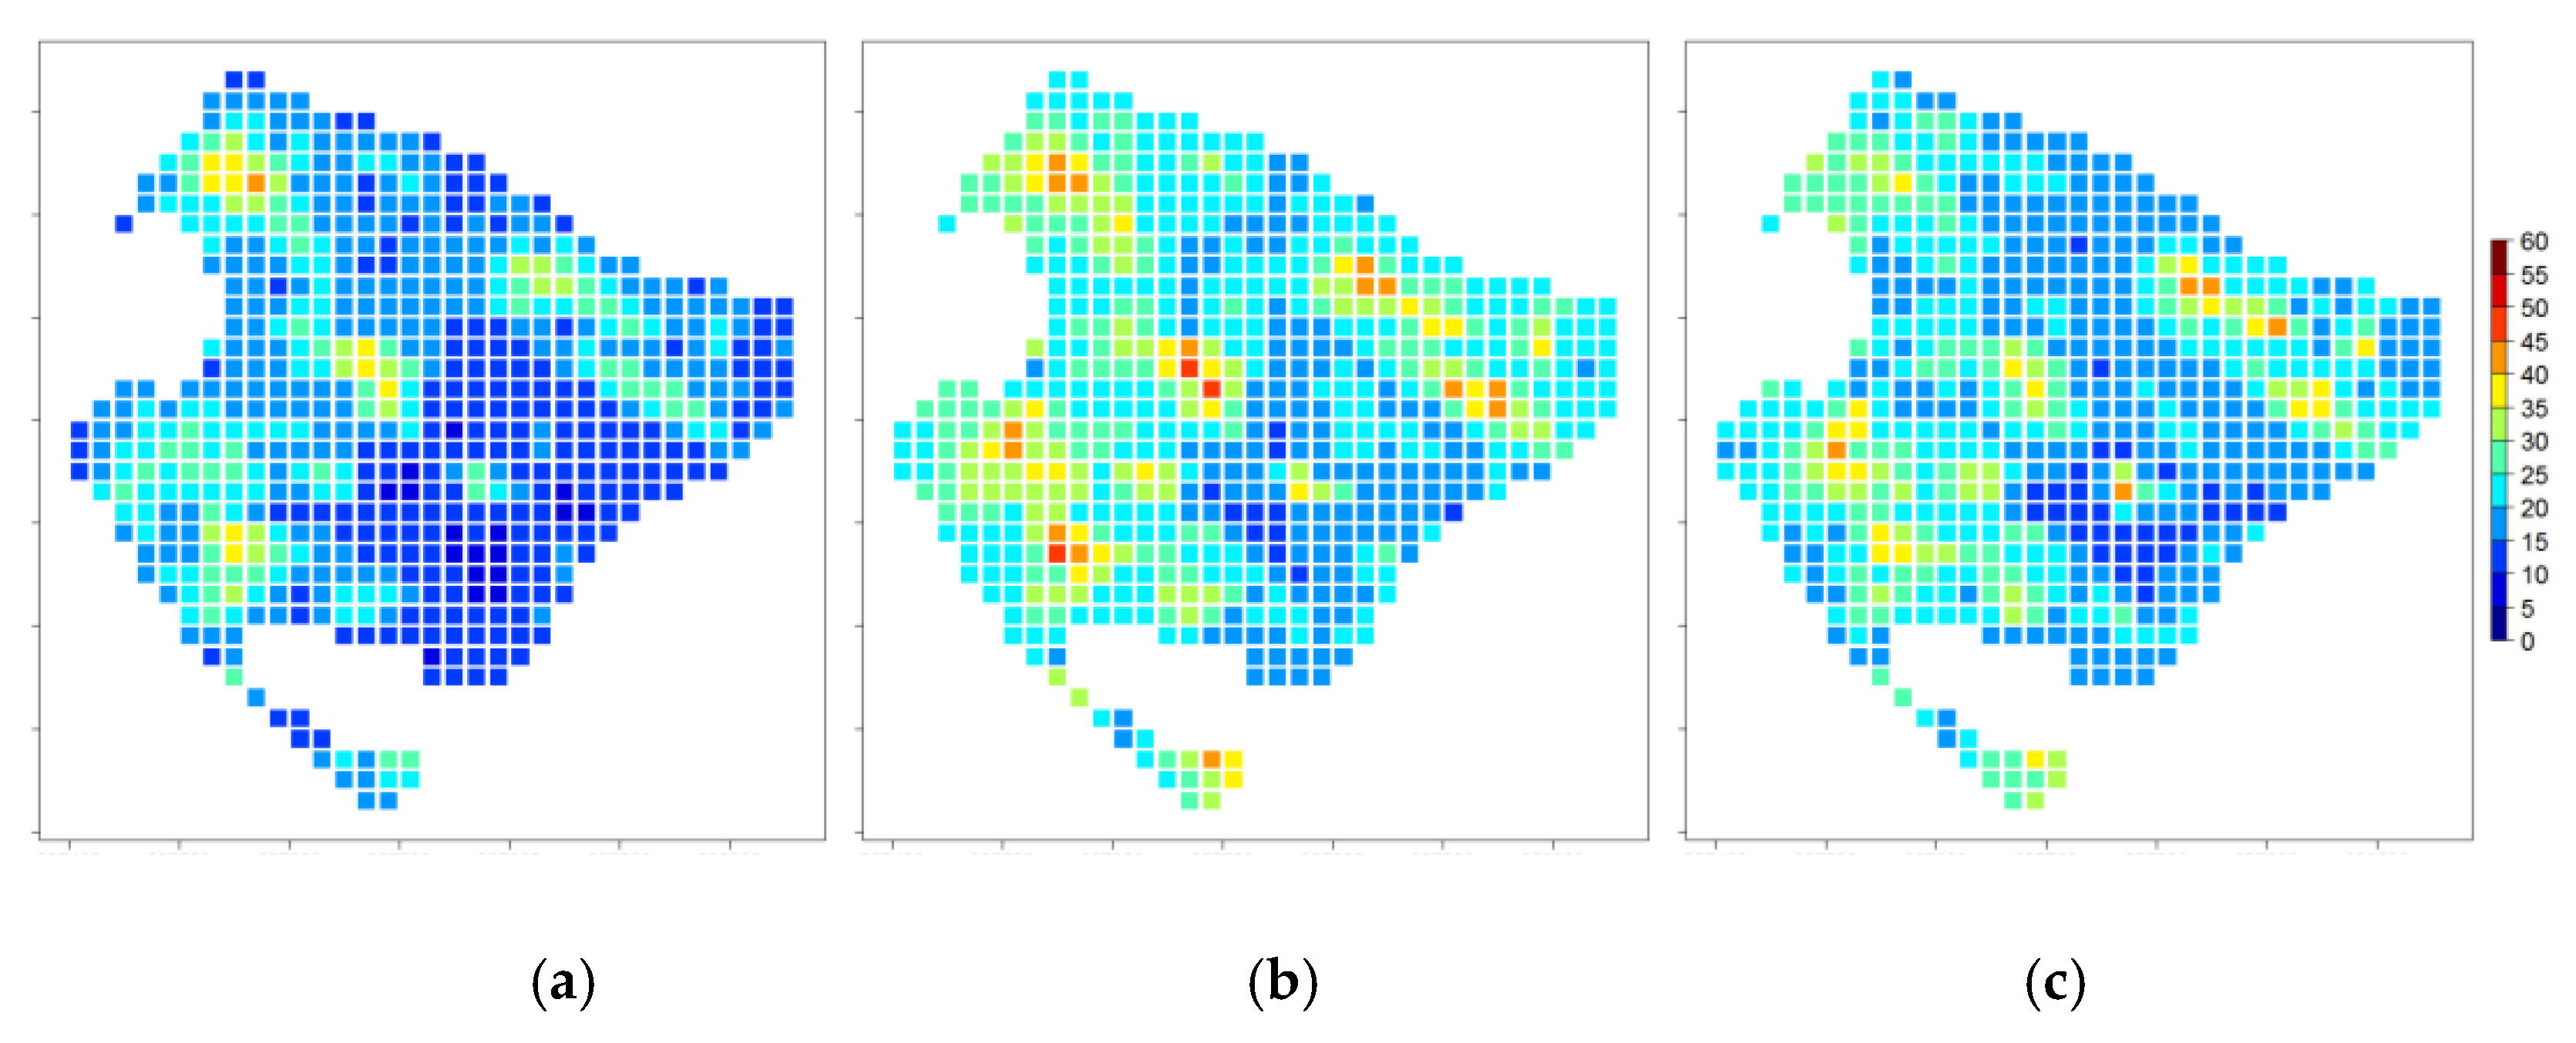
The maps of the soil electrical resistivity estimated by using the optical reflectance combined or not with the parameters derived from the DEM are presented in
Figure 2. The intra-plot spatial variability is well reproduced, and patterns either with low or high values of measured resistivity (
Figure 1) are clearly observable whatever the considered layer. Consistency between measurements and estimations results in acceptable performance levels, with R² of 0.69 and 0.59, and a relative RMSE of 18% and 16%, for the 0–50 and 0–100 cm layers. The correlation is lower for the 0–170 cm layer (R² of 0.39), while the error level remains acceptable (relative RMSE of 20%). Only few difference are observed between the two considered cases (i.e., with or without DEM), the differences between the pixels being inferior to 4.8, 5.2, and 7.1 Ohm.m for the 0–50, 0–100, and 0–170 cm layers, respectively (i.e., lower than the standard deviations observed on measurements). Such observation is confirmed by the statistical metrics, showing comparable level of relative RMSE, and only slight improvements regarding the correlation (R² of 0.74, 0.64 and 0.47 for the 0–50, 0–100, and 0–150 layers, respectively).
This potential for assessing soil variability from remote sensing data seems particularly promising, particularly in the context of precision agriculture. Indeed, the modulation of cultural practices (e.g., seedling density, nitrogen intake) is a corollary of the identification of intra-plot patterns that make it possible to partition zones with supposedly similar properties [
3]. Nevertheless, without ancillary data, the deeper interpretation of the area remains limited, as for electrical resistivity measurements where soil-core samples need to be collected to analyze the delivered signal [
2]. Moreover, the mapping of intra-plot variability offers the perspective of new modeling approaches, which would allow on the one hand to interpret the properties responsible of the observed patterns and on the other hand to analyze the interactions between soil and vegetation.
4.2. Relative Importance of Sentinel-2 Reflectances
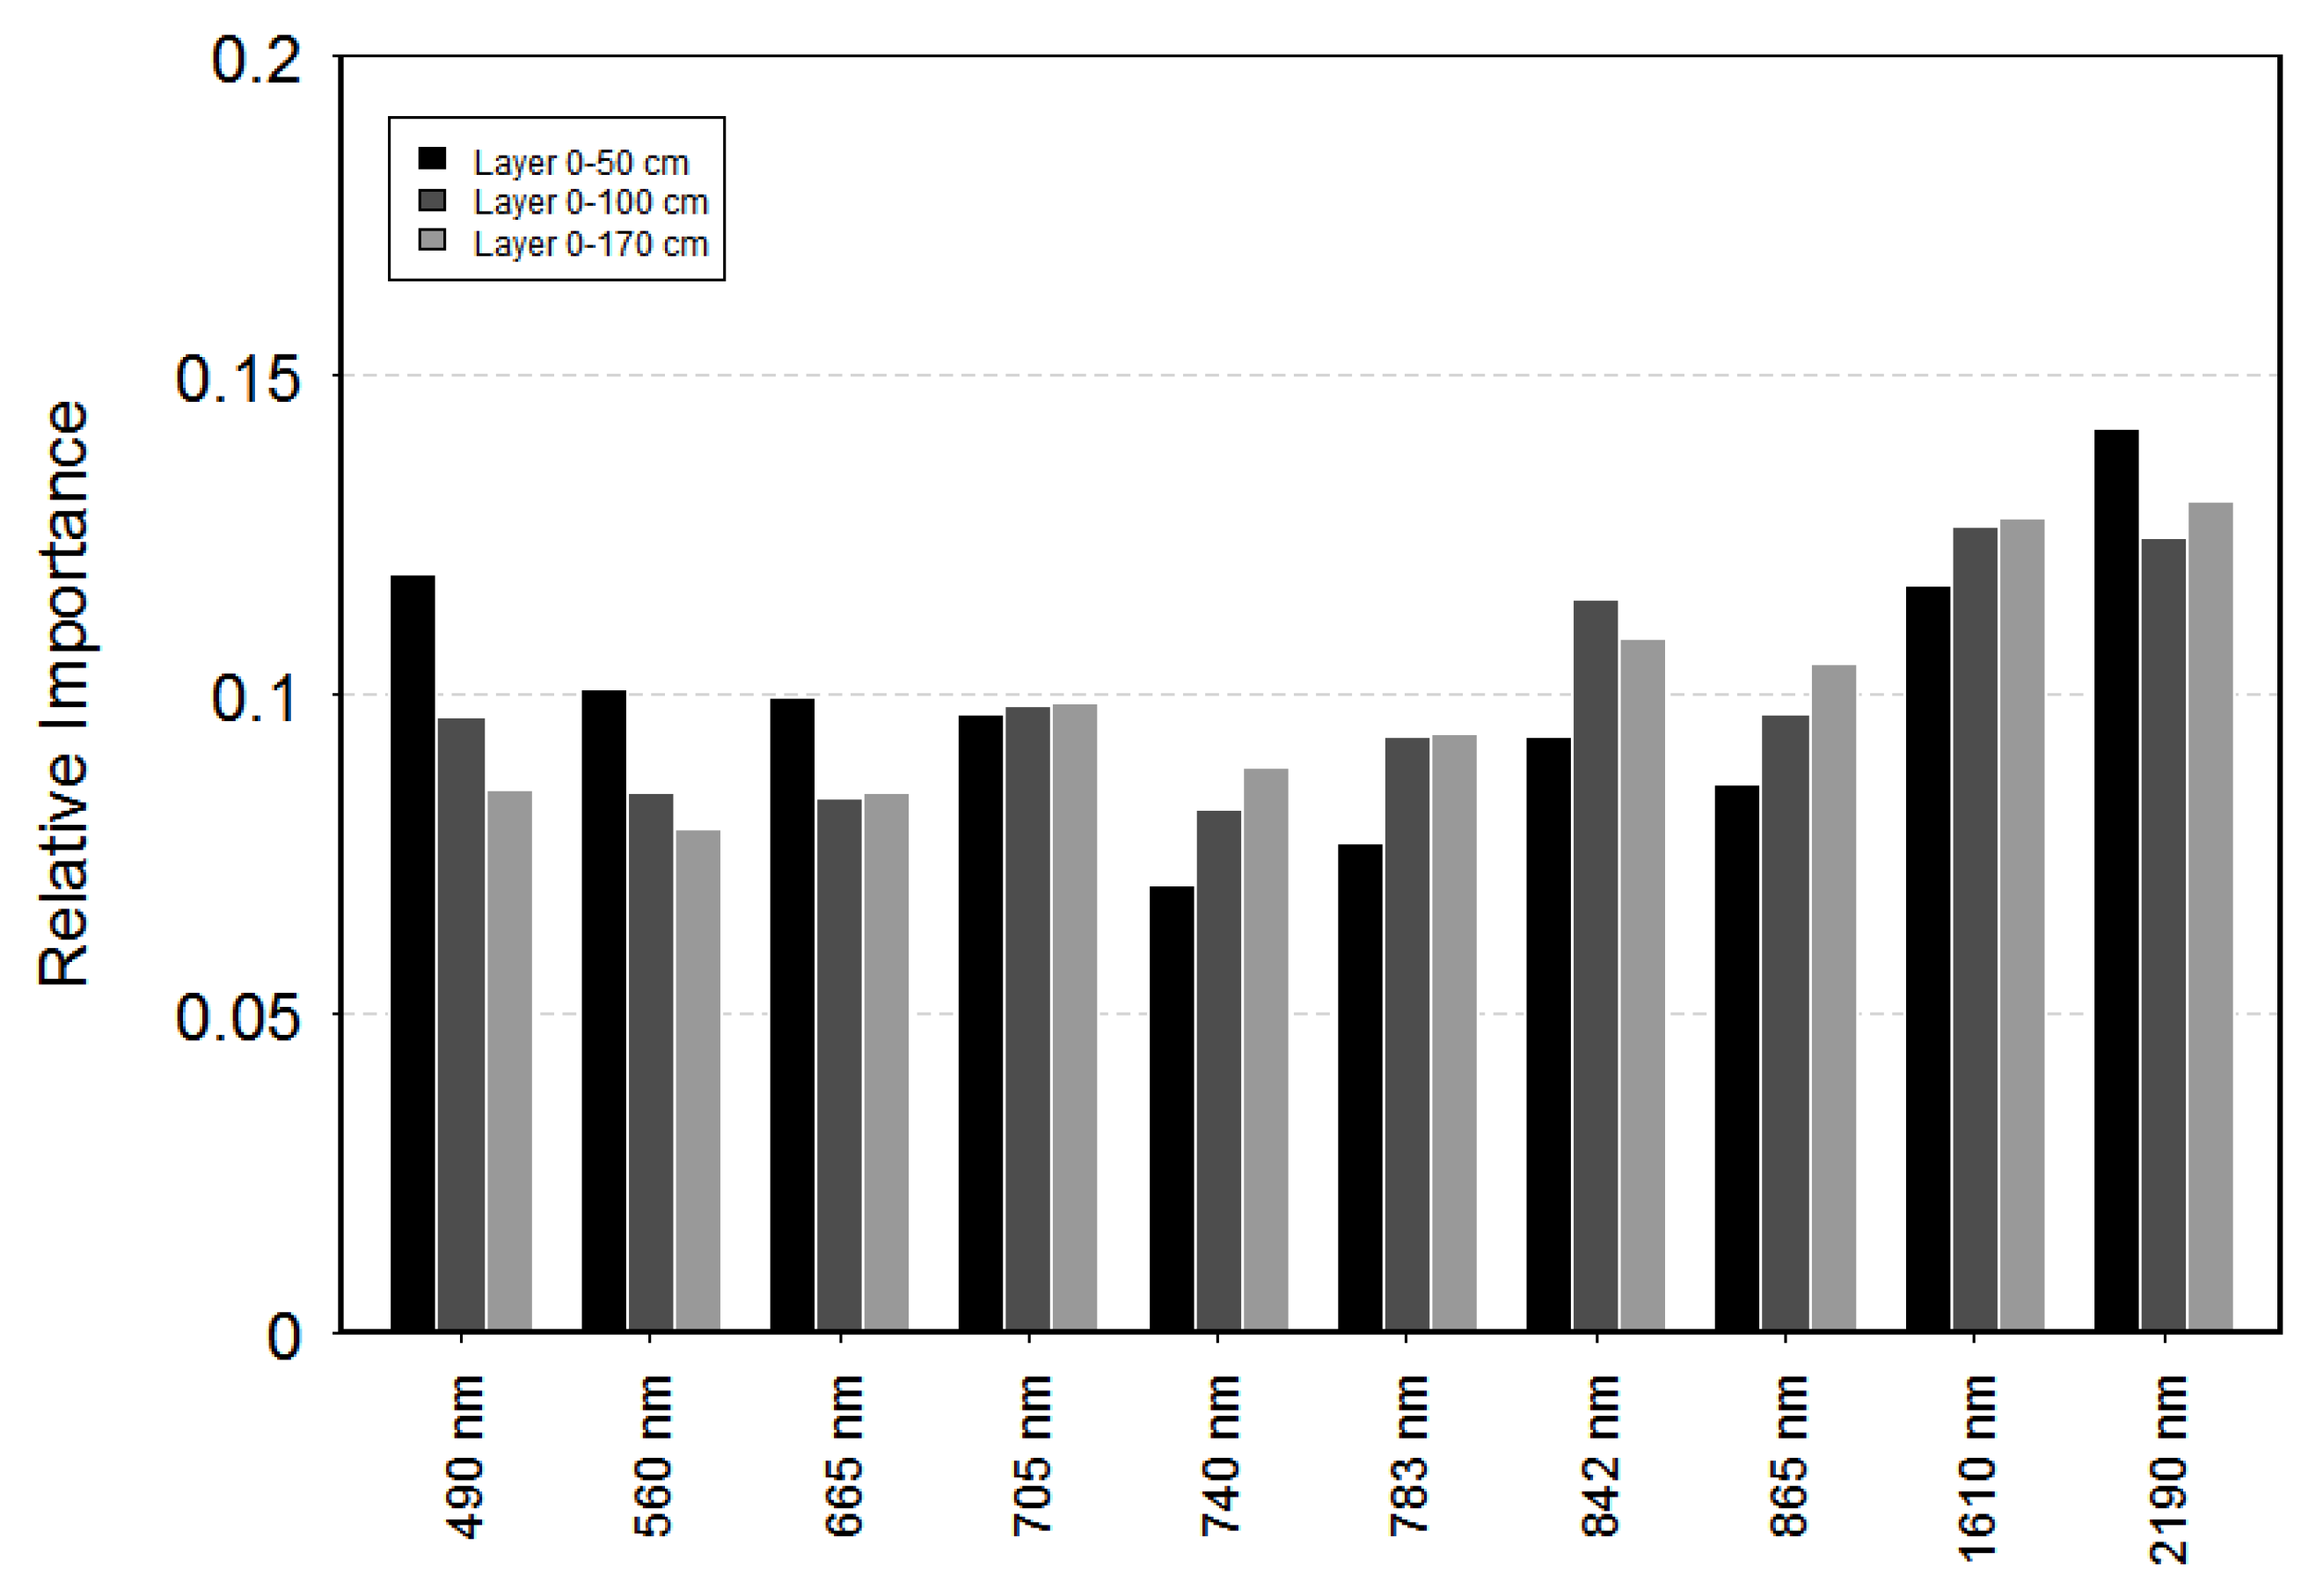
Finally, the relative importance of the predictive input reflectances on soil electrical resistivity estimates are presented in
Figure 3. The values of relative importance range from 0.070 to 0.142 for the 0–50 cm layer, from 0.082 to 0.126 for the 0–100 cm layer, and from 0.079 to 0.130 for the 0–170 cm layer, showing only limited difference whatever the considered soil layer. The highest contrast between the relative importance of reflectances is associated to the top soil layer, as evidenced by the relative difference close to 0.072 between signals acquired at 740 and 2190 nm. However, this analysis highlights an observable trend whatever the soil layer considered, that is the wavelengths acquired in the Short Wavelength InfraRed (SWIR) have a relative higher importance than Visible and Near InfraRed (VNIR) reflectance.
As it stands, these results appear to be mixed, particularly with the aim of identifying the spectral bands that could be combined through a normalized index to characterize the variability of soil conditions. Nevertheless, the first trends observed deserve special attention, and the regular acquisitions provided by the on-going satellite missions can be used as a basis to analyze if the observed behaviors are stable over time or if certain conditions disturb the relative importance of reflectances (in particular the soil moisture conditions).
5. Conclusions
The proposed study addresses the potential of using multi-spectral optical images for the mapping of the soil variability at the intra-field spatial scale. Reflectances acquired by the on-going Sentinel-2 mission constitute the input variable of random forest, trained and validated on independent set of data (i.e., on ~600 pixels of 20 m spatial resolution). Promising results are obtained on the monitored clay loam field, the estimated values showing satisfying statistical performances and spatial patterns consistent with the measured electrical resistivity. The levels of accuracy are naturally higher for the 0–50 cm soil layer (with a R² of 0.69 and a rRMSE of 18%) compared to 0–170 cm soil layer (with a R² of 0.39 and a rRMSE of 20%). Whatever the considered soil layer, optical reflectance allows the retrieval of main structures of soil, the adding of morphological parameters derived from DEM slightly improves the correlation (with a gain regarding the explained variance ranging from 5 to 8% depending on the considered layer). Finally, the analysis of variable importance points out that SWIR reflectances (i.e., 1610 and 2190 nm) bring the most information even if the differences between the signals are of low magnitude.
The robustness of the predictive capabilities offered by the images provided by the Sentinel-2 mission will be addressed by testing the presented procedure on multi-temporal acquisitions. Furthermore, the proposed approach will be extended to other monitored plots, to analyze the spatial representativeness and to identify a consistent cal/val procedure.

