Abstract
Damage leading to failure in concrete and related materials is a complex behavior. Whilst many numerical approaches are available for simulating the degradation of material strength, it is difficult to discriminate between these models experimentally in the high strain rate ballistic impact regime. An experimental method has been developed to determine when local material failure has occurred, and whether the failure can be classed as fracture or granular flow. This method is tested on Kolsky bar and ballistic impact experiments. Comparison with numerical simulations is presented.
1. Introduction
Concrete and related materials are observed to have a significant reduction in strength when exposed to mechanical, thermal, chemical and radiative stresses. This behavior is generally referred to as material damage, however the processes underpinning it are complex and in some cases poorly understood. Damage is particularly important in ballistic impacts where the history (manufacturing conditions, age, temperature cycling, chemical exposure etc.) of the material can drastically affect the result of an impact event (penetration vs. projectile defeat).
One particular physical process which is significant in determining projectile penetration vs. defeat is whether the material fails into large fractures with spalling, or comminution and granular flow. In fracture, a large (millimeter and greater) section of material is ejected from the back surface of the target. In comminution the material is ground into sub millimeter particles, and behaves similar to a soil or granular bed. There are several numerical formulations for simulating the transition from monolithic material with strength to fragmented material with strength or granular soil material, however validating these models at high strain rates is difficult. Examples of commonly used fracture models are Grady-Kipp [1] and Mott. Commonly used granular flow models are Johnson Holmquist and Reidall Heinburg Thomas (RHT). Many numerical simulations include both, but the threshold between these two behaviors is difficult to validate. One significant discriminator between current numerical simulations incorporating these two behaviors is the time after impact at which the failure behavior occurs.
In this paper, a temporally resolved experimental method to discriminate between granular flow and fracture in high strain rate events has been developed. It has been tested on Kolsky bar and ballistic impact experiments using cement and concrete simulant samples, some of which have been pre-damaged through exposure to mechanical and microwave damage.
2. Materials and Methods
In order to simulate concrete a suitable reproducible laboratory simulant was needed. Our laboratory simulant was developed based off Ultra High Performance Concrete (UHPC) with the aggregate replaced by spherical silica forms to maintain consistency in aggregate geometry.
2.1. Sample Preperation
Cement paste and concrete simulant samples were prepared to the mix presented in Table 1. The process for mixing is as follows:

Table 1.
Cement paste and concrete simulant mixes used in the experiments in this paper. The mass values are corrected for loss of material during the mix stages.
- Weigh out cement with standard (0.1 g) precision scales.
- Add water to desired weight, using pipette for control
- Mix water and cement and re-weigh mix to correct for material loss
- Add aggregate to desired weight
- Mix cement paste and aggregate and re-weigh to correct for material loss
- Add plasticizer to desired workability and measure mass added
Using a cake icing bag, the cement was piped into a tray of laser cut PMMA sample molds bolted to a steel plate base. The tray is vibrated at around 15 Hz to agitate air bubbles out of the samples. The samples were moved to a 100% humidity room and allowed to cure for 14 days. Samples of 20 mm diameter and up to 10 mm thick were cast, as well as 10 mm × 10 mm square samples 5 mm thick.
It was necessary to remove the samples from the mold without fracturing them. This was accomplished by heating the PMMA to 80 °C as the cement/concrete has a much lower thermal expansion coefficient. In addition the laser cutting also introduced a taper to the sample molds, so the samples were easy to remove in a specific direction. Samples were polished using standard wet and dry paper on a flat surface, with grit sizes from P240 to P1200. No fluid was used in the polishing and grinding process. Sample parallelism was measured using a micrometer, and samples were ground until parallelism of 1 mrad or better were achieved.
The samples were prepared to have similar properties to UHPC samples with compressive strength of up to 100 MPa. A subset of samples were then exposed to 700 W multimode microwave cavity for 5 min in order to introduce damage.
2.2. Kolsky Bar (Medium Strain Rate)
Kolsky bar experiments were carried out on the Centre for Blast Injury Studies (CBIS) Kolsky bar system. Samples were 10.3 mm × 10.3 mm square with varying thicknesses from 2 mm–5 mm. The square corners of the sample had a 1 mm radius to reduce the corner stress concentration. Inconel bars were used with steel anvils of 2 mm thickness to protect the bar ends from any hard aggregate. Anvils were lapped flat. Sample fracture was recorded using a phantom 7.2 high speed camera. The input and output bar were 12.7 mm diameter Inconel steel alloy. The input and output bar lengths were 500 mm. A 180 mm Inconel striker bar at 5 m/s launch velocity was used. There was good impedance match between the steel anvils and the Inconel bars.
2.3. Ballistic Impact (High Strain Rate)
The CBIS 32 mm light gas gun facility can launch projectiles up to velocities of around 700 m/s [2]. The experiments in the present study launched 6 mm steel ball bearings at the target at impact velocities between 120 m/s and 160 m/s. Spherical impactors were used to avoid tilt and for comparison to numerical simulations. Rear surface failure was recorded using a phantom 7.2 high speed camera, and rear surface velocity measured using a Photonic Doppler Velocimetry (PDV) system [3] and were conducted under vacuum. This preliminary study was conducted on 9 samples.
The exact location where the PDV probe is focused on the rear surface of the target can be measured relative to the high speed camera by using a phosphor card. A still frame from the high speed camera with a scale bar (steel rule) provides a calibrated image with a known scale. This is then used to identify failure regions in the high speed footage, mode of failure and residual momentum. In order to quantify the rear surface failure an algorithm was needed to consistently determine when failure occurred.
2.4. Fracture Thresholding Algorithm
Due to constraints on the frame rate and resolution, Digital Image Correlation (DIC) proved impossible with the data obtained in either the ballistic impact or Kolsky bar experiments. However, as the objective is to determine the threshold between fracture and granular flow, DIC proved not to be required in this study. A simplified algorithm was used to identify where failure was occurring in the material.
The algorithm for identifying fracture was based off an edge detection algorithm. Rather than running the edge detection on a single frame, each pixel was measured as a function of time. Using 10 frames prior to impact, the average pixel intensity could be found, and deviations of greater than 10 standard deviations were used to define failure. This is shown schematically for a pixel in Figure 1. By detecting edges in the temporal direction rather than in the spacial directions, both fractures and granular flow could be identified. Measuring the rear surface of the material in ballistic impact particularly lends itself to this method, as the material is stationary until failure.
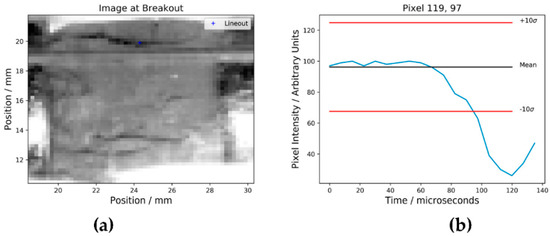
Figure 1.
(a) Image of experiment 3, with pixel on which lineout analysis has been done marked in blue. (b) Pixel intensity as a function of time. The mean of the first ten frames is shown with a black line. The threshold (10 times the standard deviation) is shown by the red lines. At around 105 microseconds the pixel is determined to have failed.
3. Results
3.1. Ballistic Impact
Ballistic impact was carried out on the CBIS 32 mm light gas gun facility. In general the thresholding algorithm determined the fracture or granular flow behavior well, identifying regions of coalesced failure. The PDV data provided velocity information which can also be used to validate numerical codes. Figure 2 a and b show an example of rear surface fracture of an undamaged sample. Breakout is defined as the time at which first movement of the rear surface is observed and is determined from the PDV data. The localised coalesced fractures in the middle were launched as fragments at velocities measured through the PDV as 70 m/s. Outside the central 5 mm of impact, fractures are radial and bifurcating.
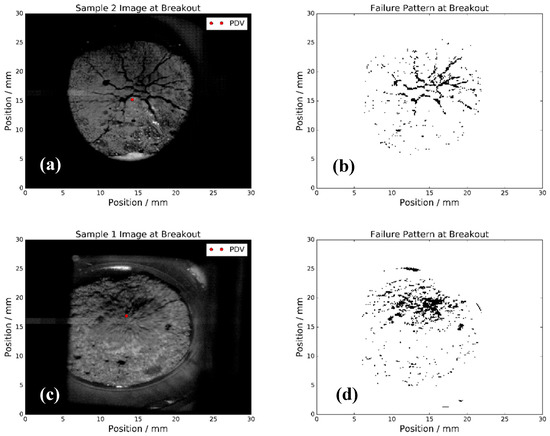
Figure 2.
(a) Image at breakout of shot number two, 20 mm diameter undamaged glass microsphere aggregate sample, spherical impact at 160 m/s. (b) Radial fractures can be seen propagating to the sample edges, in addition to a region of fracture coalescence in the centre. (c) Image of breakout frame of pre-damaged sample being impacted, spherical impact at 160 m/s. (d) Failure pattern using thresholding algorithm, indicating complete granular flow with little or no fracture.
For samples which had been heavily damaged through microwaving at 700 W for 5 min, the material showed clear signs of comminution and granular flow. The example in Figure 2 c and d shows no coalescence of failure pixels into clear fracture lines, and the image shows the material moving in a cloud. The PDV did not record a signal as the surface it was measuring was immediately disrupted.
3.2. Kolsky Bar
The Kolsky bar experiments demonstrated an ability to determine fracture vs. granular flow, however due to the in plane compression prior to fracture, the algorithm showed systematic errors. This was particularly evident at the sample edges and from the right hand input bar, as evidenced in Figure 3.
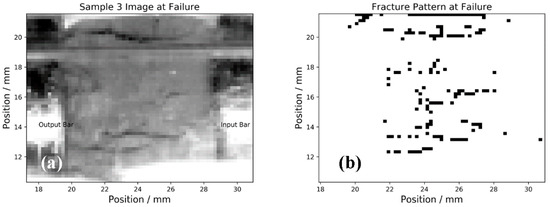
Figure 3.
(a) Image of fracture frame for sample 3, (b) Fracture pattern determined by thresholding algorithm.
Strain gauge data was recorded, and peak stresses at failure were determined. The strain was not calculated, as the material did not achieve good equilibrium due to early fracture and failure. For sample 3 a sample peak stress of 400 MPa was calculated. This is an unusually high stress for UHPC and is more likely caused by the thin sample not providing reasonable coupling, leading to a very low intensity transmitted stress pulse. Calibration data and method for this analysis can be found in [4]. For the damaged sample with aggregate, the lack of clear fracture lines is shown in Figure 4 and this is consistent with observations of the recovered sample which showed a high proportion of powder.
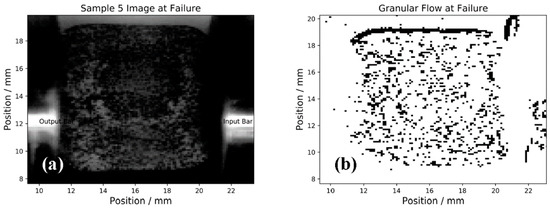
Figure 4.
(a) Image of failure frame. The surface of the cement looks noisy, this is due to the sample breaking up into granules. (b) Failure pattern determined by thresholding algorithm. The failure pattern shows little coherent fractures and is random in location indicating granular flow.
3.3. Numerical Simulations
Preliminary numerical analysis was conducted with AutoDyn. An axi-symmetric 2D model was used, with free boundary conditions on the other boundaries. The impact velocity was 160 m/s for a spherical 4340 steel impactor. The Johnson-Cook strength model was used for the steel [5] with no failure model. For the concrete the RHT model was used with damage parameters from [6]. In this preliminary analysis compressive strengths of 140 MPa for undamaged and 35 MPa for damaged samples were used, with the results shown in Figure 5. The mesh size was 20 microns square with a maximum timestep of 100 picoseconds. The damage parameter can be used to estimate granular flow vs. fracture by looking at the coalescence of damaged, partially damaged and undamaged material at the rear surface.
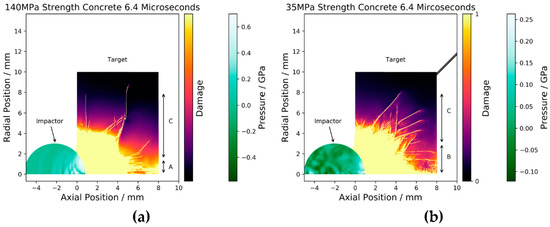
Figure 5.
(a) 140 MPa compressive strength concrete simulant with damage parameter shown after 6.4 microseconds. The region of granular flow marked A is at 2.0 mm radius and radial fracture marked C occurs out to 8.0 mm radius. (b) 35 MPa residual strength damaged concrete simulant with damage parameter shown after 6.4 microseconds. The granular flow region is no longer present with coalesced fracturing marked B occurring at a radius of 3.0 mm.
4. Discussion
The rear surface measurements for the ballistic study here allow comparison with numerical simulations. Both provide a binary threshold for failed vs. intact material, and so the same fracture analysis can now be applied to both experimental and numerical simulations. In this paper only qualitative comparisons have been drawn, identifying areas of random continuous damage as granular flow, with isolated contiguous regions as fracture. Quantitative analyses of patterns like this exist for a number of disciplines in image recognition, and in future these techniques can be applied equally to numerical simulations and experimental results.
The Kolsky bar experiments are capable of measuring fracture, however adjusting for the longitudinal compression is required, and the experimental imaging setup could be improved to make better use of the available resolution. In order to address the movement of the sample prior to fracture, an improved edge detection algorithm combining a Sobel filter with time axis thresholding, or generalizing the kernel operation to three dimensions could be investigated.
Conducting the necessary statistical study to completely validate this experimental approach is the next step, as well as measuring quasi static material behavior in a flexure test. This data can be used to populate the numerical codes with accurate static data, and test the performance of these codes with the introduction of microwave pre-damage in the samples.
5. Conclusions
- A sample preparation method has been developed which allows high tolerance, reproducible, samples to be manufactured in moderate batch sizes.
- An experimental method of identifying localized sample failure in a ballistic impact experiment has been developed which allows more direct comparison to numerical simulations.
- The thresholded images can be compared qualitatively to numerical simulations and qualitatively discriminate fracture and granular flow in ballistic impact.
- The method works with Kolsky bar experiments, however not as reliably due to sample motion prior to failure.
Author Contributions
G.T., A.C., D.S. and W.P. conceived and designed the experiments; G.T. and A.C. performed the experiments; D.M. contributed Kolsky bar analysis tools; G.T. analyzed the data; G.T. wrote the paper.
Acknowledgments
The project or effort depicted was or is sponsored by the Department of the Defense, Defense Threat Reduction Agency under grant HDTRA1-15-1-0059. The content of the information does not necessarily reflect the position or the policy of the federal government, and no official endorsement should be inferred.
Conflicts of Interest
The authors declare no conflict of interest. The founding sponsors had no role in the design of the study; in the collection, analyses, or interpretation of data; in the writing of the manuscript, and in the decision to publish the results.
References
- Grady, D.E.; Lipkin, J. Criteria for impulsive rock fracture. Geophys. Res. Lett. 1980, 7, 255–258. [Google Scholar] [CrossRef]
- Nguyen, T.-T.; Masouros, S.; Tear, G.; Proud, W.G. Investigation of Ballistic Penetration through Tibia Soft Tissue Simulant. In Proceedings of the 20th Annual Conference on the Shock Compression of Condensed Matter, St. Louis, MO, USA, 9–14 July 2017. [Google Scholar]
- Strand, O.T.; Goosman, D.R.; Martinez, C.; Whitworth, T.L.; Kuhlow, W.W. Compact system for high-speed velocimetry using heterodyne techniques. Rev. Sci. Instrum. 2006, 77, 083108. [Google Scholar] [CrossRef]
- Bo, C. Investigation of the Effects of High Pressure Pulses on Biological Samples; Imperial College London: London, UK, 2013. [Google Scholar]
- Johnson, G.R.; Cook, W.H. A constitutive model and data for metals subjected to large strains high strain rates and high temperatures. In Proceedings of the Seventh International Symposium on Ballistics, Hague, The Netherlands, 19–21 April 1983. [Google Scholar]
- Tu, Z.; Lu, Y. Evaluation of typical concrete material models used in hydrocodes for high dynamic response simulations. Int. J. Impact Eng. 2009, 36, 132–146. [Google Scholar] [CrossRef]
Publisher’s Note: MDPI stays neutral with regard to jurisdictional claims in published maps and institutional affiliations. |
© 2018 by the authors. Licensee MDPI, Basel, Switzerland. This article is an open access article distributed under the terms and conditions of the Creative Commons Attribution (CC BY) license (https://creativecommons.org/licenses/by/4.0/).