Abstract
In this paper, dynamic fracture process and strain rate effect of a porous SiC ceramic were investigated. The failure process under dynamic loading conditions was monitored by a high-speed camera. Digital image correlation (DIC) method was further utilized to calculate the surface strain field. The high-speed images show that crack initiates in the center of the specimen and then propagates to the entire specimen under dynamic loading. In addition, DIC result showed that cracks occur on the surface of the specimen formed a band. And the band finally caused the collapse of the specimen. The test results showed that compressive strength of the porous SiC ceramic is rate sensitive. Under quasi-static conditions, the compressive strength is about 120 MPa, while in dynamic conditions strength increased to 247 MPa. Energy absorption during the deformation process is much larger under dynamic loading.
1. Introduction
The porous SiC ceramics because of its low density and exceptional shock resistance are widely used in lightweight sandwich panel, filters for hot-gasses, dust collectors and armor applications [1,2,3,4,5]. The porous SiC ceramics used in energy absorption structures may be exposed to the impact of debris. Thus, it is important to investigate the failure mechanism of porous SiC ceramics under dynamic loading conditions.
In literature, investigations have been conducted on fracture mechanisms of porous SiC ceramics. Li et al. [6] explored the influences of molding pressures, bonding phase contents, and SiC particle sizes on the flexural strength of SiC-based porous ceramics. It is found that the SiC particle size is the key factor that influences the flexural strength of the SiC-based porous ceramics. Deng et al. [7] used a grain fracture model to quantitatively analyze the crack-tip blunting mechanism in porous ceramics and revealed that the crack tip blunting increases the fracture toughness of porous ceramics. Martin [8] conducted plate-impact tests on two sintered silicon carbides with different porosity and results showed that the difference in porosity distribution results in no discernable difference in their Hugoniot Elastic Limit values and spall strengths.
The few published work is focused on the effect of strain-rate on the porous ceramics. In this paper, quasi-static and dynamic experiments on a porous SiC ceramic were performed. Stress-strain curves under quasi-static and dynamic loading were obtained and during tests, high-resolution images were captured to observe the dynamic failure process of the specimen. Digital image correlation (DIC) method was also used to calculate the full surface strain field during the failure process.
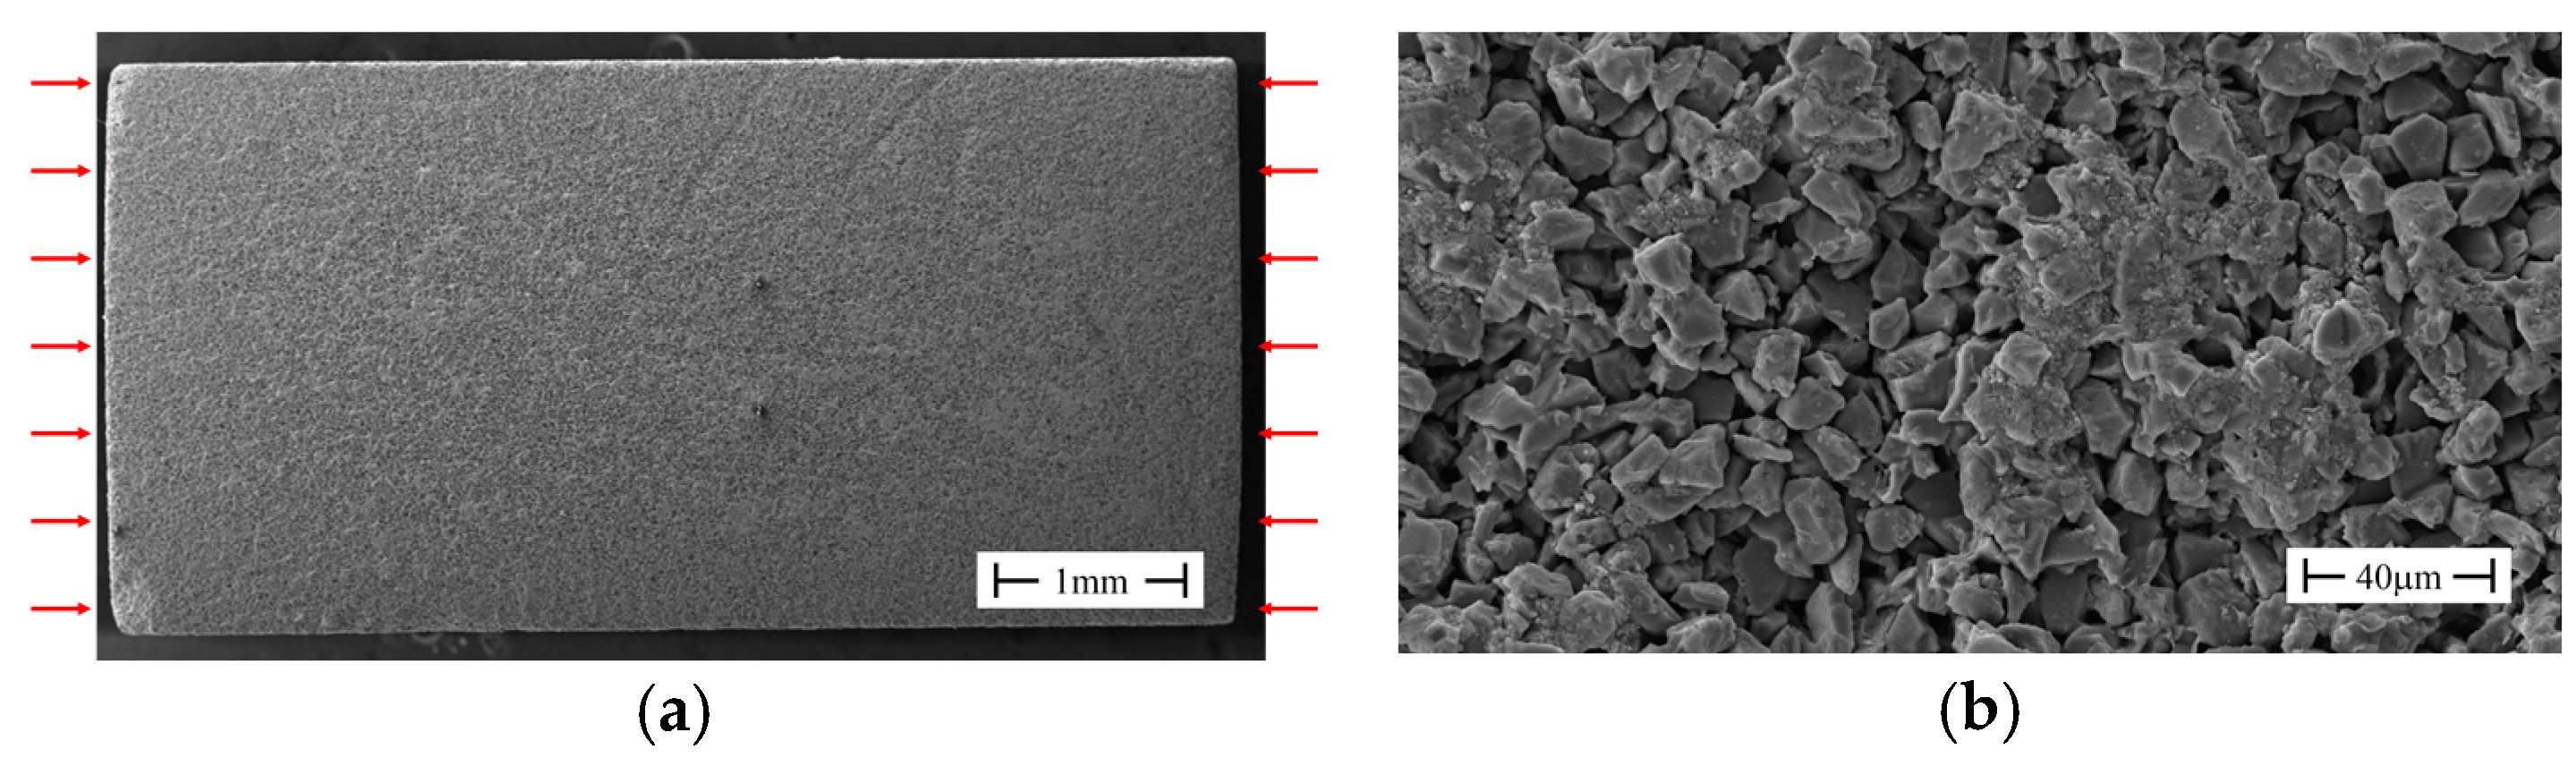
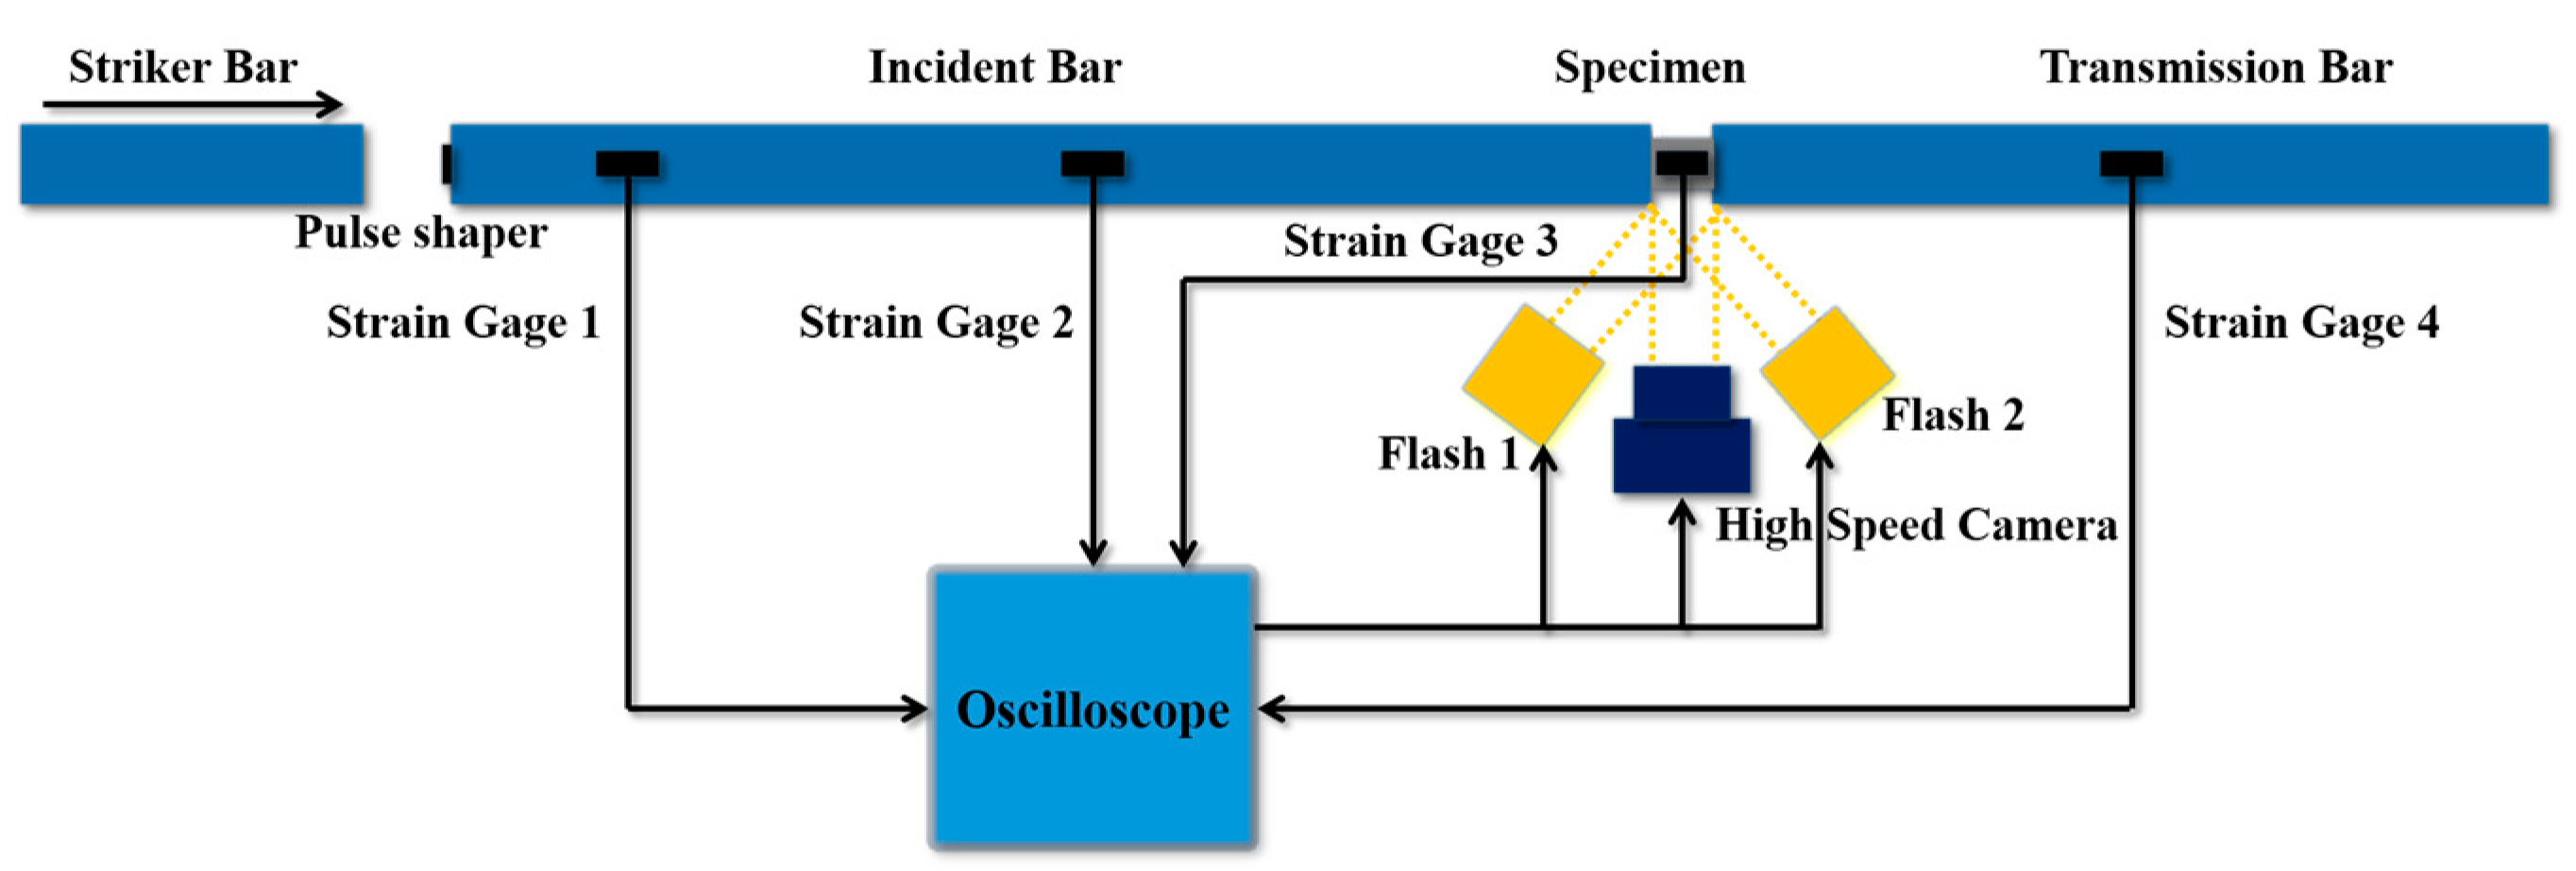
2. Material and Experiment
Generally, the porous SiC ceramics are manufactured by hot press method. The density of the as-received plates of size 50 × 50 × 5 mm3 was 1.9 g/cm3. The porosity was 30% which is measured by using Archimedes principle. The specimens of size 5 × 6 × 3 mm3 were cut from as received SiC plates. The loading surfaces were polished to ensure the parallelism of 5 micrometer. Macroscopic and microscopic pictures of a representative specimen are shown in Figure 1a,b, respectively. The loading direction is also shown in Figure 1a. The size of the grain and pore are both about 10 μm on average.
Figure 1.
SEM micrograph of a representative specimen. (a) Macroscopic; (b) Microscopic. Note: (i) Average grain and pore size are both about 10 μm; (ii) Red arrows show the loading direction.
The quasi-static experiments were performed first on an electronic universal testing machine at the strain rate of 5 × 10⁻³ s−1, followed by the dynamic compression tests completed using a traditional split Hopkinson pressure bar (SHPB) setup. Figure 2 shows the schematic setup of the dynamic compression tests. The dynamic compression tests are performed at strain-rate of about 200 s−1. To deform the specimens at constant strain-rate during dynamic loading, the cubic pulse shapers of copper were used in tests.
Figure 2.
Schematic setup of SHPB with a high-speed camera system. Note: (i) Compared to conventional SHPB set-up, a copper pulse shaper is placed on the incident bar end; (ii) Strain gage 1 is used to trigger oscilloscope and the high-speed camera and the flashlights are then triggered by the oscilloscope, and strain gages 2 and 4 are used to record the reflected and transmitted signals. Strain gage 3 is mounted on the specimen to measure the strain directly during its deformation process.
According to one-dimensional elastic stress wave theory, the strain (), stress () and strain rate () of the tested specimen can be obtained using the following equations:
where and are the reflected and transmitted strain waves which are measured by the strain gages 2 and 4, respectively (see Figure 2); , and are the longitudinal elastic wave velocity, Young’s modulus and the cross-section area of the loading bars; and are the length and cross-section area of the compressive specimen.
Real-time images of the specimens under dynamic loading were captured by a high-speed camera the framing rate of 1,000,000 frames per second with the specimen’s resolution of 600 × 500 pixels.
Three methods were used to measure the compressive strain during dynamic loading from the gauges on the bars, strain gage on the specimens and DIC method. In literature, due to the extremely low failure strain of brittle materials which is normally less than 1%, the system errors caused by the unavoidable gap between the loading bars and the specimen, the strain calculated by SHPB method is not accurate. On the other hand, the strain gage fixed on the specimen using the glue that can infiltrate into the porous specimen. In addition, as shown in Figure 1b, the specimen has a sags and crests surface in detail. The strain gage cannot adhere to the surface perfectly. Therefore, the strain measured by the strain gage can also introduce system errors due to the infiltration of glue and adhesive problem. To obtain an accurate compressive strain of the specimen, DIC method was utilized to calculate the surface strain using the high-speed photographs. The speckles pattern is shown in Figure 3b.
Figure 3.
Specimen observation under telecentric lens (a) Original surface; (b) Surface with speckles.
3. Results and Discussion
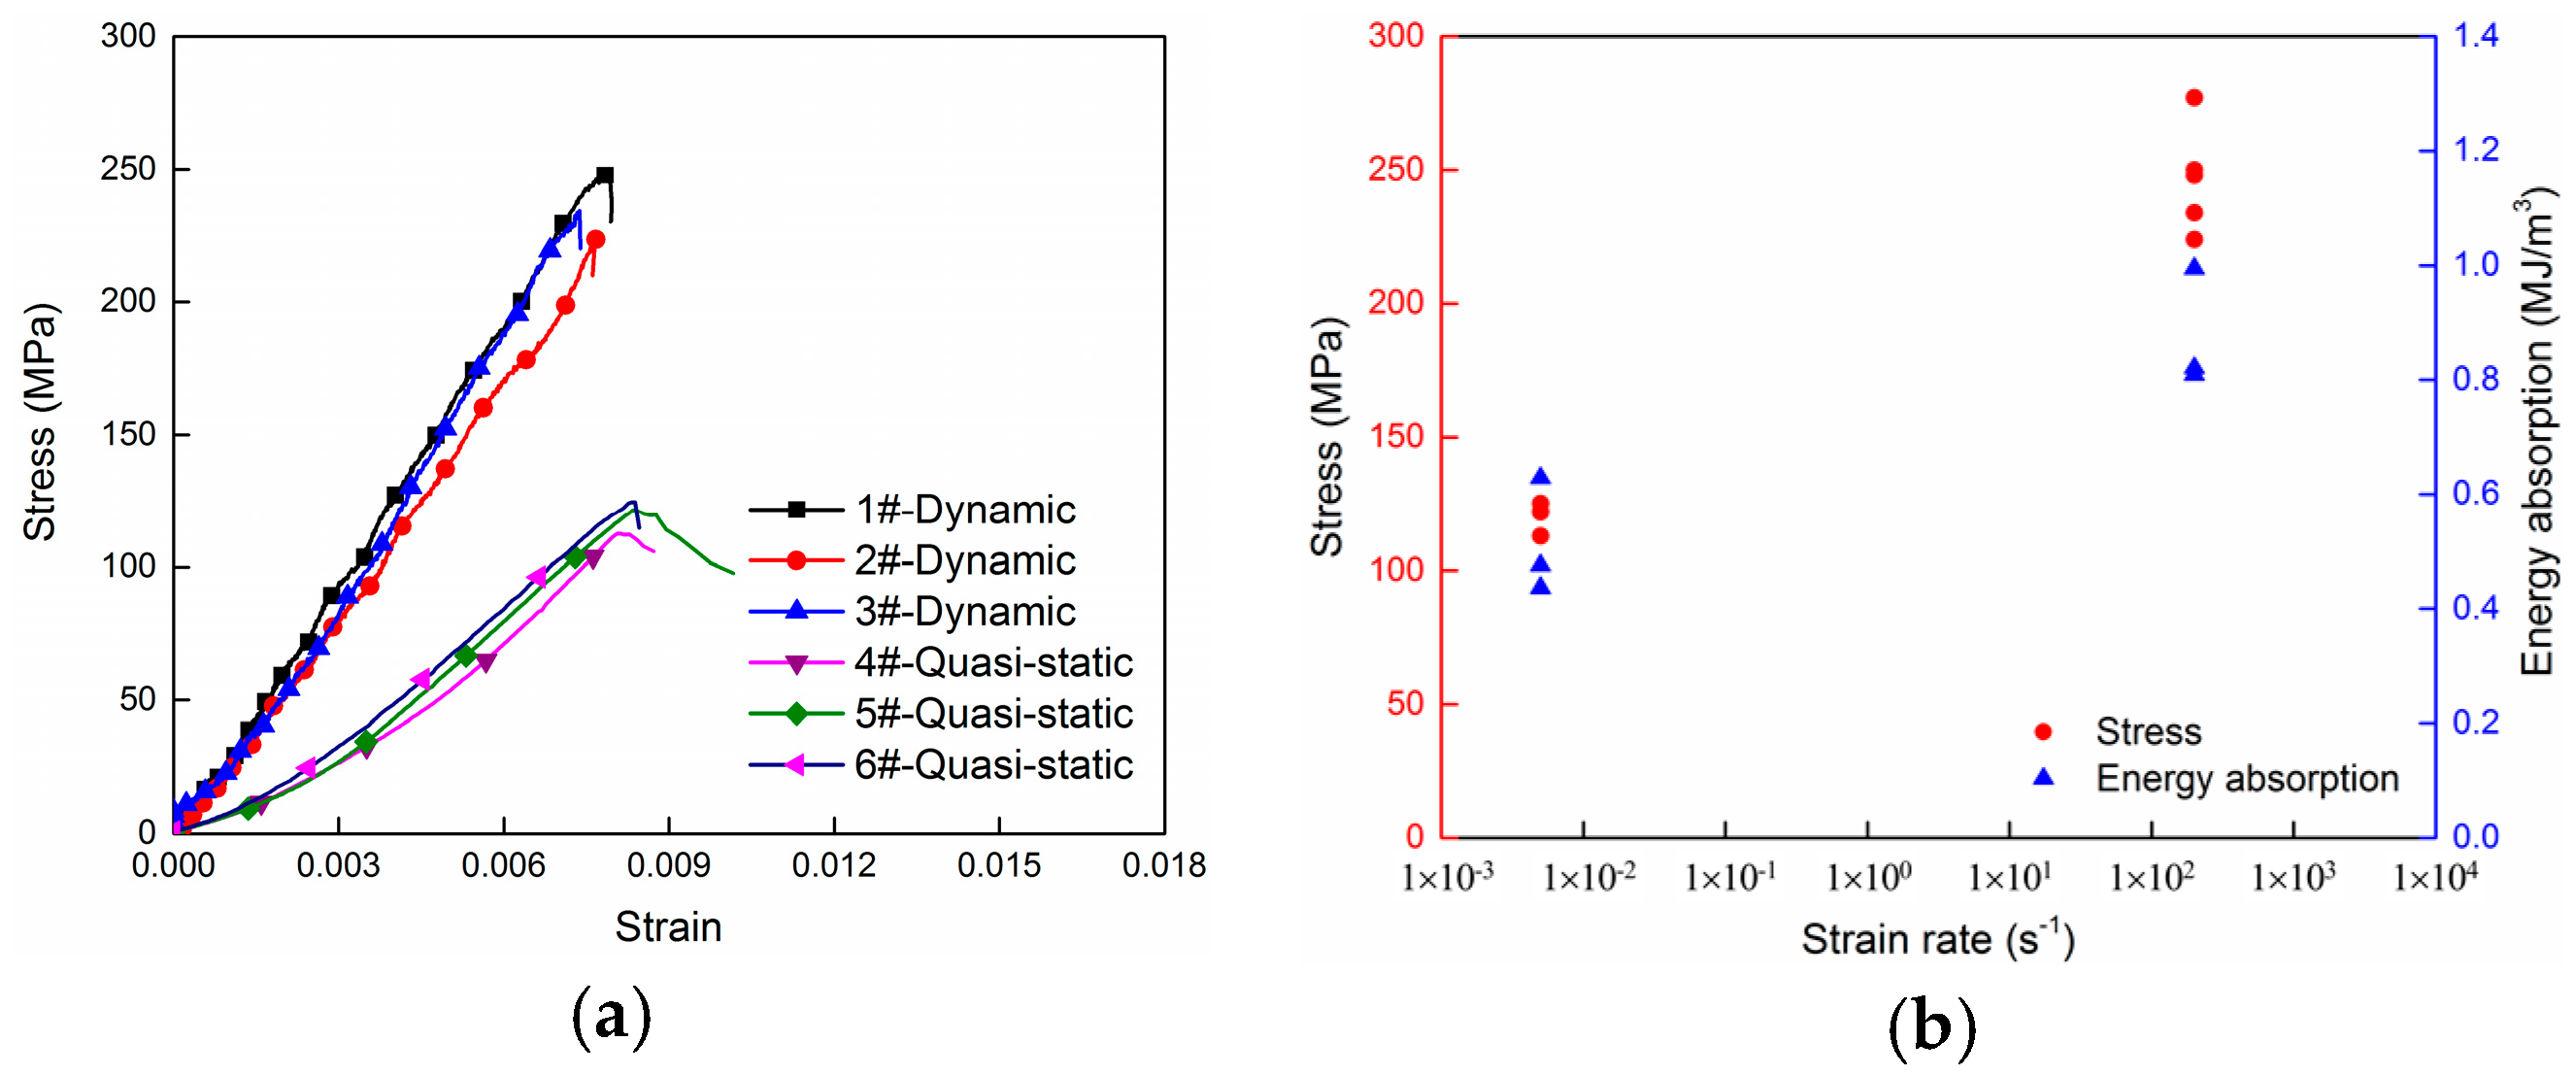
3.1. Experimental Data
Representative original data obtained by SHPB are shown in Figure 4a. Incident wave, reflected wave and transmitted wave are obtained by the strain gage mounted on the bars. Reflected wave has a plateau region during the deformation, which means constant strain rate is achieved during the loading process which is important to accurately report the compressive strength of the specimens.
Figure 4.
(a) Typical original oscilloscope data of SHPB. The reflected wave has a plateau in the start region; (b) Comparison of strain calculated by DIC method, SHPB method, and strain directly obtained from strain gage attached to the specimen.
The strain-time curves of the same specimen measured by the three methods are shown in Figure 4b. The strain measured by strain gage directly agrees with DIC result very well, while the strain calculated by SHPB method is much larger. This means that strain gage mounted on the specimen has enough accuracy, while strain calculated by SHPB method is not suitable for brittle materials like the porous SiC ceramics.
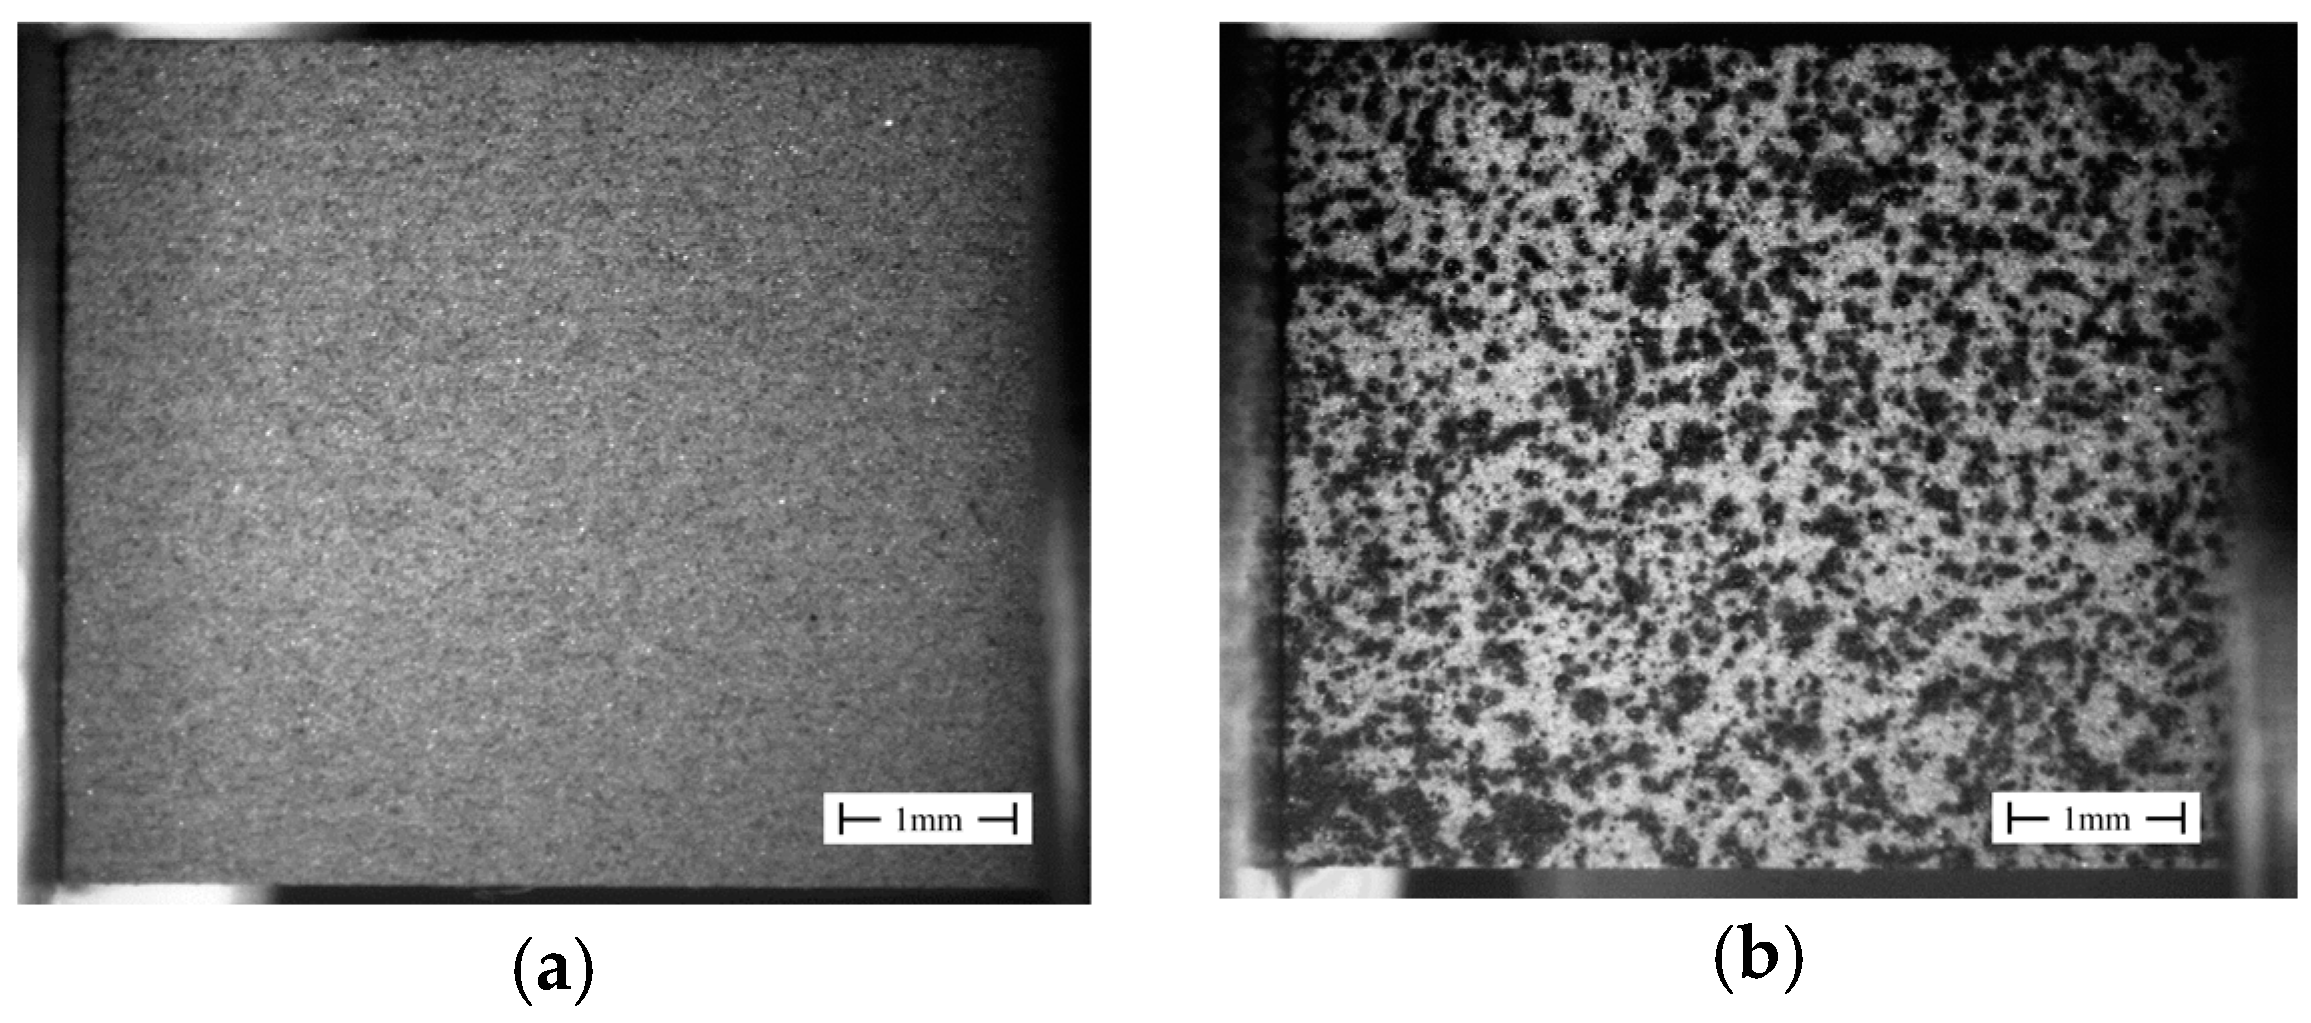
3.2. Fracture Process
Figure 5 shows the failure process along with the stress-time curve. Besides the curve, two original images are presented to represent the crack’s shape. To make the cracks obvious, the different value images calculated by minus number 1 picture with 2–7 pictures marked on the curve are shown below the curve. The crack initiated from the center of the specimen circled in the no. 4 picture, then propagated to the entire specimen. The velocity of the crack propagation is about 1000 m/s. Zig-zag crack was found in No. 6–7 pictures on the surface of the specimen. However, Hu et al. [9] reported that the specimen would fail firstly from the corner and then expanded to the whole specimen in AlN. It is different from what is observed in Figure 5. But the zig-zag shaped cracks observed during the crack propagation process which is consistent with the results of Hu et al. [9].
Figure 5.
Failure process images of a represent dynamic test. Note: (i) The numbers under each picture corresponding to the number marked in the curve; (ii) t1 = 46 μs, t2 = 49 μs, t3 = 50 μs, t4 = 51 μs, t5 = 52 μs, t6 = 53 μs, t7 = 54 μs; (iii) The pictures beside the curve represent the original images obtained; (iv) The propagation velocity of the crack can be calculated by No. 4–5 pictures. Zig-zag crack can be found in No. 6–7 pictures.
To validate the phenomenon observed in Figure 5, specimens with speckles were also tested using high-speed camera. Figure 6 shows a representative result. The strain field confirmed that the crack initiated in the center of the specimen instead of corners. Before the peak stress was reached, the specimen’s strain field showed a uniform compressive deformation. And after the peak stress is reached, the specimen collapsed into pieces in a very short time. Zig-zag crack and crack propagation velocity was also confirmed from pictures 3–6. And another crack showed on the surface of the specimen, together with the former crack to form a band which finally caused the collapse of the specimen as shown in picture No. 5–6.
Figure 6.
DIC result of a representative failure process. Note: (i) The numbers under each picture corresponding to the number marked in the curve; (ii) t1 = 40 μs, t2 = 47 μs, t3 = 48 μs, t4 = 49 μs, t5 = 50 μs, t6 = 53 μs; (iii) The pictures beside the curve represent the original images obtained; (iv) The propagation velocity of the crack can be calculated by No. 3–4 pictures. Zig-zag crack can be found in No. 5–6 pictures.
3.3. Strain Rate Effect
Stress-strain curves are shown in Figure 7 and tabulated data is presented in Table 1. The stress was calculated directly through the usual SHPB technique (Equation (1) in Section 2). Under dynamic loading, the strength (247 MPa in average) was almost two times higher compared to quasi-static loading (120 MPa in average). But they share nearly the same failure strain. Energy absorption is much larger under dynamic loading. Stress and energy absorption vs. strain rate curves are shown in Figure 7b.
Figure 7.
(a) Stress-strain curves under dynamic loading and quasi-static loading; (b) Stress and energy absorption vs. strain rate. Note: (i) Strains were measured by strain gage mounted on the specimens and stresses were calculated by strain gage mounted on transmission bar using Equation (1) in Section 2; (ii) Positive strain rate effect is confirmed.
Table 1.
Quasi-static and dynamic results.
4. Conclusions
Quasi-static and dynamic tests of a porous SiC ceramic were performed. High-resolution images were captured during tests to observe the specimens’ dynamic failure process. DIC method was applied to calculate the strain field during the specimen’s deformation process. The following conclusions can be obtained from this research work:
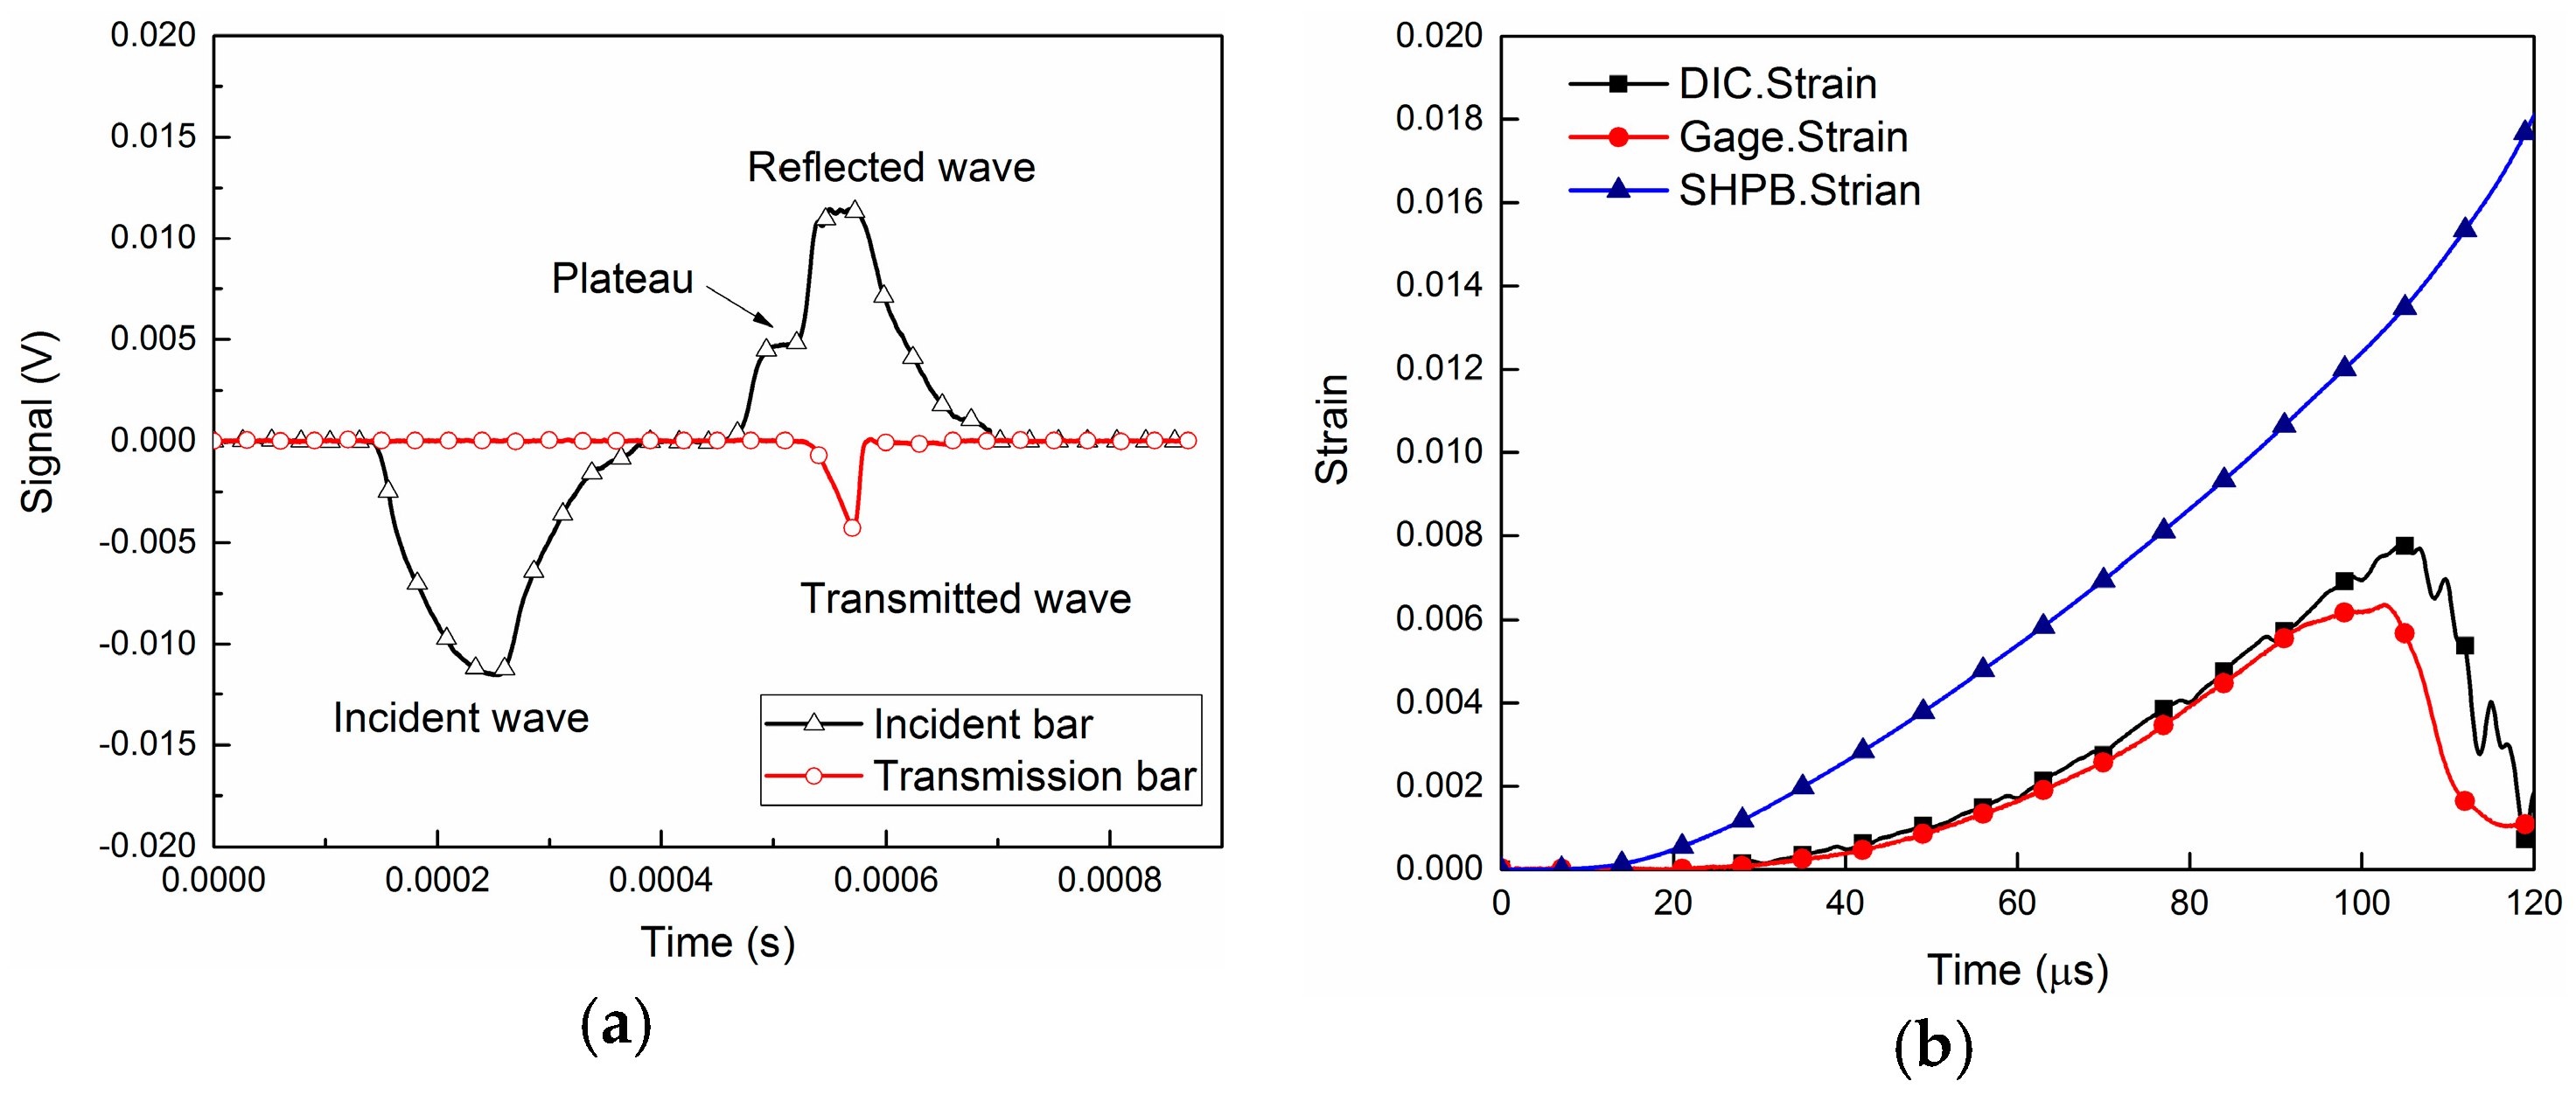
- Three methods were used to measure the strain of the specimen during deformation and the results show that DIC method is the best while strain gage mounted on the specimen is also reliable. However, strain calculated by SHPB method is not suitable for brittle materials like porous SiC ceramic.
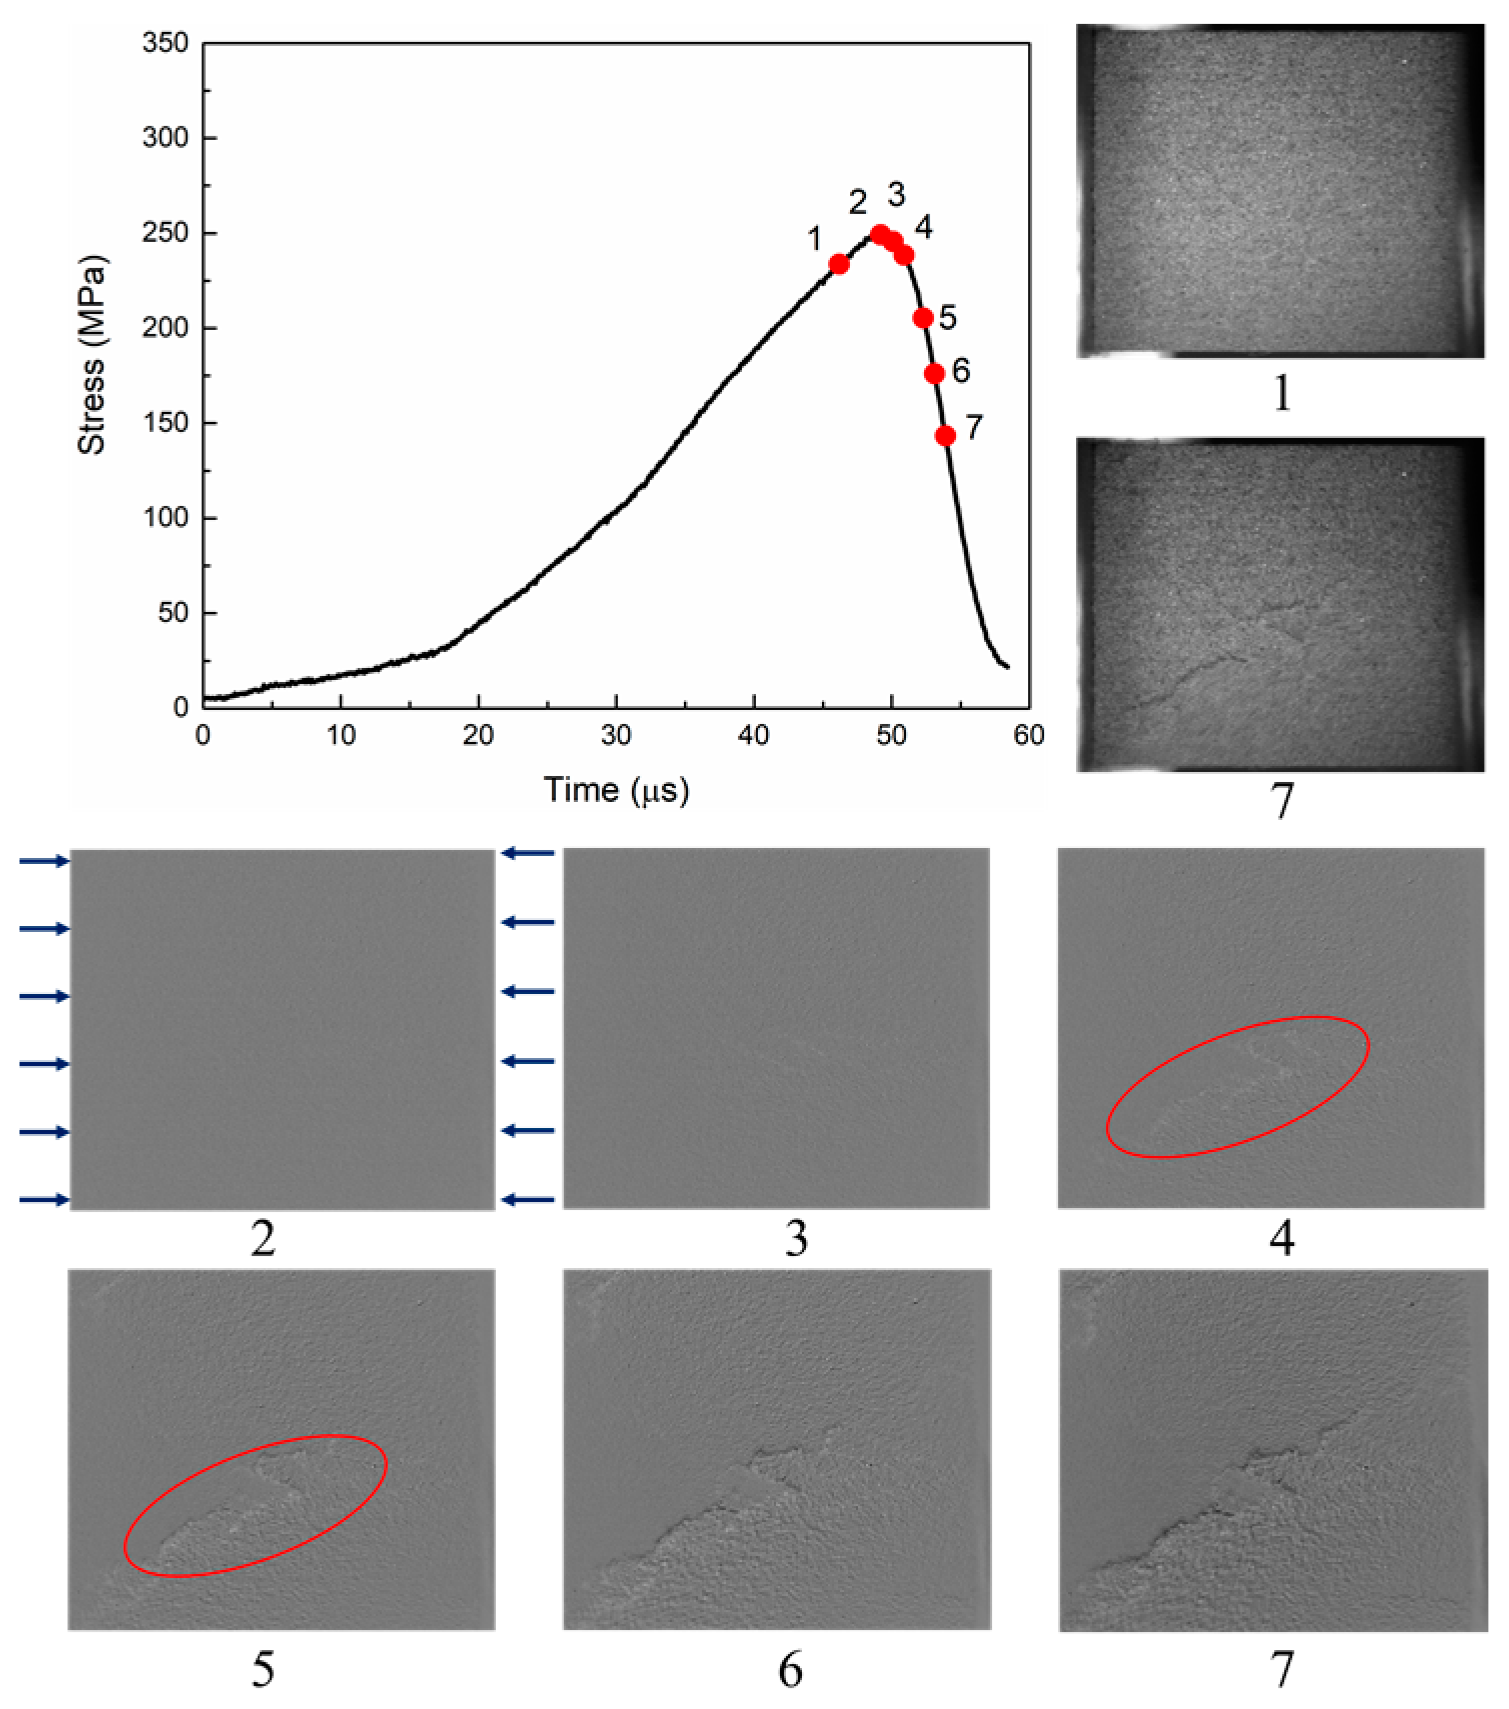
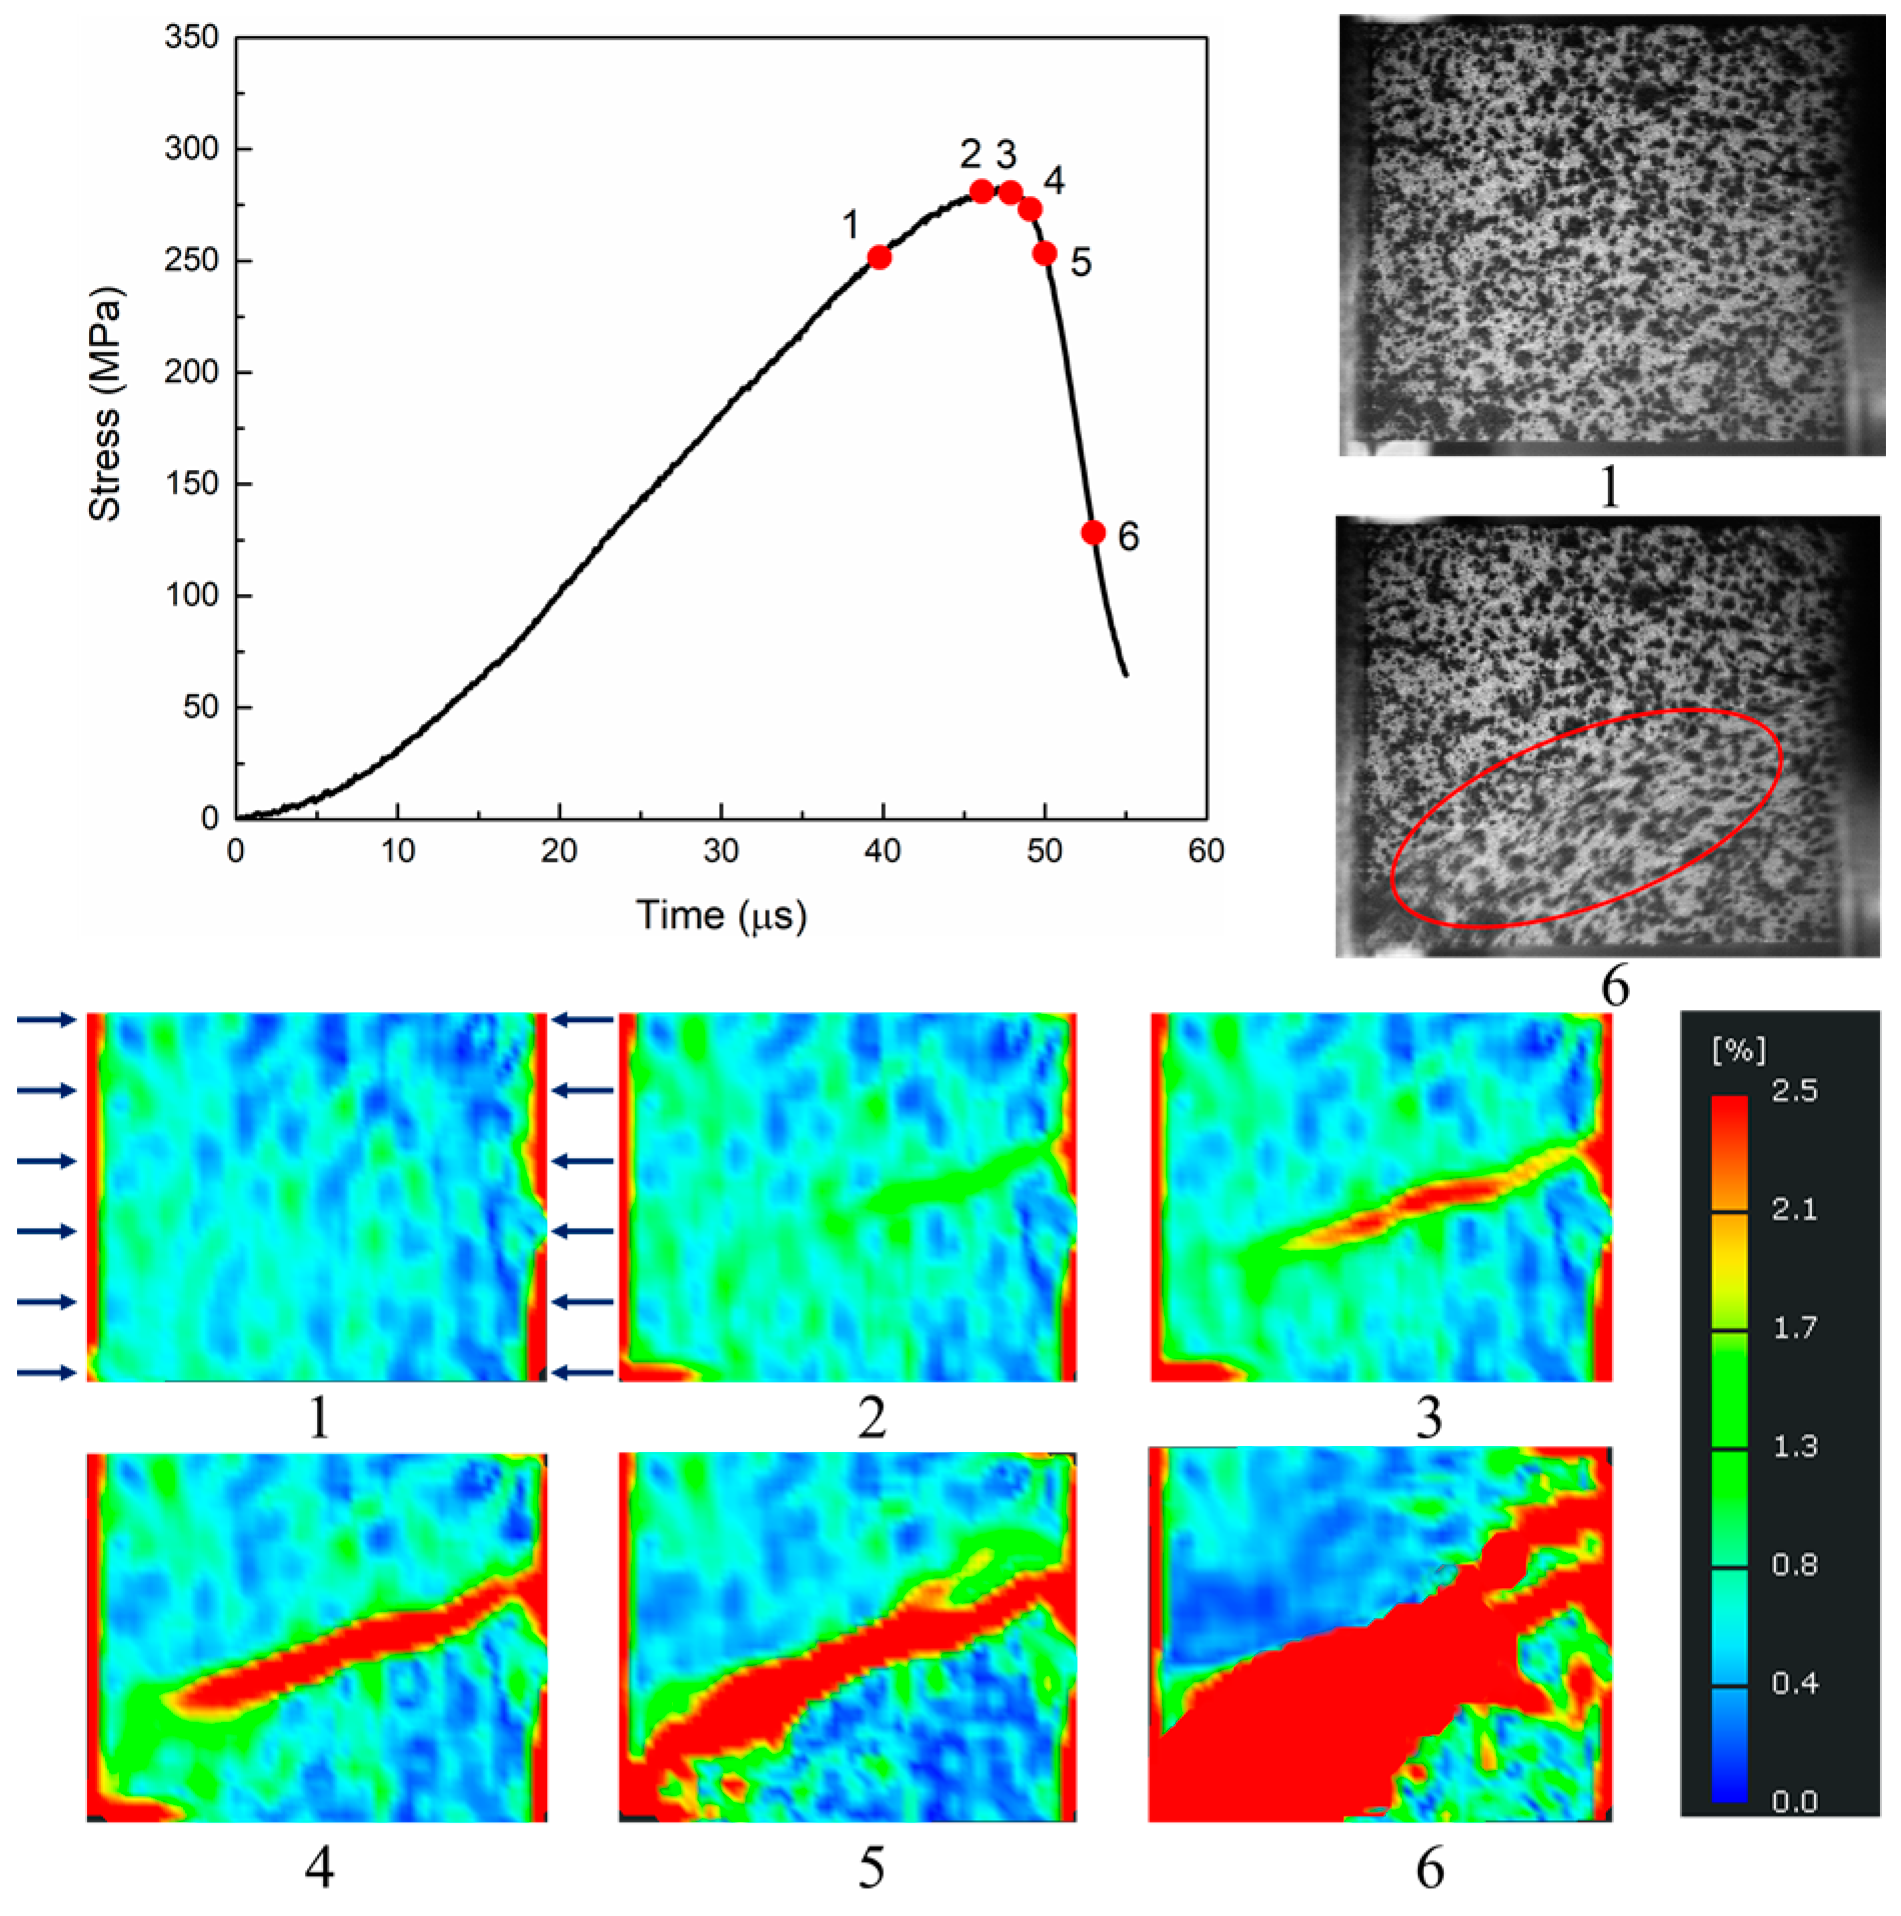
- The high-speed images showed that crack initiates in the center of the specimen and then propagates to the entire specimen under dynamic loading. The velocity of the crack propagation is about 1000 m/s. The zig-zag crack was found on the surface of the specimen. Main cracks occurred after the peak stress was achieved. DIC results verified the failure process.
- Dynamic strength of the material is much higher than the quasi-static strength which shows obviously positive strain rate effect of the porous SiC ceramic. Energy absorption during the deformation process is much larger under dynamic loading.
Author Contributions
Y.W. performed the experiments, analyzed the data and wrote the paper; D.Z. contributed analysis tools and helped to analyze the results; H.L. helped to organize the paper; S.M.Z. reviewed the paper and improved the language; Y.L. conceived and guided the experiment process.
Acknowledgments
This work is sponsored by National Science Foundation of China (No. 11527803). We thank Shen Zhen Bei Long Company for supplying the porous SiC ceramic plates. Shuangyin Zhang helped to characterize the specimens using SEM.
Conflicts of Interest
We declare no conflict of interest.
References
- Wang, F.; Yin, J.; Yao, D.; Xia, Y.; Zuo, K.; Xu, J.; Zeng, Y. Fabrication of porous SiC ceramics through a modified gelcasting and solid state sintering. Mater. Sci. Eng. A 2016, 654, 292–297. [Google Scholar] [CrossRef]
- Wang, F.; Yao, D.; Xia, Y.; Zuo, K.; Xu, J.; Zeng, Y. Porous SiC ceramics prepared via freeze-casting and solid state sintering. Ceram. Int. 2016, 42, 4526–4531. [Google Scholar] [CrossRef]
- Wu, H.; Li, Y.; Yan, Y.; Yin, J.; Liu, X.; Huang, Z.; Lee, S.-H.; Jiang, D. Processing, microstructures and mechanical properties of aqueous gelcasted and solid-state-sintered porous SiC ceramics. J. Eur. Ceram. Soc. 2014, 34, 3469–3478. [Google Scholar] [CrossRef]
- Chi, W.; Jiang, D.; Huang, Z.; Tan, S. Sintering behavior of porous SiC ceramics. Ceram. Int. 2004, 30, 869–874. [Google Scholar] [CrossRef]
- Alvin, M.A. Impact of char and ash fines on porous ceramic filter life. Fuel Process. Technol. 1998, 56, 143–168. [Google Scholar] [CrossRef]
- Li, J.; Lin, H.; Li, J. Factors that influence the flexural strength of SiC-based porous ceramics used for hot gas filter support. J. Eur. Ceram. Soc. 2011, 31, 825–831. [Google Scholar] [CrossRef]
- Deng, Z.-Y.; She, J.; Inagaki, Y.; Yang, J.-F.; Ohji, T.; Tanaka, Y. Reinforcement by crack-tip blunting in porous ceramics. J. Eur. Ceram. Soc. 2004, 24, 2055–2059. [Google Scholar] [CrossRef]
- Martin, S.R. Effects of Porosity Distribution on the Dynamic Behavior of Two Varieties of SiC; Defense Technical Information Center: Fort Belvoir, VA, USA, 2004. [Google Scholar]
- Hu, G.; Ramesh, K.T.; Cao, B.; McCauley, J.W. The compressive failure of aluminum nitride considered as a model advanced ceramic. J. Mech. Phys. Solids 2011, 59, 1076–1093. [Google Scholar] [CrossRef]
Publisher’s Note: MDPI stays neutral with regard to jurisdictional claims in published maps and institutional affiliations. |
© 2018 by the authors. Licensee MDPI, Basel, Switzerland. This article is an open access article distributed under the terms and conditions of the Creative Commons Attribution (CC BY) license (https://creativecommons.org/licenses/by/4.0/).


