Proceeding Paper

Acoustic Emission Health Monitoring of Historical Masonry to Evaluate Structural Integrity under Incremental Cyclic Loading †

by
Georgios Livitsanos
1,*,
Naveen Shetty
2,
Els Verstrynge
2,
Martine Wevers
3,
Danny Van Hemelrijck
1 and
Dimitrios G. Aggelis
1
1
Department Mechanics of Materials and Constructions, Vrije Universiteit Brussel, 1050 Brussels, Belgium
2
Civil Engineering Department, Building Materials and Building Technology division, KU Leuven, 3001 Leuven, Belgium
3
Department of Materials Engineering, KU Leuven, 3001 Leuven, Belgium
*
Author to whom correspondence should be addressed.
Presented at the 18th International Conference on Experimental Mechanics (ICEM18), Brussels, Belgium, 1–5 July 2018.
Proceedings 2018, 2(8), 508; https://doi.org/10.3390/ICEM18-05417
Published: 30 June 2018
(This article belongs to the Proceedings of The 18th International Conference on Experimental Mechanics)

Abstract

:
Historical masonry structures during the decades, were composed with a variety of brick and mortar types according to materials availability of each region and the desirable mechanical properties in each specific case. Different composition of mortars leads to another masonry behavior, and each one is suited for different structural purposes. A crucial aspect in damage evaluation of masonry structures is the analysis of long-term behavior which has a great influence on safety assessment of these structures. In this study, cement, hybrid lime cement, hydraulic lime and lime hydrate mortars were assembled with solid red clay bricks to compose four masonry walls of dimensions 515 × 376 × 90 mm. They were tested under cyclic compression loading. Acoustic Emission (AE) allowed in situ monitoring of damage progression. AE is a powerful non-destructive technique applied to identify micro and macro-defects and their temporal evolution in several materials. This technique permits to estimate a variety of characteristics during fracture propagation to obtain information on the criticality of the ongoing process. Specifically, analyzing and comparing AE parameters among the loading cycles of each wall specimen and among the different masonry compositions, an integrity assessment can be achieved. Furthermore, in each loading and unloading step, pulse velocity measurements were conducted using the AE apparatus in order to gain a velocity distribution mapping among the sensors. Each sensor was pulsed in turn, with all other sensors acting as receivers, generating a velocity matrix from one sensor to another. This provided an insight into the damage severity of masonry walls with the increasing number of loading cycles. This measurement was also necessary for refining AE source location accuracy by using either the horizontal or the vertical velocity. Two different cases were investigated. The use of one uniform velocity for the whole masonry wall and the assumption that the velocity differs in the two vertical directions due to the heterogeneity of the structure. These two cases result in differences in the quantity and the position of the localized events. Furthermore, applying direct ultrasonic pulse velocity measurements, in the direction of the width of masonry walls, another integrity investigation was feasible. The presented results further demonstrate the relationships between AE parameter-based analysis, velocity distribution and source location during cyclic compressive loading in masonry specimens. The identification of the nature of damage through the entire dataset of all sensor arrays provides a promising example for structural health monitoring applications on larger scale masonry specimens. As a conclusion, AE activity analysis proved to be a very efficient approach to evaluate fracture progress in masonry.

1. Introduction

A large number of historical structures are built up in masonry. Brick masonry is a heterogeneous and anisotropic material formed by bricks and mortar. Its behavior up to failure is nonlinear and primarily depends both on its components (brick, mortar and brick-mortar interface). Characterization of the structural condition is necessary for repair and conservation aiming to a long and safe service life [1,2]. Many researchers have attempted to evaluate the damage integrity of structures applying AE parameters. Damage is caused by an accumulation of many cracks which follows a three dimensional growth process [3]. Experimental studies using AE have shown that the accuracy of AE source localization is diminished as cracks occur [4]. With accurate localization the source should be detected constantly at the same point. In practice, some structures with damage tolerance design may contain multiple damages simultaneously, so there may be more than one AE sources at the same time. Multiple AE sources may cause the arrival times of AE waves to be confused. For this reason, it is important to improve the localization accuracy before analyzing the localized events. In many studies, different techniques for localizing acoustic emission sources are described including the advantages and disadvantages [5]. Different approaches are followed also for isotropic and anisotropic structures. Matt and Lanza di Scalea [6] investigated the strain rosette acoustic source localization technique for isotropic plates with unknown wave velocity. Also source localization by modal acoustic emission is applicable in isotropic structures [7]. McLaskey et al. [8] proposed the beamforming technique for isotropic plates. Nakatani et al. [9] extended this technique to anisotropic structures. The conventional triangulation technique is the most well-known applied in isotropic materials [10]. However, the main parameter influencing the location of damage by triangulation is the heterogeneity. In most heterogeneous structures, the relationship group-velocity/propagation-angle can be identified as elliptical which means that the velocity versus the propagation angle follows an elliptical shape. As a result, Kundu et al. [11] proposed an optimization of the triangulation technique which can work efficiently when the wave velocity is also direction dependent. Many localization accuracy applications have been investigated in concrete [12,13], metal [14] and composites [15] as well as in rocks [16] and in masonry [17]. In this study, four masonry walls composed by four different mortars and one type of brick will be thoroughly analyzed under cyclic compression loading. Evaluation of the behavior is conducted by use of NDT techniques. The use of Acoustic Emission (AE) technique is addressed. The localization of the cracks as well as the source identification of the micro cracks and the AE parameter-based analysis gives a clear aspect of the crack initiation and propagation.

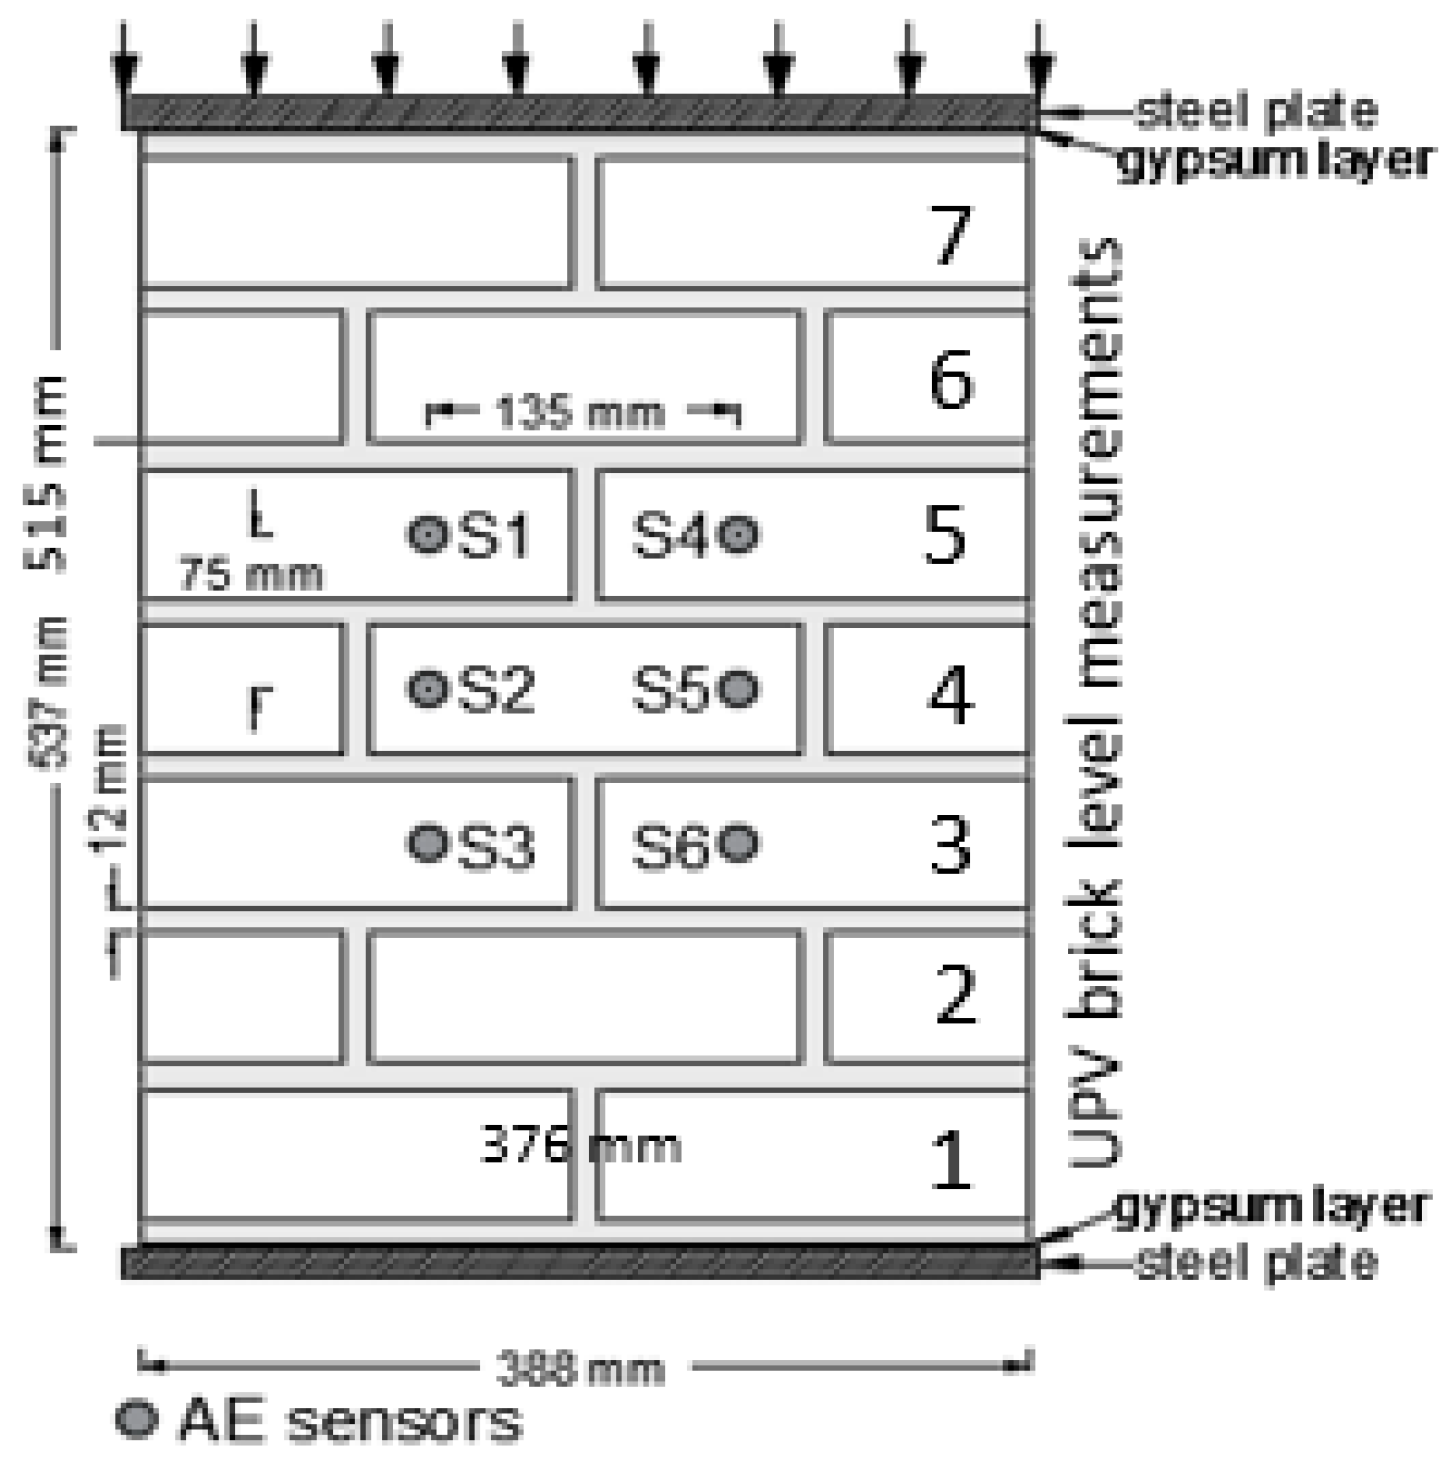
1.1. Materials and Set-Up

Four masonry walls composed with one type of brick and four types of mortars were constructed. The properties of the mortars depend on the different compositions. Specifically, the Cement based mortar (CM), the Lime-Cement (LC) the Hydraulic Lime (HL) and the Lime Hydrate mortar (LH) (Table 1). The brick is a typical solid Red Clay Brick (RCB) with a density 1653 kg/m3 and dimensions 188 × 88 × 63 mm³, which is representative for historical masonry because of the mechanical properties, the color and the surface roughness. The walls were prepared at the Reyntjens laboratory at KU Leuven with dimensions 515 × 376 × 88.5 mm3. The thickness of the mortar joints was 12 mm. Figure 1 shows the details and dimensions of the masonry wall. In this paper, one representative wall for each type of mortar is discussed for investigating the structural integrity under incremental cycling loading at the age of 28 days.
Before applying the mortar layers, the bricks were submerged in water for two minutes to avoid excessive absorption of the mortar’s water into the pores of the bricks. The walls were subjected to cyclic compression tests using a 2500 kN universal testing machine ‘Instron’ at 0.25 kN/s loading rate under force control. A thin layer of gypsum and a plastic sheet was placed on the top and bottom of the wall, and slightly pressed under the platens of the mechanical press to make it a flat surface for an equal distribution of the load.

1.2. Ultrasound—AE Testing

At the start and at the end of each loading-unloading step, direct Ultrasonic Pulse Velocity measurements (UPV) were conducted in order to have a velocity mapping at the height of each bricklayer in the horizontal direction. A portable Ultrasonic Pulse Analyzer apparatus by Controls Group, with 2 MHz sampling rate, 2500 V and 50 kHz transmitter pulse was applied. During each cycling loading, AE monitoring of the total AE activity was conducted and planar localization of the AE events was feasible. For the AE monitoring, six piezoelectric sensors (R15α, Mistras with 40 dB preamplifier) were attached on the same side of the wall. The horizontal distance between the sensors was 135 mm and the vertical distance between the sensors was 75 mm approximately, see Figure 1. Initially, for all masonry walls, the AE sensors were placed far apart and pulse calibration was performed. AE hit arrival time and amplitude were checked to witness the AE detection at multiple sensors. If the AE detection was not frequently accurate, due to signal distortion, the distance between the sensors S1 to S6 was decreased. In this manner, a suitable layout of AE sensors was selected, as shown in Figure 1. An average value of the measured AE wave velocity for each masonry wall specimen is given in Table 2. The resonant frequency of the sensors is 150 kHz. The computer is equipped by PCI/DSP-4 Data Acquisition Boards with up to 8 channel inputs with sampling rate up to 10 MHz. The threshold was 35 dB. During the tests, AE hits were recorded upon exceedance of the threshold and subsequently assembled into AE events. Acoustic coupling was improved by Vaseline (petroleum jelly) between the sensors face and the specimens’ surface. In this study, the complex damage phenomena developed in the masonry walls are analyzed by applying different AE analysis tools, such as AE source detection to localize defects on masonry.

2. Results

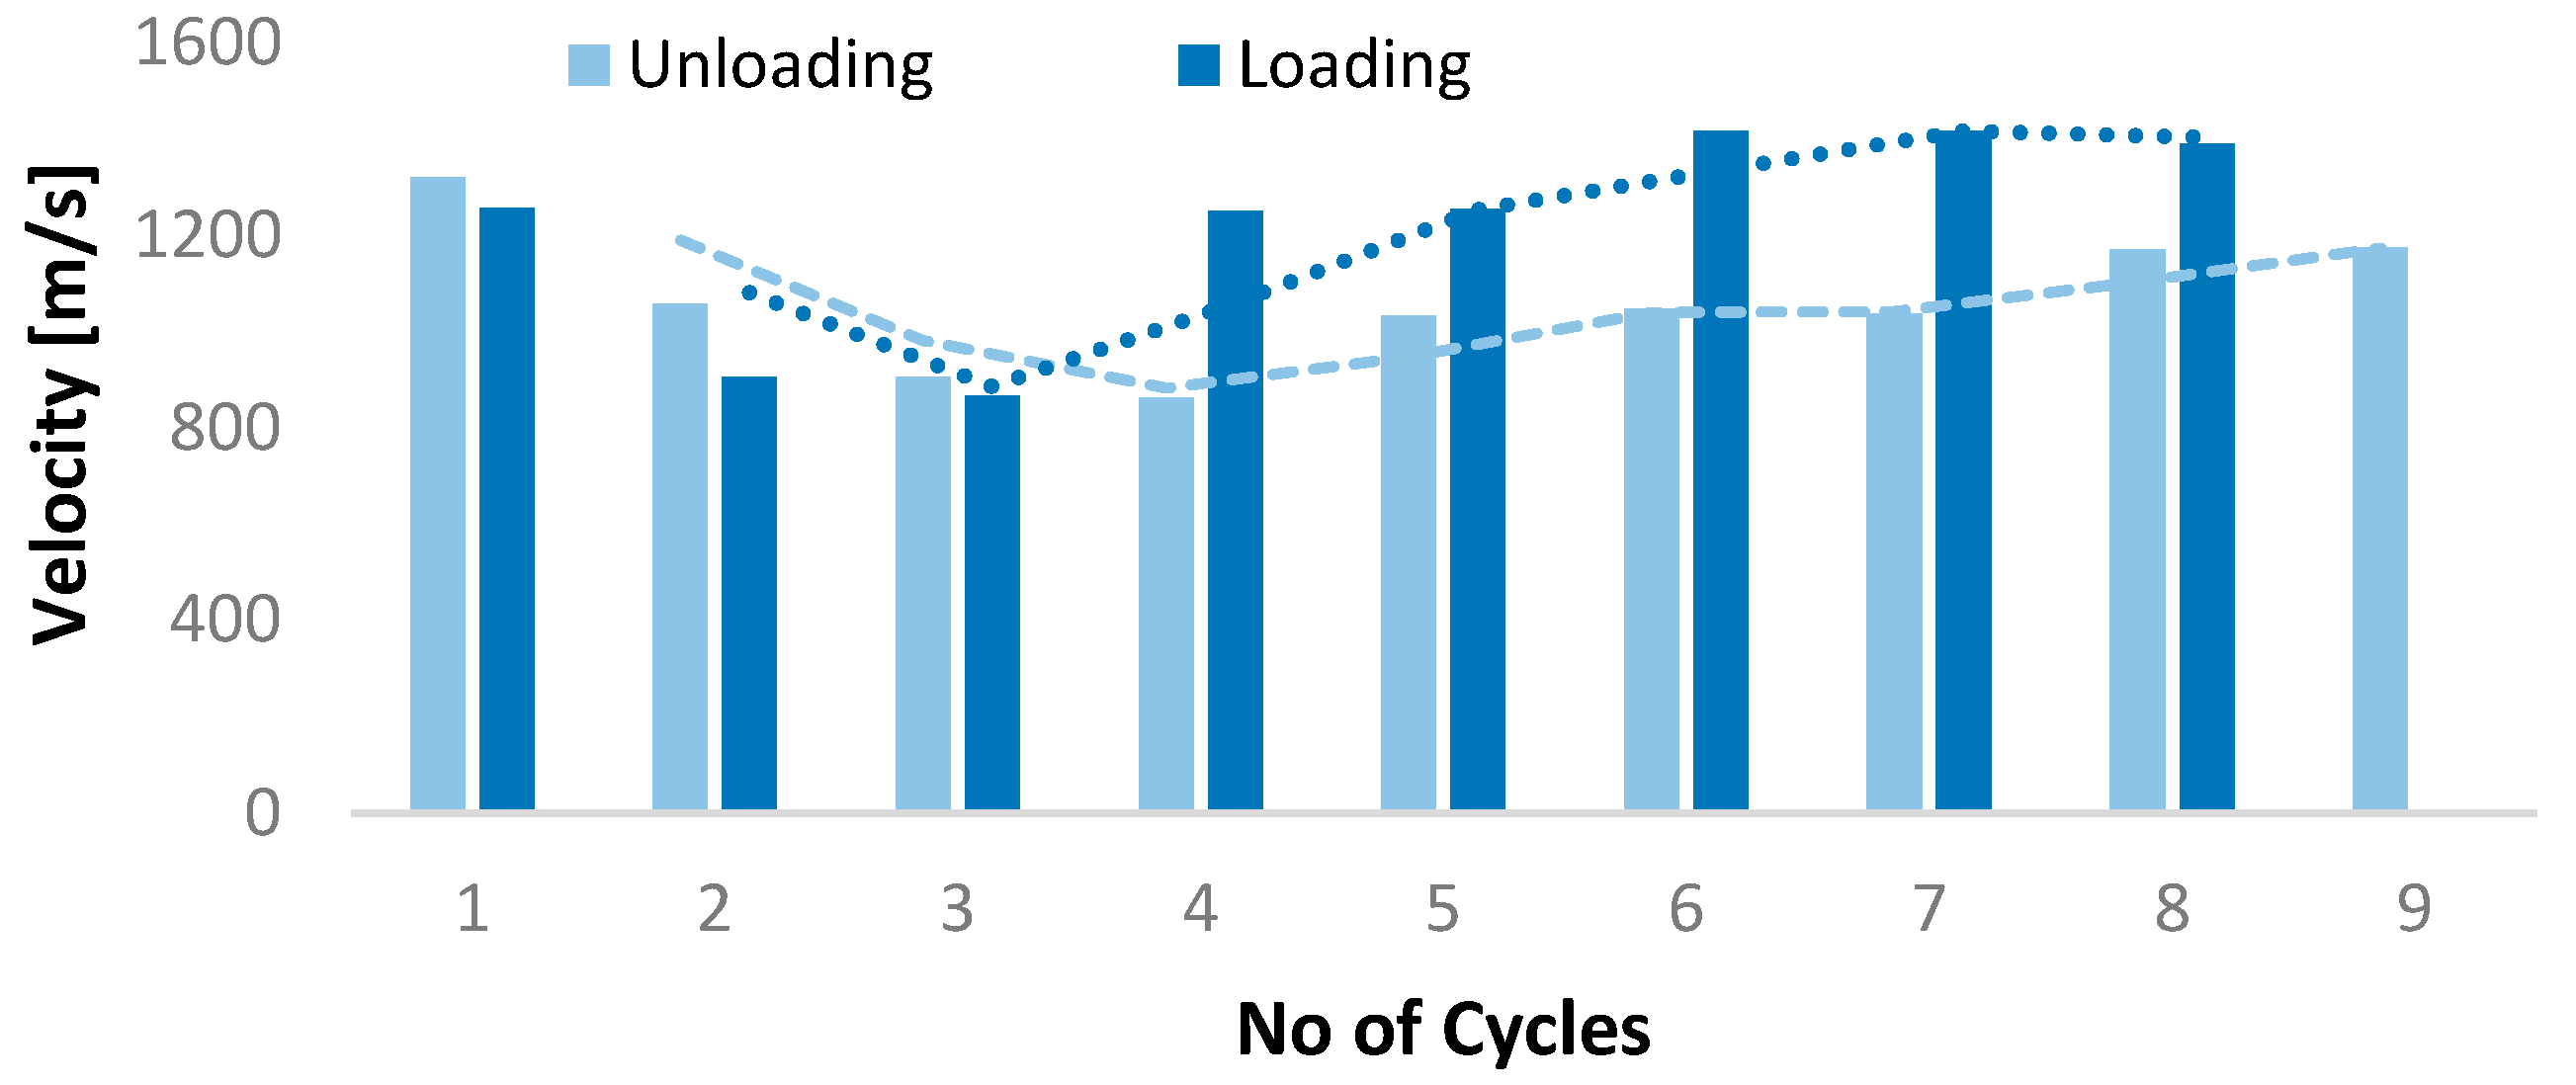
2.1. Ultrasonic Pulse Velocity Testing

The masonry walls were subjected to cyclic uniaxial loading and unloading, where the cycle’s peak stress increases from cycle to cycle. The summary of the results showing the compressive strength and failure strain are given in Table 2.
A time delay of approximately 90 s was introduced in each cycle at the higher and lower load level. During these time delays, the UPV measurements were conducted on 7 different positions on each brick level.
Figure 2 presents the UPV measurements of each loading cycle that were conducted in a specific height of the masonry wall where high fracture intensity was observed. From the second cycle, a gradual decrease on the velocity on the unloading and loading stages is observed. However, after a first damage level in the 3rd cycle, an increase in the UPV is observed in the loading stage. In general, the experimental studies in rocks show that wave velocities increase with increasing confining pressure and decrease with increasing deviatoric stresses. Both observations have been related to the pressure-induced closure and stress-induced opening of narrow cracks and as a result in the volumetric change [19,20].

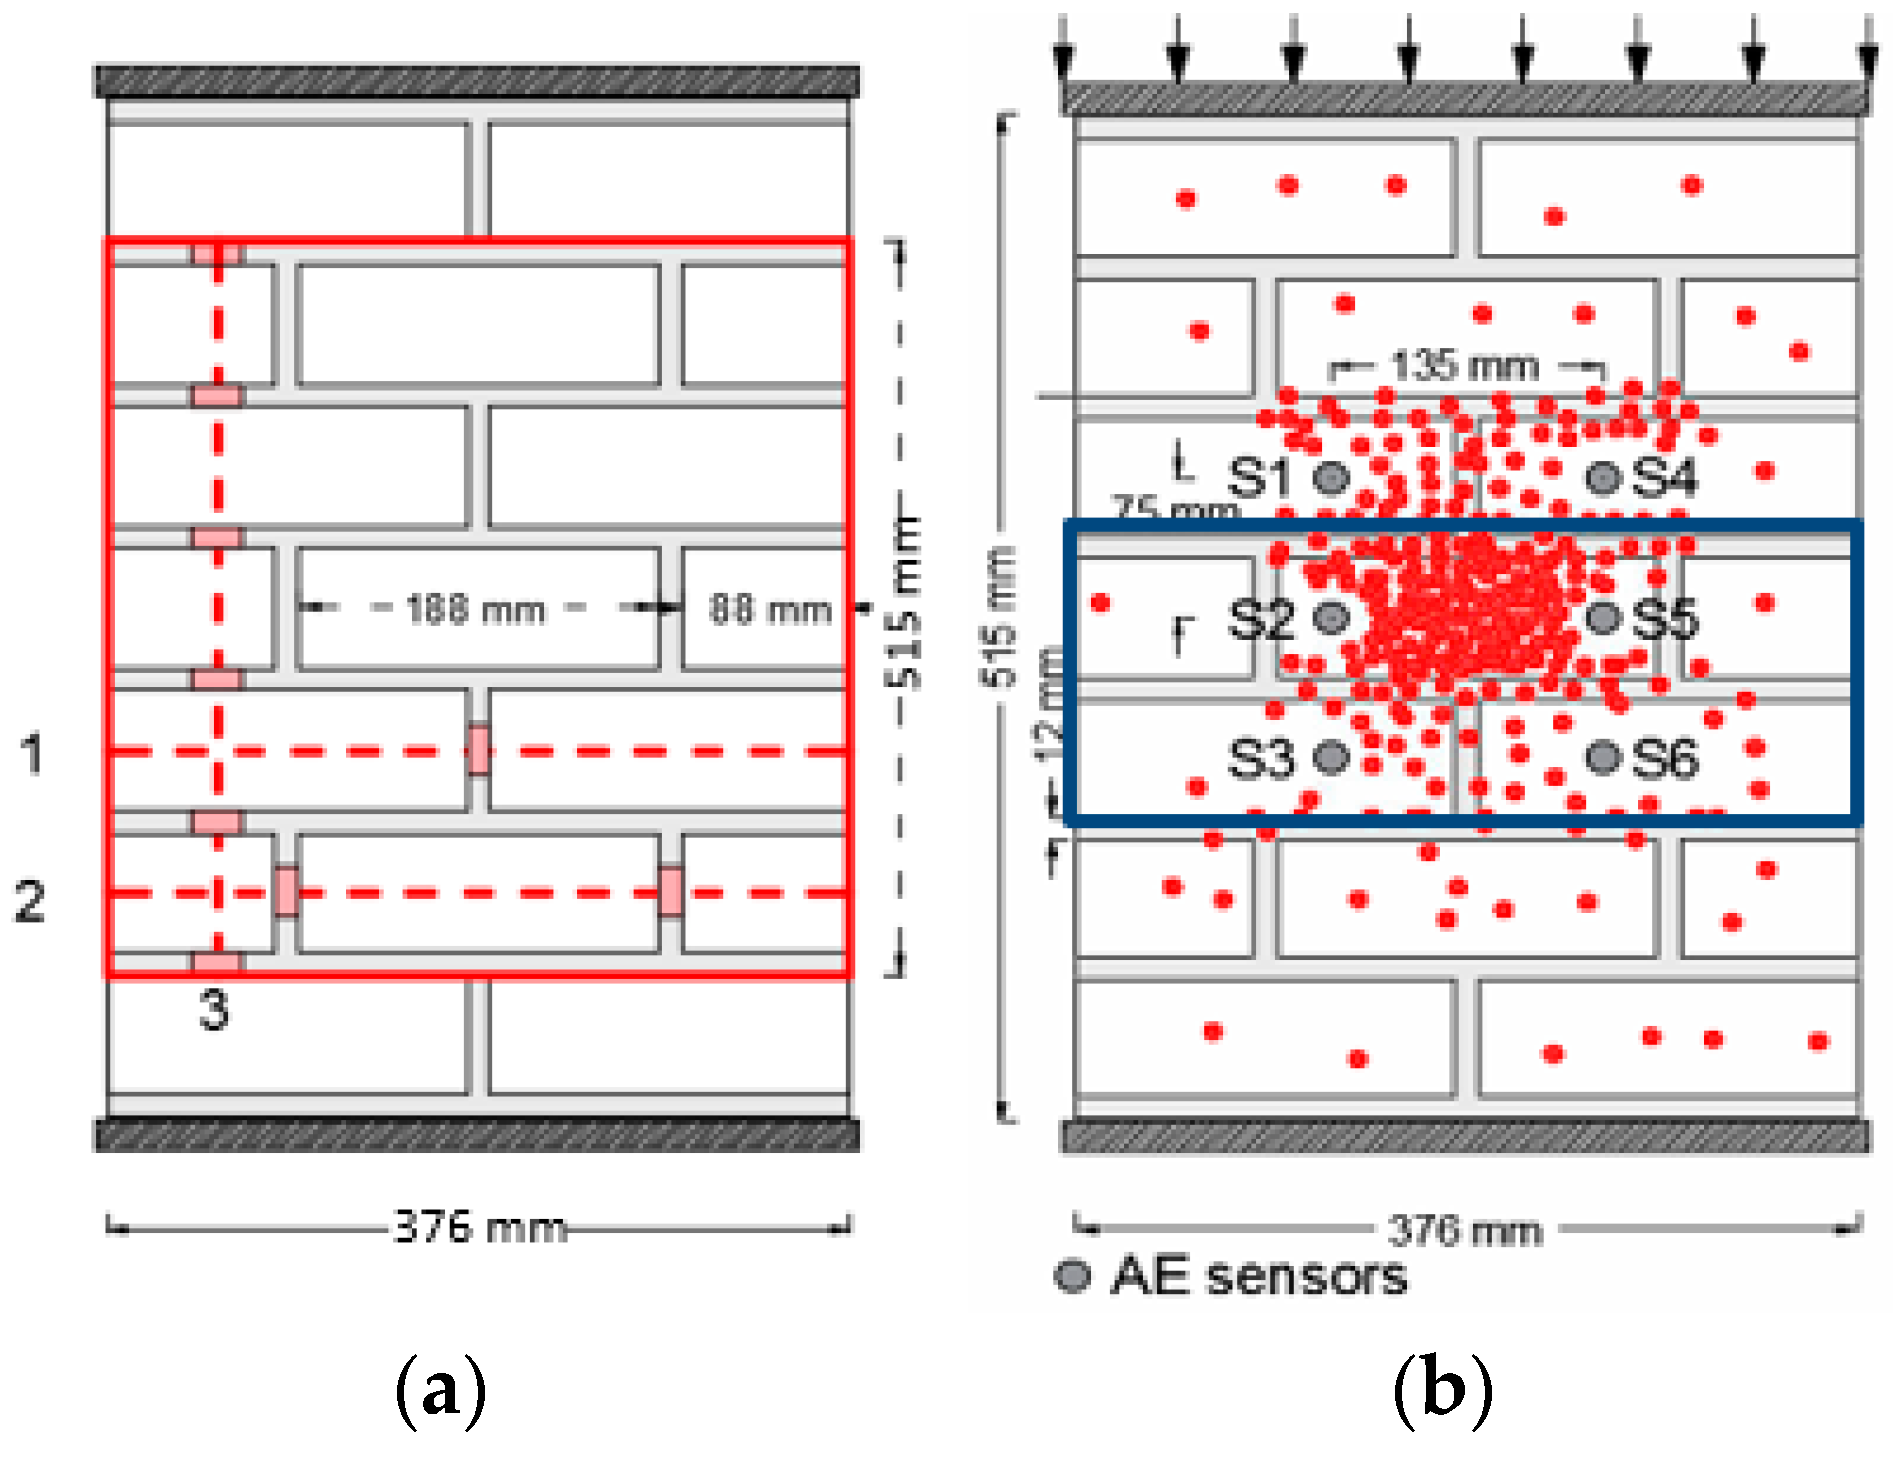
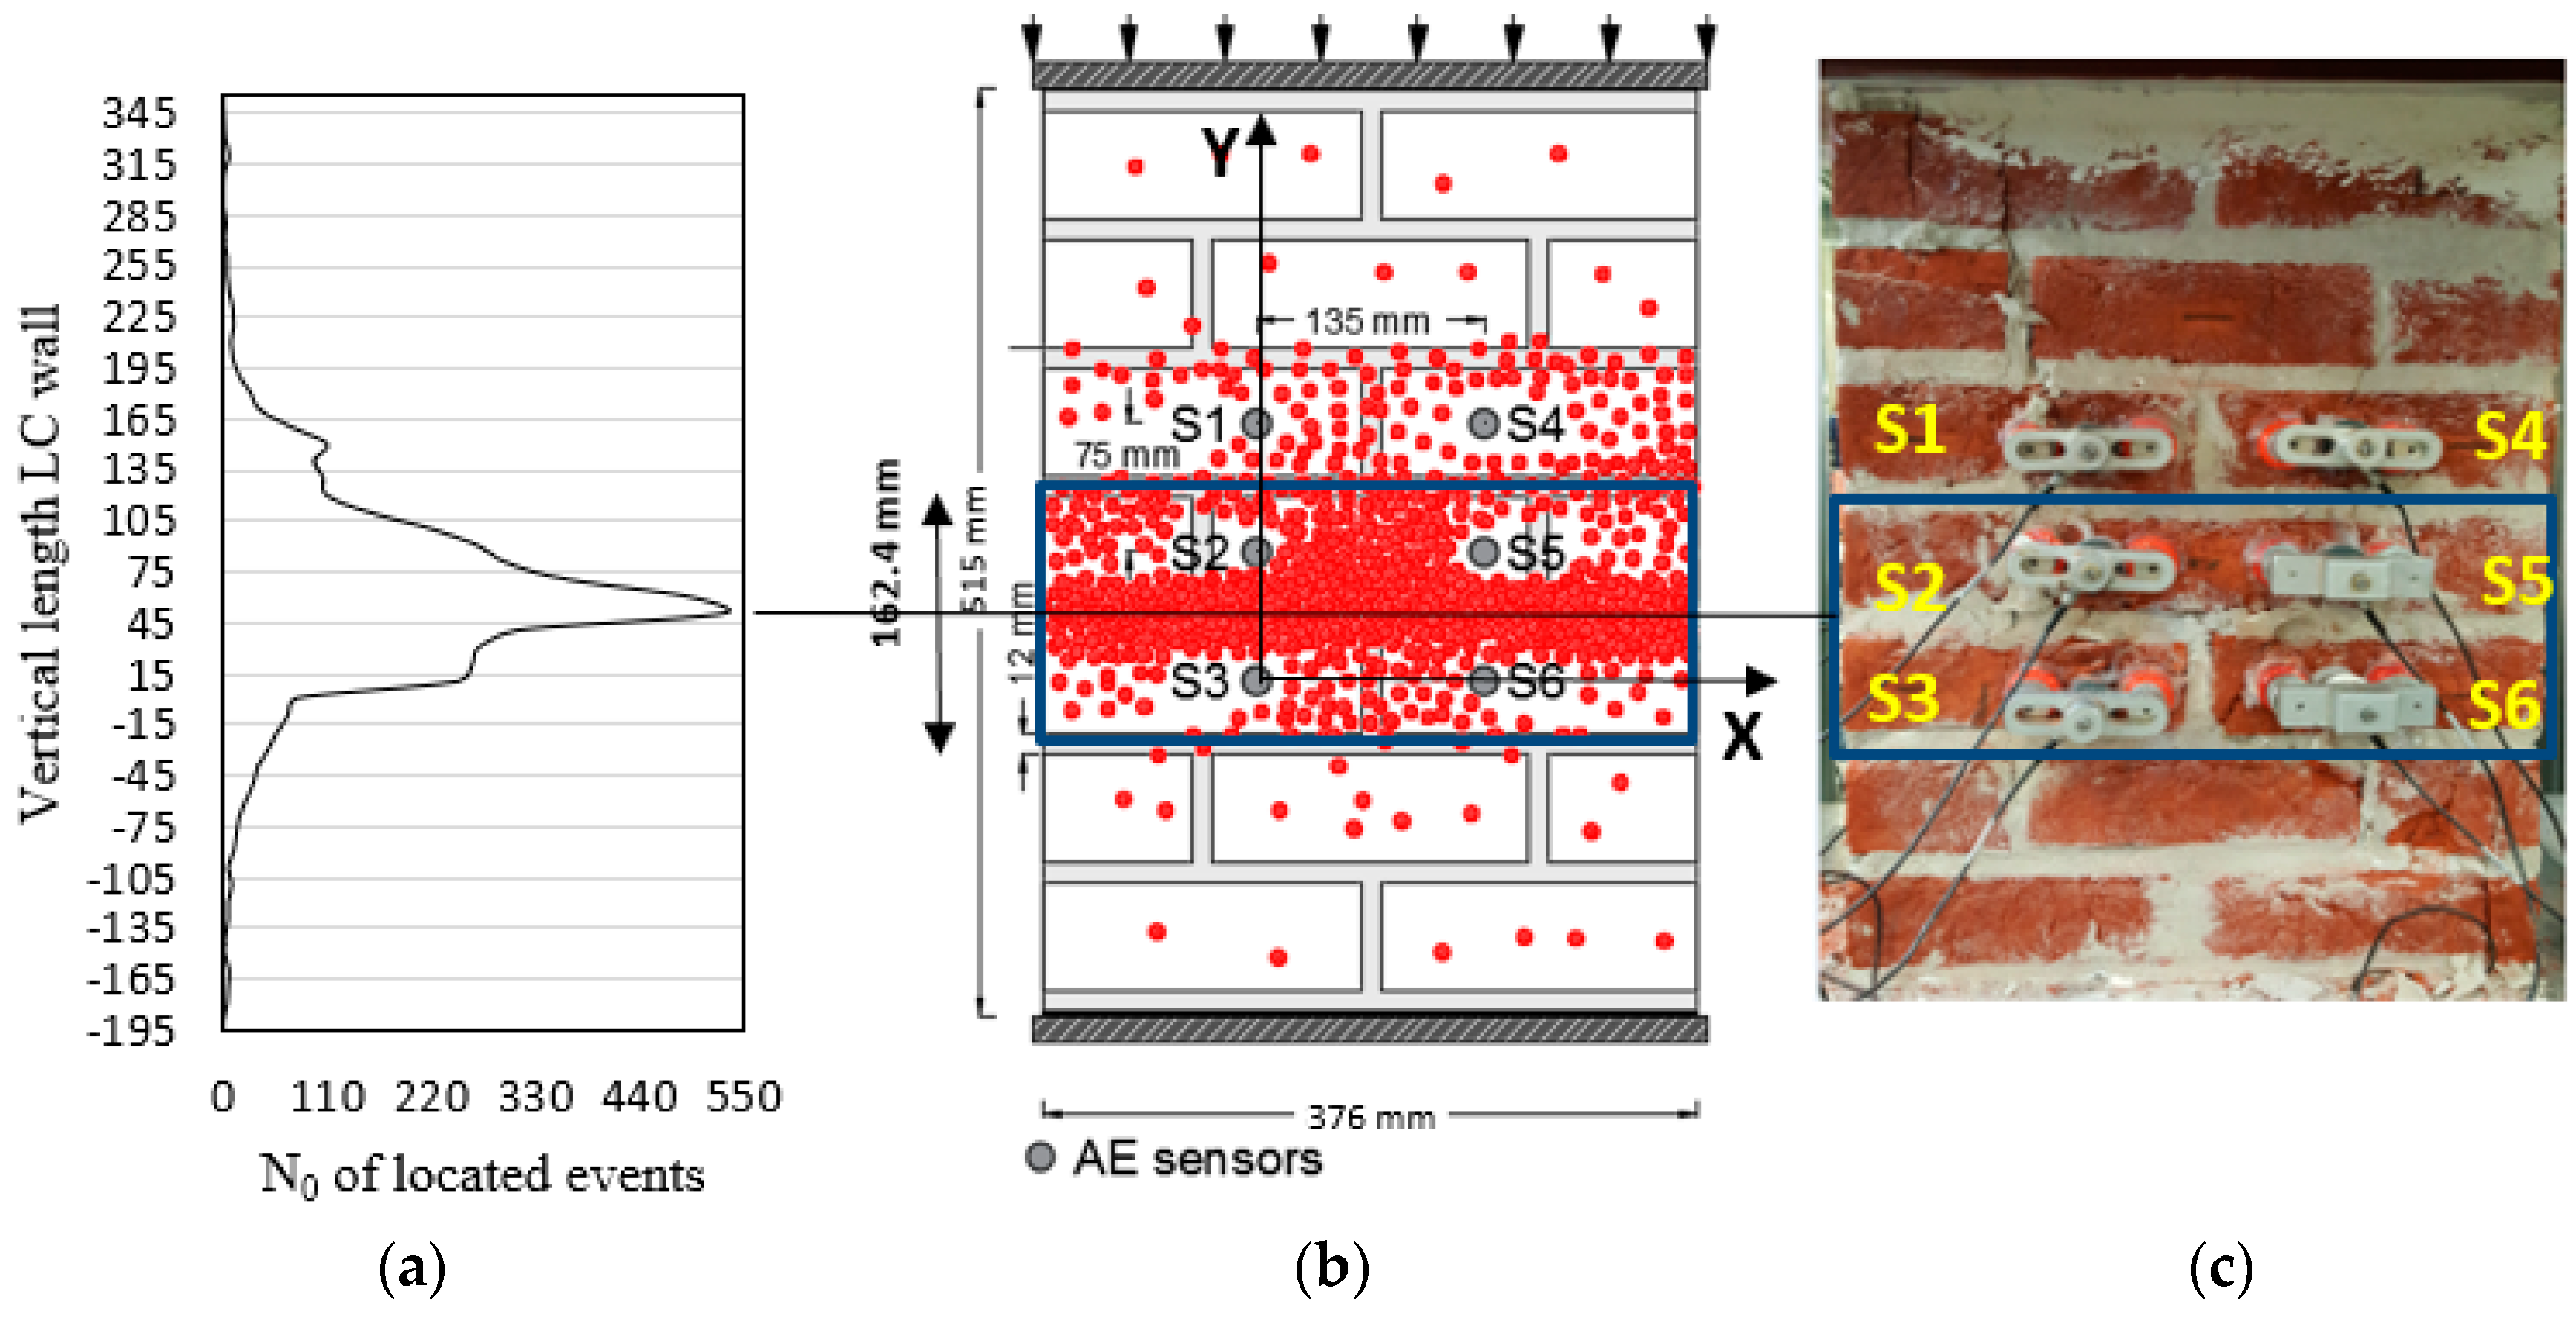
2.2. Mechanical Response—Damage Localization

The triangulation technique [10] is the most popular AE source localization technique for isotropic and homogeneous structures. Three sensors placed not in aligned positions receive the acoustic waves generated by the formation of a crack at a specific point. The wave generated by the acoustic source propagates through the structure and strikes the sensors at different times. Kundu et al. [11] extended this technique to anisotropic structures. In the case of anisotropic materials, the circles tend to deform to oval shapes and the radius decreases in the direction with the lower velocity value and it increases with the velocity increase. However, this technique requires a priori knowledge of the direction dependent velocity profile and as a result the materials properties.
The masonry wall was made in a running bond. By isolating a specific square area in a masonry wall specimen, it is observed that due to the layout of the wall, there is a different number of brick-mortar interfaces and different proportion of each material in both horizontal and vertical directions. In Table 3, in the horizontal direction along the 1st path there is 97% of brick material and 94% for the 2nd path, in contrast to the 3rd path where the percentage is only 81%. Similar trend is also followed by the UPV measurements where the 1st path presents the maximum wave velocity. A more clarified representation of the different paths is shown if Figure 3a. According to this, it was necessary to improve the localization process in order to be able to identify the observed cracks with the localized events. As an example, two different localization efforts were applied. In the first case, the specimen/media was assumed homogenous with a uniform velocity equal to the horizontal one (V = VX). In the second case, the media was assumed orthotropic and a planar anisotropic location with the six piezoelectric sensors was applied taking as an initial approximate estimation the two different, vertical and horizontal, velocities. By visual inspection we can observe the location of the main fracture process in the masonry wall, which is detected in a rectangular area (blue color), with dimensions of 162.4 × 376 mm, as indicated in Figure 4b. Only the events localized in this specific area were extracted for both localization algorithms. Figure 3b represents the located events in the isotropic case and Figure 4b the orthotropic case. In Table 4, the number of events extracted from the same area of interest in both localization cases differs with the first case providing 22.4% less events than the orthotropic algorithm.
In the Figure 4a, the extracted events are plotted in a frequency distribution graph where the vertical axis corresponds to the height of the masonry wall. The initiation point of the coordinate system is the center of the position of the sensor S3 as indicated in Figure 4b. The maximum peak of the graph represents accurately the density of the events in the actual fractured area and corresponds to the location of the crushed mortar joint.

3. Conclusions

This initial study discusses the complex response to damage of historical masonry structures. It indicates the importance of the use of non-destructive techniques on structural materials and specifically on masonry. A primary information was achieved by the UPV measurements. This provided an insight into the damage severity of masonry walls with the increasing number of loading cycles.
The UPV measurements provided also an input for a refined AE source location accuracy. Masonry is known for the damage accumulation before the main sudden fracture. This behavior was observed showing that after the first low level of crack evolution, the velocity was increasing during loading cycles due to the cracking process. AE source is accurately localized after taking into account the heterogeneous material properties and the difference in the wave transmission paths in the horizontal and in the vertical direction.
Finally, it must be stated that the study considers also a further analysis with the cumulative AE distribution in order to quantify the damage intensity according to the testing Japanese nondestructive inspection standard (NDIS-2421) for AE monitoring applications [21]. This study is also ongoing to examine the effect of wave propagation through the different interfaces. It is highly possible that the AE signals undergo strong changes in their propagation path from the source to the receiver and therefore numerical simulations are in order to examine the change of the waveform shape after propagation in masonry components. Furthermore, DIC could provide more information for setting a more accurate deterministic way in the AE parameter-based analysis.

Acknowledgments

The Research Fund—Flanders (FWO) is acknowledged for funding the FWO project “AE-FracMasS: advanced Acoustic Emission analysis for Fracture mode identification in Masonry Structures” (G.0C38.15).

References

  1. Van Balen, K.; Papayianni, I.; van Hees, R.; Binda, L.; Waldum, A. RILEM TC 167-COM: Characterisation of old mortars with respect to their repair Introduction to requirements for and functions and properties of repair mortars. Mater. Struct. 2005, 38, 781–785. [Google Scholar] [CrossRef]
  2. Verstrynge, E.; de Wilder, K.; Drougkas, A.; Voet, E.; van Balen, K.; Wevers, M. Crack monitoring in historical masonry with distributed strain and acoustic emission sensing techniques. Constr. Build. Mater. 2018, 162, 898–907. [Google Scholar] [CrossRef]
  3. Griffith, A.A.; Eng, M.VI. The phenomena of rupture and flow in solids. Phil. Trans. R. Soc. Lond. A 1921, 221, 163–198. [Google Scholar]
  4. Maji, A.; Shah, S.P. Process zone and acoustic-emission measurements in concrete. Exp. Mech. 1988, 28, 27–33. [Google Scholar] [CrossRef]
  5. Kundu, T. Acoustic source localization. Ultrasonics 2014, 54, 25–38. [Google Scholar] [CrossRef] [PubMed]
  6. Matt, H.M.; di Scalea, F.L. Macro-fiber composite piezoelectric rosettes for acoustic source location in complex structures. Smart Mater. Struct. 2007, 16, 1489. [Google Scholar] [CrossRef]
  7. Jiao, J.; He, C.; Wu, B.; Fei, R.; Wang, X. Application of wavelet transform on modal acoustic emission source location in thin plates with one sensor. Int. J. Press. Vessel. Pip. 2004, 81, 427–431. [Google Scholar] [CrossRef]
  8. McLaskey, G.C.; Glaser, S.D.; Grosse, C.U. Beamforming array techniques for acoustic emission monitoring of large concrete structures. J. Sound Vib. 2010, 329, 2384–2394. [Google Scholar] [CrossRef]
  9. Nakatani, H.; Hajzargarbashi, T.; Ito, K.; Kundu, T.; Takeda, N. Locating Point of Impact on an Anisotropic Cylindrical Surface Using Acoustic Beamforming Technique. In Key Engineering Materials; Trans Tech Publications, 2013; Volume 558, pp. 331–340. [Google Scholar]
  10. Tobias, A. Acoustic-emission source location in two dimensions by an array of three sensors. Non-Destr. Test. 1976, 9, 9–12. [Google Scholar] [CrossRef]
  11. Kundu, T.; Das, S.; Martin, S.A.; Jata, K.V. Locating point of impact in anisotropic fiber reinforced composite plates. Ultrasonics 2008, 48, 193–201. [Google Scholar] [CrossRef] [PubMed]
  12. Tsangouri, E.; Karaiskos, G.; Deraemaeker, A.; van Hemelrijck, D.; Aggelis, D. Assessment of Acoustic Emission localization accuracy on damaged and healed concrete. Constr. Build. Mater. 2016, 129, 163–171. [Google Scholar] [CrossRef]
  13. Ongpeng, J.M.C.; Oreta, A.W.C.; Hirose, S. Monitoring Damage Using Acoustic Emission Source Location and Computational Geometry in Reinforced Concrete Beams. Appl. Sci. 2018, 8, 189. [Google Scholar] [CrossRef]
  14. Ebrahimkhanlou, A.; Salamone, S. Acoustic emission source localization in thin metallic plates: A single-sensor approach based on multimodal edge reflections. Ultrasonics 2017, 78, 134–145. [Google Scholar] [CrossRef]
  15. Pearson, M.R.; Eaton, M.; Featherston, C.; Pullin, R.; Holford, K. Improved acoustic emission source location during fatigue and impact events in metallic and composite structures. Struct. Health Monit. 2017, 16, 382–399. [Google Scholar] [CrossRef]
  16. Dong, L.; Zou, W.; Li, X.; Shu, W.; Wang, Z. Collaborative localization method using analytical and iterative solutions for microseismic/acoustic emission sources in the rockmass structure for underground mining. Eng. Fract. Mech. 2018. [Google Scholar] [CrossRef]
  17. Bosia, F.; Pugno, N.; Lacidogna, G.; Carpinteri, A. Mesoscopic modeling of Acoustic Emission through an energetic approach. Int. J. Solids Struct. 2008, 45, 5856–5866. [Google Scholar] [CrossRef]
  18. Hendrickx, R. The Adequate Measurement of the Workability of Masonry Mortar. Ph.D. Thesis, KU Leuven, Leuven, Belgium, 2009. [Google Scholar]
  19. Guéguen, Y.; Palciauskas, V. Introduction to the Physics of Rocks; Princeton University Press: Princeton, NJ, USA, 1994. [Google Scholar]
  20. Stanchits, S.; Vinciguerra, S.; Dresen, G. Ultrasonic velocities, acoustic emission characteristics and crack damage of basalt and granite. Pure Appl. Geophys. 2006, 163, 975–994. [Google Scholar] [CrossRef]
  21. Ohtsu, M.; Yuyama, S. Recommended Practice for In Situ Monitoring of Concrete Structures by Acoustic Emission. In Proceedings of the 15th International Acoustic Emission Symposium, Tokyo, Japan, 11–14 September 2000; pp. 263–268. [Google Scholar]
Figure 1. Experimental set-up for testing of walls, AE sensor setup for planar localization of events.
Proceedings 02 00508 g001
Figure 2. UPV measurements for each cycle on 6th brick level.
Proceedings 02 00508 g002
Figure 3. (a) Wave velocity paths, (b) planar isotropic location.
Proceedings 02 00508 g003
Figure 4. LC wall—planar anisotropic location. (a) Event frequency distribution graph, (b) planar anisotropic location—events extracted from specific window, (c) Final fracture stage of masonry wall LC specimen- fractured area indicated (blue rectangular area).
Proceedings 02 00508 g004
Table 1. Composition of Mortars [18].
CompositionCement (CM)Lime—Cement (LC)Hydraulic Lime (HL)Lime Hydrate (HL)
River Sand (g)270027002700 2700
Binder (g)666.9
CEM I 42.5 R, Portland cement
572.5572.4
NHL5
(EN 459-1:2001)
342.9
CL90S
(EN 459-1:2001)
66.7% CL90S (EN 459-1:2001)
33.3% CEM I 42.5 R
Water at 20 °C (g)604.9583.3630.8620.6
Volume density (kg/m3)1960175817461662
Table 2. AE wave velocity corresponding to an average value of all brick levels – maximum compressive strength/strain.
Masonry WallsAE Wave Velocity [m/s]fm [MPa]Max Strain
Cement Mortar wall (CM)1000-12006.120.0083
Lime-Cement wall (LC)950-11503.860.0072
Hydraulic Lime wall (HL)850-10004.850.0092
Lime Hydrate wall (LH)700-8001.950.0062
Table 3. Wave velocity paths with different UPV and proportion of materials.
Masonry WallsVelocity [m/s]Length of BricksLength of Mortar Joints% of Brick Material
Path 1
Vx 1
1446376 mm12 mm97%
Path 2
Vx 2
1273364 mm24 mm94%
Path 3
Vy
760316 mm72 mm81%
Table 4. Isotropic—orthotropic planar locations.
LCHomogeneous Planar 2D LocationOrthotropic Planar 2D Location
Horizontal Vx1446V = 1446 m/s (Vx = Vy)2285 eventsVx = 1446 m/s, Vy = 760 m/s2952 events
Vertical Vy760
Publisher’s Note: MDPI stays neutral with regard to jurisdictional claims in published maps and institutional affiliations.

