Proceeding Paper

Effect of Open Soil Surface Patterns on Soil Detectability Based on Optical Remote Sensing Data †

1
V. V. Dokuchaev Soil Science Institute, Moscow 119017, Russia
2
Agrarian-Technological Institute, RUDN University, Moscow 117198, Russia
*
Author to whom correspondence should be addressed.
Presented at the 2nd International Electronic Conference on Remote Sensing, 22 March–5 April 2018; Available online: https://sciforum.net/conference/ecrs-2.
Proceedings 2018, 2(7), 357; https://doi.org/10.3390/ecrs-2-05170
Published: 22 March 2018
(This article belongs to the Proceedings of The 2nd International Electronic Conference on Remote Sensing)

Abstract

:
Arable soils are subjected to the altering influence of agricultural and natural processes determining surface feedback patterns therefore affecting their ability to reflect light. However, remote soil mapping and monitoring usually ignore information on surface state at the time of data acquisition. Conducted research demonstrates the contribution of surface feedback dynamics to soil reflectance and its relationship with soil properties. Analysis of variance showed that the destruction surface patterns accounts for 71% of spectral variation. The effect of surface smoothing on the relationships between soil reflectance and its properties varies. In the case of organic matter and medium and coarse sand particles, correlation decreases with the removement of surface structure. For particles of fine sand and coarse silt, grinding changes spectral areas of high correlation. Partial least squares regression models also demonstrated variations in complexity, R2cv and RMSEPcv. Field dynamics of surface feedback patterns of arable soils causes 22–46% of soil spectral variations depending on the growing season and soil type. The directions and areas of spectral changes seem to be soil-specific. Therefore, surface feedback patterns should be considered when modelling soil properties on the basis of optical remote sensing data to ensure reliable and reproducible results.

1. Introduction

Soil spectral reflectance in optical domain has been under study for quite a long time. It was found to be affected by many factors such as moisture content, surface condition, granulometric composition, total iron content, organic matter content, content of readily-soluble salts, carbonate content and mineralogical composition [1,2,3,4,5,6,7,8]. The relationships between soil spectral reflectance and its properties allow to estimate soil characteristics from remotely-sensed data.
To facilitate the development of soil mapping algorithms, spectral libraries of soils and rocks have been created [9,10,11,12,13,14]. However, the problem arises when linking spectral data measured in laboratory and in the field as surface state interferes affecting the accuracy of the acquired relationships [15,16,17,18,19].
In the experiment with rainfall simulation and wind tunnel abrasion it was proven that changes in open soil surface state significantly influence the variation in the reflectance of all wavebands [20].
To describe the way land surface transforms when drying after rainfall (which can be captured by remote sensors as changes in spectral reflectance), [21] introduced the term land surface feedback dynamic patterns. When studying open soil surface at a local level (where rainfall is uniform), feedback dynamic pattern is mainly dependent on soil conditions. The incorporation of surface feedback patterns estimated from remote sensing data was shown to increase the accuracy of digital soil texture mapping over low-relief areas [22].
As arable soils experience the influence of both agricultural and natural processes, resulting in the formation of various surface structure elements (clods, crust, cracks, grains), surface dynamic feedback patterns will be determined by the spatial arrangement of formed surface elements and the degree of their development.
Despite the recognition that surface state should be estimated when using remote sensing data for digital soil mapping as from one side it affects soil spectral reflectance [23] and from the other side can be additional source of information allowing to increase the accuracy of models for mapping of soil characteristics from remote sensing data [22], there is still a lack of studies on that topic.
Therefore, the aim of our research is to show how surface feedback patterns influence soil reflectance and its relationships with soil properties.

2. Experiments

The study area is comprised of four test plots. The first test plot (three arable fields) is located in north-eastern part of Saratov oblast in Russia. This territory is characterized by a moderately dry and moderately warm climate. The mean annual precipitation sum is 385 mm with a maximum of 255–270 mm in the warm season (April–October).
The soil cover is rather inhomogeneous there due to complex geological structure and shallow cover of quaternary deposits. Haplic and Calcic Chernozems formed on clay loam and clay are dominant. They are accompanied by Mollic Solonetz on clay and clay loams, Haplic Chernozems on eluvium of gaizes, Calcic Chernozems on sands and sandy loams, and Haplic and Calcic Chernozems on eluvium of sandstone, parent material exposure.
Second, third and fourth test plots (36 arable fields) are located in western, south-western and northern parts of Tulskaya oblast in Odoevskiy, Plavskiy and Yasnogorskiy regions correspondingly. The region has a moderate continental climate. Annual precipitation is 470 mm in the southeast and 575 mm in the northwest.
Soils of these test plots are represented by Albic Luvisols (Odoevskiy, Yasnogorskiy) and Luvic Greyic Phaeozems (Odoevskiy) formed on heavy clay loams, Grey-Luvic Phaeozems and Luvic Chernozems (Plavskiy) formed on calciferous loess loams.
The spectral reflectance was measured in the field in sunny weather with spectroradiometer HandHeld 2 working in optical domain (the range of wavelengths is from 325 to 1075 nm). The accuracy of measurements is ±1 nm. During the scanning, the apparatus was held perpendicular to the surface. Spectral reflectance at each point was measured 5-10 times and then averaged. Acquired spectra were also resampled at 10-nm intervals. Due to poor signal-to-noise ratio parts of spectrum before 350 and after 900 nm were removed from the analysis.
The research consisted of 2 main stages. At the first stage we assessed the effect of destroying surface feedback patterns (also referred to in the text as SFP) formed in the field, which is usually done when measuring spectral reflectance in laboratory. In addition, we also estimated the possible transformations of relationships between the properties of upper soil horizon and its spectral reflectance resulting from the removement of surface patterns.
For that, 50 samples were taken from the upper layer (0–5 cm depth) at the 1st test plot and scanned in dry intact (with original surface patterns) and ground (1-mm sieve) state. They were also analysed in laboratory for organic matter content [24] and texture [25].
The next stage was to find out what happens in the field with spectral reflectance when surface feedback patterns change in time during the growing season.
This part of the research was performed on the fields of 2nd, 3 rd and 4th test plots. Spectral data there was measured 8 times from April to November during 2 years (2014, 2015). Scanning was carried out on areas representing typical soils for the plots (3–5 points per a field). Generally 903 spectral curves were collected.
In our previous studies on soil spectral reflectance in optical domain it was found that along spectral curves there are sections where they change the direction due to variations in soil properties, contributing to soil reflectance [26,27,28]. Such indicative parameters were determined for studied soils and further used to assess the influence SFP have on soil reflectance. More information on the parameters and the way they are calculated can be found in [26,28].
As most of the remote sensing data used in digital soil mapping is multispectral, we recalculated obtained indicative parameters in relation to the width of spectral bands of satellite systems. In particular, we used Landsat TM-5 spectral bands. This was done to understand how changes in SFP affect soil reflectance when working with data of lower spectral resolution.
Correlation analysis, analysis of variance (ANOVA) and partial least squares regression (PLSR) were used to determine the way the destruction of SFP affects the relationships between reflectance parameters and soil properties. The effect of surface feedback pattern dynamics on soil reflectance was also estimated with ANOVA.
ANOVA was performed in the R environment with car package. The size of effect was measured with eta-squared (heplots package). PLSR modelling was done with pls package. Optimal number of components was determined using graphs of the cross validated (leave-one out method) root mean squared error of prediction (RMSEPcv). Coefficient of determination calculated with caret package was used to assess the prediction ability of the PLSR models.

3. Results and Discussion

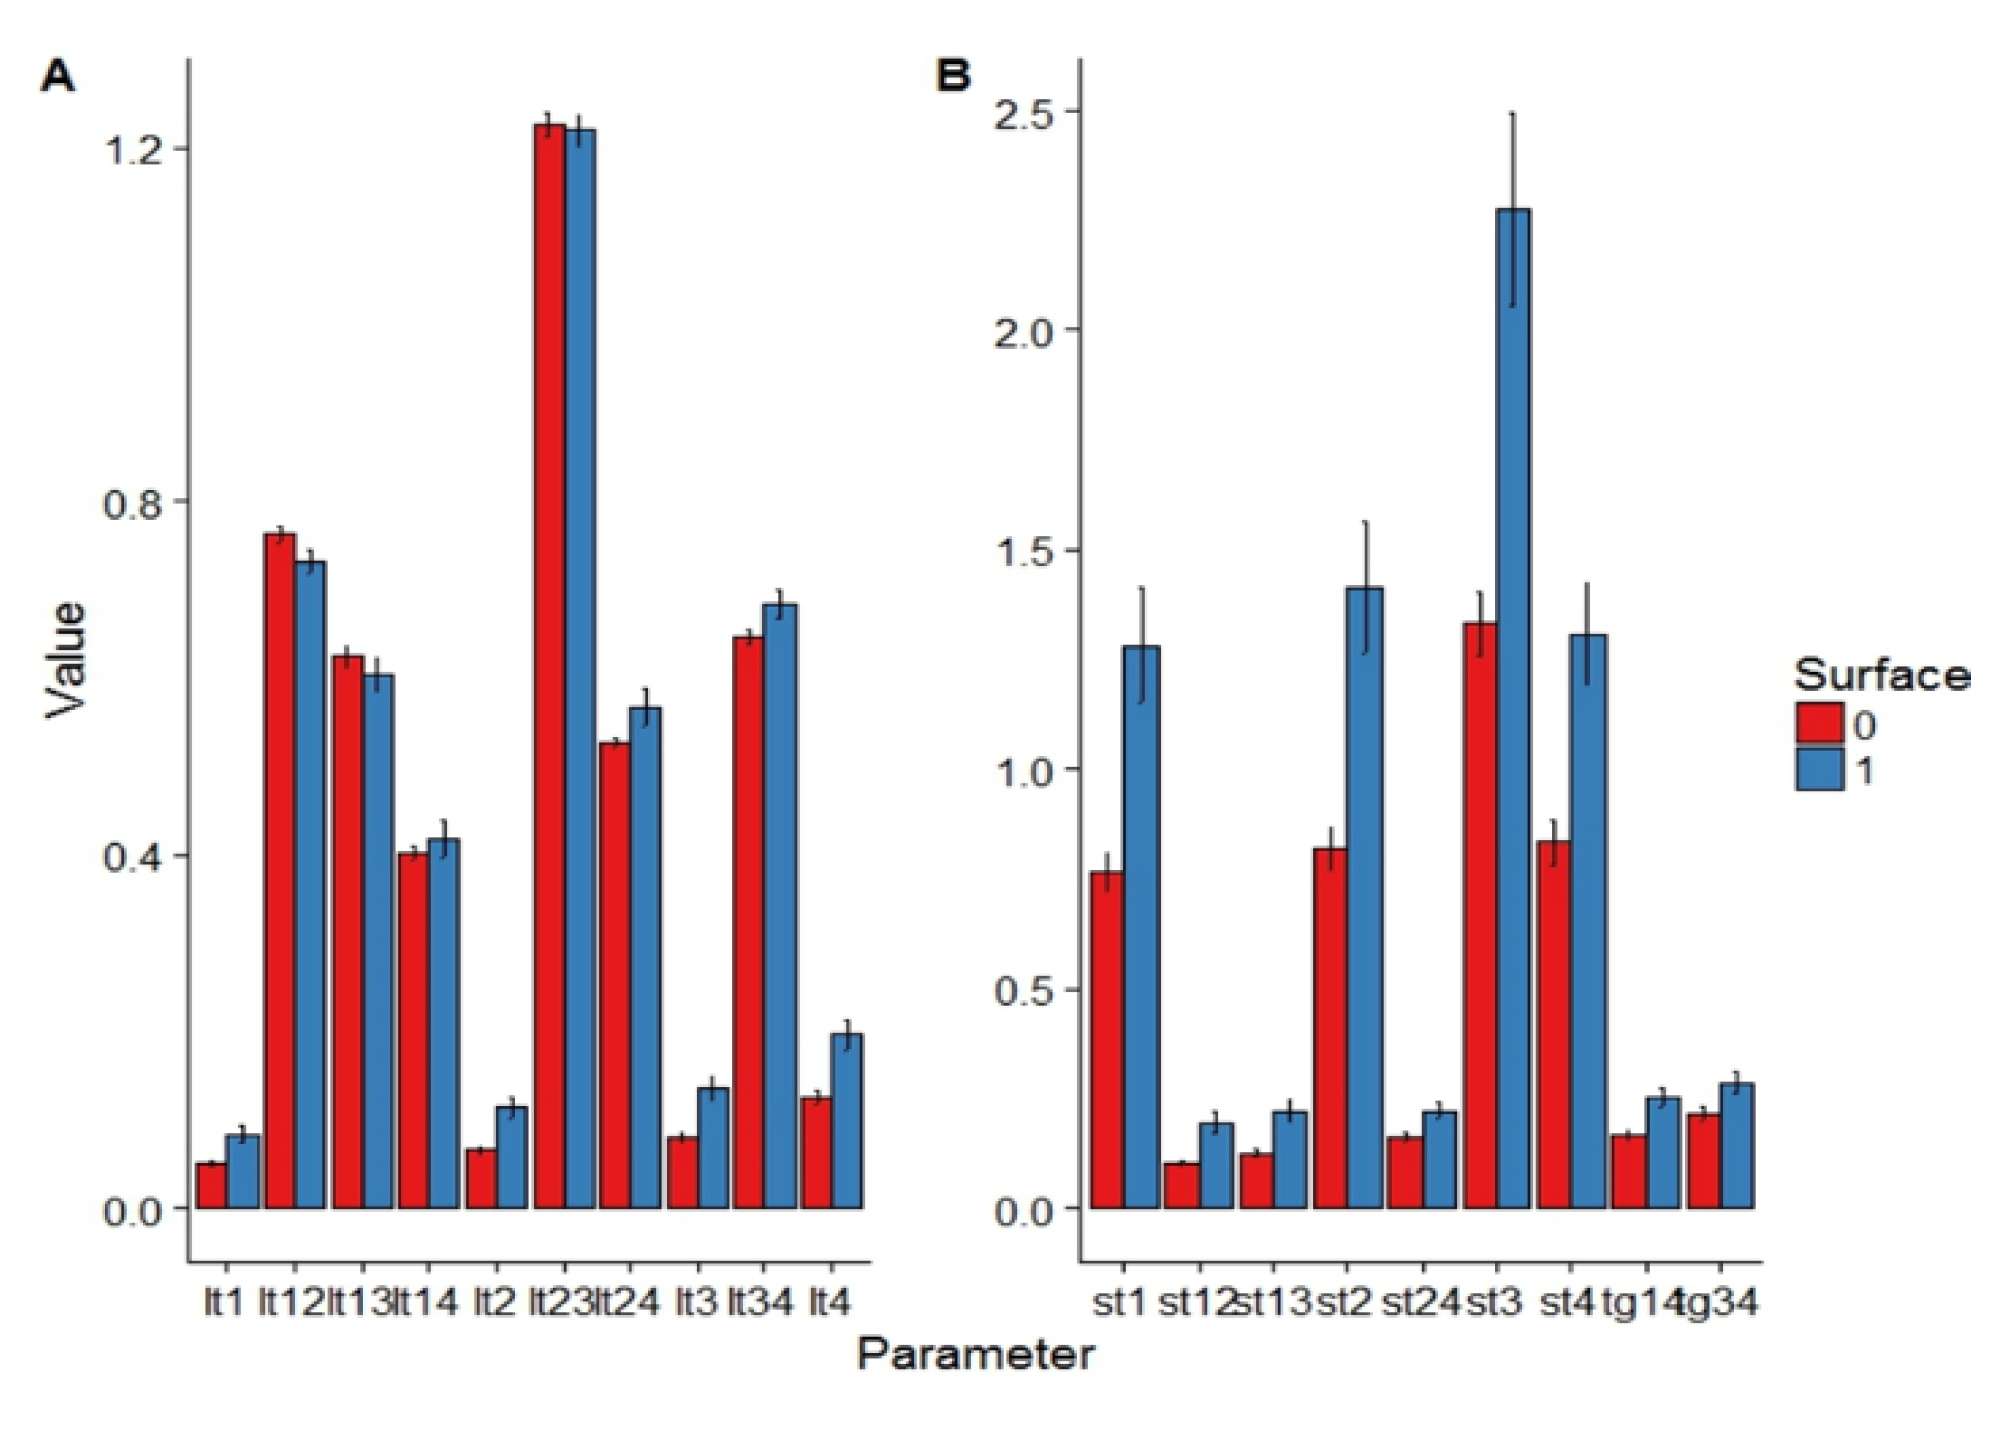
3.1. The Effect of Destroying SFP on Spectral Reflectance of Upper Soil Horizon

General analysis of spectral reflectance of dry intact and ground samples showed that removement of surface patterns results in smoothing of spectral curves and causes an increase in reflectance values.
As to indicative spectral parameters, according to analysis of variance the destruction of SFP determines 71% of their variation (Pillai’s trace = 0.71, F = 2.37, p = 0.03, eta squared = 0.71). The most pronounsed changes are observed for such parameters as st1, st2, st3 and st4, calculated as the ratios of reflectance value in certain band (Reflectance value for each considered band (here and further in the text) was obtained by recalculating from spectral data required with field spectroradiometer in relation to spectral bands of multispectral satellite systems (Landsat TM-5)) to its spectral width (Figure 1B).
Besides, the destruction of SFP results in a decrease of the correlation between organic matter, particles of coarse and medium sand fraction and spectral reflectance parameters (Table 1). In the case of fine sand and coarse silt fractions the parameters with significantly high correlations are changed.
Partial least squares regression also showed that the effect of destroying SFP varies with the properties. For organic matter, the complexity of model and R2 increase when SFP are destroyed (from three to five components and from 0.42 to 0.70 correspondingly). Prediction error changes very little (from 2.6 to 2.57). The number of model components for samples with removed SFP is also greater in case of coarse and medium sand particles (6 against 4), R2 alters slightly (from 0.70 to 0.68). But the RMSEPcv increases (from 8.1 to 10.39).
Model complexity does not change for fine sand and coarse silt particles; RMSEPcv also alters very little (from 19.5 to 19.15 and from 7.88 to 8.17 correspondingly). Determination coefficient decreases for the former (from 0.50 to 0.58) and increases for the latter (from 0.49 to 0.63).
Therefore, the removement of soil SFP may not only affect the accuracy of developed models used in digital soil mapping but also the relationships between soil reflectance and the properties itself.
Thus in order to apply the dependencies between soil characteristics and their spectral features for soil mapping and monitoring, spectral data should be acquired in the field and the registration of surface state should be done at the time of data acquisition.

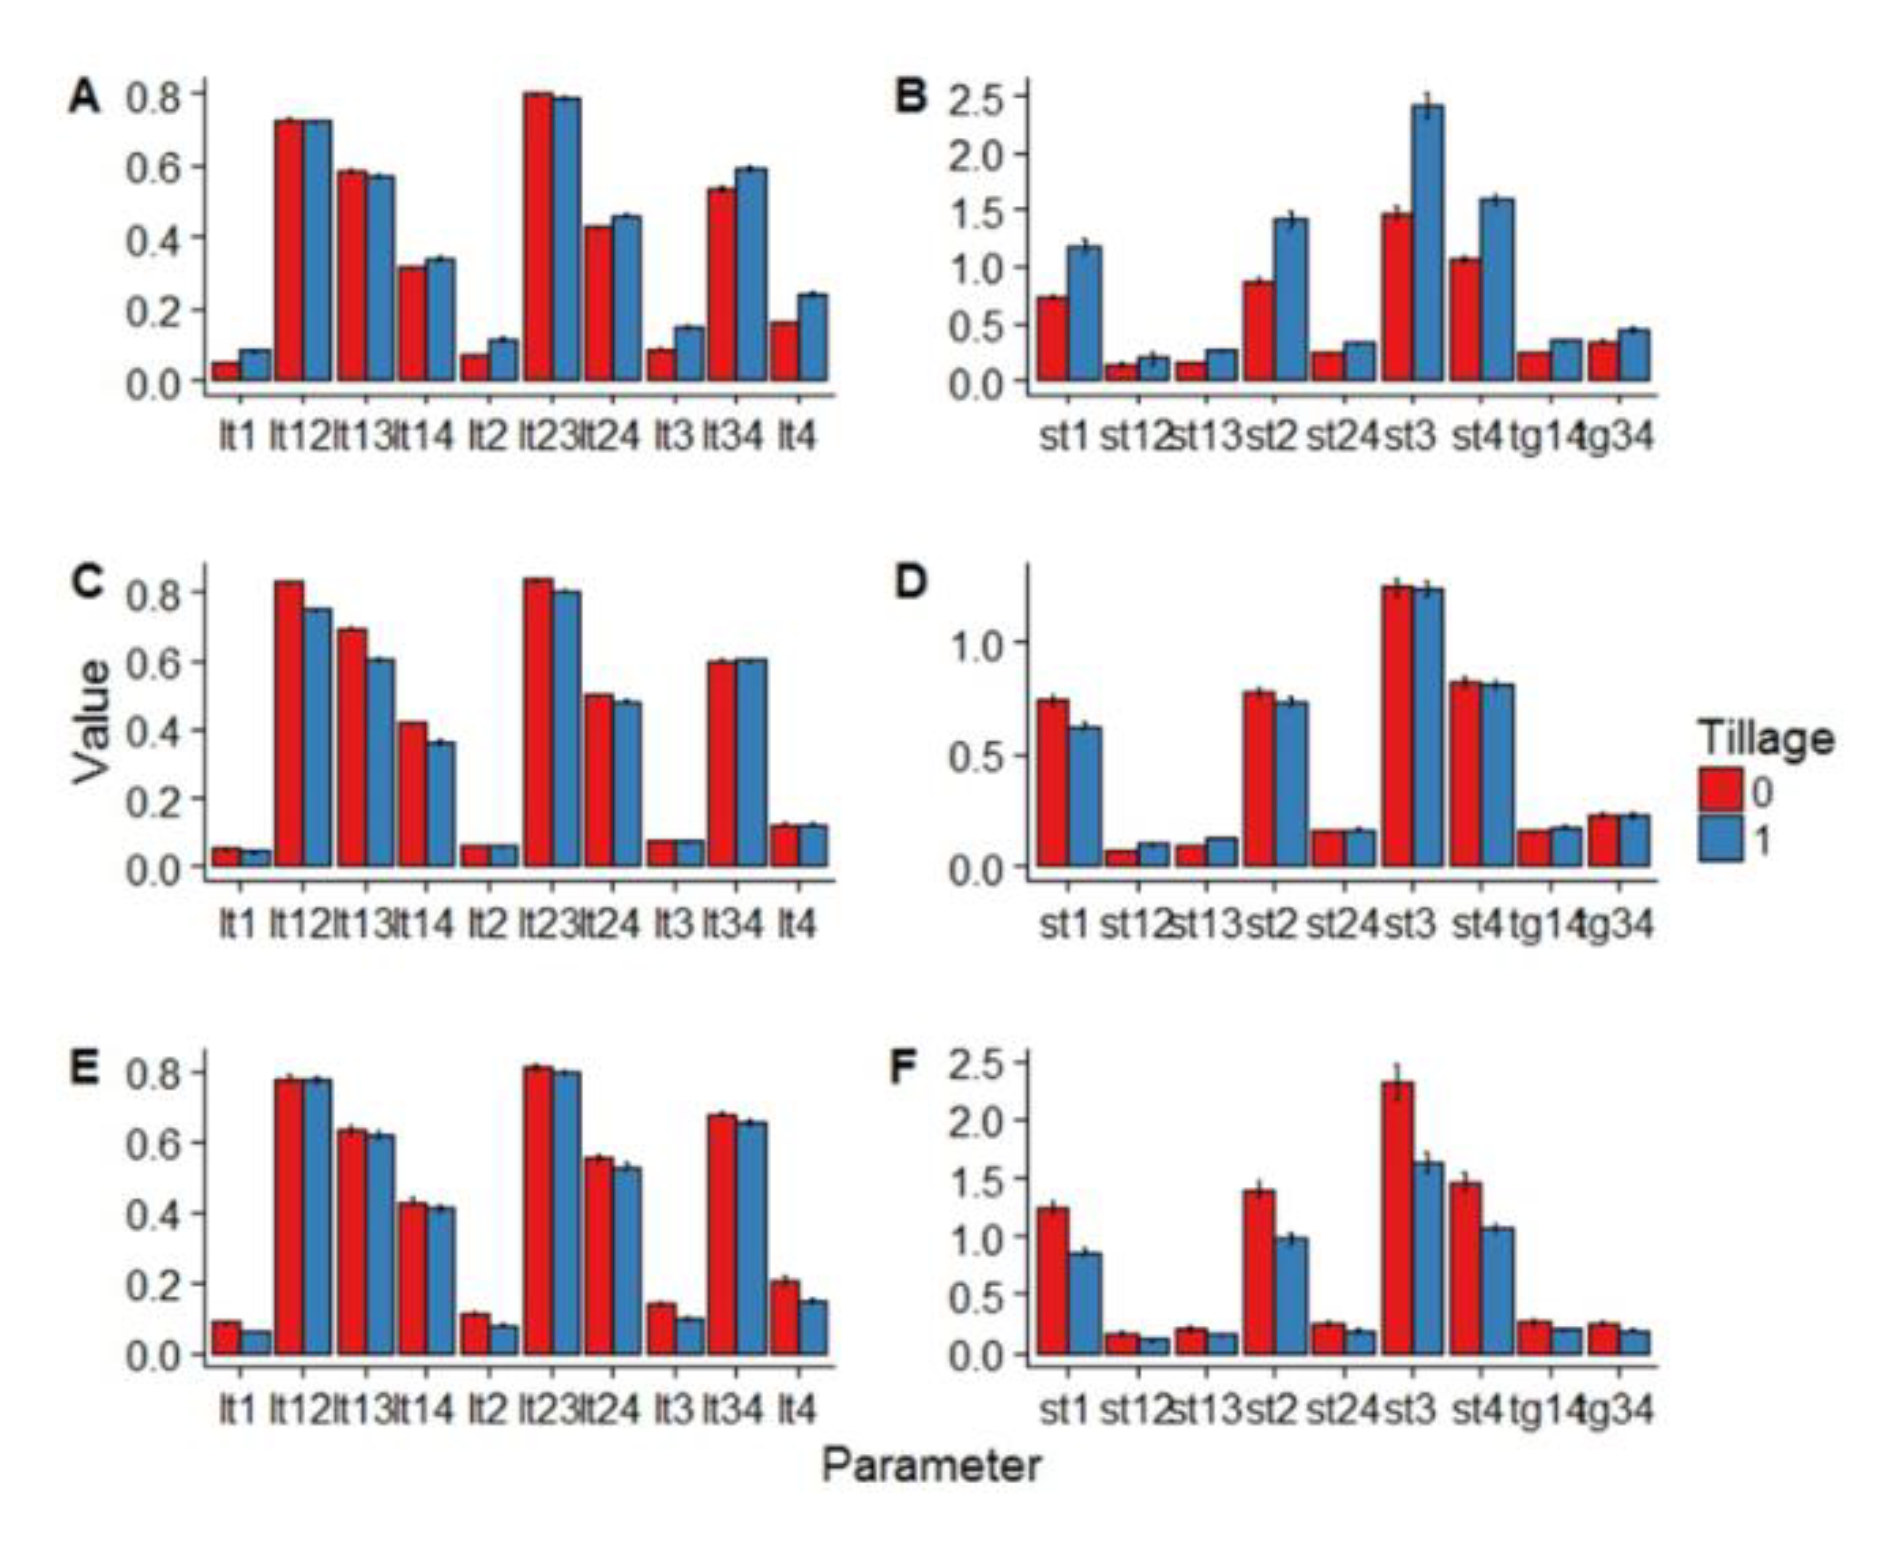
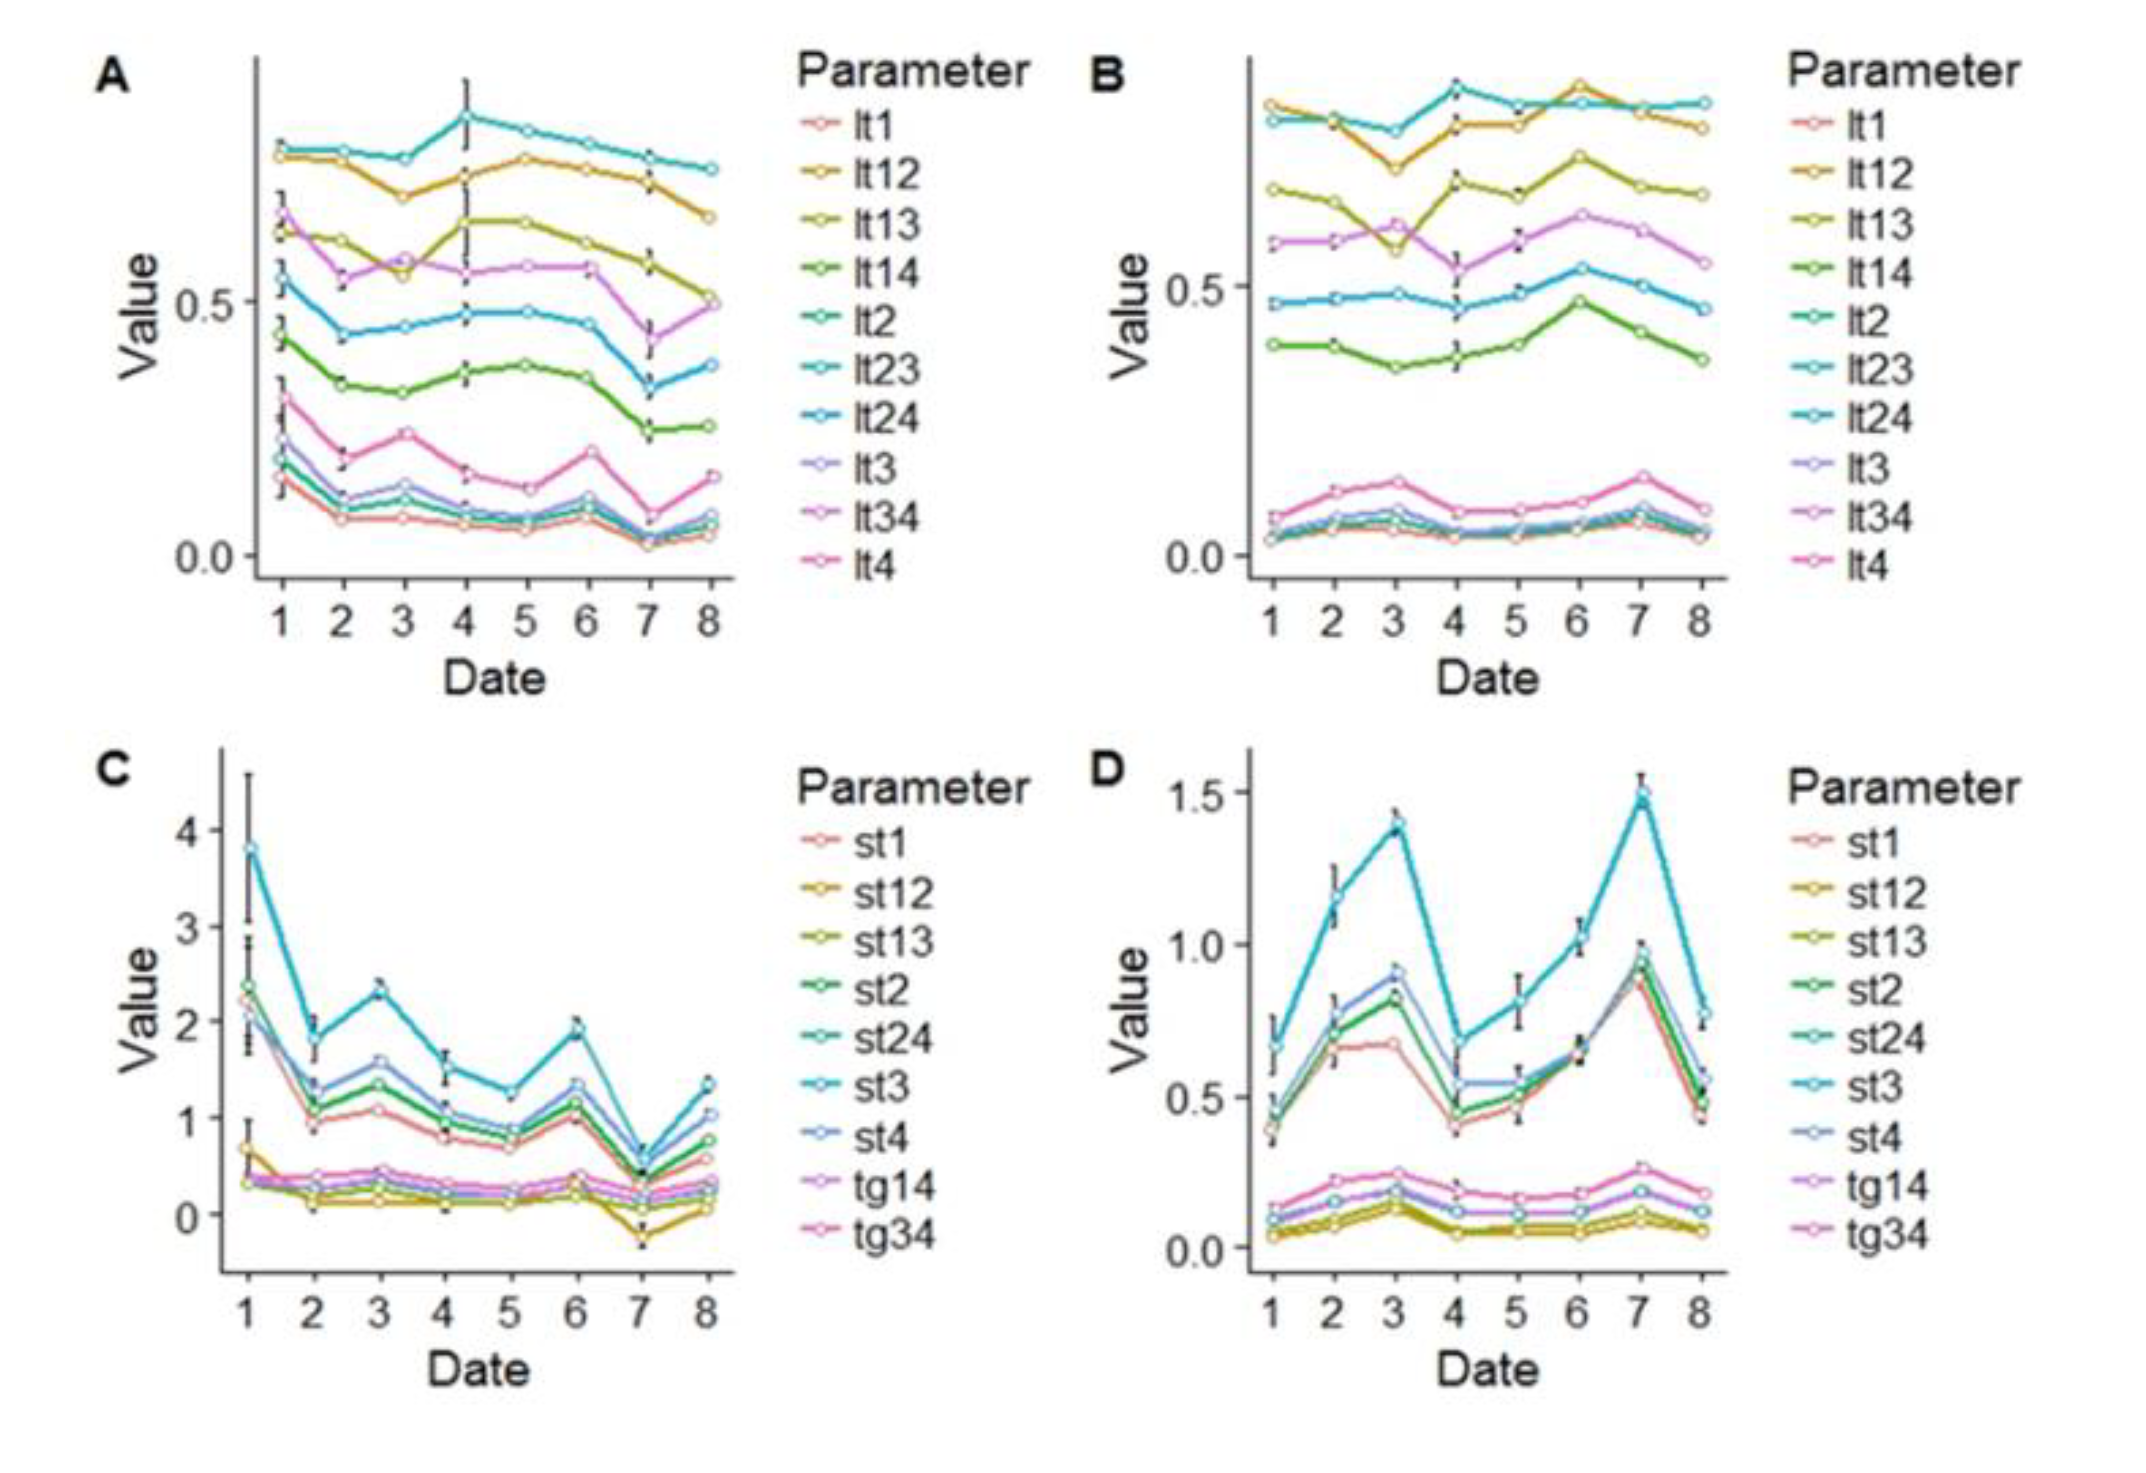
3.2. The Influence of the Dynamics of SFP on Spectral Reflectance of Upper Soil Horizon

The field observations of the bare soil surface on test plots revealed significant dynamics of its surface state caused by the influence of snow melting in spring and rainfalls in the spring-autumn period. Formed surface feedback patterns determine reflectance of upper soil horizon.
Analasing two-year data, we found that indicative spectral parameters vary with the time of spectral data acquisition (Figure 2). The character of changes and their magnitude are soil-specific as they differ with the test plots. The greatest variations are observed for st3 parameter.
The effect of tillage on surface reflectance was also found to be specific as it affected few indicative parameters (Figure 3). The biggest difference between reflectance of tilled and non-tilled surface is registered for such parametetrs as st1, st2, st3 and st4 on the 2nd and 4th test plots, and for lt13 and st1 parameters on the 3rd test plot.
Further analysis of variance proved that both the seasonality and tillage significantly affect soil reflectance properties (Table 2). The influence of tillage is generally higher. Moreover, SFP formed due to natural factors add up to the contribution of seasonality to reflectance variations. This effect also differs with the growing season.
Thus, as the dynamics of SFP accounts for more than 20% of spectral variations in the optical domain it will affect the stability and reproducibility of models which include information on the relationships between soil reflectance and its properties and are used as the basis of soil digital mapping and monitoring with optical remote sensing data.

4. Conclusions

The state of open soil surface is an important factor that should be considered when using optical spectral data for digital soil mapping as the destruction of formed surface feedback patterns alters soil reflectance causing 71% of spectral variations and modifies its relationships with soil properties.
The dynamics of surface patterns of arable soils due to natural and agricultural processes accounts for 22–50% of variations of indicative spectral parameters. The effect is greater on non-tilled soils with surface structure formed by natural processes and differs with soil type.
Therefore, ignoring state of open surface at the time of optical spectral data acquisition does not guarantee the reliability, stability and accuracy of estimated relationships between soil reflectance and properties.

Author Contributions

E.P. analyzed the data and wrote the paper; I.S. designed and performed the experiments. All authors have read and agreed to the published version of the manuscript.

Acknowledgments

This study was supported by RFBR Grant No. 18-016-00052, and RUDN University Program 5-100.

Conflicts of Interest

The authors declare no conflict of interest.

References

  1. Bowers, S.A.; Hanks, R.J. Reflectance of radiant energy from soils. Soil Sci. 1965, 100, 130–138. Available online: http://citeseerx.ist.psu.edu/viewdoc/download?doi=10.1.1.453.9032&rep=rep1&type=pdf (accessed on 10 December 2017). [CrossRef]
  2. Sinha, A.K. Spectral reflectance characteristics of soil and its correlation with soil properties and surface conditions. J. Indian Soc. Remote Sens. 1986, 14, 1–9. [Google Scholar] [CrossRef]
  3. Coleman, T.L.; Agbu, P.A.; Montgomery, O.L. Spectral differentiation on surface soils and soil properties: Is it possible from space platforms? Soil Sci. 1993, 155, 283–293. [Google Scholar] [CrossRef]
  4. Orlov, D.S. Spectral Reflectance of Soils and Their Components; Moscow State University: Moscow, Russia, 2001. [Google Scholar]
  5. Fox, G.A.; Sabbagh, G.J. Estimation of soil organic matter from red and near-infrared remotely sensed data using a soil line Euclidian distance technique. Soil Sci. Soc. Am. J. 2002, 66, 1922–1928. [Google Scholar] [CrossRef]
  6. Daughtry, C.S.T.; Bausch, W.C. Remote- and Ground-Based Sensor Techniques to Map Soil Properties. Photogramm. Eng. Remote Sens. 2003, 69, 619–630. [Google Scholar]
  7. Metternicht, G. ; Zinck. J.A. Remote Sensing of Soil Salinization. Impact on Land Management; CRC Press: New York, NY, USA, 2009. [Google Scholar]
  8. Belinaso, H.; Demattê, J.A.M.; Remerio, S.A. Soil spectral library and its use in soil classification. Rev. Bras. Cienc. Solo 2010, 34, 861–870. [Google Scholar] [CrossRef]
  9. Shepherd, K.D.; Walsh, M.G. Development of reflectance spectral libraries for characterization of soil properties. Soil Sci. Soc. Am. J. 2002, 66, 988–998. [Google Scholar] [CrossRef]
  10. Sankey, J.B.; Brown, D.J.; Bernard, M.L.; Lawrence, R.L. Comparing local vs. global visible and near-infrared (VisNIR) diffuse reflectance spectroscopy (DRS) calibrations for the prediction of soil clay, organic C and inorganic C. Geoderma 2008, 148, 149–158. [Google Scholar] [CrossRef]
  11. Rossel, R.A.; Webster, R. Predicting soil properties from the Australian soil visible-near infrared spectroscopic database. Eur. J. Soil Sci. 2012, 63, 848–860. [Google Scholar] [CrossRef]
  12. Stevens, A.; van Wesemael, B.; Bartholomeus, H.; Rosillon, D.; Tychon, B.; Ben-Dor, E. Laboratory, field and airborne spectroscopy for monitoring organic carbon content in agricultural soils. Geoderma 2008, 144, 395–404. [Google Scholar] [CrossRef]
  13. Shi, Z.; Wang, Q.; Peng, J.; Ji, W.; Liu, H.; Li, X.; Viscarra Rossel, R.A. Development of national VNIR soil-spectral library for soil classification and the predictions of organic matter. Sci. China Earth Sci. 2014, 57, 1–10. [Google Scholar] [CrossRef]
  14. Gogé, F.; Gomez, C.; Jolivet, C.; Joffre, R. Which strategy is best to predict soil properties of a local site from a national Vis-NIR database? Geoderma 2014, 213, 1–9. [Google Scholar] [CrossRef]
  15. Morgan, C.L.S.; Waiser, T.H.; Brown, D.J.; Hallmark, C.T. Simulated in situ characterization of soil organic and inorganic carbon with visible near-infrared diffuse reflectance spectroscopy. Geoderma 2009, 151, 249–256. [Google Scholar] [CrossRef]
  16. Sudduth, K.A.; Hummel, J.W. Soil organic matter, CEC, and moisture sensing with a portable NIR spectrophotometer. Trans. ASAE 1993, 36, 1571–1582. [Google Scholar] [CrossRef]
  17. Waiser, T.H.; Morgan, C.L.S.; Brown, D.J.; Hallmark, C.T. In situ characterization of soil clay content with visible near-infrared diffuse reflectance spectroscopy. Soil Sci. Soc. Am. J. 2007, 71, 389–396. [Google Scholar] [CrossRef]
  18. Ackerson, J.P.; Demattê, J.A.; Morgan, C.L. Predicting clay content on field-moist intact tropical soils using a dried, ground VisNIR library with external parameter orthogonalization. Geoderma 2015, 259, 196–204. [Google Scholar] [CrossRef]
  19. Ji, W.; Li, S.; Chen, S.; Shi, Z.; Rossel, R.A.V.; Mouazen, A.M. Prediction of soil attributes using the Chinese soil spectral library and standardized spectra recorded at field conditions. Soil Tillage Res. 2015, 155, 492–500. [Google Scholar] [CrossRef]
  20. Chappell, A.; Zobeck, T.M.; Brunner, G. Using on-nadir spectral reflectance to detect soil surface changes induced by simulated rainfall and wind tunnel abrasion. Earth Surface Process. Landf. 2005, 30, 489–511. [Google Scholar] [CrossRef]
  21. Zhu, A.; Liu, F.; Li, B.; Pei, T.; Qin, C.; Liu, G.; Wang, Y.; Chen, Y.; Ma, X.; Qi, F.; et al. Differentiation of soil conditions over low relief areas using feedback dynamic patterns. Soil Sci. Soc. Am. J. 2010, 74, 861–869. [Google Scholar] [CrossRef]
  22. Liu, F.; Geng, X.; Zhu, A.X.; Fraser, W.; Waddell, A. Soil texture mapping over low relief areas using land surface feedback dynamic patterns extracted from MODIS. Geoderma 2012, 171, 44–52. [Google Scholar] [CrossRef]
  23. Ben-Dor, E.; Irons, J.R.; Epema, G. Soil reflectance. In Remote Sensing for the Earth Sciences; Renzc, A.N., Ed.; Wiley: New York, NY, USA, 1999; Volume 3, pp. 111–188. [Google Scholar]
  24. Standards. GOST 26213-91. Soils. Methods of Determination of Organic Matter Content; Publisher of Standards: Moscow, Russia, 1992. [Google Scholar]
  25. Standards. GOST 12536-79. Soils. Methods of Laboratory Assessment of Texture and Microaggregate Composition; Publisher of Standards: Moscow, Russia, 2003. [Google Scholar]
  26. Prudnikova, E.Y.; Savin, I.Y. Satellite assessment of dehumification of arable soils in Saratov region. Eurasian Soil Sci. 2015, 48, 533–539. [Google Scholar] [CrossRef]
  27. Prudnikova, E.Y.; Savin, I.Y.; Vasilyeva, N.A.; Veretelnikova, I.V.; Bairamov, A.N. The color of soils as a basis for proximal sensing of their composition. Byulleten Pochvennogo Inst. Dokuchaeva 2016, 86, 46–52. [Google Scholar]
  28. Prudnikova, E.Y.; Savin, I.Y. Study of the optical properties of an exposed soil surface. J. Opt. Technol. 2016, 83, 642–647. [Google Scholar] [CrossRef]
Figure 1. Variations in indicative spectral parameters due to the destruction of soil surfrace feedback patterns: (A) parameters calculated as ratios of spectral reflectances of two corresponding bands (lt12, lt13, lt14, lt23, lt 24, lt34) and as average reflectance for the band (lt1, lt2, lt3, lt4); (B) parameters calculated as ratios of band reflectance to the its spectral width (st1, st2, st3, st4) and as the ratio of ditterence between reflectances in two bands to the difference between maximum and minimum wavelength of the corresponding bands (st12, st13, st24, st14, st34). Surface: 0—dry intact; 1—dry ground.
Proceedings 02 00357 g001
Figure 2. Variations in mean values of spectral indicative parameters due to seasonality (with error bars): (A,C) 2nd test plot; (B,D) 3rd test plot. Date corresponds to the times of spectral data acquisition.
Proceedings 02 00357 g002
Figure 3. Variations in mean values of indicative parameters due to tillage interference (with error bars): 0—non-tilled surface with SFP; 1—tilled surface; (A,B) results for the 2nd test plot; (C,D) results for the 3rd test plot; (E,F) results for the 4th test plot.
Proceedings 02 00357 g003
Table 1. Correlation coefficients between spectral reflectance and soil properties for intact (above the slash) and ground samples (under the slash). (Significant coefficients are written in semi-bold type).
Parameter 1Properties
Organic MatterCoarse and Medium Sand ParticlesFine Sand ParticlesCoarse Silt Particles
lt10.61/0.02−0.27/0.03−0.56/−0.50.48/0.58
lt30.44/0.05−0.21/0.01−0.61/−0.370.56/0.39
st10.59/0.05−0.32/0.02−0.55/−0.520.47/0.6
st130.26/−0.030.09/0.02−0.7/−0.10.64/0.07
st30.49/0.05−0.19/0.01−0.64/−0.370.57/0.39
lt120.14/0.21−0.61/−0.180.46/−0.43−0.3/0.58
lt23−0.32/−0.210.52/−0.14−0.31/0.770.33/−0.8
lt130.27/0.19−0.68/−0.060.46/−0.59−0.38/0.72
lt140.09/0.09−0.51/0.010.4/−0.64−0.27/0.74
lt24−0.06/0.03−0.36/0.120.42/−0.64−0.35/0.67
1 Only parameters having at least one significant correlation coefficients are shown.
Table 2. Multivariate analysis of surface dynamics influence on soil spectral reflectance.
ParameterSeasonalitySeasonality/TillageSeasonality/YearTillage
Non-TilledTilled20142015
2nd test plot
Pillai’s trace1.241.540.900.531.050.28
F6.016.262.483.245.177.83
p-value0.000.000.000.000.000.00
eta squared0.250.380.220.270.350.28
3rd test plot
Pillai’s trace1.300.911.161.160.910.50
F12.2223.417.067.0623.4145.23
p-value0.000.000.000.000.000.00
eta squared0.220.460.290.290.460.50
Publisher’s Note: MDPI stays neutral with regard to jurisdictional claims in published maps and institutional affiliations.

