Proceeding Paper

Data Mining Using NDVI Time Series Applied to Change Detection †

by
Andeise Cerqueira Dutra
*,
Yosio Edemir Shimabukuro
and
Maria Isabel Sobral Escada
National Institute for Space Research (INPE), Av. dos Astronautas, 1758, 12227-010, São José dos Campos—SP, Brazil
*
Author to whom correspondence should be addressed.
Presented at the 2nd International Electronic Conference on Remote Sensing, 22 March–5 April 2018; Available online: https://sciforum.net/conference/ecrs-2.
Proceedings 2018, 2(7), 356; https://doi.org/10.3390/ecrs-2-05169
Published: 22 March 2018
(This article belongs to the Proceedings of The 2nd International Electronic Conference on Remote Sensing)

Abstract

:
Quantifying and monitoring woody cover distribution in semiarid regions is challenging, due to their scattered distribution. Data mining has been widely used with remote sensing data for the information extraction of spectral and temporal data in the analysis of change detection. The main objective of this study was to characterize the land cover and use over the 2000–2010 time period for the Brazilian Caatinga seasonal biome using a temporal Normalized Difference Vegetation Index (NDVI) series and Geographic Object-Based Image Analysis (GEOBIA). For each of the target years NDVI images were derived from a Moderate Resolution Imaging Spectroradiometer (MODIS, MOD13Q1, at a 250 m spatial and 16-day temporal scale) sensor during the dry season to predict wood cover in the municipality of Buriti dos Montes, in the state of Piaui in the north-east region of Brazil (H13V09 tile). The images were automatically pre-processed and the GEOBIA approach was performed for image segmentation, spatial and spectral attribute extraction and labelling according to the following legend, tree cover (TC) and cropland/grass (CG), to obtain a classification using the decision tree supervised algorithm. Our results showed that the approach using GEOBIA presented a Kappa index of 0.58 and global accuracy (GA) of 0.81% and showed better accuracy for the tree cover. Finally, we recommend new studies adding others parameters strongly related to the vegetation of semiarid regions.

1. Introduction

Semiarid regions present low and irregular precipitation, limited to a very short period of the year in a large part of their extension. These regions are mainly characterized by a long period of rainfall reduction [1]. In Brazil, almost half of the semiarid region receives less than 750 mm/year and periods of drought are relatively frequent in the north-east region as a consequence of high interannual rainfall variability. Northeast Brazil has a type of vegetation adapted to semiarid conditions called Caatinga in which biome covers an area of circa 844,453 km2 or approximately 11% of the Brazilian territory and is populated by more than 27 million inhabitants [2].
However, the Caatinga biome is the third most degraded in Brazil and this region has suffered heavy losses of natural vegetation as a common practice for the preparation of land for agriculture, contributing to the loss of biodiversity. Moreover, the partial or total removal of the native vegetation has caused a reduction in the aerial biomass, a practice that has been carried out in a predatory manner due to firewood being one of the main energy sources in the region [3].
In this context, monitoring and mapping is crucial to understand vegetation and structural changes [4] and their variations over time. Thus, many studies have used remote sensing techniques to extract information for the analysis of temporal series through the mining of spatial and spectral data for change detection [5]. Geographic object-based image analysis (GEOBIA) is based on topological information and the geometry of the objects for the classification of images.
In this context, the aim of the present work is to classify the land cover and land use of the Brazilian Caatinga seasonal biome using geographic object-based image analysis (GEOBIA) in a temporal Normalized Difference Vegetation Index (NDVI) series over the 2000–2010 time period.

2. Materials and Methods

2.1. Study Area

To accomplish our study goal, we investigated the municipality of Buriti dos Montes (Figure 1), located in the state of Piaui in northest region of Brazil. The municipality occupies an area of approximately 2653 km2. The mean altitude is 500 m and has a tropical climatic classification, with a dry season between July and October [6,7].
The area is characterized by the representative vegetation of semiarid regions, presenting tree and shrub caatinga cover [8], and the main agricultural products are rice, beans and corn where native plants have been replaced [6].

2.2. Acquisition and Pre-Processing of the Data

This study uses MODIS (moderate resolution imaging spectroradiometer) sensor imagery from MOD13Q1, a NDVI (Normalized Difference Vegetation Index) product available at a 250 m spatial resolution [9], composed of a mosaic of 16 days of imaging. Based on the supposition that only trees and shrubs have active photosynthesis during the dry season, we applied the methodology process only for the months of August, over the period 2000–2010 to the tile H13V09 available at EarthData—NASA (<https://ladsweb.modaps.eosdis.nasa.gov>) atmospherically corrected.
Two land cover and land use maps were used for the years 2000 and 2010 as a reference data for this study. The data were obtained from SAP (Sistema de Alerta Precoce contra a Seca e Desertificação—CCST/INPE) at a 30 m spatial resolution derived from Landsat TM (thematic mapper) and Landsat ETM+ (enhanced thematic mapper) sensors [8].
Very high spatial resolution sensor images from the GeoEye 1 satellite were visualized in Google Earth Pro software. The images were used for the visual interpretation of the targets and illustration of the land cover changes detected in the MODIS time series.
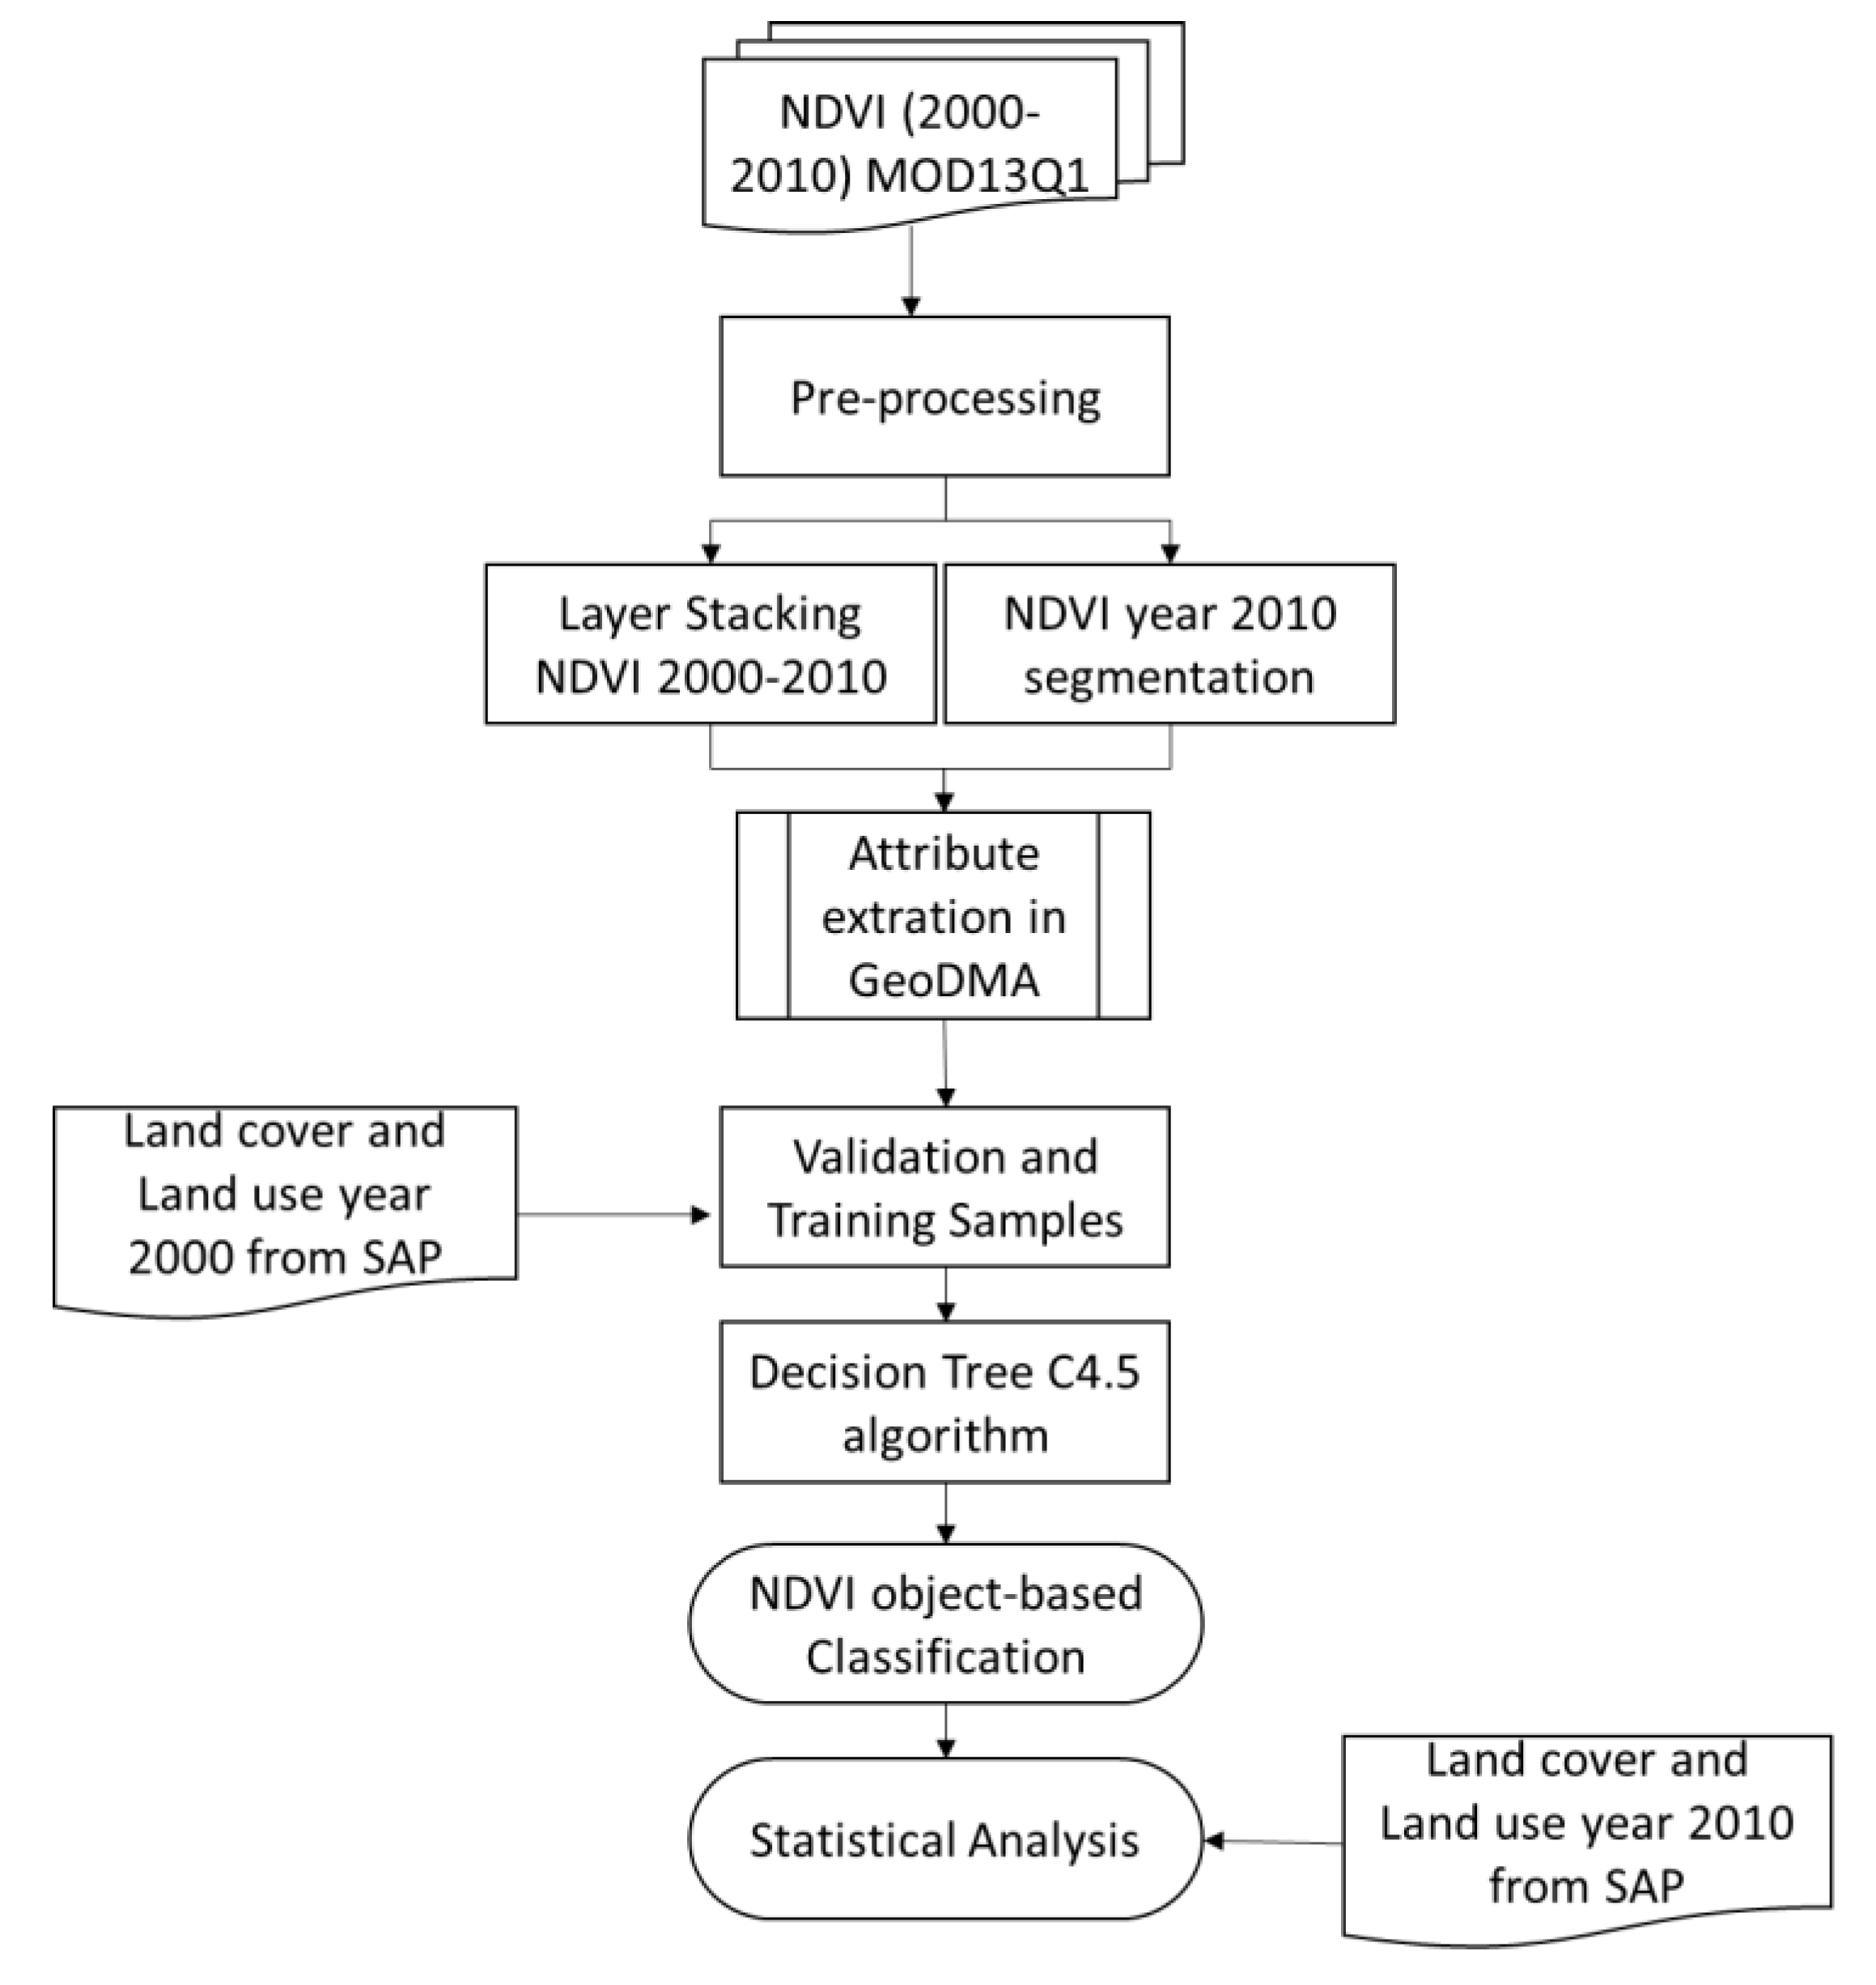
In the pre-processing stage, the images of the NDVI product were extracted to the interest area within the limits of the municipality and were then stacked to a single raster cube file in the ENVI 5.1 environment. All the images were normalized to a range of 0 to 1 (Figure 2).
The second part of the study was carried out in the TerraView 4.2.2 software for the processes involving data mining techniques. Image segmentation, attribute extraction and sampling for training were the stages performed specifically through the GeoDMA (geographical data mining analyst) plug-in [10] that is used by GEOBIA for image classification [11].
For this procedure, the segmentation process was performed in the NDVI product for year 2000. We used the segmentation algorithm based on the growing region [12], for which the Euclidean distance and minimum area parameters are used to divide the image into homogeneous spectral regions. During this procedure, several segments were tested, but the threshold that best fit the analyzed data was the values 30 and 10 for the Euclidean distance and minimum area, respectively.
Subsequently, the spectral and spatial metrics were extracted using the segmentation results and the NDVI cube over the analyzed period. Thus, each object generated through segmentation had an attribute value calculated from the selected metrics.
For the classification process, it was necessary to select training and validation samples, which consisted of the selection of the pixels or homogeneous regions that best represented each one of the classes resulting in an object-based classification map. In this study, we used the land cover and land use mapping from the SAP as a reference for year 2000. The selected samples were used for the classification based on the decision tree by algorithm C4.5 available in the GeoDMA plug-in. Objects were classified into two land cover classes; the tree cover (TC) class, defined as trees and shrub caatinga, and the cropland/grass (GC) class.
Due to the lack of appropriate field data required to assess the quality of the land cover map produced for our study, in order to evaluate the accuracy, we opted to compare the land cover map from the SAP of year 2010, used as a reference map, with the classification obtained by the decision tree. The Kappa index (Equation (1)) obtained by the error matrix, global accuracy (Equation (2)), hypothesis test by Z test (Equation (3)), producer accuracy (Equation (4)) and consumer accuracy (Equation (5)) were used.
k ^ = θ 1   θ 2 1 θ 2   ,     w h e r e :     θ 1 = k = 1 c x k k n       e     θ 2 = k = 1 c x + k n ²
G l o b a l   A c c u r a c y :         k = 1 c X k k n
Z   T e s t = k ^ k V a r ( k ^ )   ~ N ( 0 , 1 )
Producer Accuracy   k = X k k X + k
Consumer Accuracy       k =   X k k X k +  
where kk is the sum of each element of the diagonal, +k is the total of the column of each class and k+ is the total of the row of each class.

3. Results and Discussion

After performing the steps in GeoDMA, the C4.5 classifier generated the decision tree from the calculated spatial and spectral metrics, using those that best fit the data set.
Using the decision tree generated by the classification algorithm, we obtained a land cover and land use classification map based on the NDVI time series. The generated map was compared in relation to our reference dataset for the year 2010 also in terms of the SAP in order to generate the statistical analyses (Figure 3).
Based on the generated map and the reference map of the 2010 year, the extension for each class was calculated, obtaining a result of 1927 km2 for tree cover and 725 km2 for cropland/grass using the classification based on the NDVI time series. On the other hand, for the reference map, the TC area covered approximately 1746 km2 of the municipality of Buriti dos Montes; this was 907 km2 for cropland/grass (Table 1).
According to [8], about 81.5% of the entire territory of the municipality of Buriti dos Montes was covered by Caatinga (tree and shrub ) in year 2000, however, there was a reduction of the vegetation cover to 65.82% in year 2010, while there was a considerable increase of 15.64% in agriculture.
In addition, according to [8], twice the average number of outbreaks of fire for the year 2010 was reported, ranging from an average of 50–100 fires detected. Moreover, there was an increase of the environmentally susceptible area index (IAS), reaching levels of moderate and high susceptibility in the municipality.
The error matrix (Table 2) was generated after crossing the 265 sampling points with the map obtained using object-based classification. The Kappa index for this classification process was 0.58 and the global accuracy was 81%. The main source of error occurred in the classification of 31 TC areas as CG. The pattern identified in this study suggests that there are large variations between classes due to the patchiness of tree cover, as well as due to the scattered distribution of wood plants and the distribution of cultivated fields. Values of producer and consumer accuracy were also observed (Table 3).
Considering the application of the Z test at 5% significance, in order to verify whether there was agreement between the NDVI time series in the object-based classification and the reference map for the year 2010, we observed that a Z value of 10.88 meant that there is agreement between both maps.
This can be attributed to the fact that the results of the classification obtained from the time series of the NDVI did not obtain excellent results, possibly due to differences in the spatial resolution of the data used and the reference data.

4. Conclusions

The use of the GeoDMA computational application for the extraction of the spatial and spectral metrics through data mining proved to be an efficient and accessible tool for classifying orbital images of the temporal NDVI series using the C4.5 algorithm.
The results indicated that the process of classification through the data mining method allows the detection of changes in land cover using the NDVI product for a long period, especially with regard to the expansion of agriculture in the municipality of Buriti dos Montes.
Finally, we recommended new approaches for the use of Earth observation data with a higher spatial resolution for better comparison with the reference data used in this work, as well as the addition of other parameters strongly related to the vegetation of semiarid regions.

Acknowledgments

The authors thank the National Institute for Space Research (INPE/Brazil) and CAPES.

Conflicts of Interest

The authors declare no conflict of interest.

References

  1. Jacques, D.C.; Kergoat, L.; Hiernaux, P.; Mougin, E.; Defourny, P. Monitoring Dry Vegetation Masses in Semi-Arid Areas With Modis Swir Bands. Remote Sens. Environ. 2014, 153, 40–49. [Google Scholar] [CrossRef]
  2. Ministério do Meio Ambiente (Mma). Biomas—Caatinga. Available online: www.mma.gov.br/biomas/caatinga (accessed on 8 August 2017).
  3. Silva, A.C.D.C.; Prata, A.P.D.N.; Souto, L.S.; Mello, A.A.D. Aspectos de ecologia de paisagem e ameaças à biodiversidade em uma unidade de conservação na Caatinga, em Sergipe. Rev. Árvore 2013, 37, 479–490. [Google Scholar] [CrossRef]
  4. Suemi Saito, N.; Paiva Arguello, F.V.; Alves Moreira, M.; Rosa Dos Santos, A.; Coelho Eugenio, F.; Costa Figueiredo, A. Uso da geotecnologia para análise temporal da cobertura florestal. Cerne 2016, 22, 11–18. [Google Scholar] [CrossRef]
  5. Korting, T.S. GeoDMA: A Toolbox Integrating Data Mining with Object-Based and Multi-Temporal Analysis of Satellite Remotely Sensed Imagery. Ph.D. Thesis, Inpe-Instituto Nacional De Pesquisas Ambientais, São José Dos Campos, Brazil, 2012. [Google Scholar]
  6. Ibge. Instituto Brasileiro De Geografa E Estatística. In Banco De Dados Agregados. Available online: www.ibge.gov.br (accessed on 8 August 2017).
  7. Kottek, M.; Grieser, J.; Beck, C.; Rudolf, B.; Rubel, F. World Map of The Köppen-Geiger Climate Classification Updated. Meteorol. Z. 2006, 15, 259–263. [Google Scholar] [CrossRef]
  8. Vieira, R.M.S.P.; Tomasella, J.; Alvalá, R.C.S.; Sestini, M.F.; Affonso, A.G.; Rodriguez, D.A.; Barbosa, A.A.; Cunha, A.P.M.A.; Valles, G.F.; Crepani, E.; et al. Identifying Areas Susceptible to Desertification in the Brazilian Northeast. Solid Earth 2015, 6, 347–360. [Google Scholar] [CrossRef]
  9. Kamel, D. Mod13q1 Modis/Terra Vegetation Indices 16-Day L3 Global 250 m Sin Grid; Nasa Lp Daac. University of Arizona, Alfredo Huete—University of Technology Sydney and Modaps Sips—Nasa: Washington, DC, USA, 2015. [Google Scholar]
  10. Korting, T.S.; Garcia Fonseca, L.M.; Câmara, G. Geodma—Geographic Data Mining Analyst. Comput. Geosci. 2013, 57, 133–145. [Google Scholar]
  11. Korting, T.S.; Fonseca, L.M.; Escada, M.I.S.; Silva, F.C.; Silva, M.P.S. Geodma: A Novel System for Spatial Data Mining. In Proceedings of the IEEE International Conference on Data Mining Workshops, Pisa, Italy, 15–19 December 2008. [Google Scholar]
  12. Bins, L.; Fonseca, L.M.; Erthal, G.J.; Mitsuo Ii, F. Satellite Imagery Segmentation: A Region Growing Approach. Proceeidngs of the Simpósio Brasileiro De Sensoriamento Remoto, Salvador, Brasil, 14–19 May 1996; pp. 677–680. [Google Scholar]
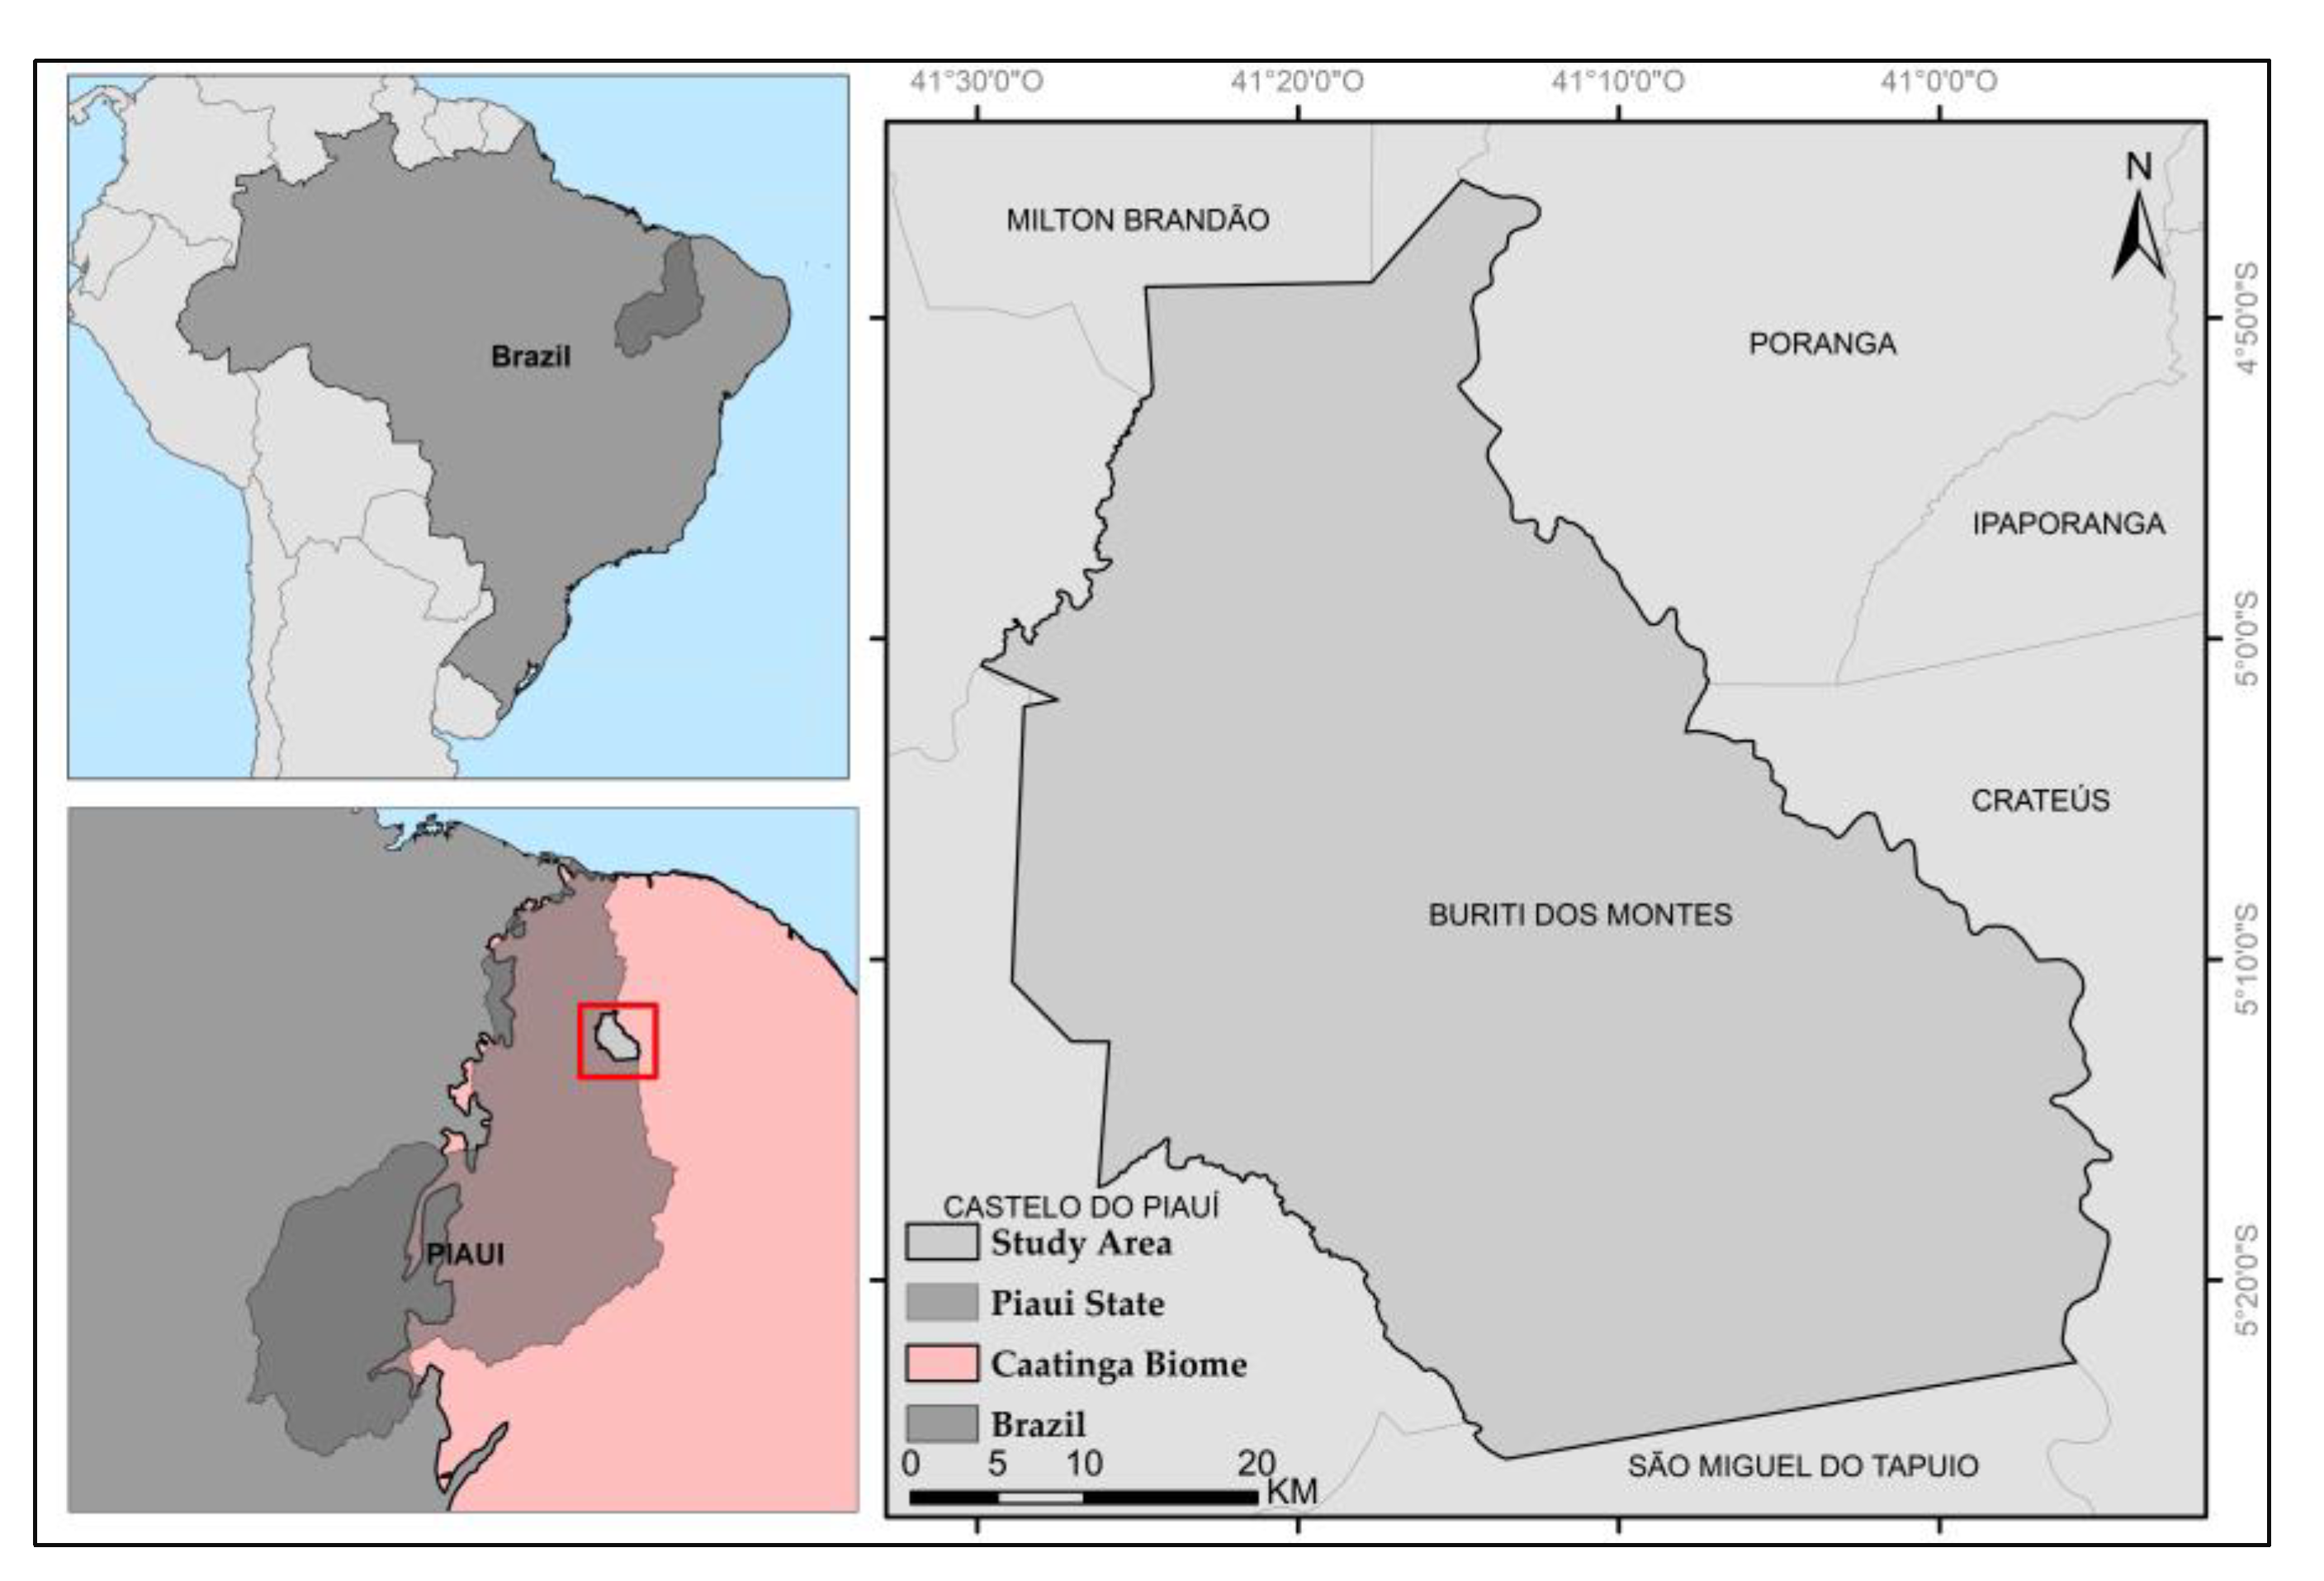
Figure 1. Location of the study area in Piauí, Brazil.
Proceedings 02 00356 g001
Figure 2. Methodological work-flow including earth observation data for assessing changes in the vegetation.
Proceedings 02 00356 g002
Figure 3. (a) Normalized Difference Vegetation Index (NDVI) time series object-based classification map and (b) Land cover and land use reference data for the 2010 year by Sistema de Alerta Precoce contra a Seca e Desertificação (SAP); adapted by the author.
Proceedings 02 00356 g003
Table 1. Area of tree cover and cropland/grass classes for object-based classification and SAP mapping for the year 2010 as a reference.
Area 2010 (km2)
NVDI ClassificationSAP Reference
Tree Cover19271746
Cropland/Grass725907
Total26532653
Table 2. Error matrix for object-based classification.
ClassesTree CoverCropland/GrassTotal
Tree Cover15131182
Cropland/Grass196483
Total17095265
Kappa Index 0.58
Global Accuracy 0.81
Z Test 10.88
Table 3. Producer and consumer accuracy for the NDVI classification (%).
ClassesProducer AccuracyOmission ErrorConsumer AccuracyInclusion Error
Tree Cover88.8211.1782.9617.03
Cropland/Grass67.3632.6377.1022.89
Publisher’s Note: MDPI stays neutral with regard to jurisdictional claims in published maps and institutional affiliations.