1. Introduction
With the burgeoning coastal population in India, food demands have increased over the years. Sea food is very popular in coastal regions and to meet the demand, aquaculture systems are growing very fast. Aquaculture is used to produce food and other commercial products that are extracted from fish, prawns, shrimp, mussels, and other marine life. There are two types of aquaculture: marine and freshwater. Marine aquaculture focuses on the production of shrimp, fish, mussels, oysters, and seaweed. India has a coastline of 7517 km, and therefore, it has huge potential for marine aquaculture. Aquaculture farming contributes 1.1% of India’s GDP [
1]. In India, the annual fisheries and aquaculture production have increased from 0.75 million tonnes in 1950–1951 to 11.41 million tonnes in 2016–2017 [
2], second only to China [
2]. Over 10% of the global fish diversity can be found around the Indian subcontinent, and >15 million people depend on fishery activities for their livelihood. During the financial year 2016–2017, India has exported aquaculture products of worth US
$ 5.78 billion [
2].
An artificial neural network is a computing system that is based on the operation of neurons in the human brain. Neural networks are used for complex signal processing or image recognition [
3]. Examples of commercial use of neural networks are handwriting recognition, speech to text transcription, oil exploration, data analysis, and facial recognition. As humans recognize any object through their experience, computers also have the capability to identify any object based on its example data set. This feature is called pattern recognition and is used for computer vision [
4]. Computers understand the pattern of pixels in an example data set and then recognize the object from other images.
Satellite images and extracted thematic maps provide higher level information to recognize, monitor, and manage resources [
5]. Image classification depends on the spectral characteristics of features. It is important to refine techniques to improve the accuracy of image classification for deriving land use and land cover maps [
6]. Popular methods of satellite image classification are mainly based on digital values of an example data set. Neural network classification methods are typically based on digital values as well as their patterns. River, ocean, lagoon, and aquaculture features have similar reflectance in satellite images; however, geometrical shapes are observed in aquaculture, whereas other features such as rivers, oceans, etc. usually have irregular patterns.
Odisha is a coastal state of India with a coastline of 480.4 km. There are 13 ports and 57 fish landing centers in Odisha [
7]. Bhadrak and Kendrapara districts are in coastal regions, wherein aquaculture practices have increased rapidly over the last two decades. These activities are major sources of income for middle-class communities. Foreign export of these products makes this activity even more profitable, while the risk component may not be neglected. As the Odisha government is promoting aquaculture practices via ‘Fish Pond Yojna’, people have started aqua farming [
8]. The main objectives of this study are to extract aquaculture from multi-spectral satellite images based on a neural network classification method and to estimate the dynamics of land use and land cover changes due to aquaculture.
2. Study Area & Data Used
The study area comprises the two coastal districts (Bhadrak and Kendrapara) of Odisha, India. Bhadrak district is located between 21°0′ N to 20°59′ N & 86°17′ E to 86°53′ E. Its area is 2505 km
2. Its population is 1,506,522 and its population density is 601 per km
2. Dhamra port is located on the banks of the Baitrani River. Kendrapara district is located between 20°20′ N to 20°37′ N & 86°14′ E to 87°01′ E. Its area is 2644 km
2. The total population is 1,439,891 and the population density is 492.38 per km
2. Bhitarkanika National Park is located in this area and is a famous tourist place in Odisha. The locations of Bhadrak and Kendrapara districts are shown in
Figure 1.
Landsat 7 ETM+ and Landsat-8 images were obtained from USGS (
www.earthexplorer.usgs.gov). The ETM+ images were acquired for the year 2002 while the landsat-8 OLI images were from 2017. Landsat 7 has six spectral bands in the visible to SWIR range with a spatial resolution of 30 m and temporal resolution of 16 days. It has two sensors: OLI (Operational Land Imager) and TIRS (Thermal Infrared Sensor). It has eleven bands with Visible to SWIR bands having a spatial resolution of 30 m and temporal resolution of 16 days.
Table 1 shows the date of acquisition of satellite data and their coreesponding path and row numbers.
3. Methodology
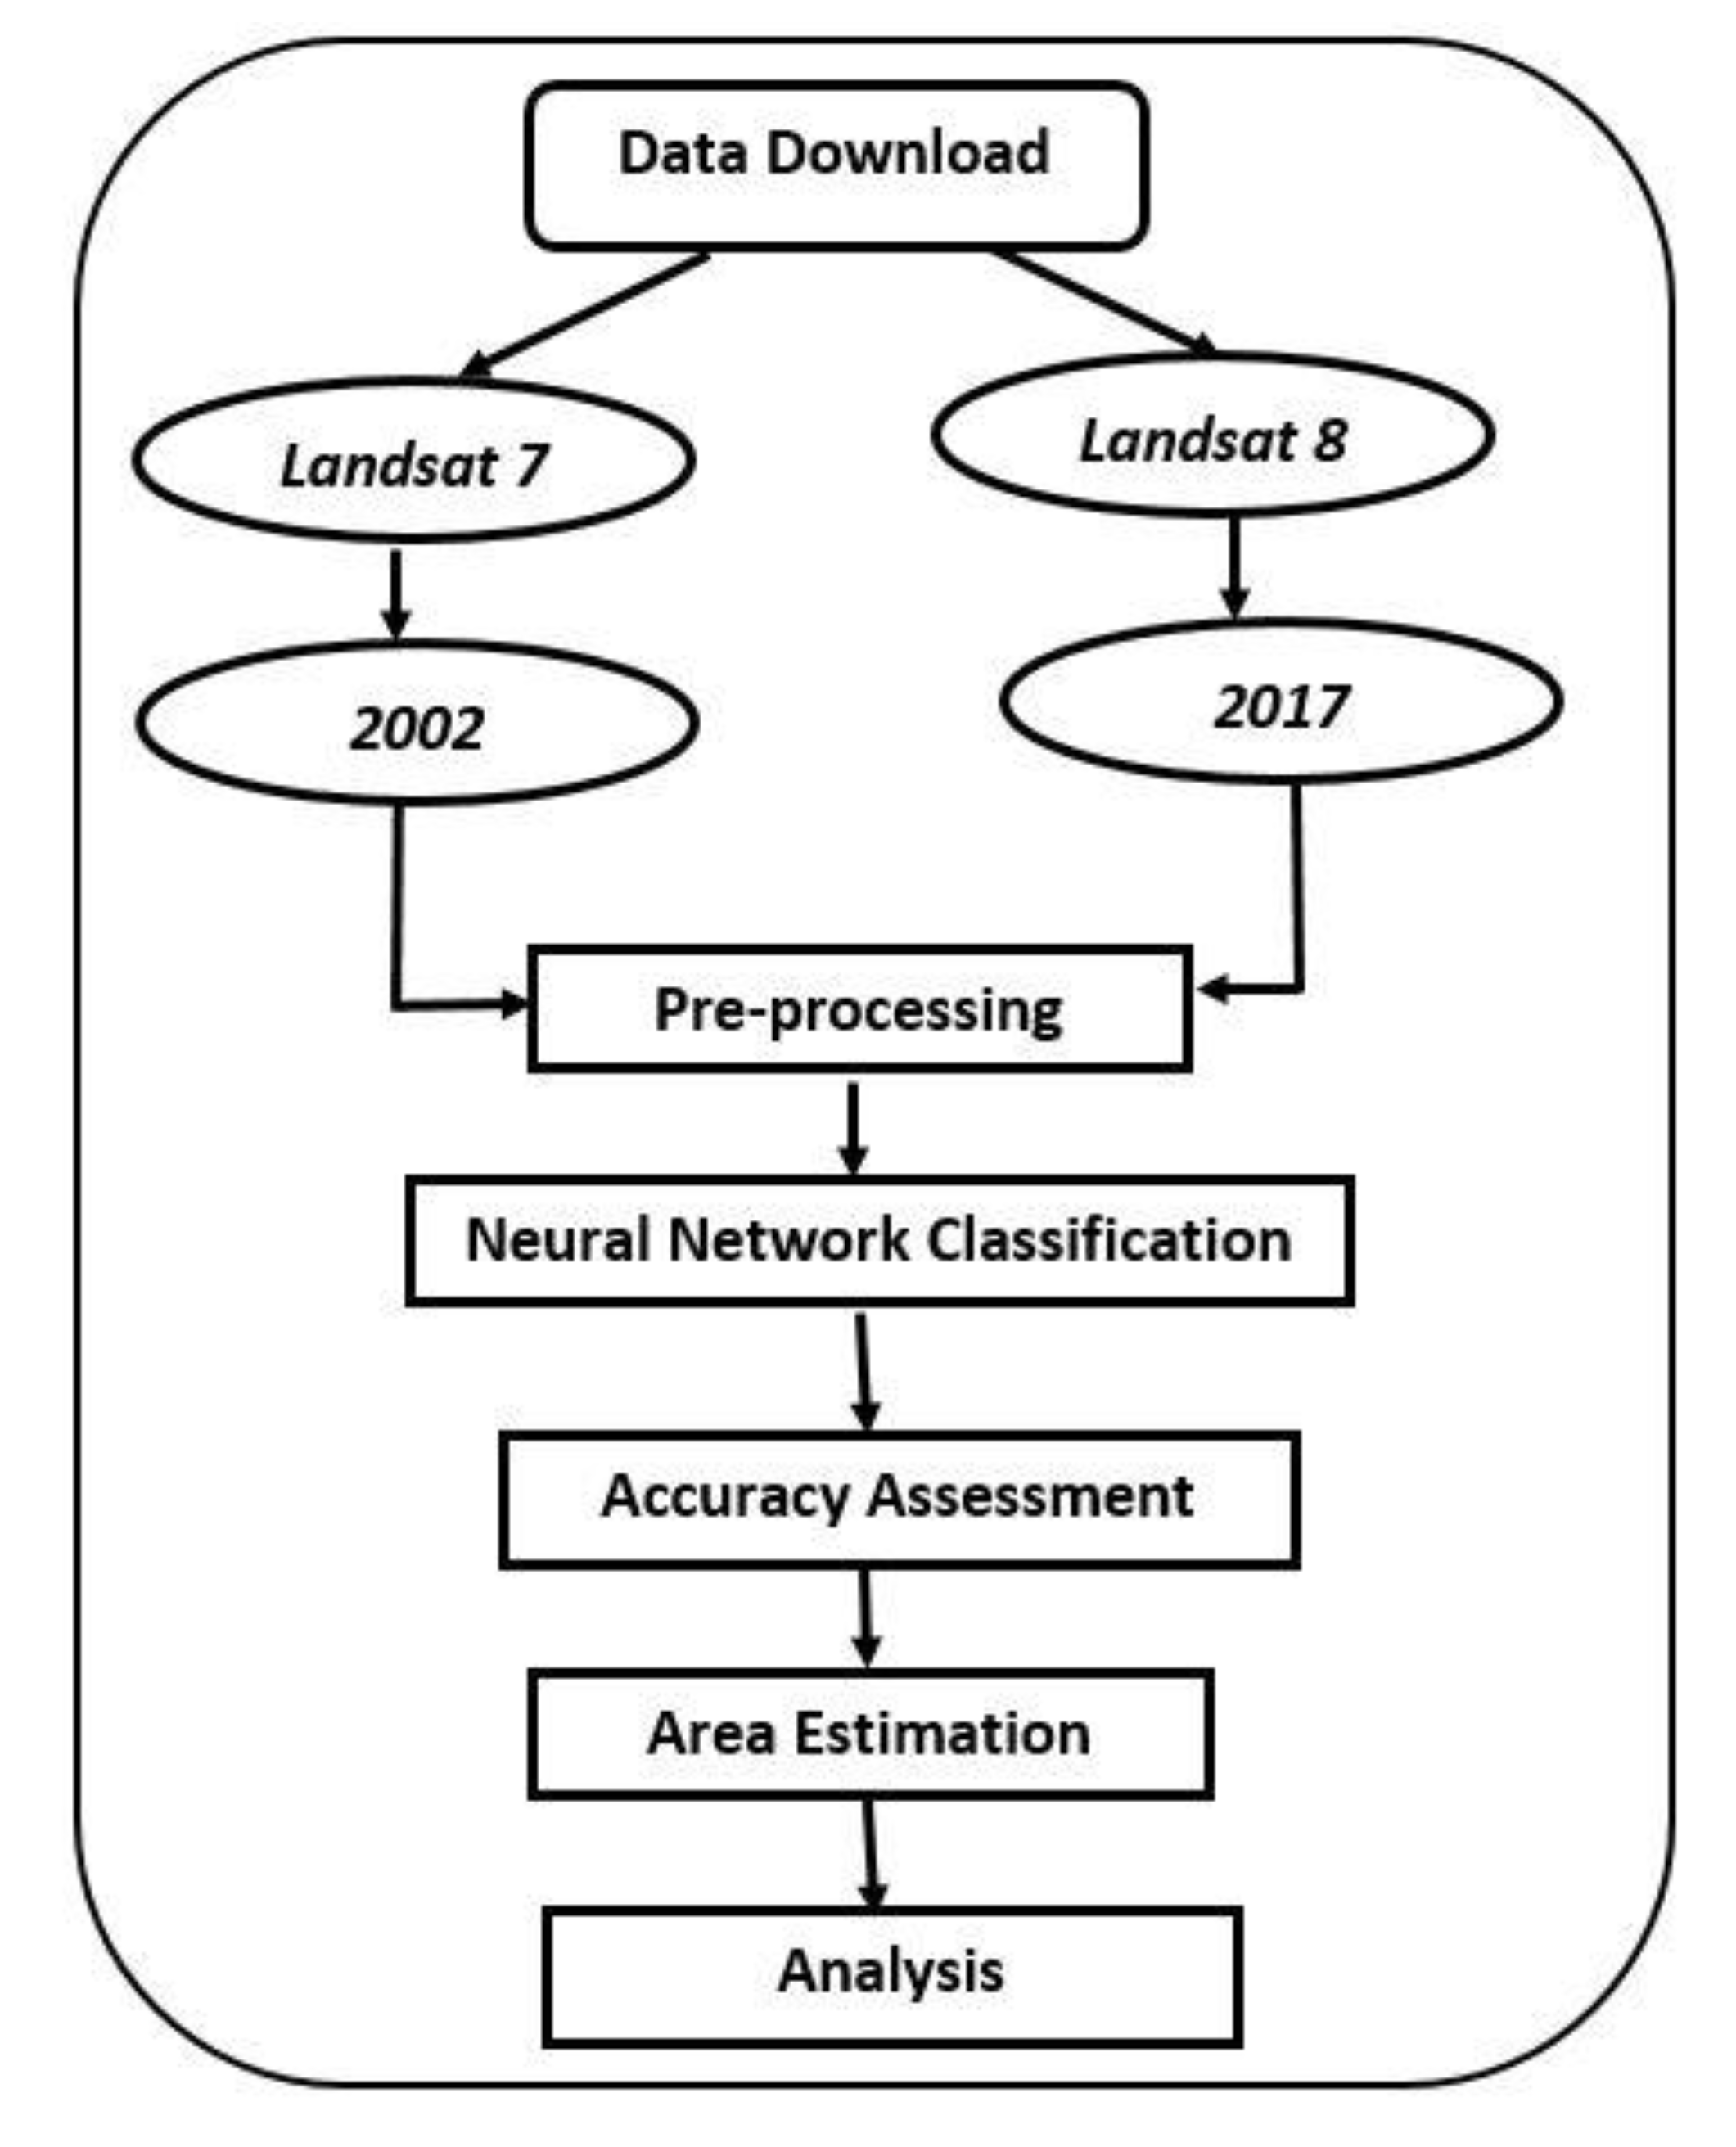
To view changes between 2002 and 2017, Landsat satellite imageries were used. Two tiles of Landsat images were downloaded for each year and were mosaicked using image processing software. The flow chart of the methodology is shown in
Figure 2. Firstly, radiometric calibration was performed by applying FLAASH settings in ENVI for four bands, i.e. blue, green, red & NIR bands. Then, dark pixel subtraction was performed to eliminate the effect of atmospheric scattering. This is an atmospheric correction method as dark objects include a substantial component of atmospheric scattering. The neural network (NN) classification tool in ENVI software was used to classify the image into five classes, namely, Aquaculture, Rivers and Ocean, Mangroves, Wetlands, and other remaining features. The NN technique uses the standard backpropagation method for classification.
More attention was given towards the ROI selection for aquaculture and river class. The classified images were used for area calculation for each class. An accuracy assessment was performed with the help of Google Earth Images.
Table 2 shows the specifications of neural network classification used in this study.
4. Results & Discussion
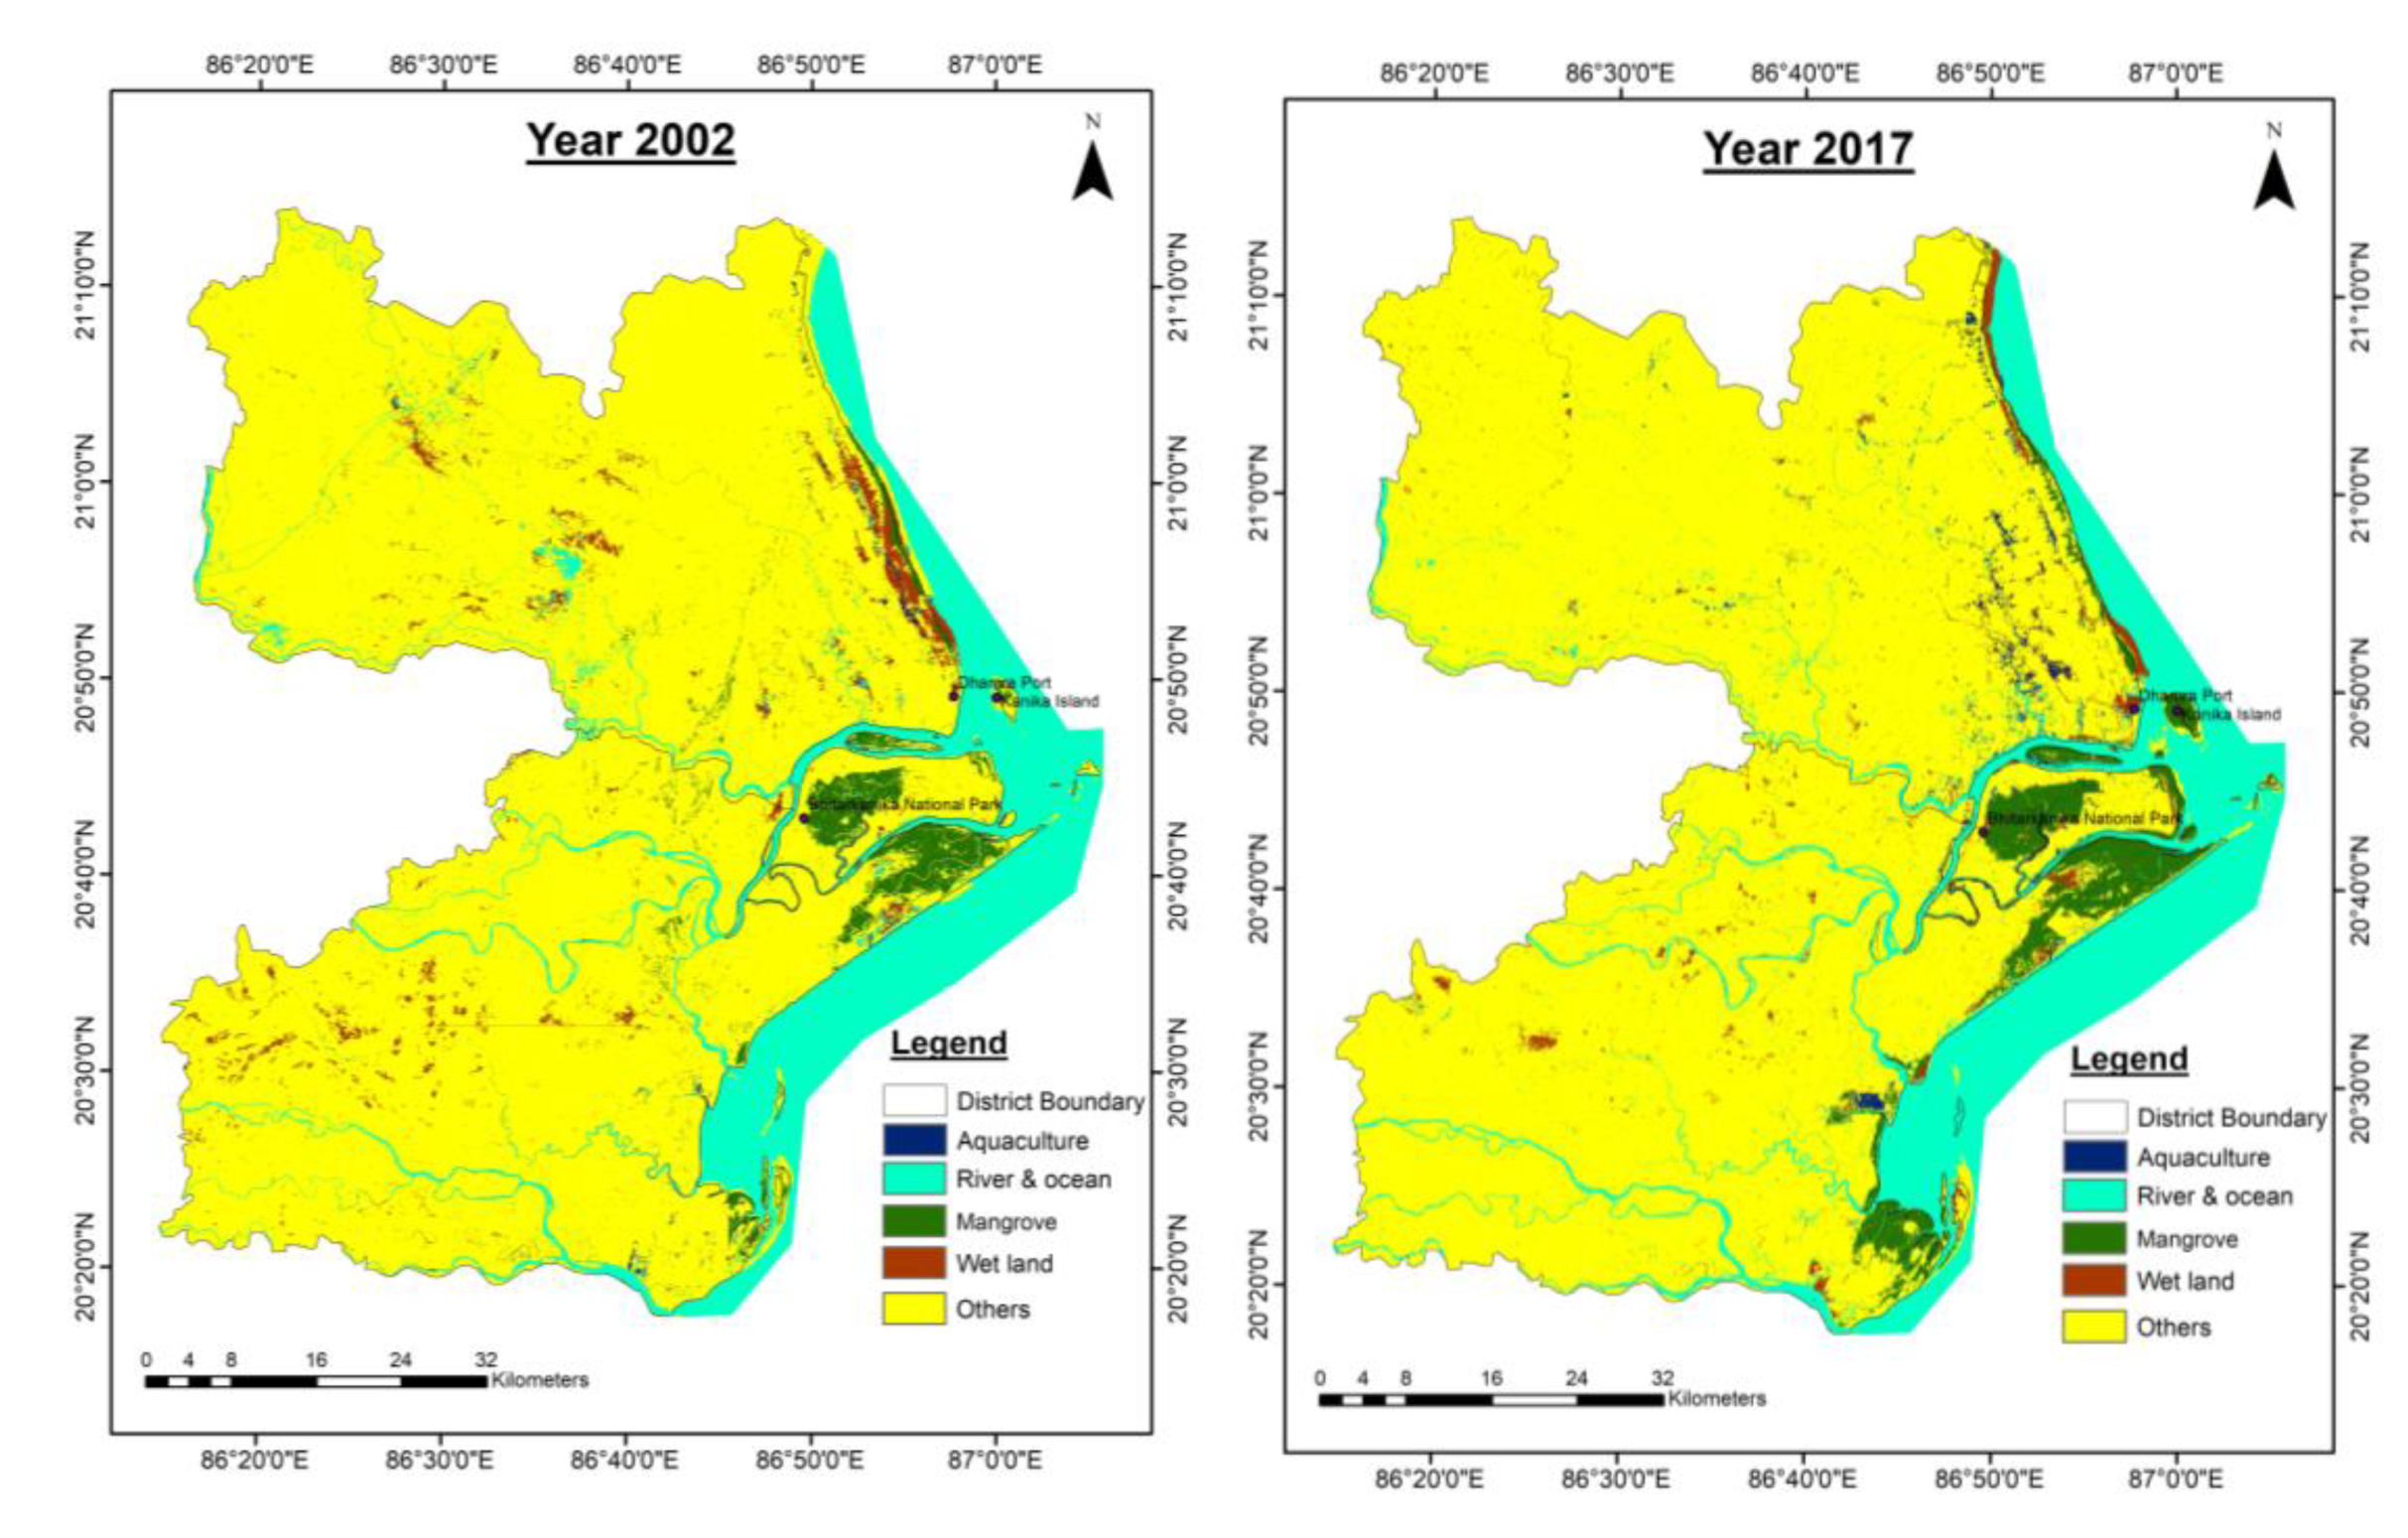
The satellite images were classified into five major classes using the NN method. The classified maps are shown for years 2002 and 2017 in
Figure 3. The results indicate that there was an increase in the mangrove area over the period 2002 to 2017. Since there was an abundance of other vegetation in 2002, the mangrove area was classified as other. Aquaculture increased from 20.76 km
2 in 2002 to 44.86 km
2 in 2017. area statistics of different land use and land cover classes in year 2002 an d 2017 were shown in
Table 3.
The area under aquaculture increased from 0.36% to 0.79% over 15 years. The increase in aquaculture was about two-fold. There was a large increase in aquaculture activities in Bhadrak district compared to Kendrapara. The accuracy and kappa value of different classes were shown in
Table 4.
The overall accuracy of classification in 2002 was 81.2%, compared with 85.2% for 2017. The accuracy of aquaculture was 77.4% in 2002, as the aquaculture class was classified as river because the signature of the water was the same for both river and aquaculture. The accuracy of aquaculture increased to 86.1% in 2017. Wide streams and ocean were accurately classified but narrow streams were classified as other. The Kappa value for the 2002 classified image was 0.75, compared with 0.81 for 2017.
5. Conclusions
The neural network (NN) classification method has been very helpful in the delineation of aquaculture. Other popular classification methods such as the nearest neighborhood and parallel piped methods do not provide sufficient accuracy due to similar reflectance features. The NN classification method has 86% accuracy with respect to aquaculture. There was a problem with narrow streams which spectral signature confused with aquaculture, and thus higher resolution satellite images may resolve these errors. The NN method takes more time for training but provides satisfactory results in the differentiation between similar-textured features when only the shape or pattern is different.
The increase in aquaculture reached two-fold, i.e., 216.08%, over the period from 2002 to 2017. Remote sensing and GIS have been very helpful in estimating the increase in aquaculture.


