Proceeding Paper

Applying High-Resolution Visible-Channel Aerial Scan of Crop Canopy to Precision Irrigation Management †

MIGAL Galilee Research Institute, Kiryat Shmona 11016, Israel
*
Author to whom correspondence should be addressed.
Presented at the 2nd International Electronic Conference on Remote Sensing, 22 March–5 April 2018; Available online: https://sciforum.net/conference/ecrs-2.
Proceedings 2018, 2(7), 335; https://doi.org/10.3390/ecrs-2-05148
Published: 22 March 2018
(This article belongs to the Proceedings of The 2nd International Electronic Conference on Remote Sensing)

Abstract

:
Canopy cover (or vegetation cover) maps serve in irrigation management mainly to determine the primary evapotranspiration (ET) coefficient, as radiation interception and evaporative surface area are directly related to canopy cover. Crop size and development with time depends on water supply; therefore, crop canopy maps are tools for the detection of the spatial uniformity of irrigation systems. Several aerial scan campaigns were deployed in the Upper Galilee of Israel in the 2017 growing season to follow up and evaluate the irrigation uniformity and crop coefficients of peanuts and cotton by RGB scans of a Phantom 4 multirotor unmanned aerial vehicle (UAV). Foliage intensity and coverage were enhanced by a green-red vegetation index (GRVI), which is a normalized difference vegetation index (NDVI)-like process where the green channel replaced the near-infrared (NIR). The results demonstrated that the GRVI is suitable for the purpose of determining the vegetation cover. Furthermore, the GRVI yielded better results than the NDVI in recognizing phenological crop changes (especially senescence). Therefore, this research proves the applicability of a low-cost digital camera mounted on an easily accessible UAV for crop cover and actual, in-field, ET coefficients determination and irrigation uniformity evaluation.

Published: 22 March 2018

1. Introduction

A lot of work has been done investigating plants’ spectral reflectance in the visible and near-infrared part of the electromagnetic spectrum at different phenological stages. Understanding the single leaf’s spectral response and the processes that occur on this level allows to apply this knowledge to the canopy level [1]. Spectral indexes allow for better information extraction from remotely sensed data because they reduce the effects of soil, view angle, and topography, while enhancing the focus on the desired extracted feature (e.g., the vegetation indexes enhance the visibility of the vegetation) [2]. Multitude of vegetation indexes (VI) were introduced in order to evaluate plant’s vigor and stress. While multiple VIs that use the ratio between the red and near-infrared (NIR) spectral wavebands (e.g., normalized difference vegetation index (NDVI), ratio vegetation index (RVI), soil adjusted vegetation index (SAVI)) [3,4,5,6] are successful in reducing atmospheric radiance and transmittance [5,7], the red wavelengths are strongly absorbed by chlorophyll and therefore are less sensitive to changes in chlorophyll content [7,8,9,10]. As the leaf area index (LAI) increases, apparent canopy chlorophyll content also increases regardless of the single-level leaf chlorophyll content, therefore these VIs are much more affected by LAI than by changes in chlorophyll at the canopy scale [7,11,12]. Since chlorophyll is vital for the photosynthesis process, changes in chlorophyll levels can be linked to photosynthetic productivity, developmental (phenological) stages, and plant stress.
On the other hand, the green wavelengths are more sensitive to high chlorophyll levels, since they are less absorbed by chlorophyll a and b, unlike the blue, red, and NIR wavelengths [7,8,9,10]. Therefore, VIs using the green wavelength are capable to detect changes in chlorophyll contents at the leaf and canopy scale and are suitable to monitor plants’ developmental stages and stress.
Gitelson et al. [13] found that the NIR reflectance band is less sensitive for determining the vegetation cover (or vegetation fraction—VF) for VF > 60% and showed that a VI using the green–red–blue wavelengths have a linear relationship to VF, with an accuracy level of up to 90%. They showed that in wheat, when VF is between 50 and 100%, the green wavelength is most sensitive to changes in the vegetation cover (while the blue, red, and NIR wavelengths are insensitive to changes in the vegetation cover).
Adamsen et al. [14] found that the green to red (G/R) spectral wavelengths ratio index is sensitive to the amount of greenness of the plant: it is less than 1 in the beginning and at the end of the growing season, and above 1 at midseason [14,15]. Kanemasu [15] concluded that the G/R ratio may serve as a benchmark for crop growth, phenological stages, and for indicating the VF.
Another VI that is based on the G/R ratio is the green-red vegetation index (GRVI) that is defined according to Equation (1):
GRVI = (ρgreen − ρred)/(ρgreen + ρred)
Motohka et al. [16] evaluated the use of the GRVI as a phenological indicator. They concluded that the GRVI index can differentiate between green vegetation (index above 0), water and snow (index around 0), and soils (index below 0). Furthermore, they demonstrated that the GRVI (unlike the NDVI) is sensitive to leaf color change (leaf greening and autumn coloring). They suggested using the threshold of GRVI = 0 as a site-specific threshold for monitoring phenological changes and the GRVI index as an indicator for plant disturbances, and comparing between different ecosystem types [16].
Current satellite-based remotely sensed products can cover large areas, but they are limited by both their temporal (revisit time) and spatial (pixel size) resolutions, when compared to unmanned aerial vehicles (UAV). One of satellite imaging’s challenges is dealing with pixels that have multiple objects with different spectral signatures (e.g., plants and soil). Such pixels are called mixed-pixels. UAV, imaging high spatial resolution, produces mixed-free pixels, therefore making vegetation detection and differentiation an easier task. Similarly, high spatial resolution allows for a precise estimation of the vegetation cover fraction.
A basic method for irrigation scheduling is factoring the potential evapotranspiration (PET), computed from measured radiation, wind speed, air temperature, and relative humidity, with a crop-specific coefficient (Kc), [17]. Crop coefficients are provided by diverse methods, such as empirical conclusions from field experiments, degree-day-based seasonal functions, experts’ recommendations, and the FAO #56 publication Kc library, or by field-specific measurements. Since the evapotranspiration (ET) driving energy received by the crop canopy is directly proportional to the light interception (LI) [18,19], and the LI is directly proportional to crop cover, Kc can be fitted to the field- and plot-specific dimension by measuring crop cover. Aerial survey-derived VFs are directly proportional to cover, [20] thus aerial photography provides an efficient method for Kc determination.
The main objectives of this study were to test the ability of an inexpensive RGB camera mounted on an inexpensive unmanned aerial vehicle (UAV) to determine vegetation cover and vigor at the canopy scale at a large-scale whole-field resolution and to investigate whether vegetation cover and vigor patterns can be utilized as indicators for irrigation water uniformity. Another objective of this study was to compare the efficiency of an RGB- based VI with that of the well-known NDVI, both in UAV-based high spatial resolution cameras and via satellite imaging.

2. Materials and Methods

2.1. UAV Imaging System

DJI Phantom 4 quadcopter UAV was used as the flying platform. The UAV is equipped with a built-in RGB camera with a 4000 × 3000 pixel 4K resolution CMOS sensor, a 20 mm (35 mm eq.) lens with field of view (FOV) of 94°, in a 3-axis stabilized gimbal. The UAV was flown using Pix4D Capture pre-programmed flightpath control. The Parrot Sequoia multispectral sensor was used in order to compare NDVI with GRVI. The Parrot Sequoia sensor consists of five downward-looking image sensors: a Visible 16 MPixel (RGB) with a definition of 4608 × 3456 pixels and four 1.2 MPixel: Green (550 nm), Red (660 nm), Red Edge (735 nm), and Near-infrared (790 nm) bands, 1280 × 960 pixels. The sensor was mounted on a DJI Mavic-Pro small-size, foldable-rotor quadcopter UAV.

2.2. Flight Campaigns

Flight campaigns were conducted in two test sites: the Gadot center pivot test site (33°2′22.91″ N, 35°38′0.43″ E) and the Havat Gadash field crops experimental farm (33°10′56.24″ N, 35°35′5.78″ E), both located in the Upper Galilee region in the northern part of Israel. The area has a Mediterranean climate, characterized by wet, mild winters, and hot, dry summers. Annual winter rainfall is in the range of 400–600 mm, while summer crops utilize 80–120 mm of winter soil water storage for the initial growth periods. The field at the Gadot center pivot test site was cultivated with cotton crop, sown on 4 April 2017. The field was irrigated at eight-day intervals beginning from 3 June. Two flight campaigns were conducted on 5 July and 24 August, when the crop had already reached full cover. The flights were conducted at midday, at 50 m altitude and pixel spatial resolution of 0.02 m. At the Havat Gadash, peanuts cv Hanoch were sown on 1 May 2017 and irrigated uniformly by an experimental lateral move, starting on 8 May (Table 1). PET was calculated according to the Penman–Montieth formula. Four differential irrigation treatments were performed: 120%, 100%, 85%, and 70% replacement of PET, starting on 19 July. Prior to this date, uniform irrigation was applied to all treatments (Table 1). The Kc (70%) treatment yielded the highest,and was selected for ground truth validation. Experimental plots were four 12 × 25 m plots, side by side in four replicates. Seven flight campaigns were conducted at midday, at 10–50 m altitude and pixel spatial resolution of 0.006–0.02 m. Crop cover did not reach full cover during the first two campaigns (25 June, 17 July).
Flight courses were created with the Pix4Dcapture software, which was also used to automatically pilot the DJI Phantom 4 UAV according to the flight path. An overlap percentage of 60% was chosen in order to ease the task of mosaicking.
In order to compare NDVI and GRVI, a flight campaign using the DJI Mavic-Pro UAV was conducted in the peanut field at the Havat Gadash experimental farm on October 10, twelve days before the end of the growing season. The Parrot Sequoia multispectral sensor was used to create the NDVI, while the RGB camera was used to create the GRVI.

2.3. Data Processing

The images collected in each flight campaign were mosaicked and georeferenced using the Pix4Dmapper software. The ArcGIS 10.5 geo-referencing tools were used for fine adjustments.
VF was calculated using ArcGIS 10.5, calculating the histogram of the GRVI products. Pixels with GRVI values greater than 0 were classified as vegetation. At the beginning of the growing season, negative values that were close to 0 were also classified as vegetation.
Sentinel-2 Level-2A atmospherically corrected images of the Gadot test site from 29 August 2017 were acquired courtesy of the Copernicus Open Access Hub. Several VI were created and compared to the UAV image from 24 August, in order to check whether it is possible to use Sentinel-2 satellite imaging (with spatial resolution of 10 m) to determine irrigation uniformity issues. The following VI were checked: NDVI [5], green normalized difference vegetation index (GNDVI) [9], and GRVI [5,16].

3. Results and Discussion

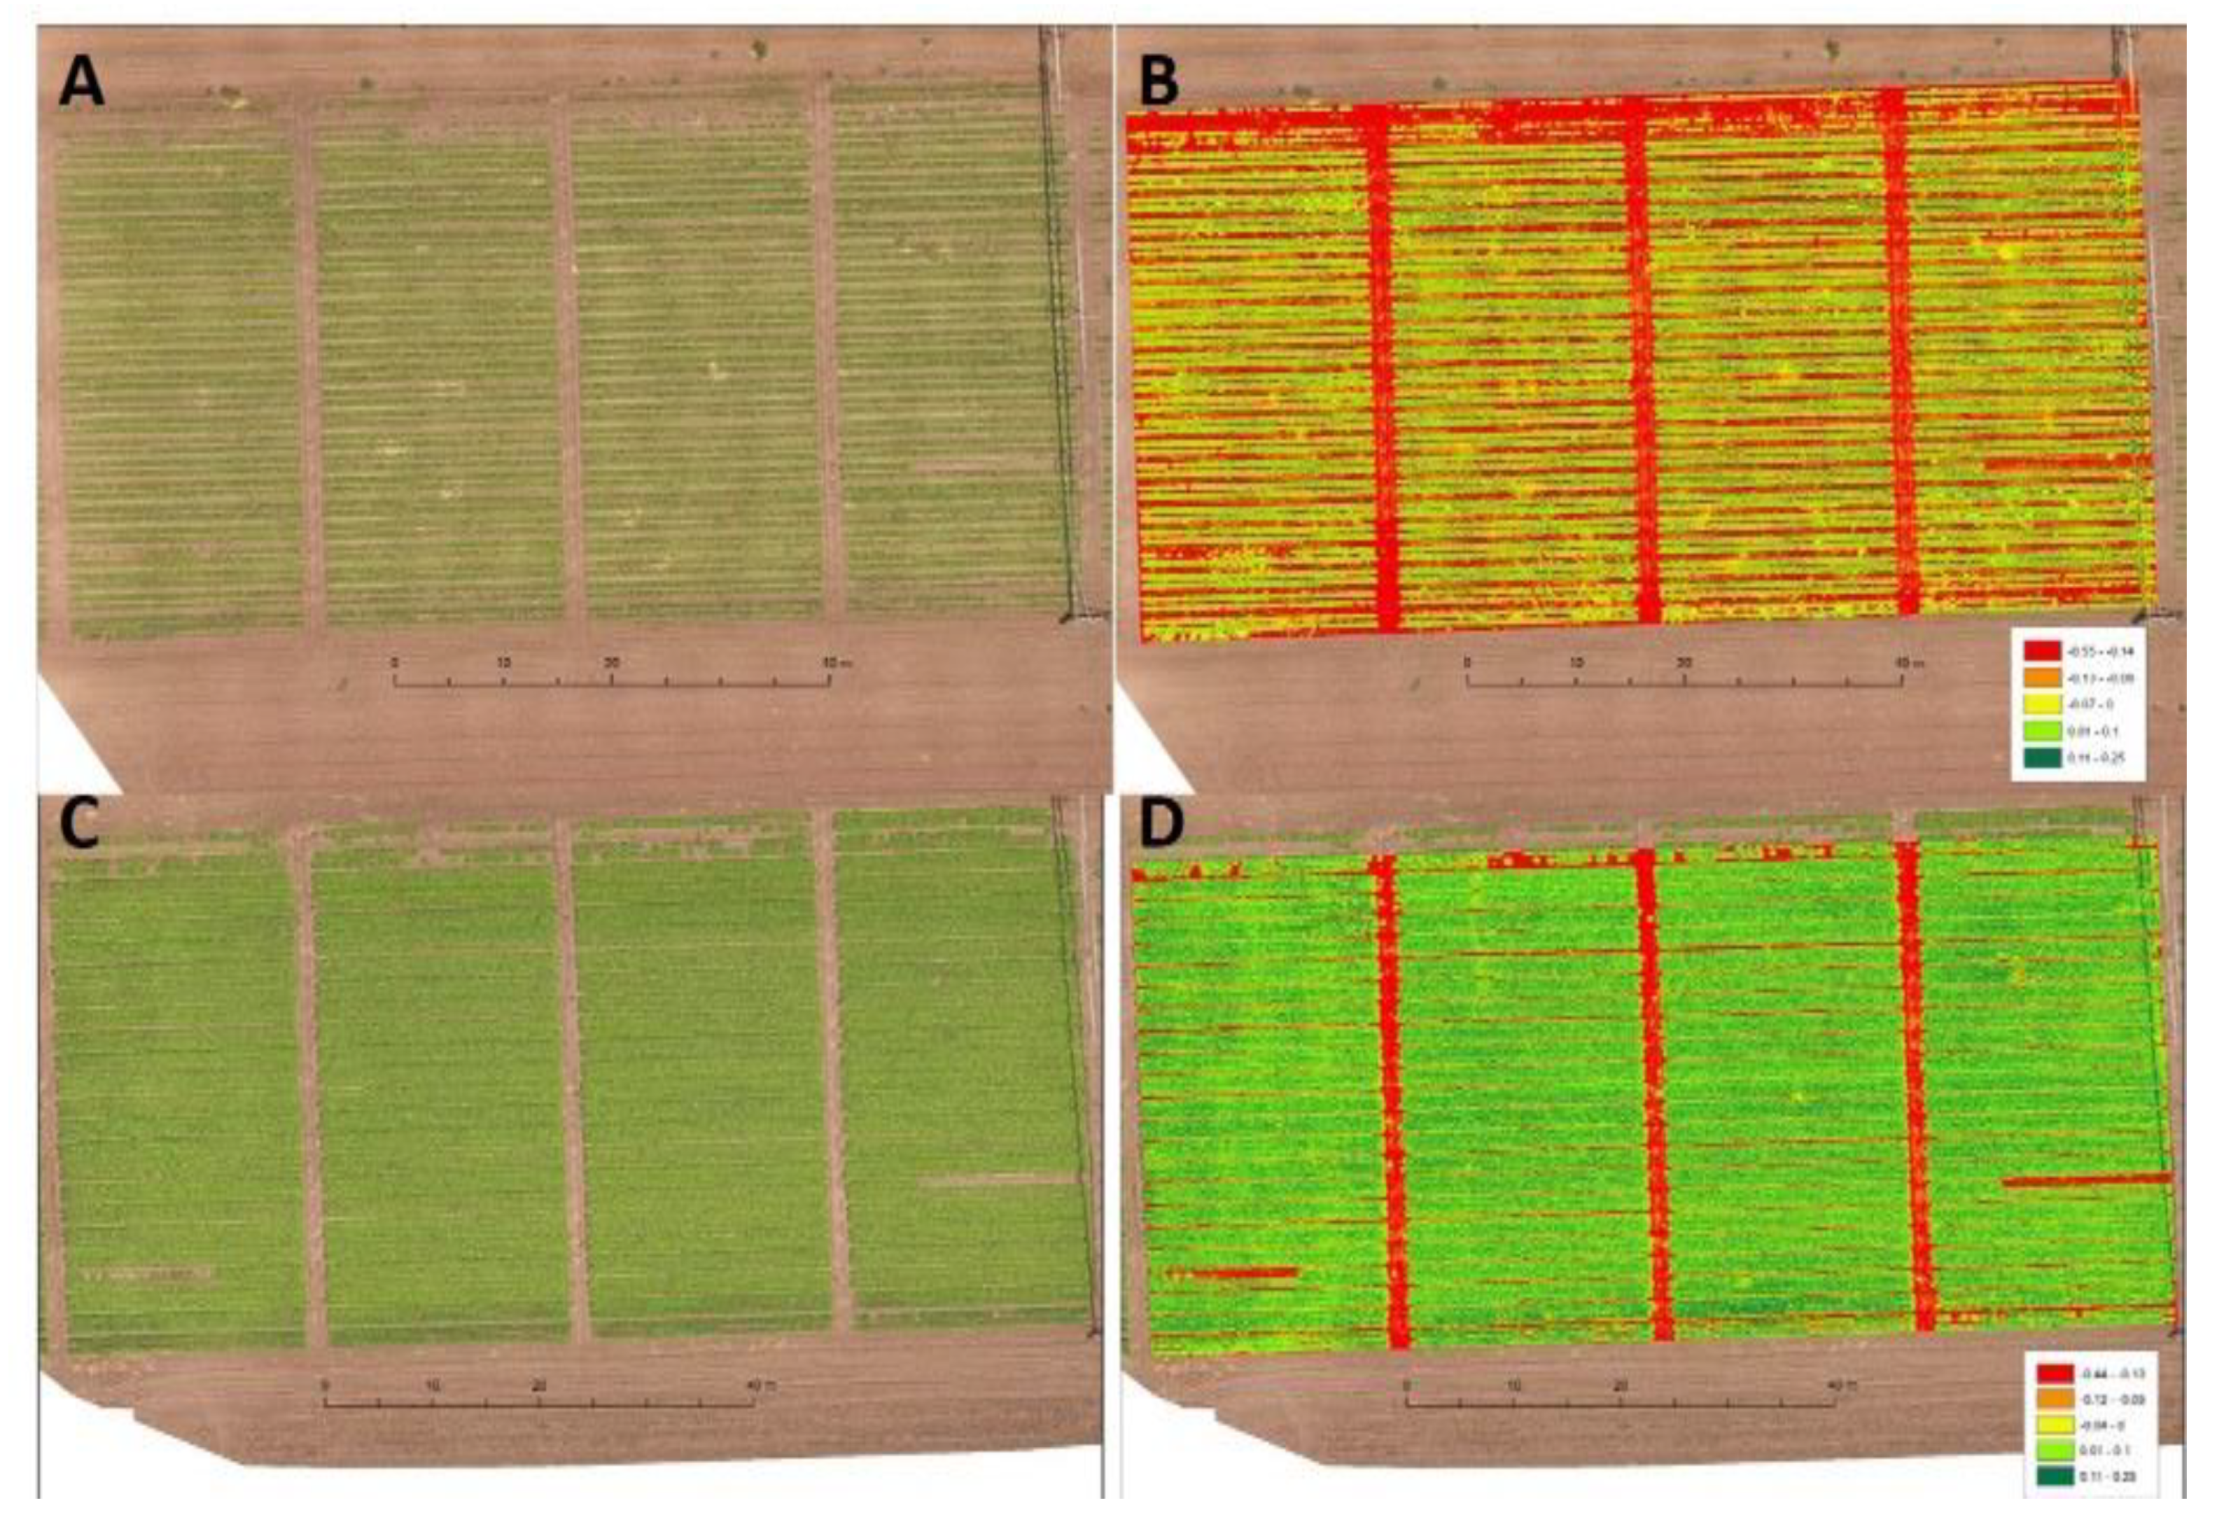
3.1. Havat Gadash Experimental Farm Campaign

The RGB images (Figure 1A,C) have high spatial resolution, allowing the differentiation of crop from soil. The GRVI images revealed crop phenological stages: most of the vegetation pixels’ GRVI values in the image taken 55 days from sowing were around zero and even slightly below zero (Figure 1B), the G/R ratio was close to one and even less than 1—indicative of the beginning of the growing season. On the other hand, most of the vegetation pixels’ GRVI values in the later image at 77 days from sowing (Figure 1D) were above zero, indicative of healthy and vital vegetation suitable to the midseason phenological stage. Therefore, the GRVI is also helpful in determining the phenological stages. The VFs determined according to the GRVI images’ histograms were 40% and 80% (Figure 1B,D respectively). The calculated Kc for the campaign dates (Table 1) were in-par with the calculated VFs, validating the VF calculations.

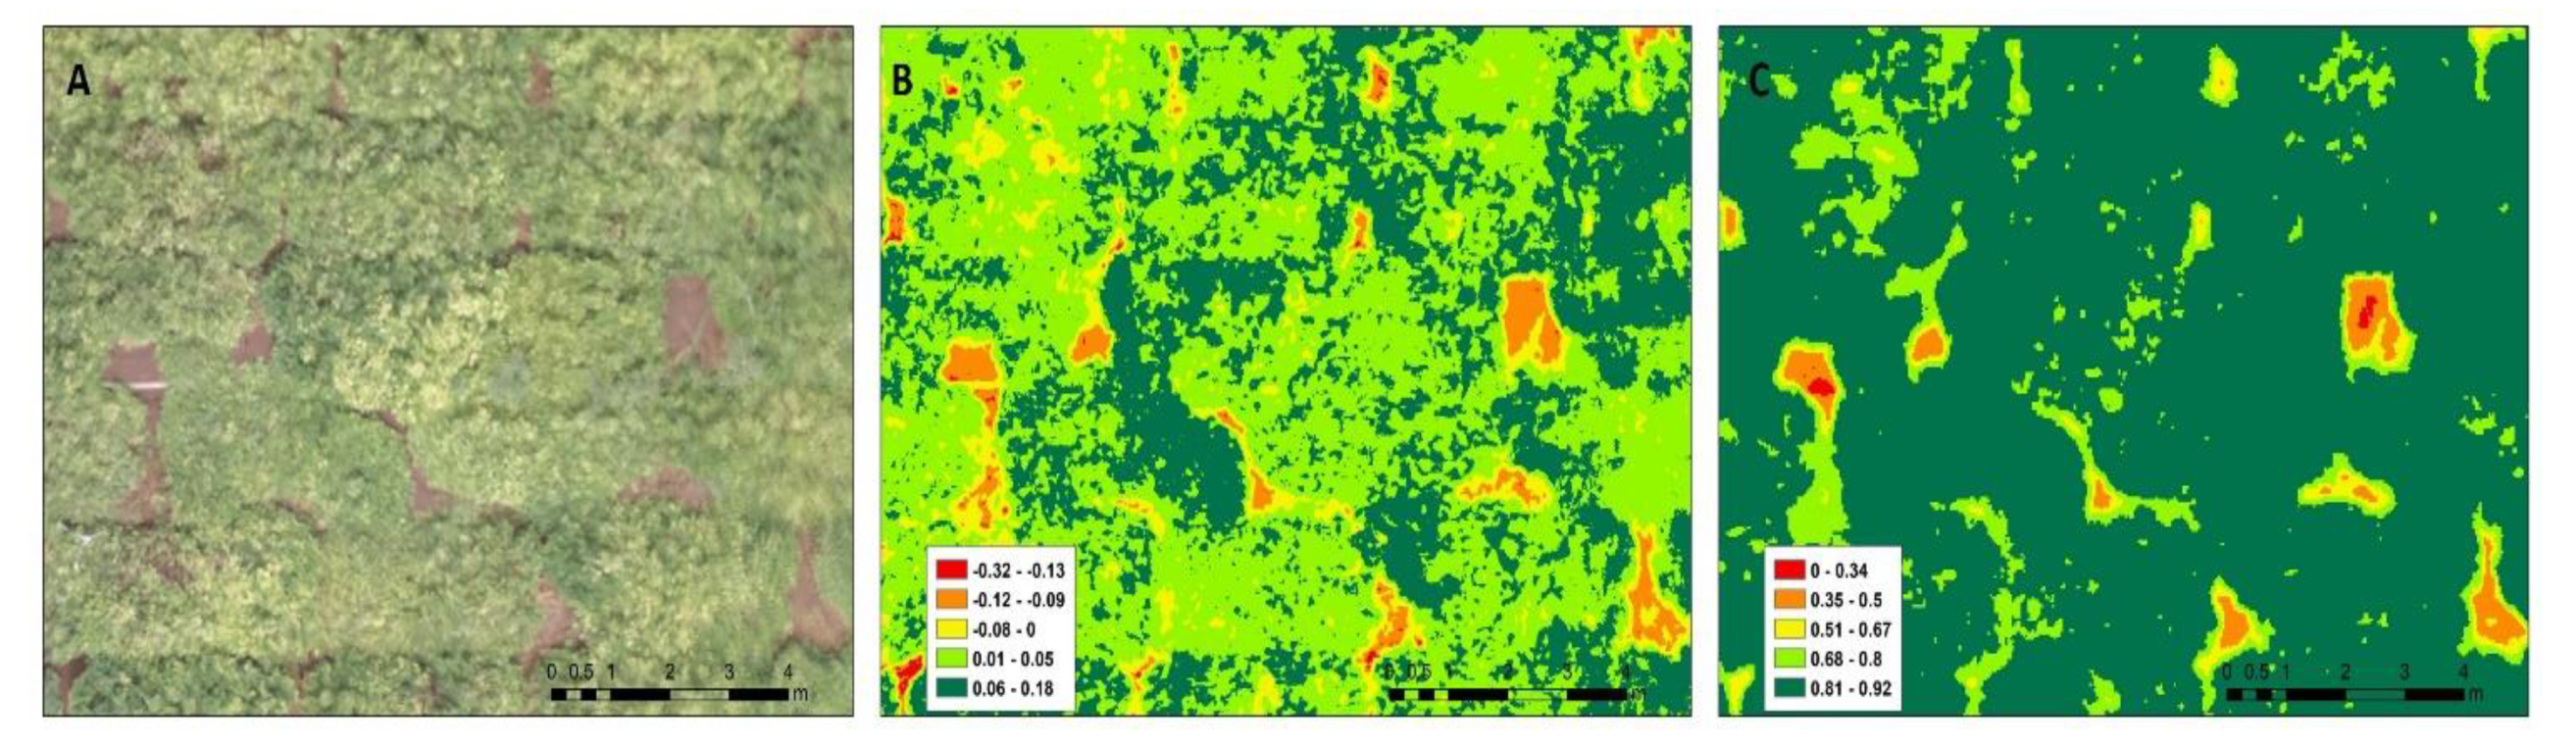
3.2. Comparison between NDVI and GRVI

Since there were two different sensors measuring the NDVI and the GRVI (Section 2.3), the spatial resolution of the NDVI was lower (pixel size of 0.0373 m) than that of the GRVI (0.0095 m), thus enabling sharper GRVI imagery. The image was taken toward the end of the season, depicting plants in different stages of senescence. As can be seen in Figure 2, the GRVI captured plant senescence better than the NDVI: changes in plant color from green to yellow are depicted more accurately in the GRVI image than in the NDVI image. Greener vegetation (depicted in the RGB image Figure 2A) has higher GRVI values (Figure 2B). On the other hand, the NDVI image (Figure 2C) did not capture the differences between plants that were visible in the RGB image (Figure 2A). The NDVI values were very high for most pixels, indicating saturation of the NDVI values, probably due to high LAI values [7,11,12]. It is probable that the differences in pixel resolution are also responsible for the accuracy differences. Regardless, for the purpose of vegetation classification and vigor analysis, the use of RGB VI is preferable to that of the NDVI, thus making the Parrot–Sequoia NIR sensor superfluous.

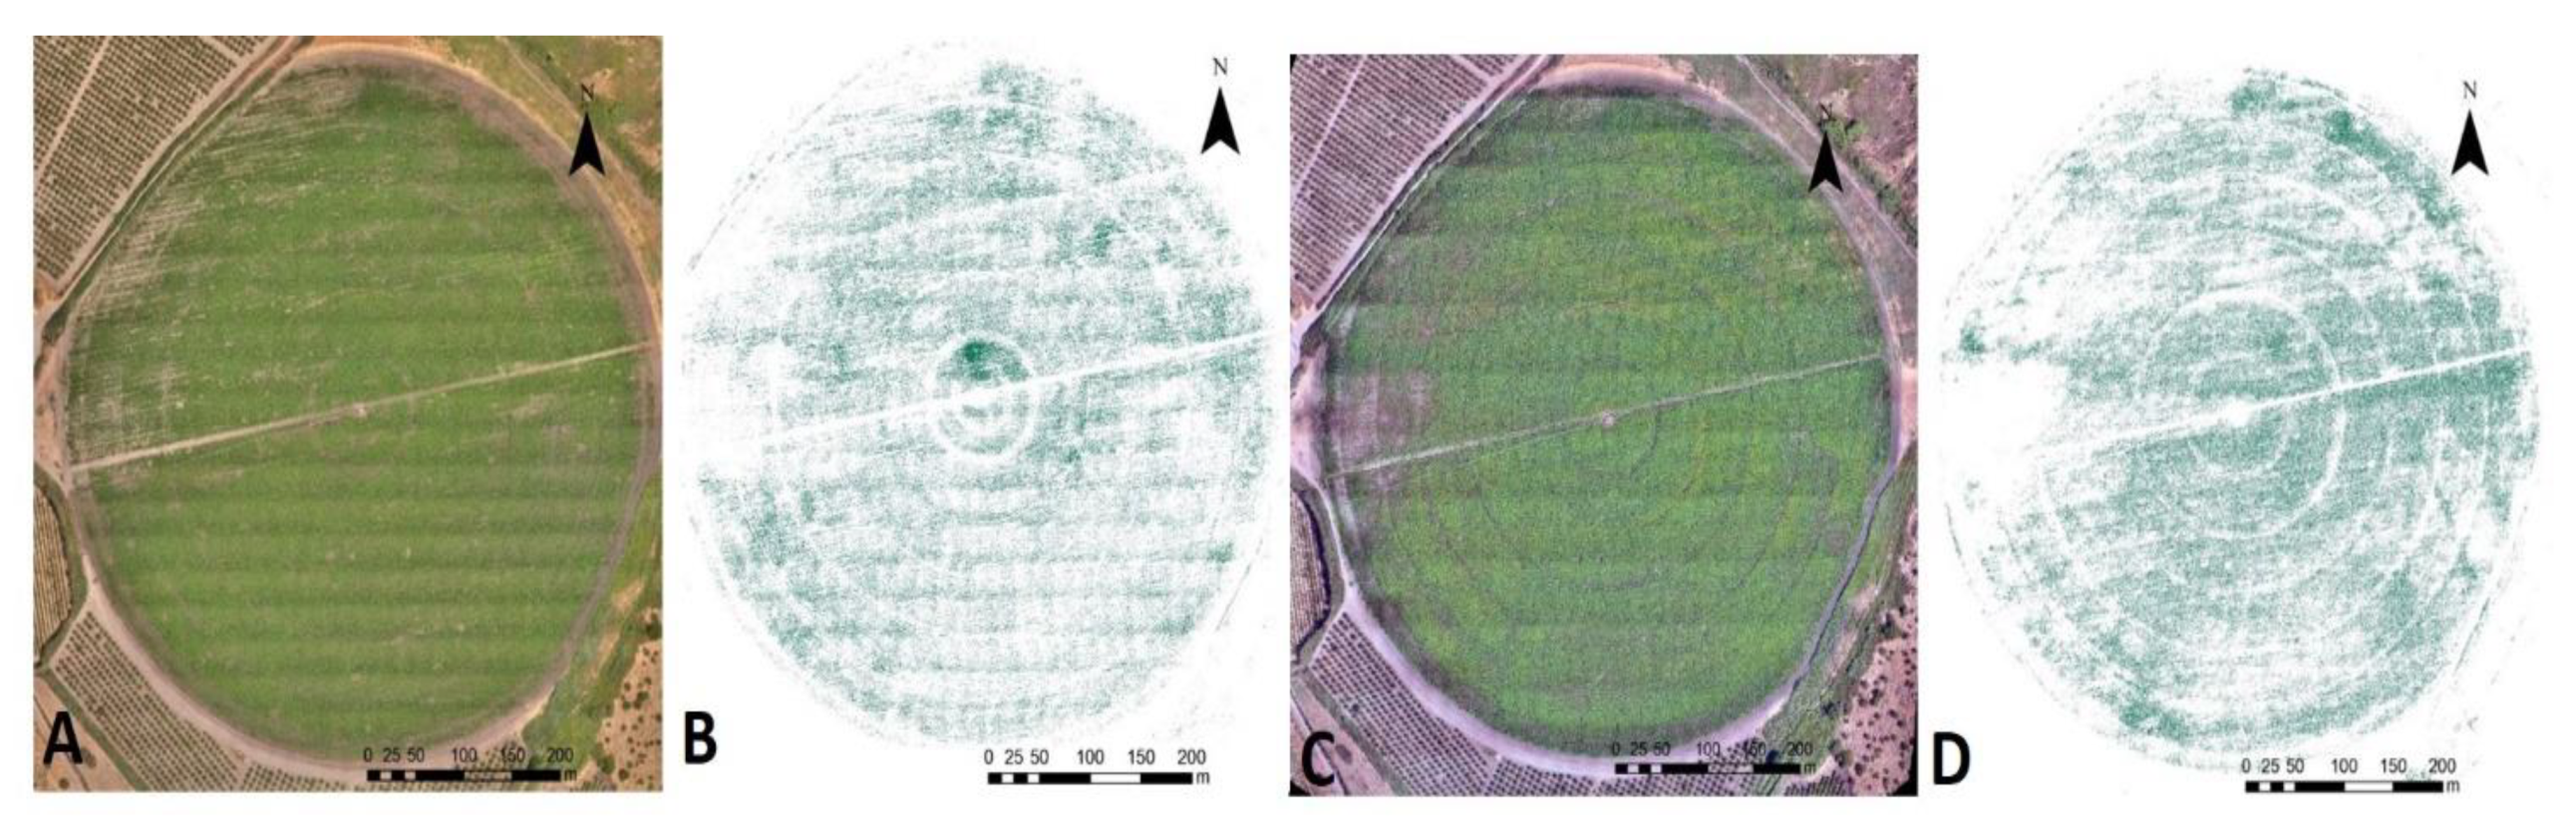
3.3. Gadot Test Site Campaign

The images of the Gadot pivot irrigated cotton crop were taken after the crop had reached full canopy cover (Figure 3A,C). A closer look at the GRVI images reveals “sector” lines, indicating differences in plant vigor (Figure 3B,D). The “sector” patterns are indicative of ununiformed irrigation, due to intermittent pivot movement: the “greener” areas probably received more irrigation, due to lower pivot speed. This could have resulted from physical obstacles, uneven ground, malfunctioning pivot control, etc. Whereas these “sectors” are noticeably visible in the GRVI image, it is impossible to notice them in the RGB image. Therefore, using the GRVI in this case is crucial in order to detect irrigation uniformity, irrigation malfunctions, and other subtle disturbances.

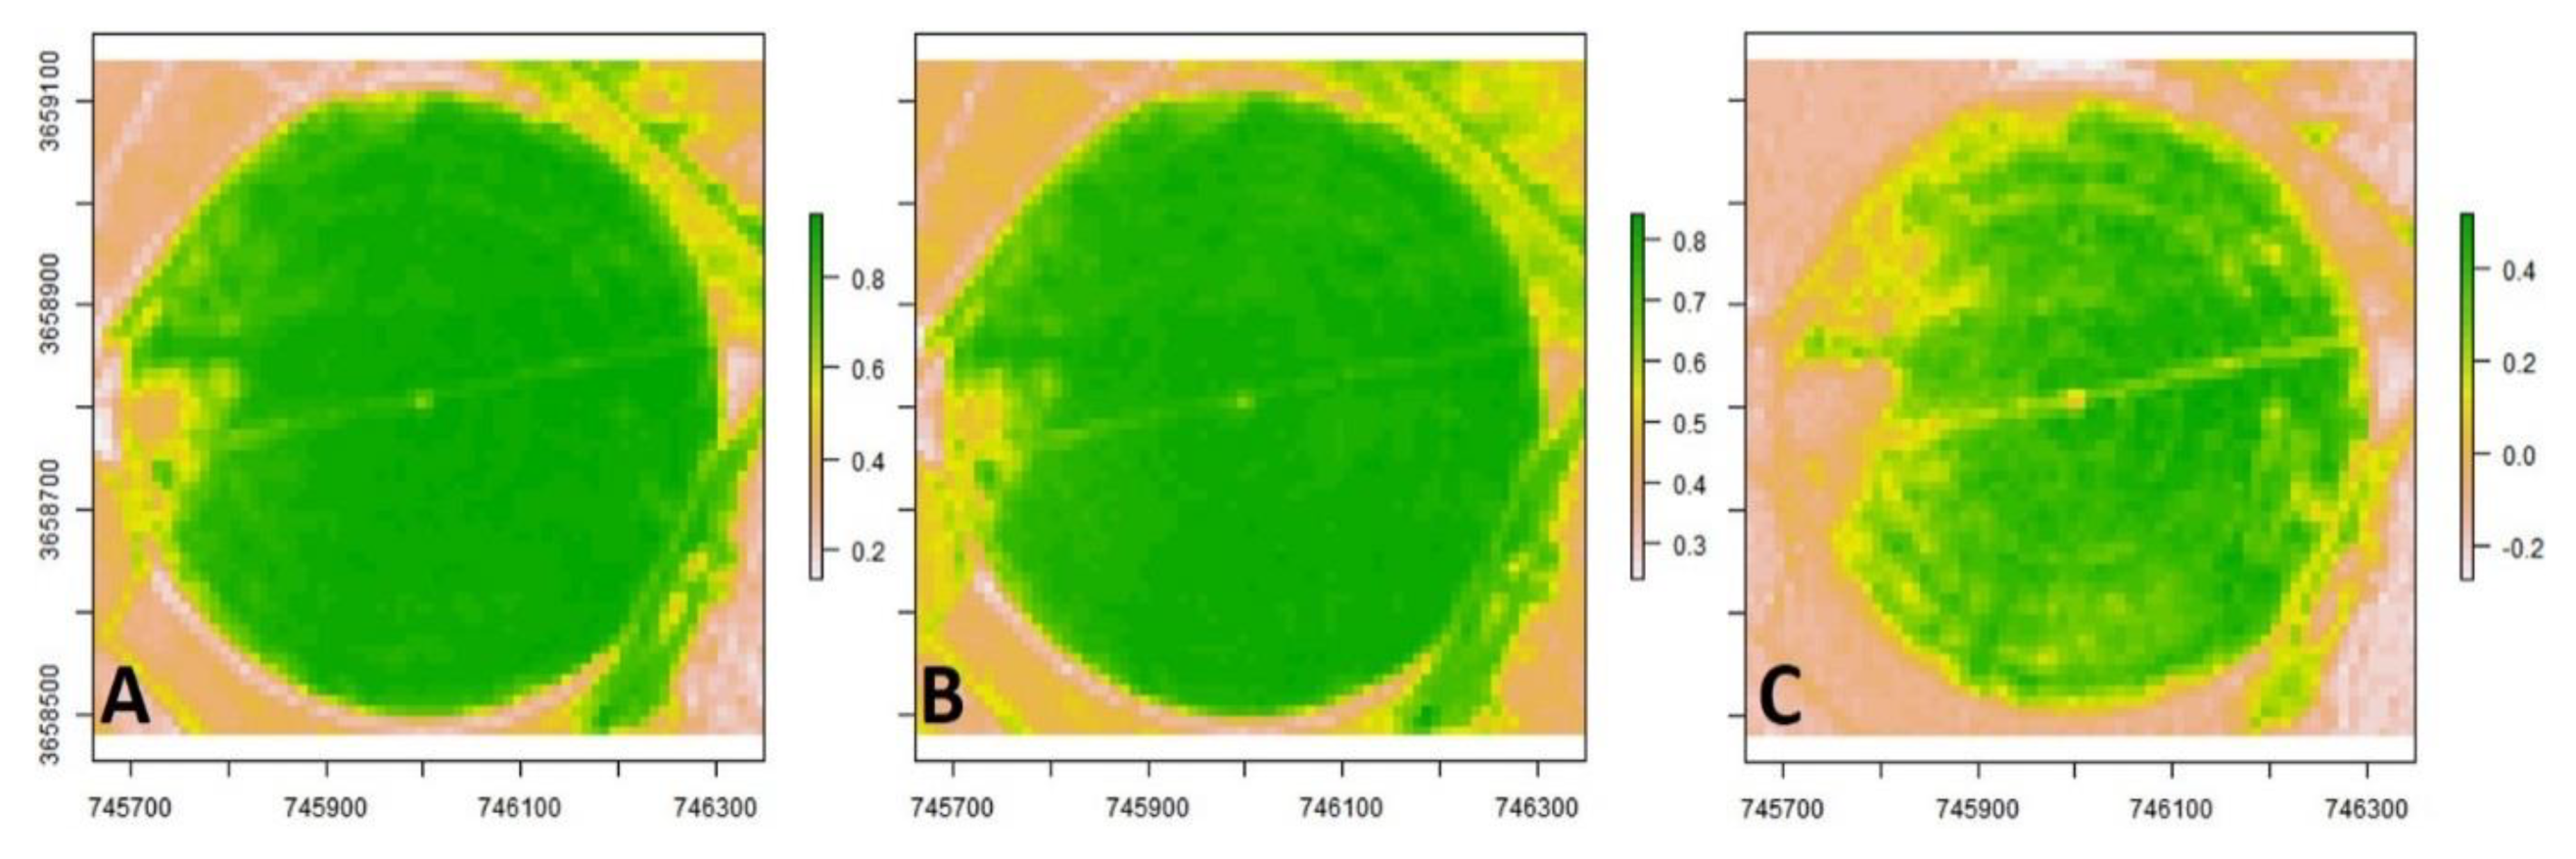
3.4. Sentinel-2 Satellite VI of the Gadot Test Site

The NDVI and GNDVI images are pretty similar, showing high values homogenously throughout the whole field, except for the middle left corner (Figure 4A,B). The GRVI image is more heterogeneous, showing patches of low values that are correlated to the UAV high-resolution GRVI image’s patches (Figure 3D and Figure 4C), indicative of the field’s heterogeneous plant vigor and ununiformed irrigation. The GRVI is therefore better at presenting the real crop vigor situation. Whereas the saturation of red reflectance at intermediate to high chlorophyll values is well known [10,15] and is typical of NDVI, it is surprising to see that the GNDVI was also saturated and did not show field’s heterogeneity.

4. Conclusions

In this study, the ability of a high-resolution RGB imaging to determine vegetation cover and vigor at the canopy scale at a large-scale whole-field resolution was evaluated, using an RGB VI, namely, the GRVI. It was concluded that the GRVI is suitable for determining vegetation cover, distinguishing between vegetation and other land covers (such as soil and dead vegetation, Figure 1). The VF can be accurately measured and used by the farmer “on the spot” in order to directly define the Kc. It was also shown that the GRVI can be used to distinguish a plant’s phenological stages. In fact, detecting early season and senescence is easy with GRVI: a GRVI lower than 0 indicates low plant’s vigor, whereas a GRVI greater than zero, indicates strong plant vigor, corresponding to the mid-season plant phenological stage (Figure 1 and Figure 2). It was also concluded that the GRVI is better than the NDVI and GNDVI in detecting subtle disturbances in mid-season (Figure 4). High-resolution RGB imaging can be utilized to monitor the uniformity of irrigation water application and to detect heterogeneity in field irrigation (Figure 3). Since both the camera and the UAV used in this research are inexpensive and available and the current auto-pilot UAV guiding technologies ease the use of UAVs, the presented tools should be available for “on-the-spot” farming decision-making processes involving precision irrigation and irrigation management.

Acknowledgments

This study was funded by a Grant from the Upper Galilee Development Corporation. Special thanks to On Rabinowitch, Min. of Agriculture field crops advisor, for his valuable assistance.

References

  1. Hatfield, J.L.; Gitelson, A.A.; Schepers, J.S.; Walthall, C.L. Application of spectral remote sensing for agronomic decisions. Agron. J. 2008, 100. [Google Scholar] [CrossRef]
  2. Hunt, E.R.; Doraiswamy, P.C.; McMurtrey, J.E.; Daughtry, C.S.T.; Perry, E.M.; Akhmedov, B. A visible band index for remote sensing leaf chlorophyll content at the Canopy scale. Int. J. Appl. Earth Obs. Geoinf. 2012, 21, 103–112. [Google Scholar] [CrossRef]
  3. Jordan, C.F. Derivation of Leaf-Area Index from Quality of Light on the Forest Floor. Ecology 1969, 50, 663–666. [Google Scholar] [CrossRef]
  4. Rouse, J.W.; Hass, R.H.; Schell, J.A.; Deering, D.W. Monitoring vegetation systems in the great plains with ERTS. Third Earth Resour. Technol. Satell. (ERTS) Symp. 1973, 1, 309–317. [Google Scholar]
  5. Tucker, C.J. Red and photographic infrared linear combinations for monitoring vegetation. Remote Sens. Environ. 1979, 8, 127–150. [Google Scholar] [CrossRef]
  6. Huete, A.R. A soil-adjusted vegetation index (SAVI). Remote Sens. Environ. 1988, 25, 295–309. [Google Scholar] [CrossRef]
  7. Hunt, E.R.; Daughtry, C.S.T.; Eitel, J.U.H.; Long, D.S. Remote sensing leaf chlorophyll content using a visible band index. Agron. J. 2011, 103, 1090–1099. [Google Scholar] [CrossRef]
  8. Yoder, B.J.; Waring, R.H. The normalized difference vegetation index of small Douglas-fir canopies with varying chlorophyll concentrations. Remote Sens. Environ. 1994, 49, 81–91. [Google Scholar] [CrossRef]
  9. Gitelson, A.A.; Kaufman, Y.J.; Merzlyak, M.N. Use of a green channel in remote sensing of global vegetation from EOS-MODIS. Remote Sens. Environ. 1996, 58, 289–298. [Google Scholar] [CrossRef]
  10. Gitelson, A.A.; Viña, A.; Ciganda, V.; Rundquist, D.C.; Arkebauer, T.J. Remote estimation of canopy chlorophyll content in crops. Geophys. Res. Lett. 2005, 32, 1–4. [Google Scholar] [CrossRef]
  11. Daughtry, C.S.T.; Walthall, C.L.; Kim, M.S.; De Colstoun, E.B.; McMurtrey Iii, J.E. Estimating Corn Leaf Chlorophyll Concentration from Leaf and Canopy Reflectance. Remote Sens. Environ. 2000, 74, 229–239. [Google Scholar] [CrossRef]
  12. Eitel, J.U.H.; Long, D.S.; Gessler, P.E.; Hunt, E.R.; Brown, D.J. Sensitivity of Ground-Based Remote Sensing Estimates of Wheat Chlorophyll Content to Variation in Soil Reflectance. Soil Sci. Soc. Am. J. 2009, 73, 1715–1723. [Google Scholar] [CrossRef]
  13. Gitelson, A.A.; Kaufman, Y.J.; Stark, R.; Rundquist, D. Novel algorithms for remote estimation of vegetation fraction. Remote Sens.Environ. 2002, 80, 76–87. [Google Scholar] [CrossRef]
  14. Adamsen, F.J.; Pinter, P.J.; Barnes, E.M.; LaMorte, R.L.; Wall, G.W.; Leavitt, S.W.; Kimball, B.A. Measuring wheat senescence with a digital camera. Crop. Sci. 1999, 39, 719–724. [Google Scholar] [CrossRef]
  15. Kanemasu, E.T. Seasonal canopy reflectance patterns of wheat, sorghum, and soybean. Remote Sens. Environ. 1974, 3, 43–47. [Google Scholar] [CrossRef]
  16. Motohka, T.; Nasahara, K.N.; Oguma, H.; Tsuchida, S. Applicability of Green-Red Vegetation Index for remote sensing of vegetation phenology. Remote Sens. 2010, 2, 2369–2387. [Google Scholar] [CrossRef]
  17. Allen, R.G.; Pereira, L.S.; Raes, D.; Smith, M. Crop Evapotranspiration (Guidelines for Computing Crop Water Requirements), FAO Irrigation and Drainage Paper No. 56; FAO: Rome, Italy, 1998; Volume 290. [Google Scholar] [CrossRef]
  18. Johnson, R.S.; Ayars, J.; Trout, T.; Mead, R.; Phene, C. Crop coefficients for mature peach trees are well correlated with midday canopy light interception. Acta Hortic. 2000, 537, 455–460. [Google Scholar] [CrossRef]
  19. Green, S.; McNaughton, K.; Wünsche, J.N.; Clothier, B. Modeling Light Interception and Transpiration of Apple Tree Canopies. Agron. J. 2003, 95, 1380. [Google Scholar] [CrossRef]
  20. Meron, M.; Tsipris, J.; Hetsroni, A.; Cohen, S. Aerial photography and ground based equipment to evaluate crop cover for tree specific irrigation scheduling. In In Proceedings of the 8th International Conference on Precision Agriculture, Minneapolis, MN, USA, D., Ed., 23–26 July 2006; Mulla. [Google Scholar]
Figure 1. RGB (A + C) and green-red vegetation index (GRVI) (B + D) images of the peanut field in Havat Gadash experimental farm on 25 June (A + B, 55 days from sowing) and on 17 July (C + D, 77 days from sowing).
Proceedings 02 00335 g001
Figure 2. RGB (A); GRVI (B) and normalized difference vegetation index (NDVI) (C) zoom-in images of the peanut field at Havat Gadash experimental farm.
Proceedings 02 00335 g002
Figure 3. RGB (A + C) and GRVI (B + D) images of the cotton field in Gadot test site on 5 July (A + B) and on 24 August (C + D).
Proceedings 02 00335 g003
Figure 4. NDVI (A); green normalized difference vegetation index (GNDVI) (B); and GRVI (C) vegetation indexes based on a Sentinel-2 imagery of the cotton field in Gadot test site from 29/08/2017.
Proceedings 02 00335 g004
Table 1. Cumulative evapotranspiration (ET), irrigation water applied, and crop-specific coefficients (Kc) in the peanut irrigation experiment, Havat Gadash 2017.
DateCumulative ET (mm) *Irrigation (mm)Cumulative Irrigation (mm) *Kc **
Uniform irrigation04/06/201717040400.23
13/06/201723040800.35
29/06/2017342451250.37
06/07/2017389451700.44
12/07/2017432452150.50
0.7 Kc Irrigation19/07/20174337370.86
27/07/20179637740.77
03/08/2017143371110.78
10/08/2017186371480.80
19/08/2017240371850.77
30/08/2017308372220.72
10/09/2017369372590.70
24/09/2017434402990.69
* Cumulative amounts recalculated for the two experimental stages; ** Kc calculated as cumulative irrigation divided by cumulative ET.
Publisher’s Note: MDPI stays neutral with regard to jurisdictional claims in published maps and institutional affiliations.

