1. Introduction
As part of the plethora of technologies exploited in remote sensing, hyperspectral imaging (HSI) sensors provide information on hundreds of distinct and contiguous channels of the electromagnetic spectrum, thus enabling the identification of multiple ground objects through their detailed spectral profiles. However, restrictions on the spatial resolution of HSI data, the multiple scattering of the incident light between objects, and microscopic material mixing together form the mixed pixel problem. Pixels are identified as mixed when they are composed of the spectral signatures of more than one ground object. Therefore, we adopted the linear and non-linear spectral mixing techniques [
1,
2], which model the pixel spectra as a combination of pure components (endmembers) weighted by the fractions (abundances) that contribute to the total reflectance of the mixed pixel. Ideally, each selected endmember from the HSI under study has the maximum possible abundance of a single physical material present and minimum abundance for the rest of the physical materials. Spectral unmixing (SU) consists of two main substages: (a) endmember extraction; and (b) abundance estimation [
3]. In addition, certain signal transformations are adopted prior to the performance of SU [
4,
5]. The determination of the number of endmembers is critical, since underestimation may result in a poor representation of the mixed HSI pixels, whereas overestimation may result in an overly segregated area. Clearly, the ultimate success of unmixing depends heavily on the appropriate selection of the endmembers. In addition, since only a small number of the available materials’ spectra are expected to be present in a single pixel, the abundance vectors are often sparse in non-zero entries.
In mineralogy, the identification of the mineral constituents of major rock types is typically approached using unmixing methods [
1]. The Sicilian volcano, Mt. Etna, is an intriguingly diverse case study, since it is one of the most active stratovolcanoes globally. Its intense volcanic activity [
6], geomorphological complexity [
7] and well-documented flank eruptions [
8] perplex the remote sensing monitoring of the bulk volcanic edifice. Various spectroscopy studies [
9,
10] over the volcanic area have examined the mineralogical composition of the extensive lava fields. Nontheless, there are no findings concerning Etna’s lava flow (LF) delineation through unmixing, which further intensifies the need for multitemporal analysis of the volcano.
In this paper, we focus on the accurate estimation of fractional abundances of the deposited volcanic products on older lava fields. For this purpose, a NASA Hyperion, on board the Earth Observing Mission 1, HSI image of Etna was selected and for the sub-pixel analysis we proposed
four signal transformations that can be assimilated in linear least squares unmixing (LLSU). Our approach was narrowed to the part including Etnian historical eruptions on the sensor’s field of view, namely between 1536–1669 AD, where deposited products present lower correlation coefficients than those of younger lava flows. The latest geological map of Etna was used as the ground truth [
7]. The resulting abundances from each method were quantitatively evaluated via the structural similarity index (SSIM) [
11] and, finally, a comparative analysis of the selected methods was carried out.
2. Study Area and Methodology
In this section, we define the key characteristics of Etna’s morphology and describe the implemented methods for the linear and bilinear unmixing of the historic lava fields.
2.1. Study Area
Mt. Etna is a large basaltic complex stratovolcano with a broad base diameter of 1.178 Km
2. Its volcanism started approximately 500 ka ago, from a submarine fissure of the Gela–Catania basin. It is characterized by two major components: (i) the central
summit craters, and (ii) the
flank eruptions. Summit events are consistent for many years, while flank eruptions occur every few years and are correlated with tectonic faults and shallow seismic activity [
12]. Etna has the ability to change its land field rapidly, vigorously and continuously. It is capable of producing both brief paroxysmal episodes and long-standing, relatively milder eruptions. During the last 100 years Mt. Etna has produced on average 10
7 m
3 of new lava per year [
8], both from its summit craters and from its flank areas. The youngest active bulks of Etna are
Ellitico and
Mongibello. We focus our research on the persistent activity of the Mongibello volcano, which entails the major volcanic formation of Torre del Filosofo. It contains voluminous products younger than 122 BC, with continuous temporal succession and similar lithologies. The formation is divided into
three sub-formations formed in different time periods [
7]:
Mongibello Filosofo 1 (MF1): The first sub-formation with volcanic products from 122 BC–1669 AD. The effusive products originate from intense summit activity and are combined with intermediate flank eruptions. As expected, MF1 products follow the mountain morphology and spread radially from the main volcanic volume.
Mongibello Filosofo 2 (MF2): Includes the time interval of the post-1669 AD eruption period to the pre-1971 AD eruption period.
Mongibello Filosofo 3 (MF3): Contains the most recent and well-documented summit/flank eruptions and flows eastward to the Valle del Bove depression .
MF1 is ideal for testing unmixing processes, since it contains mostly altered lavas with high reflectance. The respective lava fields are distinct, voluminous and often do not mingle with younger lavas. Considering the Hyperion’s limited swath range and spatial resolution over Etna, lava fields from 1536–1669 AD are contained in the data cube.
2.2. Data
The Hyperion HSI dataset was acquired on 9 July 2007, with low cloud coverage and a ±5° looking angle to avoid geometrical distortions. The retrieved Level 1T product was radiometrically and geometrically corrected, and also used for spectroscopy studies of Etna [
13]. Extensive pre-processing was applied in order to obtain the optimum ground reflectance dataset and ultimately 140 spectral bands were retained, with central wavelengths at 477.7–884.7 nm, 973–1336.2 nm, 1477.4–1790.2 nm and 2062.5–2355.2 nm. Preprocessing included: (i) atmospheric correction; (ii) dimensionality and noise reduction via minimum noise fraction analysis; (iii) vegetation masking using the Normalized Difference Vegetation Index (NDVI ) values; (iv) active area segregation: Valle del Bove intense current eruptive activity was masked from the initial image; and lastly (v) formation masking: digitization of the MF1 formation within the sensor’s FOV, using the formation’s boundaries as depicted in the geological map.
2.3. Endmember Extraction
Endmembers were retrieved through regions of interest (ROIs) that were strictly constrained within denser lava deposition fields and close to the eruption vents. Borderline regions with potential vegetation growth were excluded and ROIs with limited pixels were merged. In addition, spectral profile examination ensured minimum variability within a certain ROI. Since the broader region of the volcano contains small urban and semi-urban areas, ROIs were also selected for these classes. We extracted ROI pixel values manually and retained the spectral information within 25–75% of the normal distribution of the reflectance values per ROI and per spectral band. Therefore, outliers and non-characteristic signatures were omitted. We then calculated the mean value per band for the total number of pixels, thus defining the associated endmember vector. We retrieved, in total, 13 endmembers corresponding to eight LFs (1536, 1537, 1566, 1610, 1614–24 , 1634–36, 1646–47 & 1669 AD), two scoria cones (1610 & 1646–47 AD) and three artificial materials (industrial, semi-urban and tile rooftop areas).
2.4. Methods and Adopted Transformations
In this section, we will describe in detail the adopted signal transformations and unmixing models implemented for the LF segregation. The implicit fractional abundances were very often constrained to be non-negative (NNC) and to sum-to-one (STOC) [
14].
2.4.1. Method 1: Linear Least Squares Unmixing (LLSU) on the Original Image
This method is based on the linear mixture model, Equation (1), for the original reflectance dataset, assuming that each endmember covers a defined region inside the pixel area and multiple scattering is negligible [
14].
where
y is the spectral signature column vector of a certain pixel;
M is the matrix containing the
mi,
i = 1, …, K, endmembers in its columns;
α is the abundance vector; and
n is the additive white noise. As for the unmixing method, we used a linear least squares non-negative approach, where the estimated abundances [
15], derived from a suitable defined Lagrangian function, are given by Equation (2):
2.4.2. Method 2: LLSU on the Reduced Channel Domain
Since the removal of multi-collinearity improves the performance of spectral unmixing, and based on the assumption that LFs of the same eruptive cycle can be distinguished by the dataset’s intrinsic dimensionality, we removed the redundant spectral information. For this a feature selection (FS) code was used that exploits the sparse unmixing Bayesian inference Iterative Conditional Expectations (BI-ICE) algorithm [
16]. Consequently, the total number of endmembers was defined considering a sparsity promoting scheme, hence the extracted endmember matrix is tall by definition. The output of the FS is a set of estimated vectors, the first of which contains a spectral band index with a decreasing significance order, while the second contains the ranks denoting the level of significance of each of these bands. We retained only the first 22 bands with higher significance, reduced the initial image dimension accordingly and then again performed an LLSU scheme.
2.4.3. Method 3: LLSU with Fast Fourier Transform (FFT) on Selected Frequencies
For the implementation of this method, the FFT was performed on each of the pixel vectors in the original dataset and on each signature vector in the endmember matrix. Again, the adopted transformation was integrated into an LLSU model. In this case, we implemented the real number of input arguments as a linear combination of the squared imaginary and real parts of the image/endmember matrices. Subsequently, the image was dimensionally reduced in a subspace of 20 frequencies in the frequency domain, which preserved the total energy content. The advantage of this approach is that it counteracts the computationally intensive and time-costly FS.
2.4.4. Method 4: Bilinear Unmixing (BLU) with the Enhanced Endmember Matrix
Due to the complex structure of the deposited volcanic deposits, nonlinear effects still exist at macroscopic scales. Therefore, the linear representation of mixed pixels lacks the required detail between secondary light interactions with the on-site materials. In this paper, the nonlinear representation of mixed ground components is inserted through their correlation within the pixel area and the implementation of the interactions in a bilinear mixture model (Equation (3)) [
17].
where the vector
results from the elementwise product of m
i, m
j, Κ* = 1/2Κ(Κ + 1), constrained for α
k* ≥ 0. The bilinear approach was applied to the reduced image resulting as in the context of method 2 and was implemented in the LLSU scheme, where we inserted the non-linearity with an enhanced matrix, containing the dot product specified above.
3. Results
The tested unmixing methods produced distinct abundance maps for each endmember that were evaluated in terms of: (i) image reconstruction efficiency; and (ii) method optimality.
Endmember Abundances
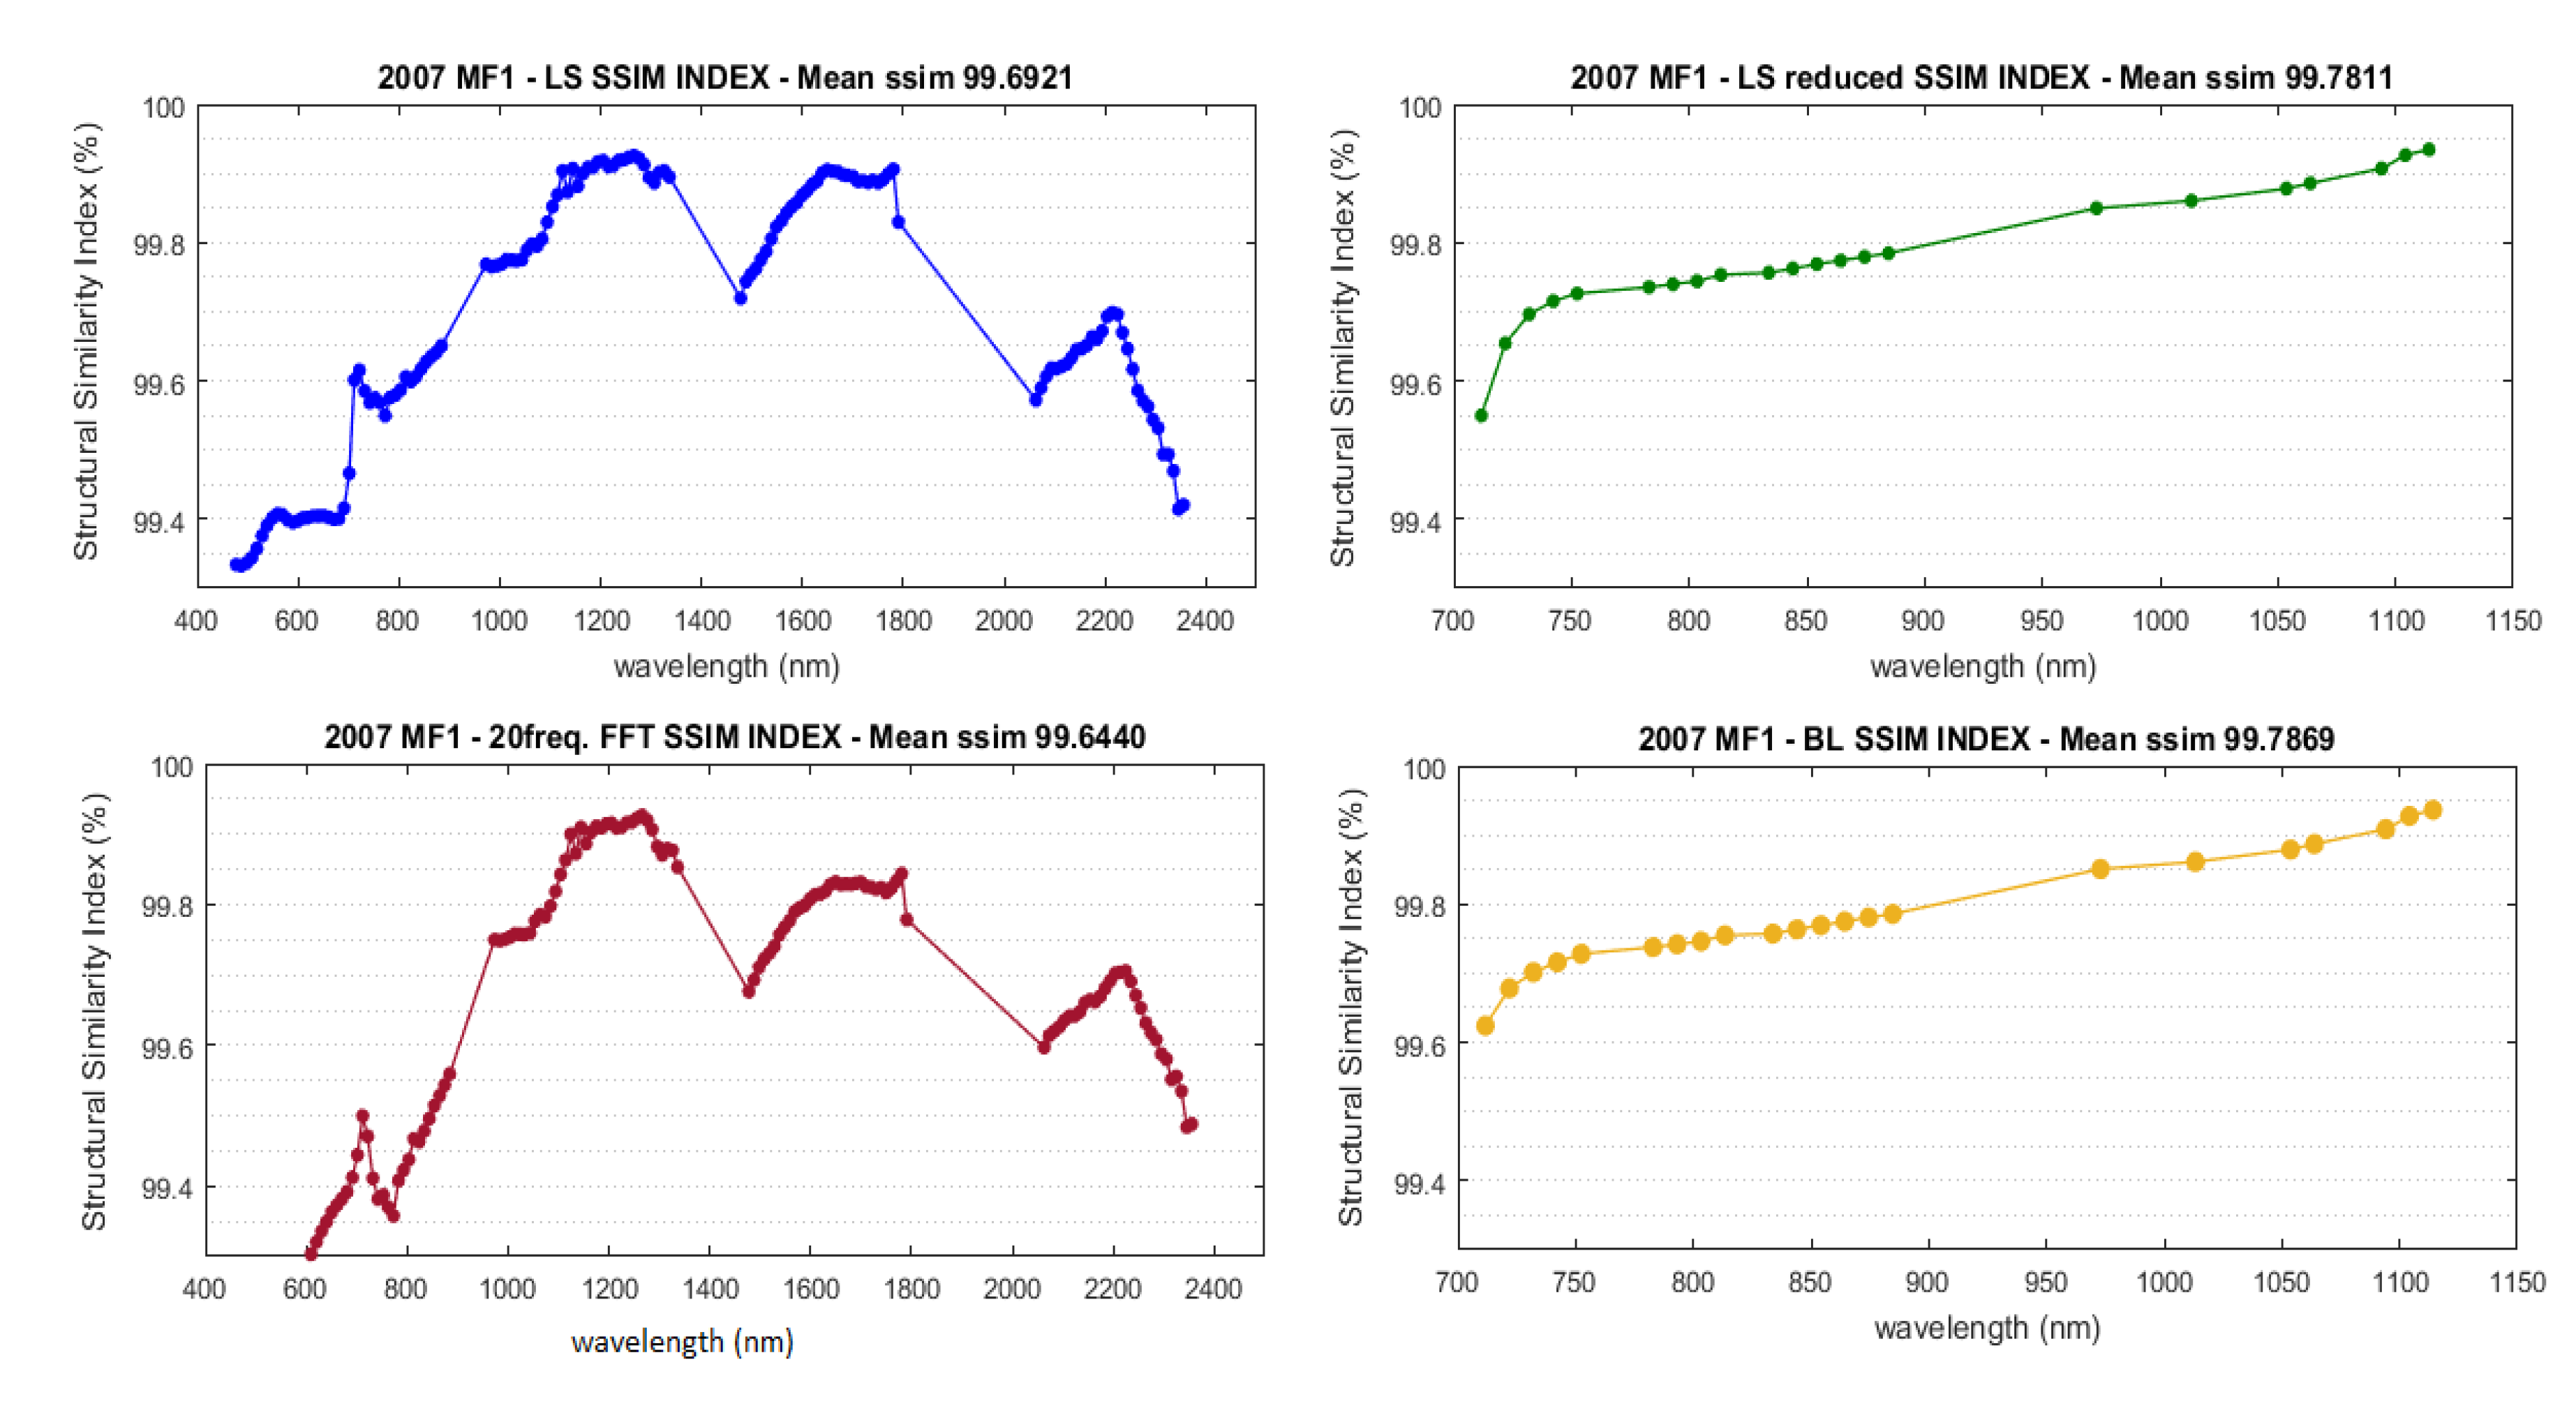
We indicatively present the abundances of the 1614–24 LF, 1646–47 scoria, industrial areas (
Figure 1) and the SSIM index values for each method (
Figure 2). The SSIM index is the quantitative evaluation of our results and indicates the degree of agreement between the initial image and the reconstructed image with the estimated abundance vectors. Each of the SSIM plots exhibits different micro-trends, while there are methods that under strict comparison produce similar results.
Method Efficiency
Each method was timed during code performance with a simplistic tic-toc Matlab approach.
Table 1 provides the optimum method in terms of time efficiency and dimensionality reduction possibilities. To be statistically accurate, the process was recorded five times per method, then the average time duration was calculated along with the respective error. As inferred from the results, the unmixing of the FFT transformed image is the quickest approach, and also had the lowest standard deviation. This was expected considering the fast implementation of the Fourier transform.
4. Discussion
The evaluation of the resulting abundance maps, per endmember, carried out via a two-stage process: (a) tracing volcanic product abundances and inter-correlation on a per-method comparison to ground truth; and (b) delimiting lava flows using different methods to extract comparative results, given the reconstruction efficiency for each method. Since the geological map was primarily used for the demarcation of the MF1 formation, we did not provide a definite LF mapping, but rather a spatial verification of each product’s presence on the MF1. The above results show that the majority of LFs were accurately delineated by both the linear- and bilinear-based unmixing approches. As expected, higher abundance values were consistently attributed to the ROI areas over the different lava fields. Areas with man-made material were also clearly distinguished. Minor confusions were observed, mainly for products with a similar mineralogical composition and spectral features, such as the scoria cones. Specifically, the observed low abundances in the same areas for different methods can be attributed to the lack of low frequency information due to the dimensionality reduction of the reduced datasets. Generally, all adopted methods showed a reconstruction efficiency greater than 99.5%, denoting the successful implementation of unmixing. Each of the SSIMs exhibited different micro-trends, while there were methods that under strict comparison produced the same reconstruction results. In terms of method effciency, the LLSU and LLSU with FFT for the selected frequencies exhibited the same SSIM trends with respect to the wavelength content and slightly varying SSIM mean values.
5. Conclusions
A quantitative analysis of the application of potential spectral unmixing methods on Etnian Lava fields was presented. We concluded that the selection of appropriate regions of interest in such a diverse volcanic environment, considering the particularities of the Hyperion dataset, is of great importance in order to obtain accurate unmixing results. Considering the basic assumptions of the LLSU with fast Fourier transform (FFT) on the selected frequencies method and the subsequent reconstruction degree, we concluded that this method obtains efficient dimensionality reduction of the initial abundance spectral information, with high unmixing accuracy. To the best of our knowledge, the volcanic products of Etna are studied mostly from field measurements, complemented by satellite images, and there are no references to the application of hyperspectral unmixing techniques to Etnian lava fields. Hence, the present research is innovative since signal processing approaches were tailored to a multi-diverse volcanic environment.


