Combining Water Indices for Water and Background Threshold in Landsat Image †


Abstract
:1. Introduction
2. Experiments
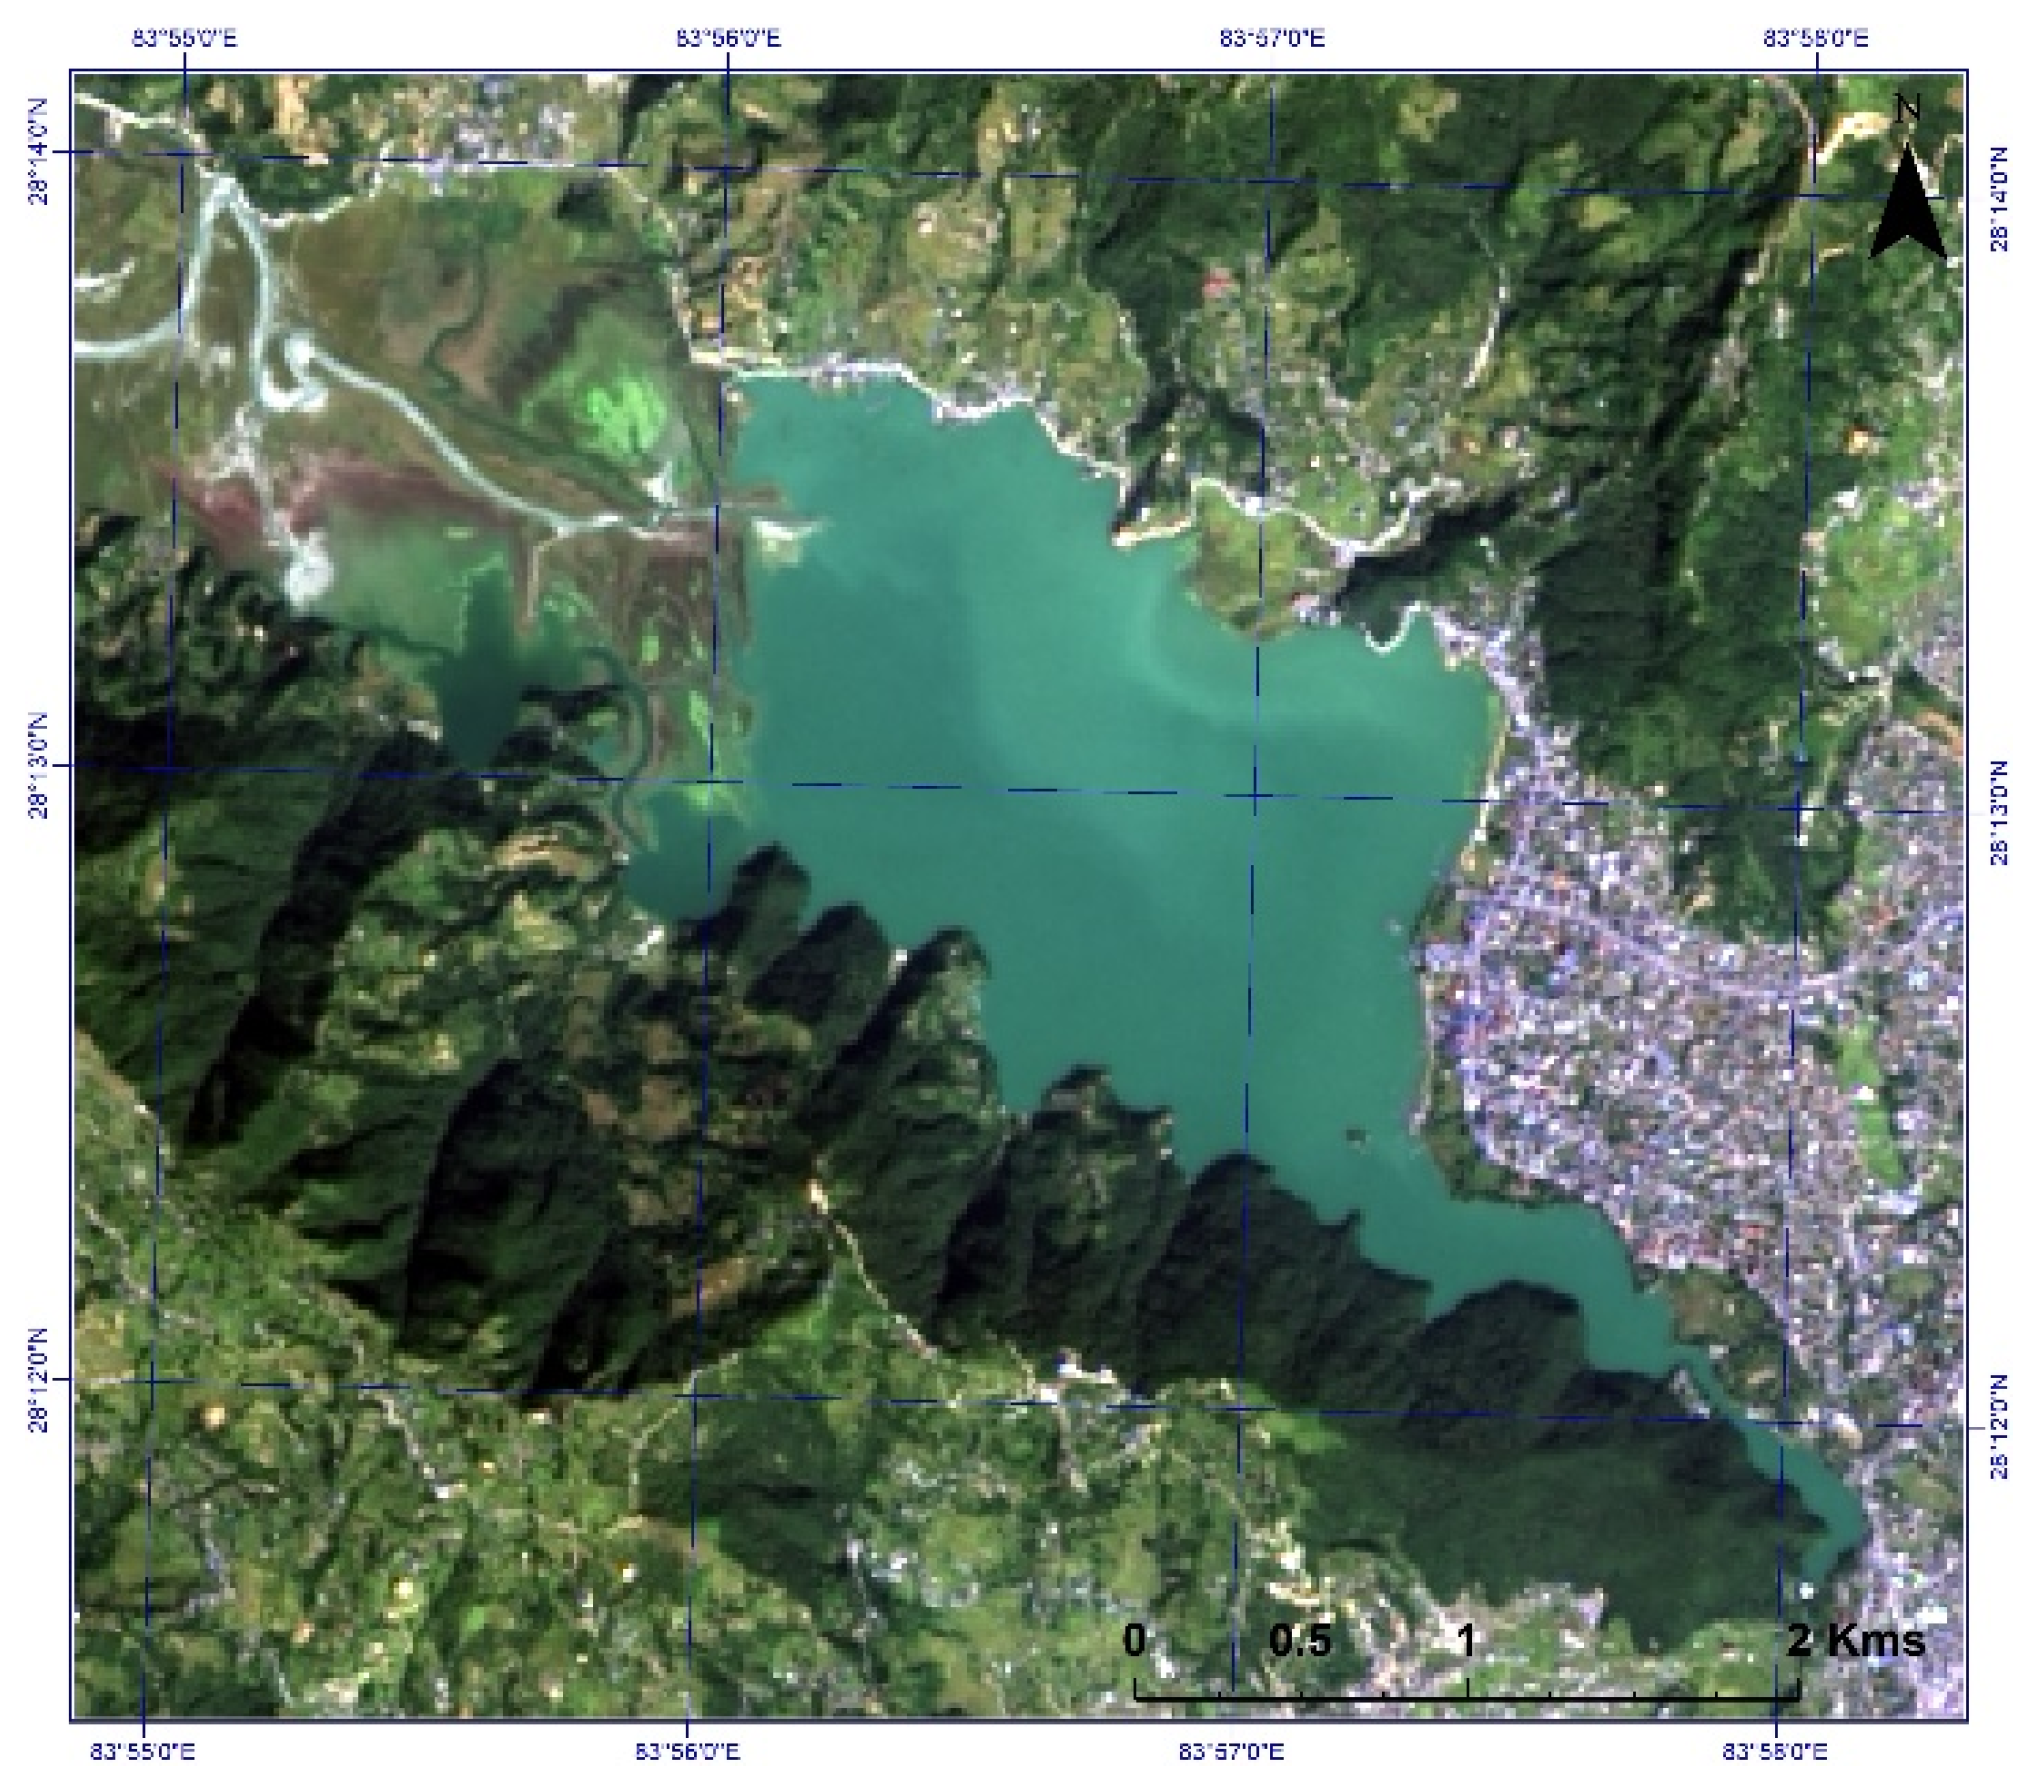
2.1. Test Site
2.2. Data
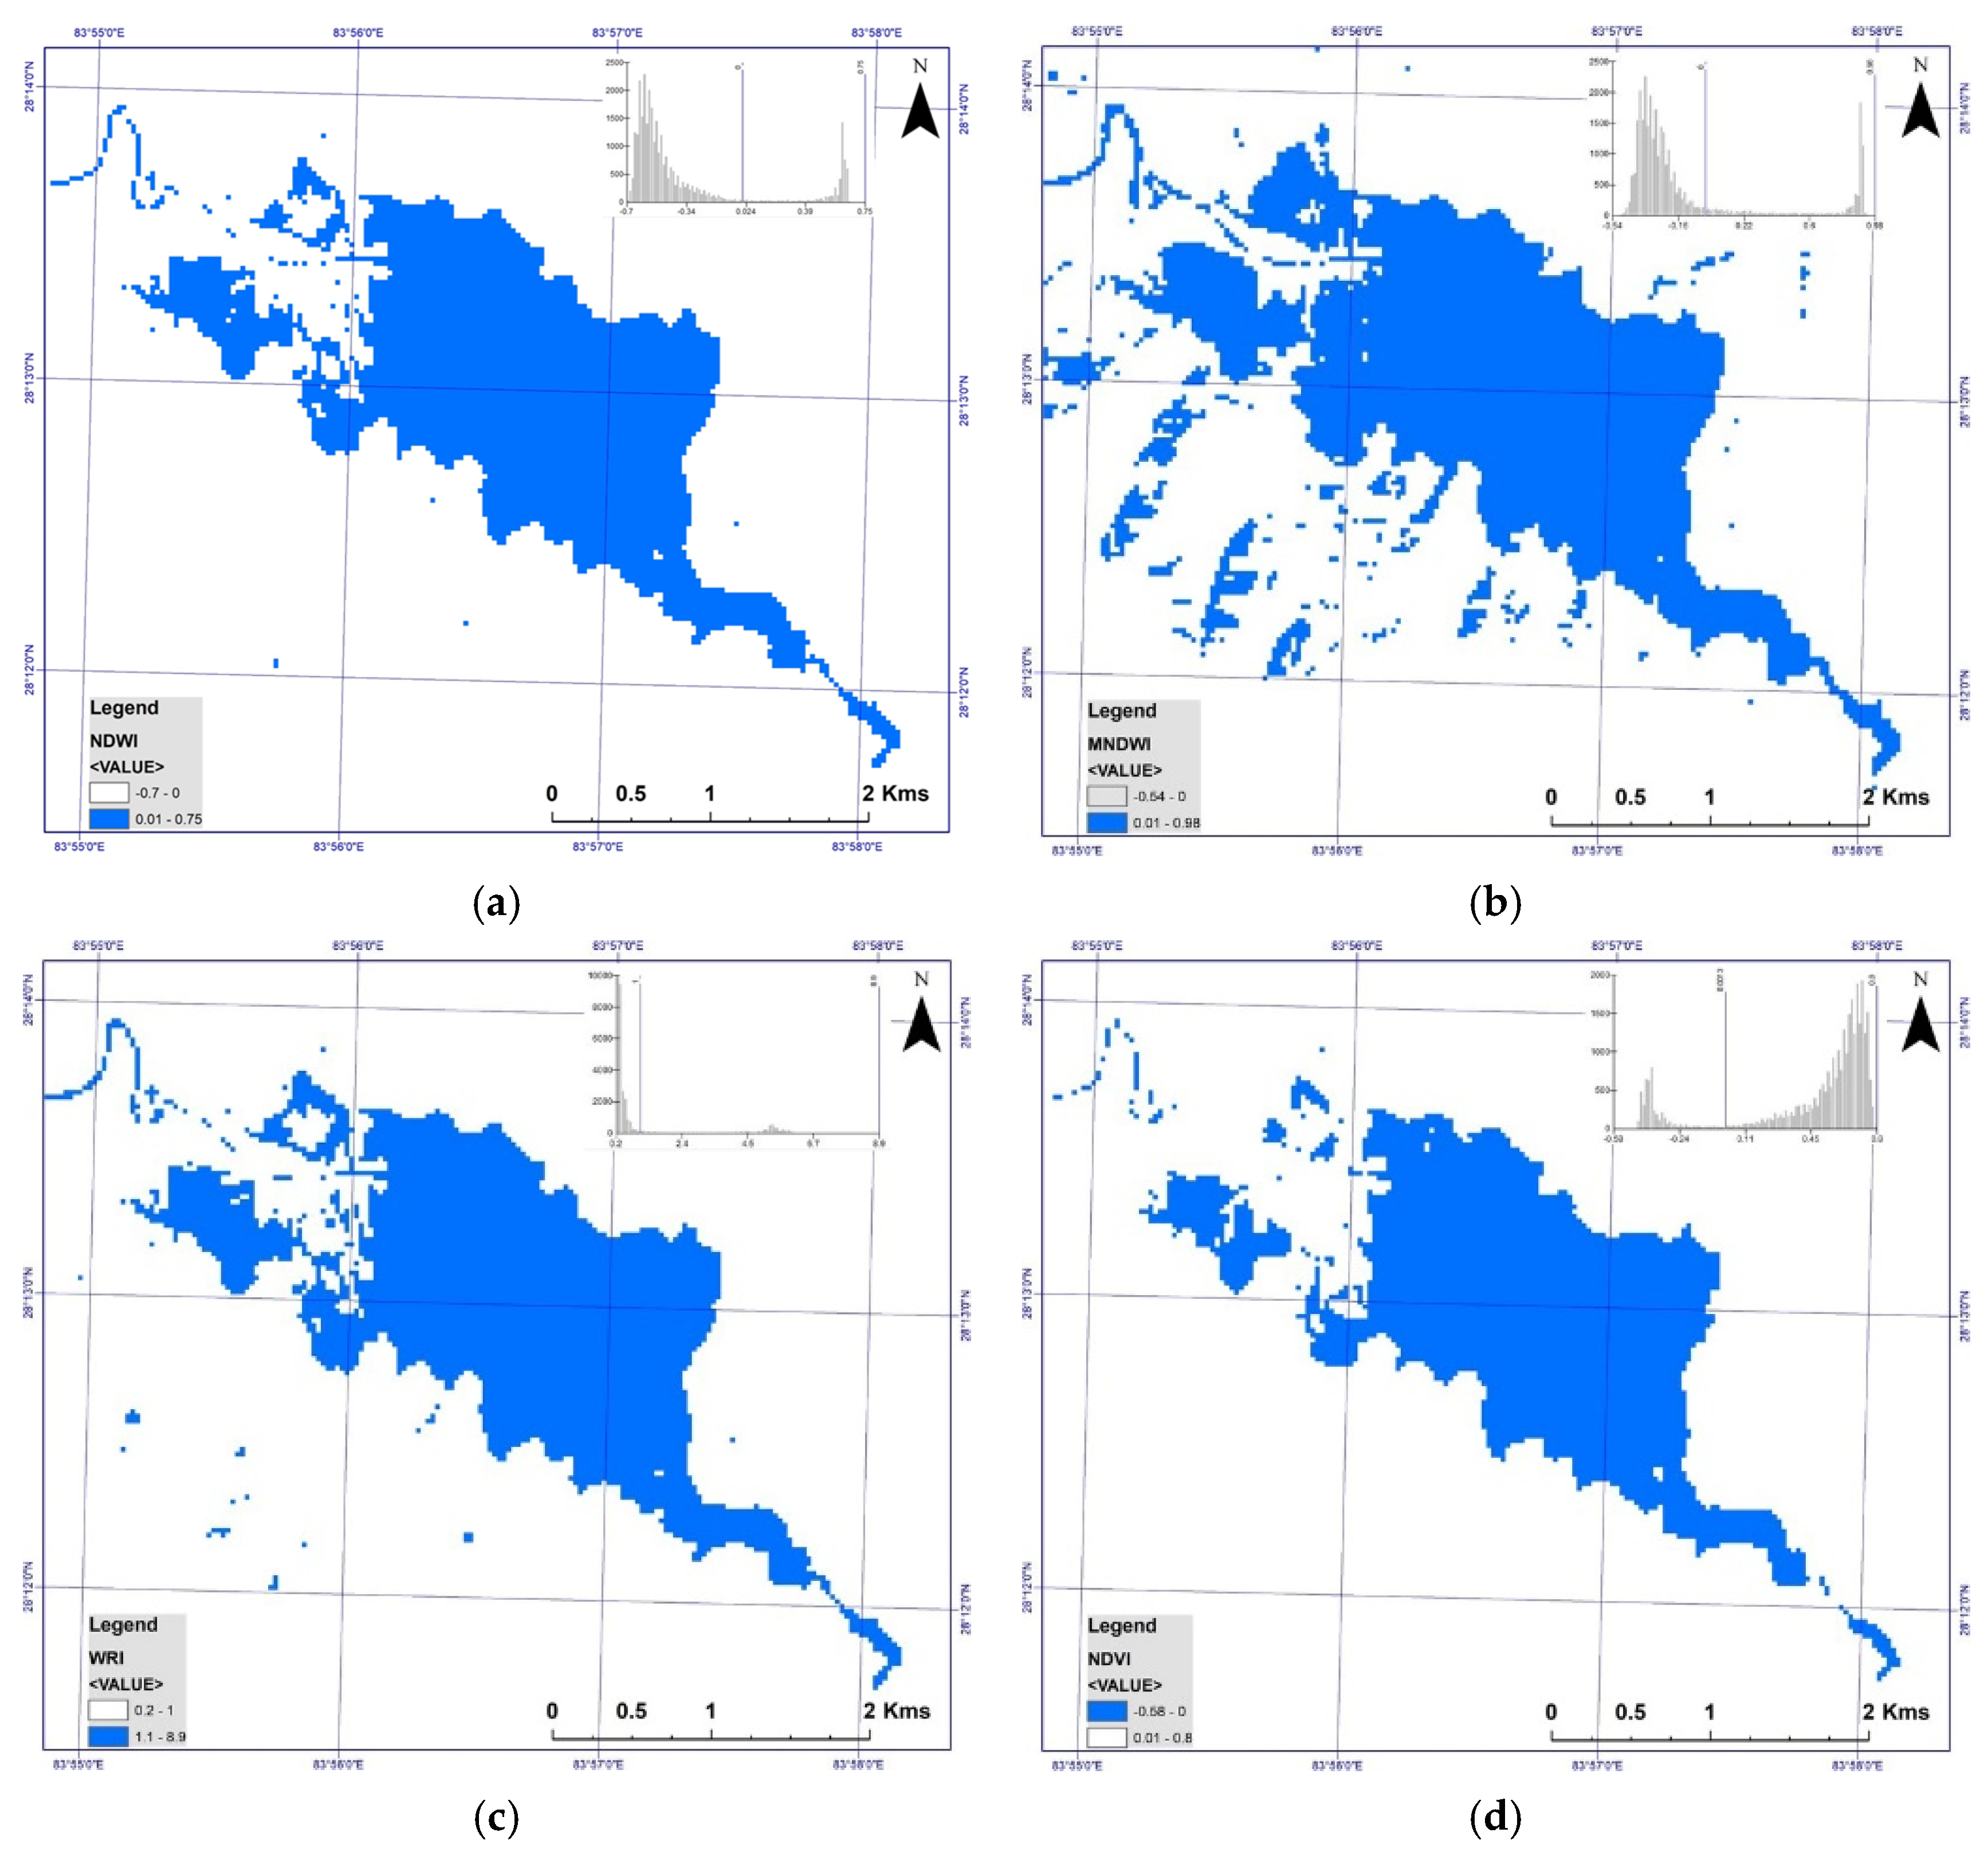
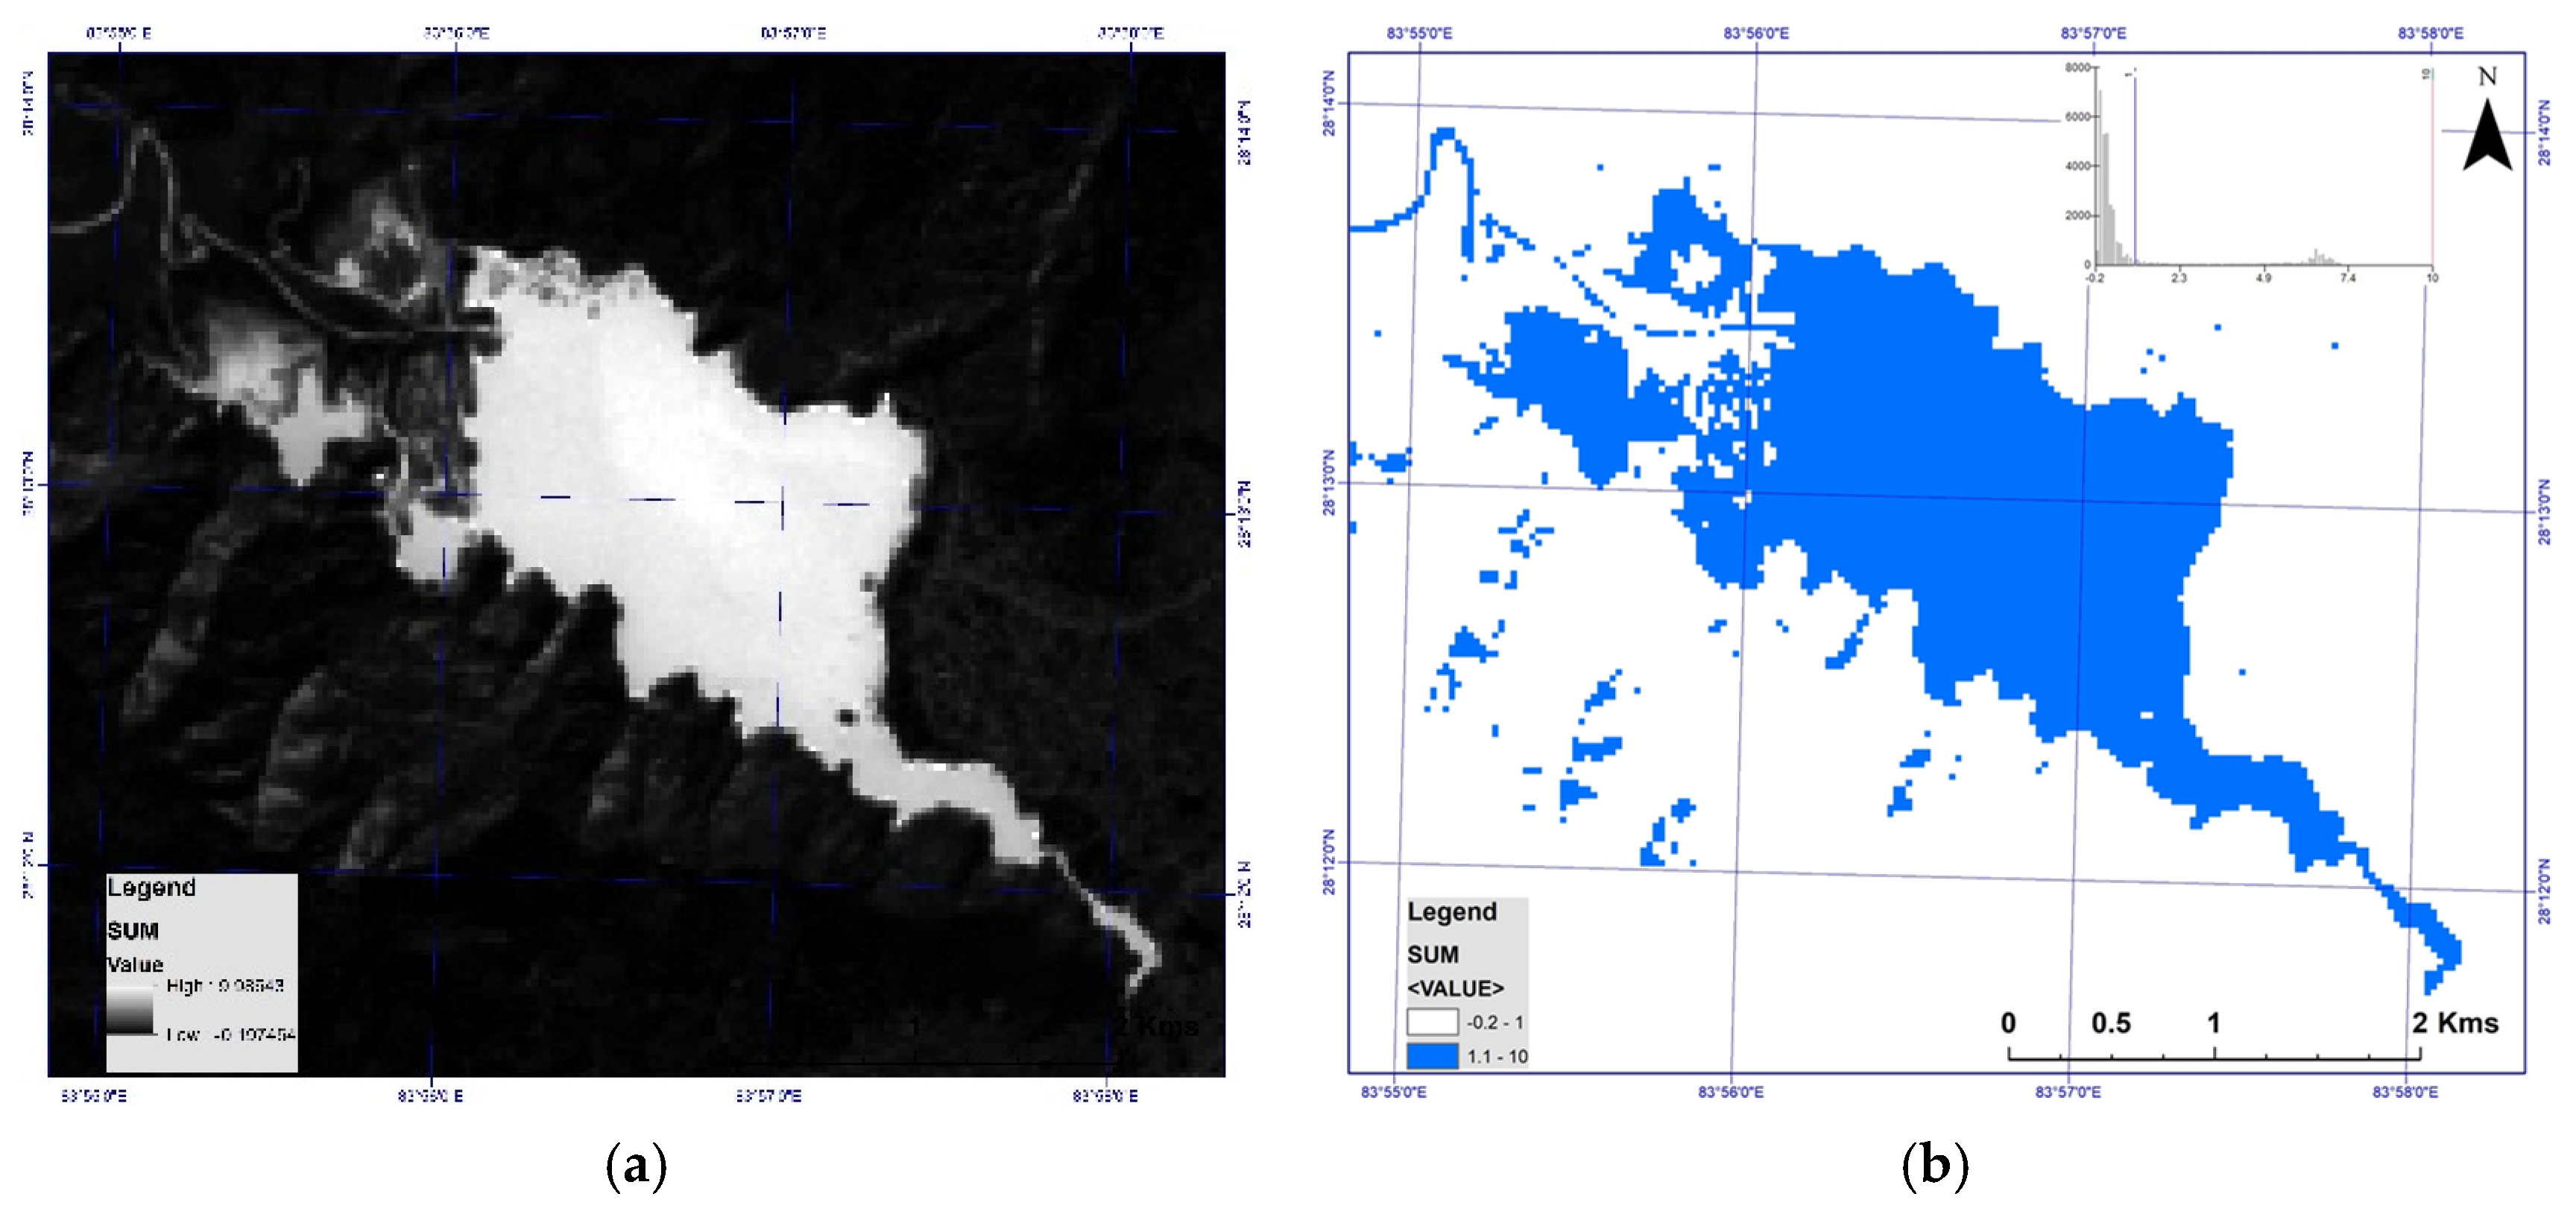
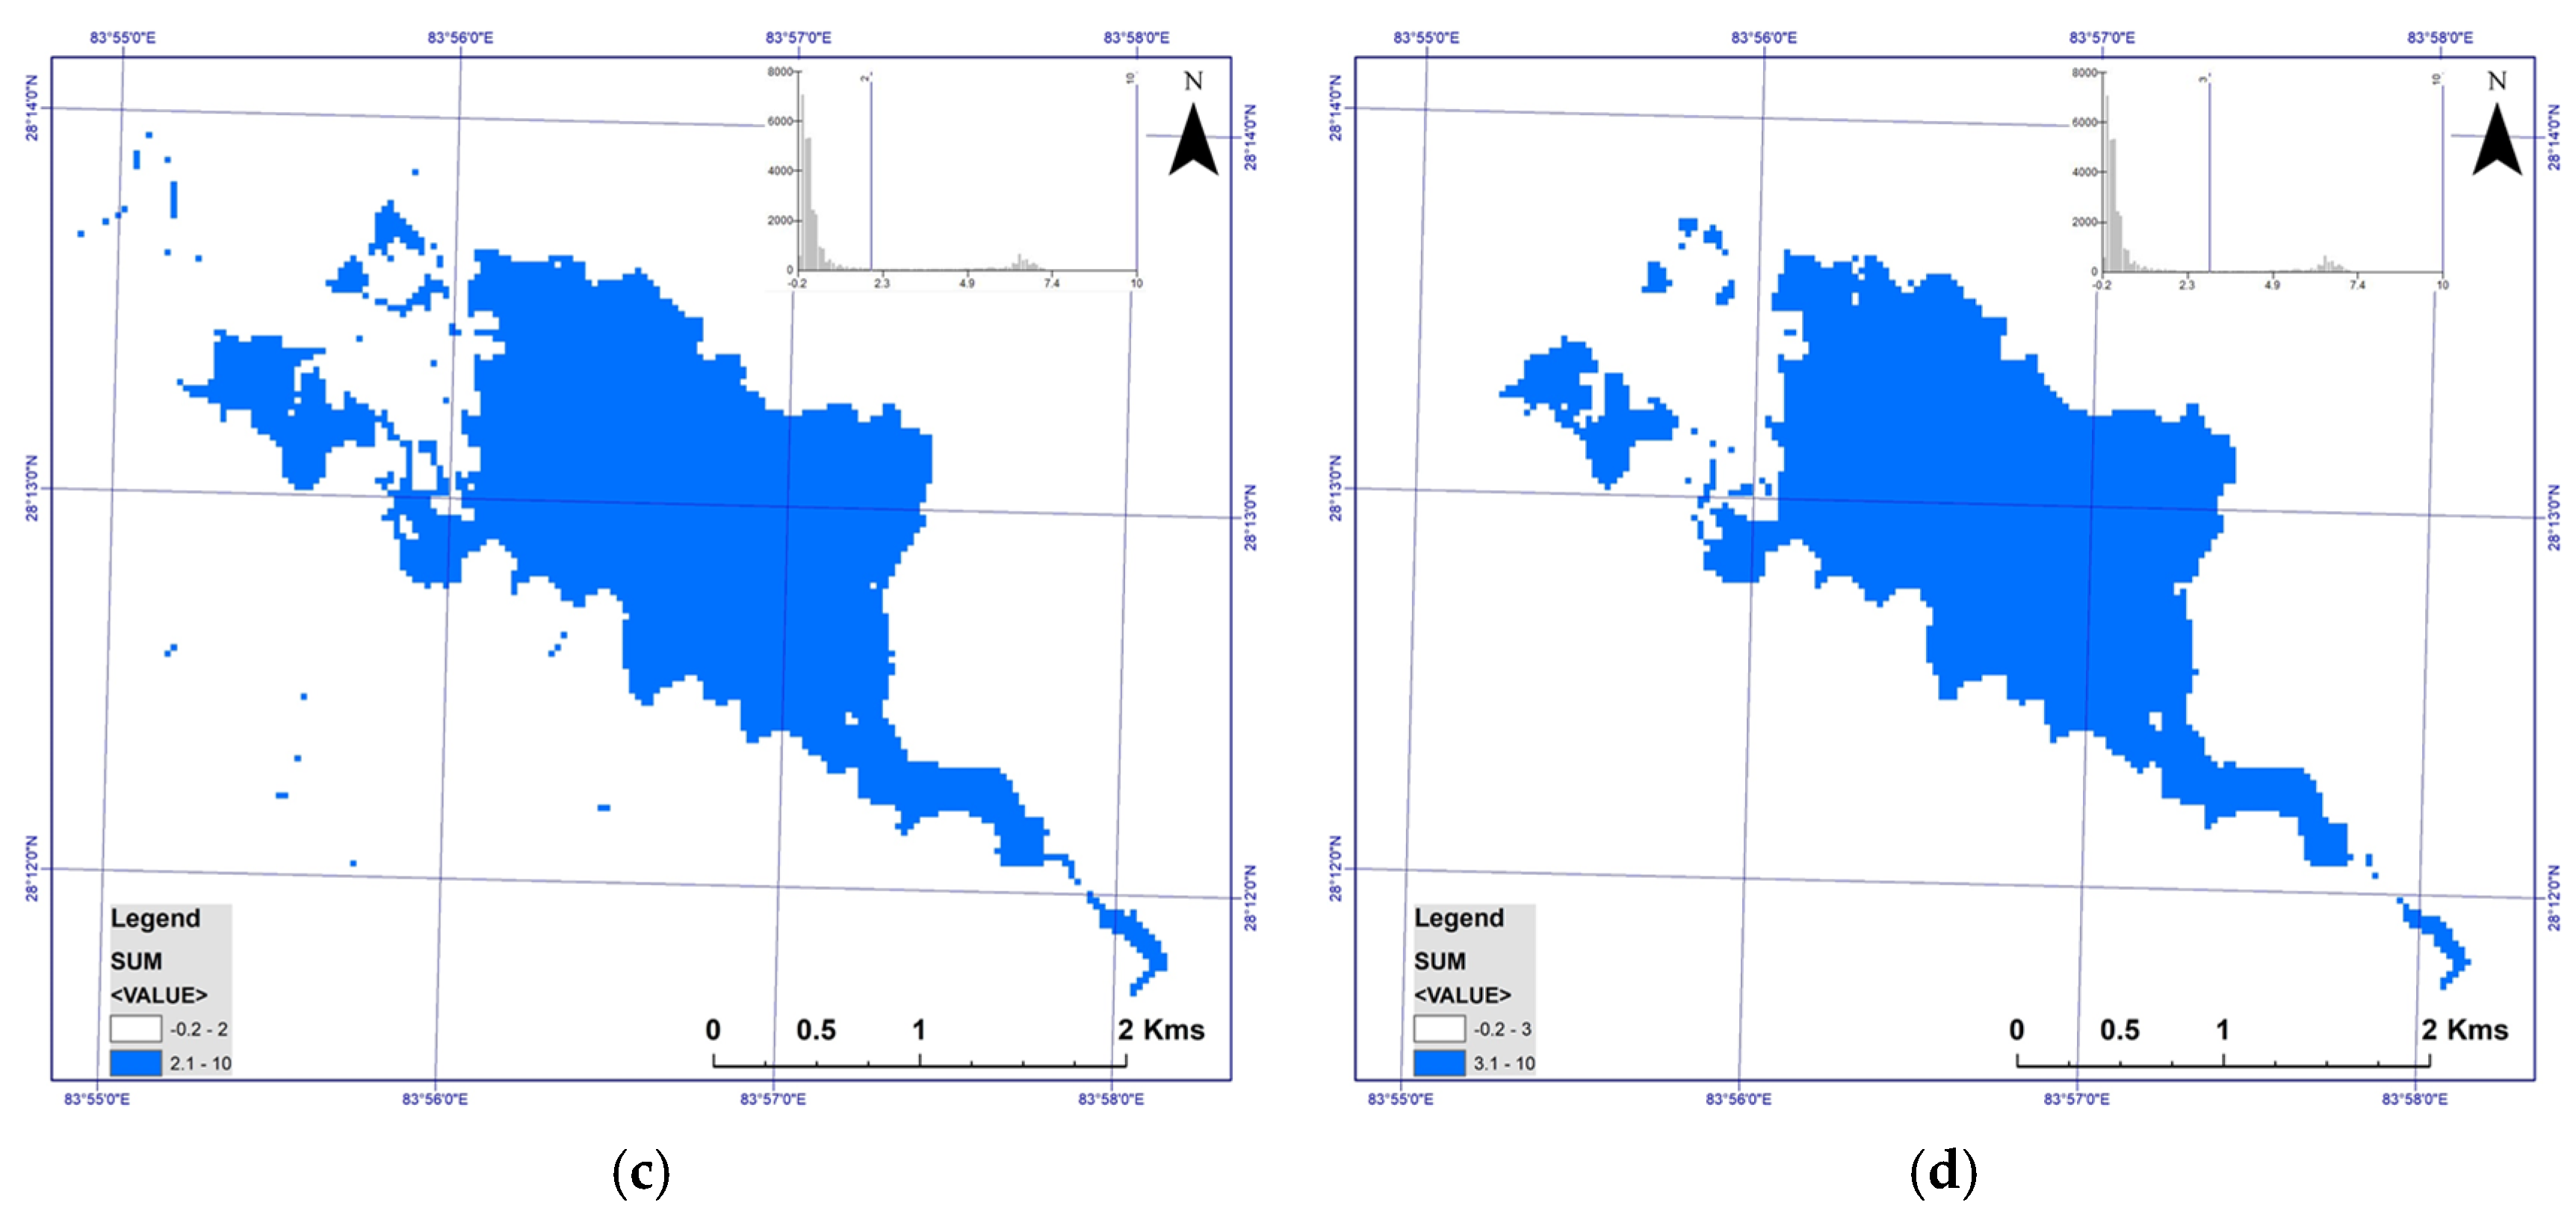
2.3. Method
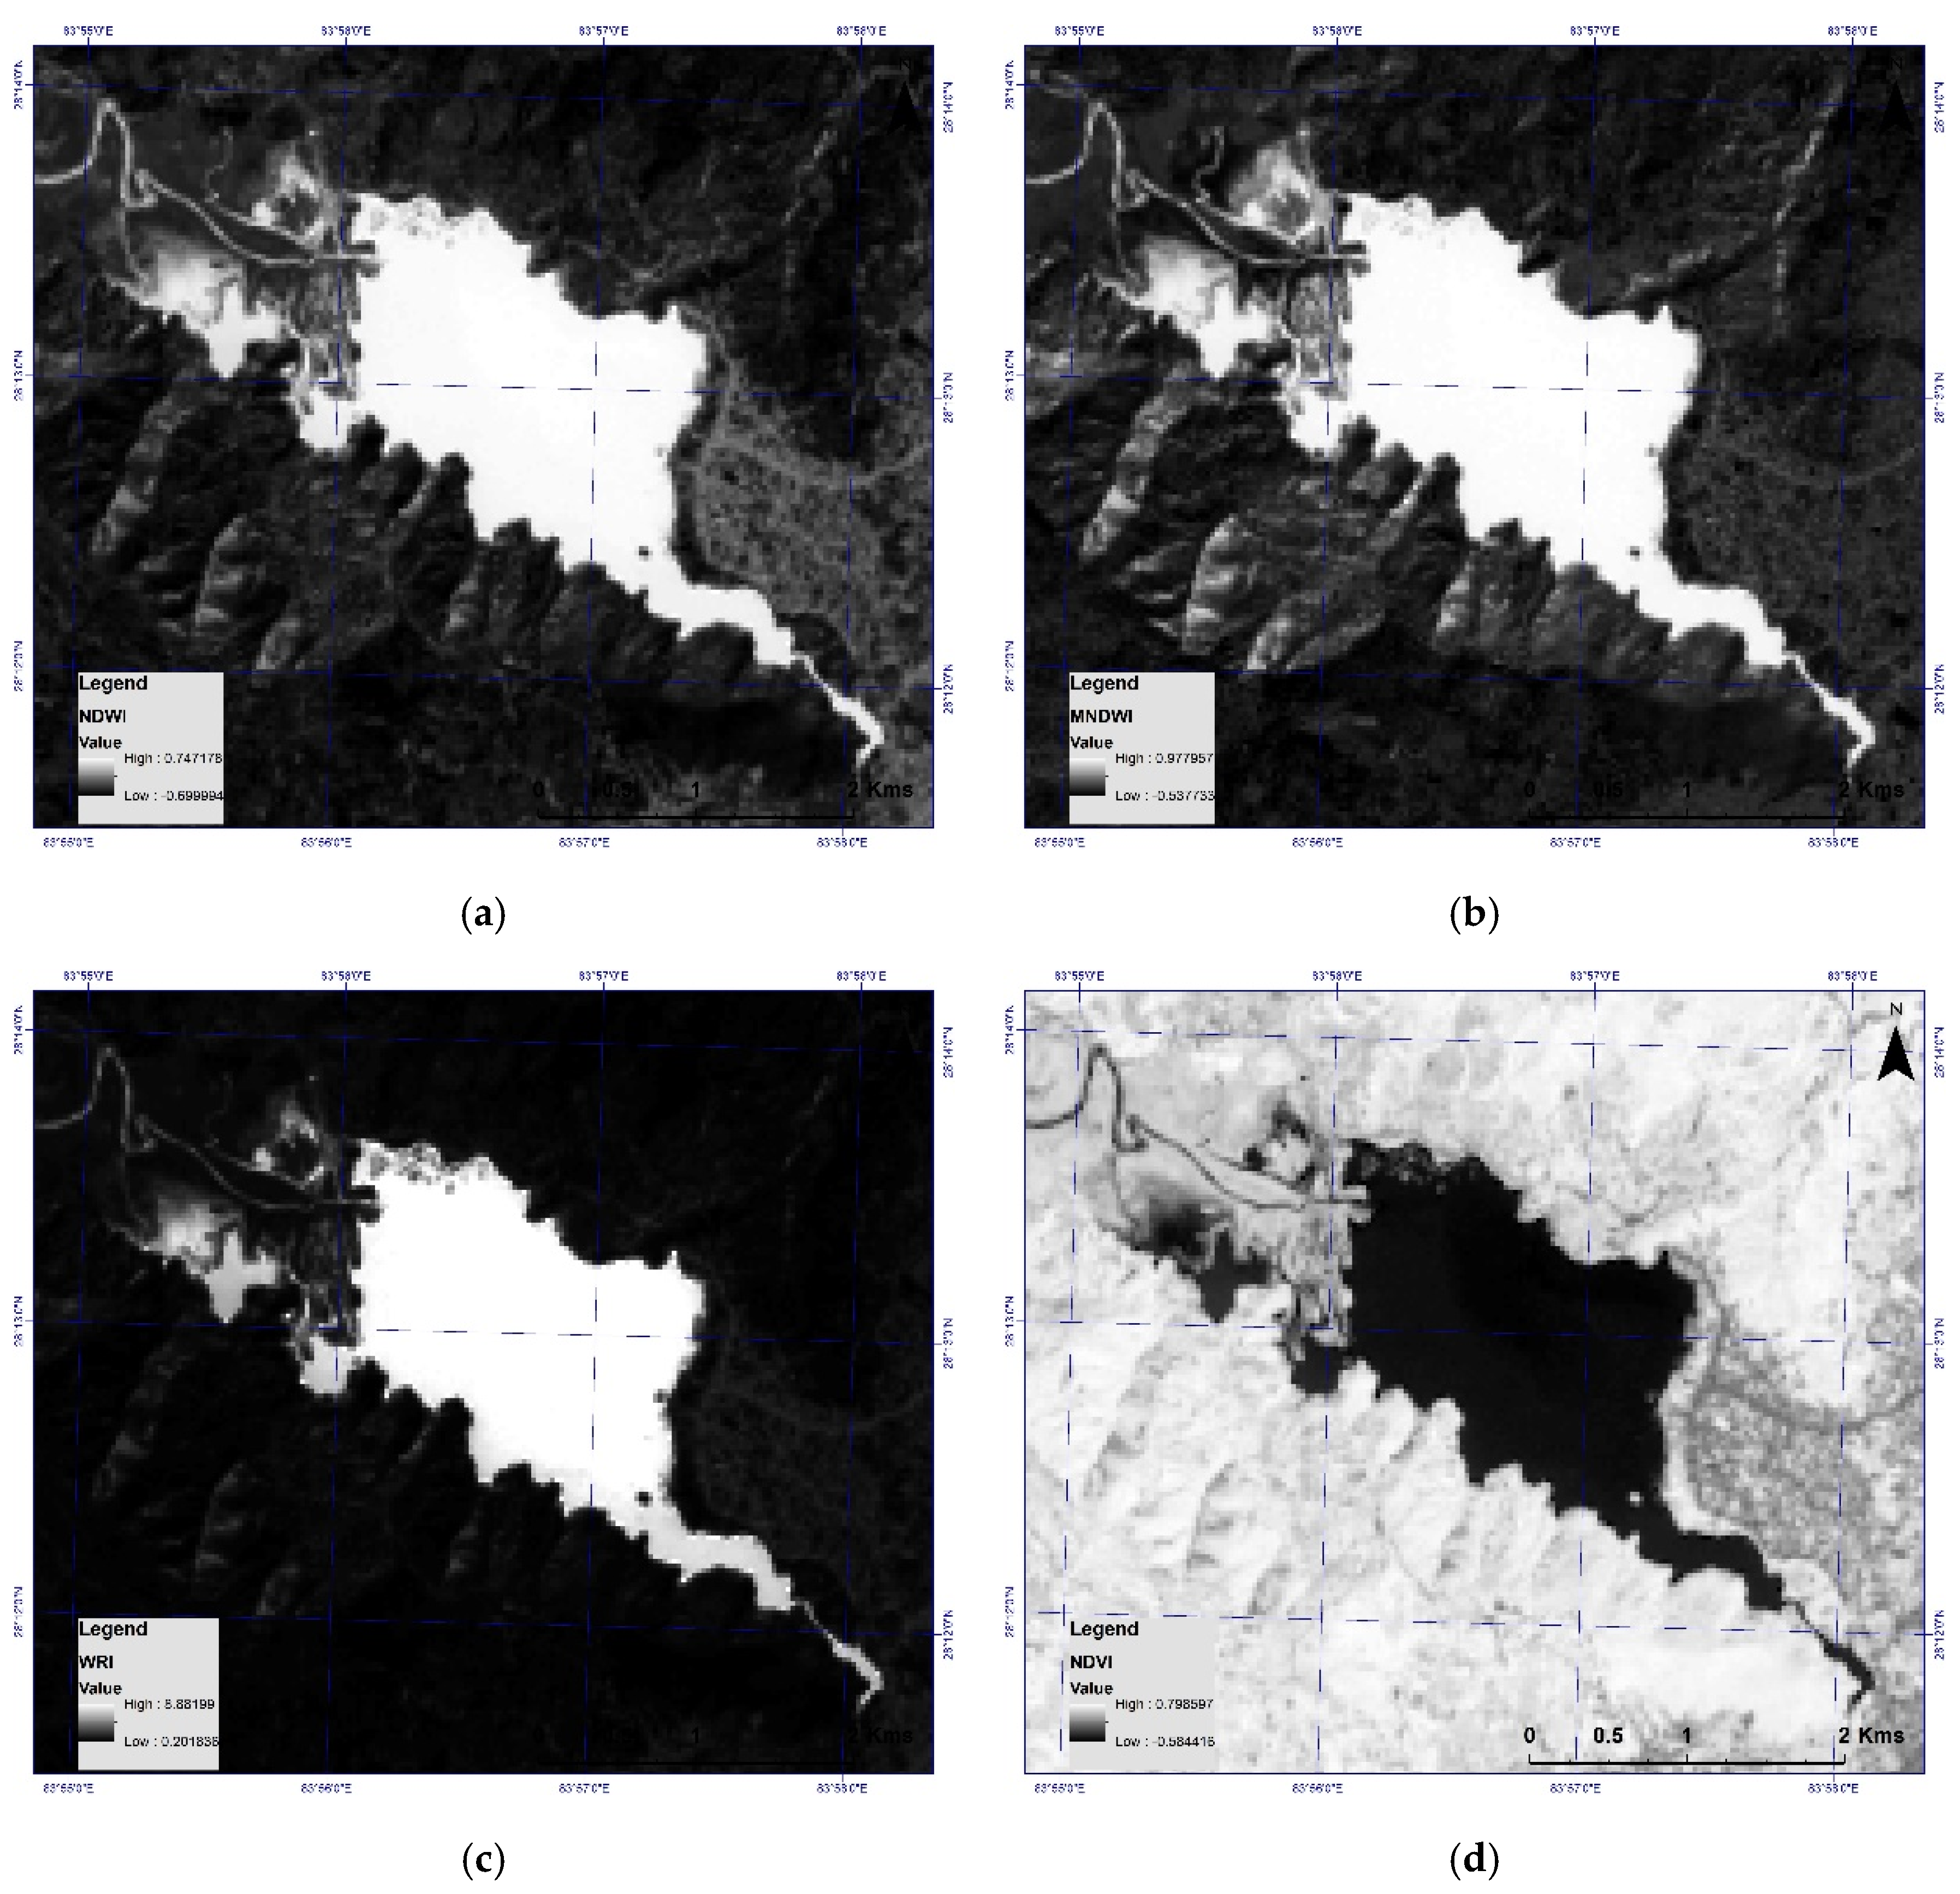
3. Results and Discussion
4. Conclusions
Conflicts of Interest
References
- Acharya, T.D.; Lee, D.H.; Yang, I.T.; Lee, J.K. Identification of Water Bodies in a Landsat 8 OLI Image using a J48 Decision Tree. Sensors 2016, 16, 1075. [Google Scholar] [CrossRef] [PubMed]
- Karpatne, A.; Khandelwal, A.; Chen, X.; Mithal, V.; Faghmous, J.; Kumar, V. Global Monitoring of Inland Water Dynamics: State-of-the-Art, Challenges, and Opportunities. In Computational Sustainability; Lässig, J., Kersting, K., Morik, K., Eds.; Springer: Cham, Switzerland, 2016; pp. 121–147. [Google Scholar]
- Tulbure, M.G.; Broich, M. Spatiotemporal Dynamic of Surface Water Bodies using Landsat Time-Series Data from 1999 to 2011. ISPRS J. Photogramm. Remote Sens. 2013, 79, 44–52. [Google Scholar] [CrossRef]
- Nath, R.K.; Deb, S.K. Water-Body Area Extraction from High Resolution Satellite Images-an Introduction, Review, and Comparison. Int. J. Image Process. 2010, 3, 353–372. [Google Scholar]
- Sivanpillai, R.; Miller, S.N. Improvements in Mapping Water Bodies using ASTER Data. Ecol. Inform. 2010, 5, 73–78. [Google Scholar] [CrossRef]
- McFEETERS, S.K. The use of the Normalized Difference Water Index (NDWI) in the Delineation of Open Water Features. Int. J. Remote Sens. 1996, 17, 1425–1432. [Google Scholar] [CrossRef]
- Xu, H. Modification of Normalised Difference Water Index (NDWI) to Enhance Open Water Features in Remotely Sensed Imagery. Int. J. Remote Sens. 2006, 27, 3025–3033. [Google Scholar] [CrossRef]
- Shen, L.; Li, C. Water Body Extraction from Landsat ETM Imagery using Adaboost Algorithm. In Proceedings of the 18th International Conference on Geoinformatics, Beijing, China, 18–20 June 2010; pp. 1–4. [Google Scholar]
- Rouse, J.W.; Haas, R.H.; Schell, J.A.; Deering, D.W. Monitoring Vegetation Systems in the Great Plains with ERTS (Earth Resources Technology Satellite). In Proceedings of the Third Earth Resources Technology Satellite Symposium, Greenbelt, ON, Canada, 10–14 December 1973; pp. 309–317. [Google Scholar]
- Acharya, T.D.; Yang, I.T.; Subedi, A.; Lee, D.H. Change Detection of Lakes in Pokhara, Nepal using Landsat Data. Proceedings 2017, 1, 17. [Google Scholar]
- Acharya, T.D.; Yang, I.T.; Lee, D.H. Water Index Based Coastline Detection from Landsat Images. In Proceedings of the 2017 Conference of the Korean Society for Geospatial Information Science, Seoul, Korea, 25–26 May 2017; pp. 187–188. [Google Scholar]


| S. No. | Spectral Indices | Formula | Threshold | Ref. |
|---|---|---|---|---|
| 1 | Normalized Difference Water Index (NDWI) | (Green − NIR)/(Green + NIR) | 0 | [6] |
| 2 | Modified Normalized Difference Water Index (MNDWI) | (Green − SWIR)/(Green + SWIR) | 0 | [7] |
| 3 | Water Ratio Index (WRI) | (Green + Red)/(NIR + SWIR1) | 1 | [8] |
| 4 | Normalized Difference Vegetation Index (NDVI) | (NIR − Red)/(NIR + Red) | 0 | [9] |
Publisher’s Note: MDPI stays neutral with regard to jurisdictional claims in published maps and institutional affiliations. |
© 2018 by the authors. Licensee MDPI, Basel, Switzerland. This article is an open access article distributed under the terms and conditions of the Creative Commons Attribution (CC BY) license (https://creativecommons.org/licenses/by/4.0/).
Share and Cite
Acharya, T.D.; Subedi, A.; Yang, I.T.; Lee, D.H. Combining Water Indices for Water and Background Threshold in Landsat Image. Proceedings 2018, 2, 143. https://doi.org/10.3390/ecsa-4-04902
Acharya TD, Subedi A, Yang IT, Lee DH. Combining Water Indices for Water and Background Threshold in Landsat Image. Proceedings. 2018; 2(3):143. https://doi.org/10.3390/ecsa-4-04902
Chicago/Turabian StyleAcharya, Tri Dev, Anoj Subedi, In Tae Yang, and Dong Ha Lee. 2018. "Combining Water Indices for Water and Background Threshold in Landsat Image" Proceedings 2, no. 3: 143. https://doi.org/10.3390/ecsa-4-04902
APA StyleAcharya, T. D., Subedi, A., Yang, I. T., & Lee, D. H. (2018). Combining Water Indices for Water and Background Threshold in Landsat Image. Proceedings, 2(3), 143. https://doi.org/10.3390/ecsa-4-04902