1. Introduction
The area of structural health monitoring (SHM) has been prominent in several academic and industrial segments due to the importance of the subject, since the detection and prevention of damage at an early stage are of global interest. Structural and mechanical systems, such as bridges, aircraft, ships, trains, dams, large rotating machines, among others, are some examples of structures that should be monitored, because the occurrence of damage can hinder the operation of these systems and, consequently, put at risk the safety of users.
Therefore, SHM systems that perform in real time or periodically the monitoring of structural damage been extensively investigated in recent years [
1]. These systems, in addition to offering a high level of security to users, also reduce the maintenance costs of structures, since damage such as corrosions, delaminations, cracks and fatigue are still detected at an early stage.
As in most real-world monitored structures (bridges, pipelines, airplanes) the total interruption of operation is infeasible, it is desirable that minimally invasive techniques be used without significantly altering its mechanical properties. These techniques are known as nondestructive testing (NDT) or nondestructive evaluation (NDE). There are several techniques reported in the literature as NDT that are applied to SHM systems and the electromechanical impedance (EMI) stands out for its simple methodology and the use of small and low-cost piezoelectric transducers [
2].
Initially, damage detection research based on the EMI method used almost exclusively commercial impedance analyzers, such as the HP 4194A and HP 4294A, to measure the electrical impedance of piezoelectric transducers. However, these commercial instruments are bulky, costly and with features that are not used for damage detection. In order to circumvent these disadvantages, several researchers have proposed alternative measurement systems based on various techniques.
In [
3], Baptista and Vieira Filho proposed a versatile and easy-to-implement system that uses a multifunctional data acquisition (DAQ) device (with at least one input and one analog output) and a PC with LabVIEW software. As excitation signal of the transducer, a chirp dynamic signal is used and the electrical impedance is calculated from the frequency response function (FRF) obtained by the relation between the response and excitation signals.
Many recent SHM applications [
4] based on the impedance method have used the Analog Devices integrated circuit AD5933 since it is a complete solution for the measurement of electrical impedance. However, here, the excitation signal is performed step by step, with sine wave signals.
The precision of the measurements is important in SHM applications because the detection and quantification of damage is characterized by comparing two impedance signatures, so that variations caused by the measurement system itself can interfere directly with the results and make it impossible to detect damage at an early stage or cause false positive diagnoses. Therefore, in this work, two different methods using the EMI technique are analyzed and statistically compared for the precision of measurements and sensitivity to detect structural damage.
2. Electromechanical Impedance Method
2.1. Electromechanical Impedance Principle
The principle of the EMI technique for detecting structural damage consists of attaching a piezoelectric transducer to the structure that will be monitored and evaluating the mechanical condition of the structure by measuring and comparing two electrical impedance signatures of the piezoelectric transducer. There are several models to relate the electrical impedance of the piezoelectric transducer with the mechanical impedance of the structure. For this work, which uses a small structure for analysis, the use of the one-dimensional model is adequate and the electrical impedance of the piezoelectric transducer bonded to the structure is given by [
5]
where
is the electrical impedance of the transducer at the frequency
f;
is the mechanical impedance of the transducer;
is the mechanical impedance of the monitored structure;
C is the static capacitance of the transducer;
,
and
are the piezoelectric, elastic compliance and dielectric constants, respectively, of the piezoelectric material, where the superscripts
T and
E indicate constant stress and constant electric field, respectively, and the subscripts 1 and 3 represent the axes of the natural coordinate system of the piezoelectric material under the one-dimensional assumption; and
j is the unit imaginary number.
According to Equation (1), any variation in the mechanical impedance will result in a variation in the electrical impedance of the piezoelectric transducer. Thus, the verification of damage caused by any type of structural variation is perceived by the change in the electric impedance signature of the transducer.
2.2. Damage Detection
Structural damage can be detected and quantified by measuring and analyzing the electrical impedance of the transducer. Typically, this verification is performed through damage indices, comparing two electrical impedance signatures. The impedance signature used as a reference (baseline) must be of the healthy structure, without damage, while the other impedance signature refers to a moment of monitoring of the structure. For this work, the index used for the characterization of damage is the correlation coefficient deviation metric (CCDM), based on the correlation coefficient, which is calculated as follows
where
and
are the electrical impedance signatures (amplitude, real part or imaginary part), as given by Equation (1), with the structure in the healthy and damaged condition, respectively, in the frequency
k, ranging from the initial frequency
to the final frequency
, and
and
are the respective mean values of the impedance signatures for the two conditions analyzed.
In this work, the real part of the signatures was used to be more sensitive to variations due to structural damage [
6]. In addition to an appropriate damage index, the method of signal acquisition from the piezoelectric transducer is fundamental for the correct diagnosis of the structure. Two methods were analyzed and compared, as described in the next section.
3. Experimental Setup
Two methods of signal acquisition were analyzed, both based on LabVIEW software using a DAQ device. The first method is that proposed by Baptista and Vieira Filho [
3], which, as already described in
Section 1, uses a chirp type dynamic excitation signal, in which all the frequencies desired for the analysis of the electrical impedance of the transducer are contained in a single signal. The second method uses several excitation signals, all sine waves, each with a single frequency of the desired frequency band. As the purpose of this work is to compare the results of two different techniques typically used in the EMI technique, all tests were performed under the same conditions and configurations.
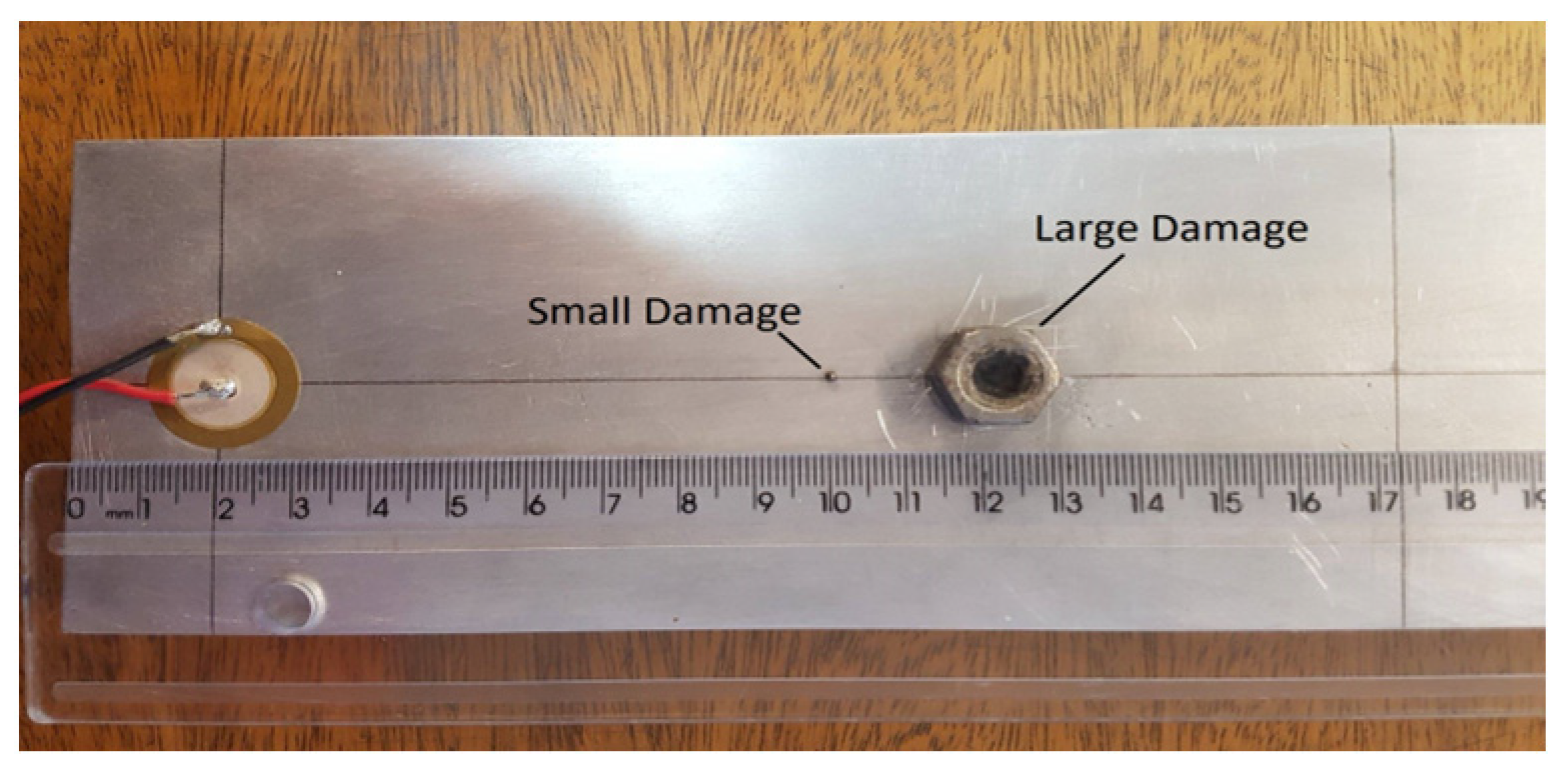
The materials used in this work were: a NI-USB-6361 DAQ device; an aluminum bar with dimensions 790 mm × 75 mm × 3 mm; a piezoelectric diaphragm 7BB-20-6 type, from Murata Manufacturing, with brass base of 20 mm in diameter and thickness of 0.20 mm, piezoelectric ceramic with a diameter of 14 mm and a thickness of 0.22 mm; a small steel sphere of 1 mm in diameter and a steel nut of 8 mm × 14 mm for the simulation of damages. The piezoelectric diaphragm was attached 20 mm from one end of the bar, which was the structure monitored in this work. The piezoelectric diaphragm was used as the piezoelectric transducer, since it is an inexpensive component and proven to be able to several applications such as loading monitoring [
7], to detect partial discharges in power transformers [
8], and even in the feasibility for applications in SHM systems based on the EMI method [
9].
As a simulation of damage, the sphere and the nut were attached at 100 mm from the transducer, one at a time, causing the variation of the mechanical characteristics of the bar similarly as occurs for real damage. To perform the experiments, the bar was supported on rubber blocks to minimize the effects of external vibrations, besides being performed in an environment with temperature controlled by air conditioning. The experimental setup is presented in
Figure 1.
The first part of the experiments consisted of analyzing the repeatability and precision of the measurements. Thus, the real part of the impedance at the frequency band from 1 kHz to 200 kHz was measured twenty times with each acquisition method and the standard deviation of these measurements was calculated for one resonance peak for each frequency point for the two methods. The configurations used in each acquisition method are shown in
Table 1.
The second part of the experiments aimed to analyze the sensitivity of each method to detect the different damages previously presented. Therefore, ten measurements were performed with each damage and the calculation of the CCDM index was performed from 40 kHz to 50 kHz sub-band using the real part of the impedance. In addition, ten measurements were also performed for the healthy bar, such that when using the CCDM index for damage characterization, it is visible how the imprecision of the acquisition methods can cause a false-positive diagnosis of the monitored structure.
It is worth mentioning that the indices were calculated using the same baseline of each method and, to normalize the results in relation to the variations of the method itself, the indices were divided by the values obtained using a second baseline of the respective method. For this step, the number of samples and frequency step were, respectively, 20,000 and 100 Hz for both methods.
In addition, all impedance signatures were obtained from a single measurement, without averaging, for an effective comparison between the methods.
4. Results and Discussion
As previously described, 20 measurements were performed with each acquisition method.
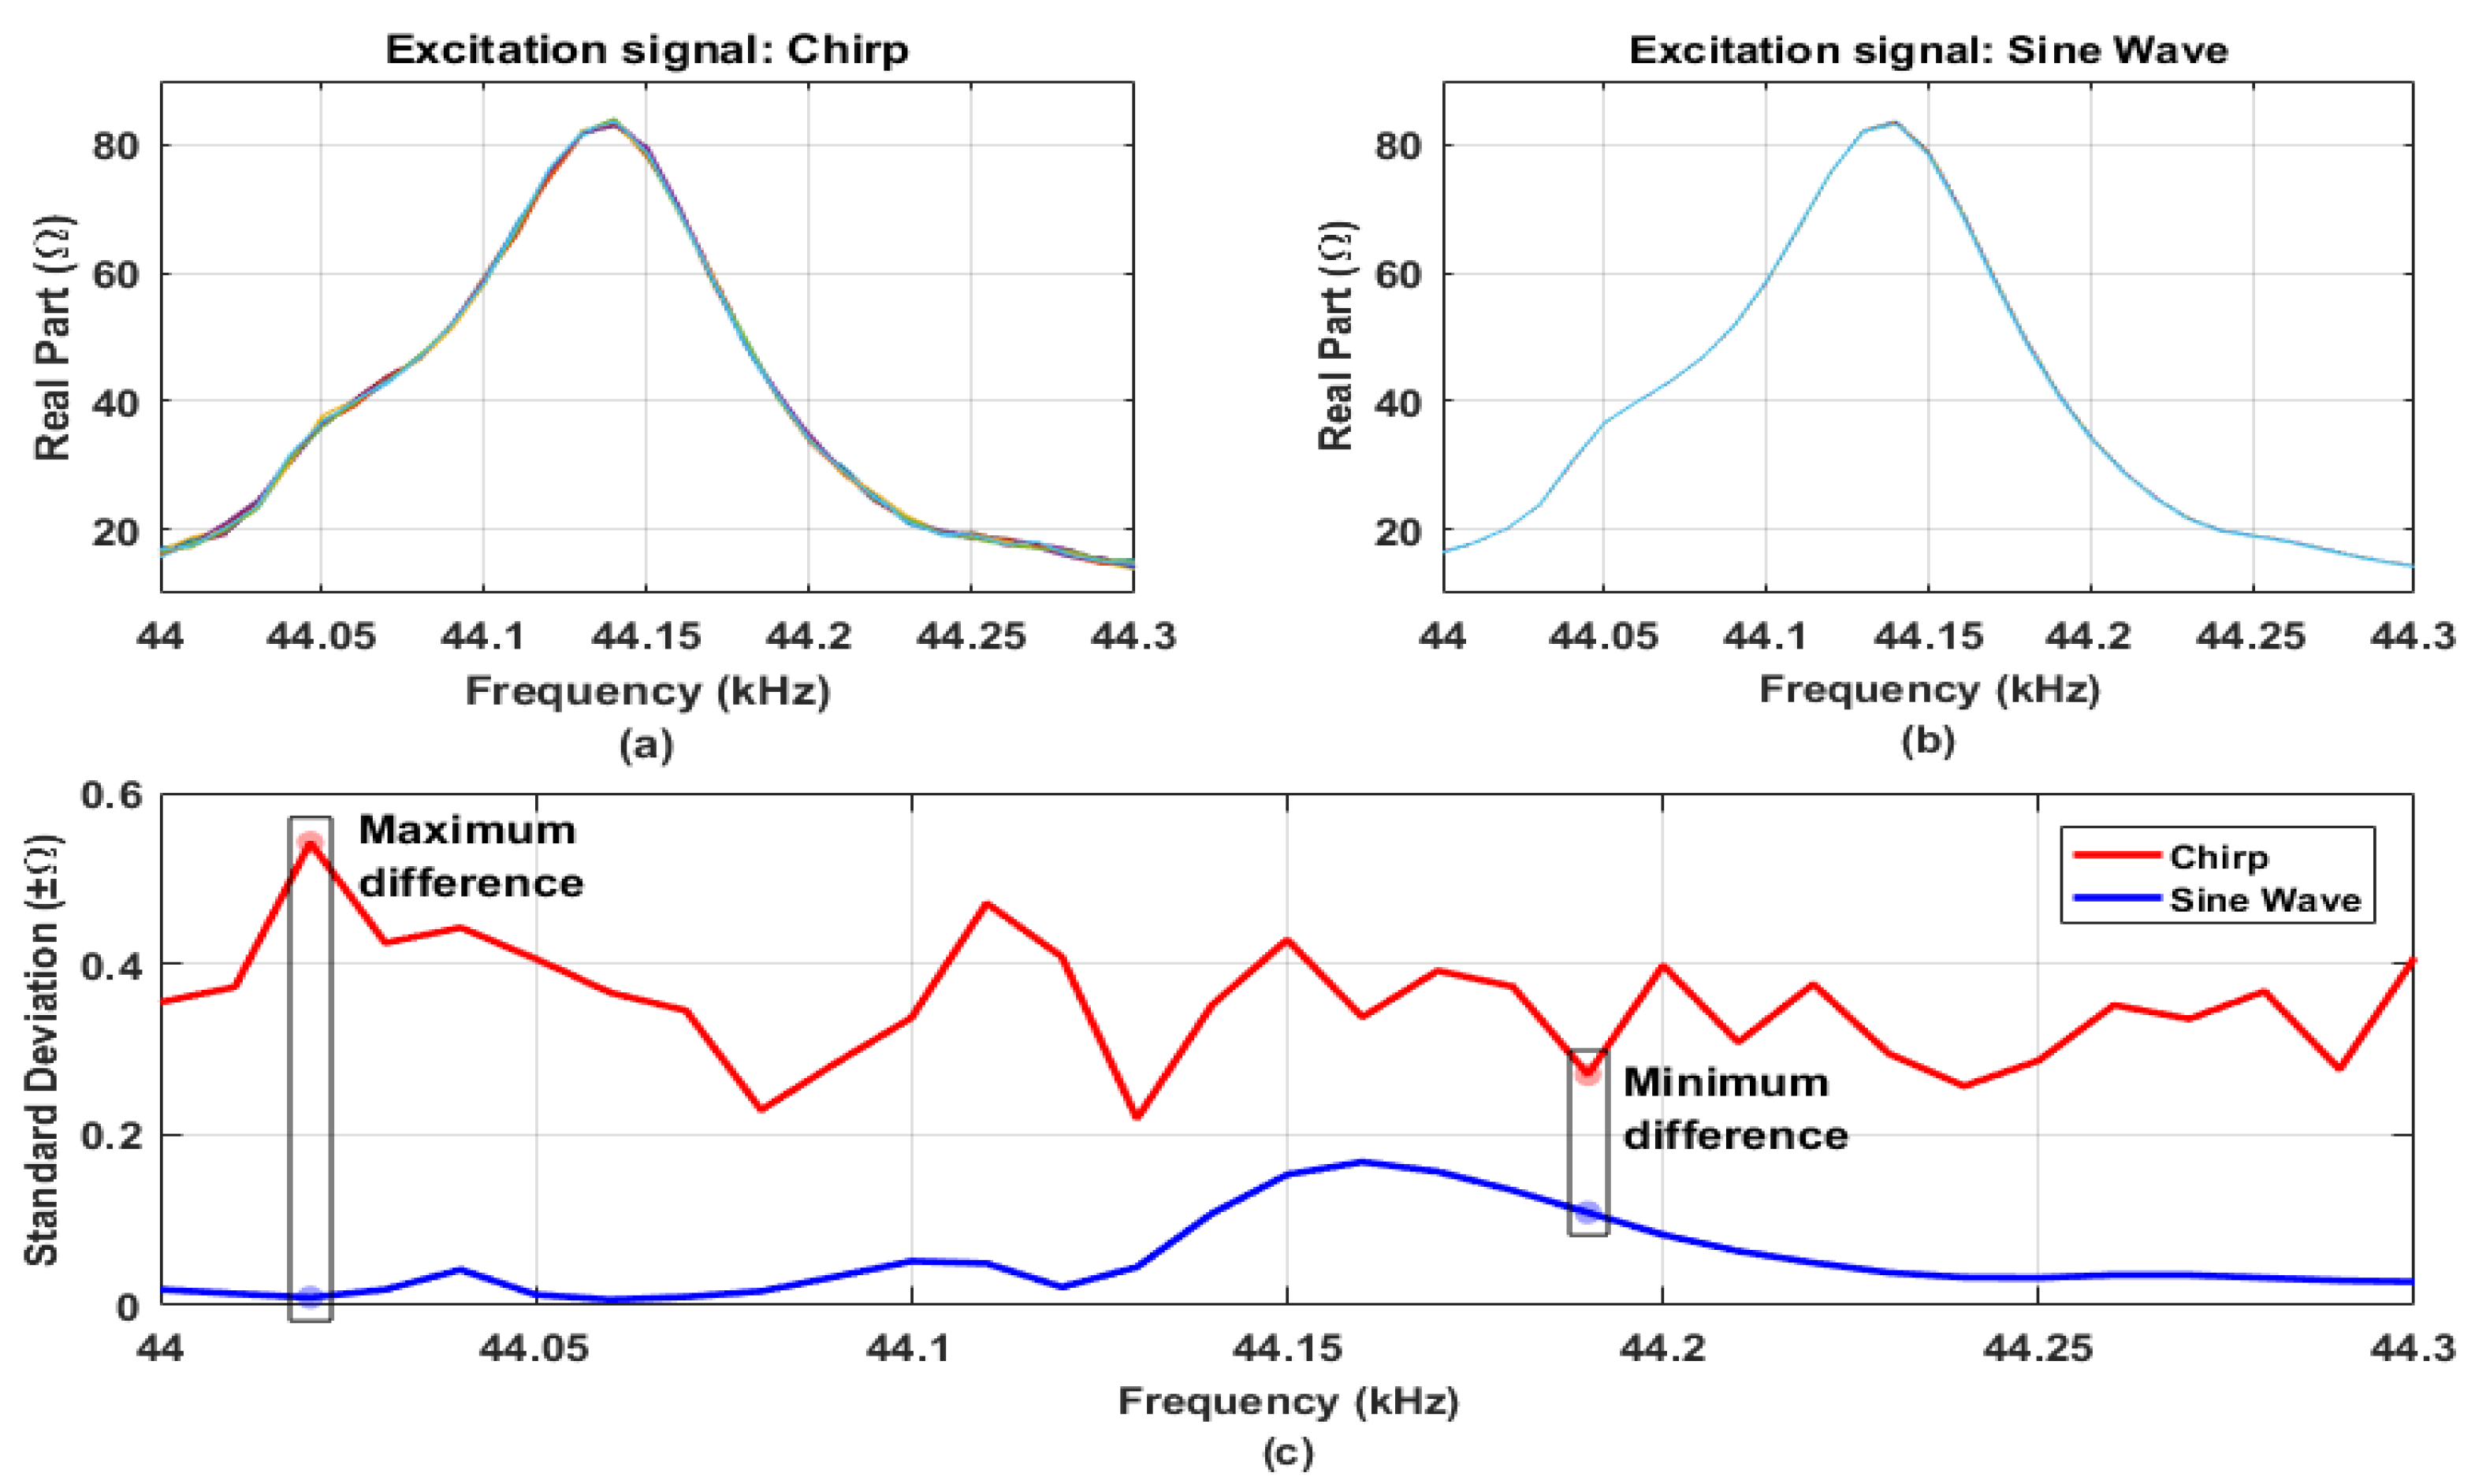
Figure 2a,b show the real part of the impedance signatures for a resonance peak between 44 kHz and 44.3 kHz, as a way of illustrating the dispersion of each system. Furthermore,
Figure 2c shows the standard deviation for the measurements in this same frequency band, point to point.
As can be observed, the method with sine-wave excitation signals presented better precision than the chirp type excitation signal method for all points analyzed. From
Figure 2c, this advantage can be observed quantitatively by analyzing the standard deviation among the twenty measurements performed for each method. The largest difference between the standard deviations of the systems occurred at the frequency of 44,020 Hz, with the deviation of the system with chirp signal being 58.34 times greater than the deviation of the system with sine wave signals, while the smallest difference was in the frequency of 44,190 Hz, being the standard deviation of the system with chirp signal 2.49 times greater than that of the sine-wave system.
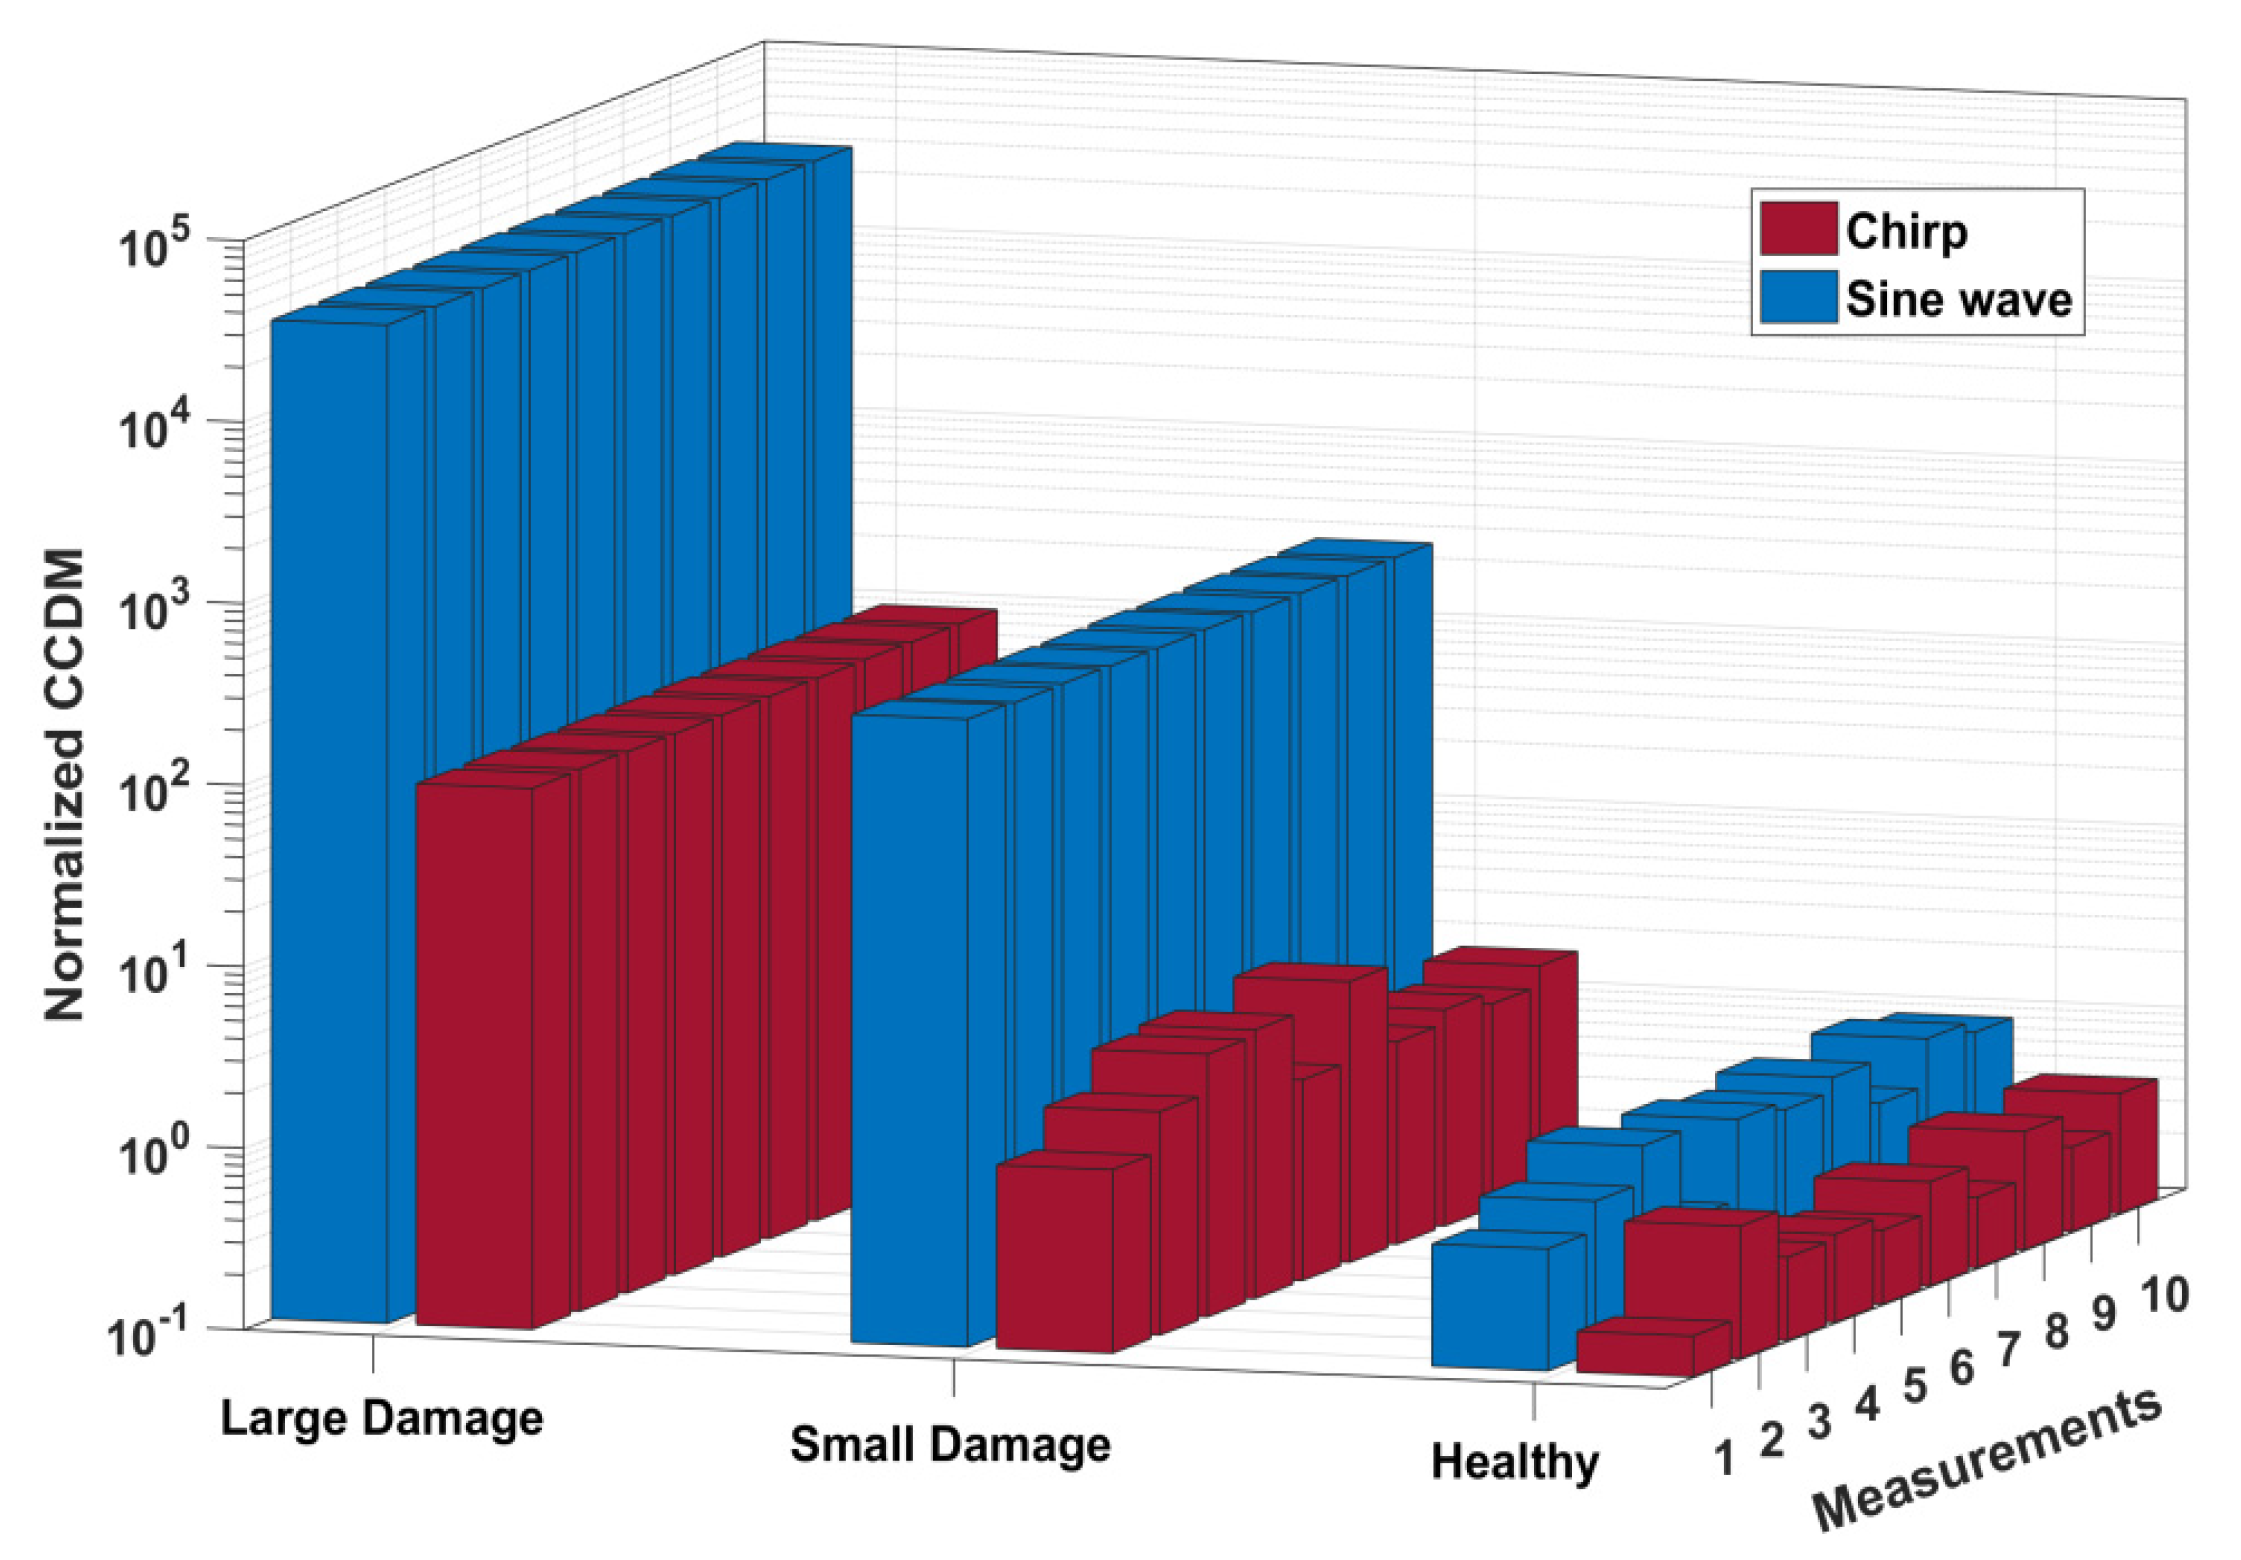
For the second stage of experiments, the aim was to compare the sensitivity of the systems to detect damage in the monitored aluminum bar. Therefore, ten measurements were performed with the structure without damage (Healthy), ten with the sphere attached to the structure (Small Damage) and another ten with the nut (Large Damage).
Figure 3 shows the CCDM indices.
According to
Figure 3, regardless the damage size, the method with sinusoidal signals is more sensitive to damage than the system with chirp signal. In addition, as previously reported in
Figure 2, the precision of the two methods can be further compared by analyzing the indices obtained for the healthy structure. Since the data were normalized, the indices were expected to be unit value. It is important to note that the results presented in this article were obtained from an initial study and a more extensive and detailed analysis is currently under investigation [
10].
5. Conclusions
The results show that both acquisition methods are able to detect damage and, therefore, are suitable for impedance-based SHM applications. However, both methods present important differences in the precision of the measurements and sensitivity to damage. Under the experimental conditions considered in this study, the method using sine waves showed higher precision and sensitivity to damage. This result is important and should be considered in the development of SHM systems, since a more precise and sensitive method can detect incipient structural damage and avoid false-positive diagnoses.


