Novel Food-Safe Spin-Lattice Relaxation Time Calibration Samples for Use in Magnetic Resonance Sensor Development †


Abstract
:1. Introduction
2. Material and Methods
2.1. Sample Preparation
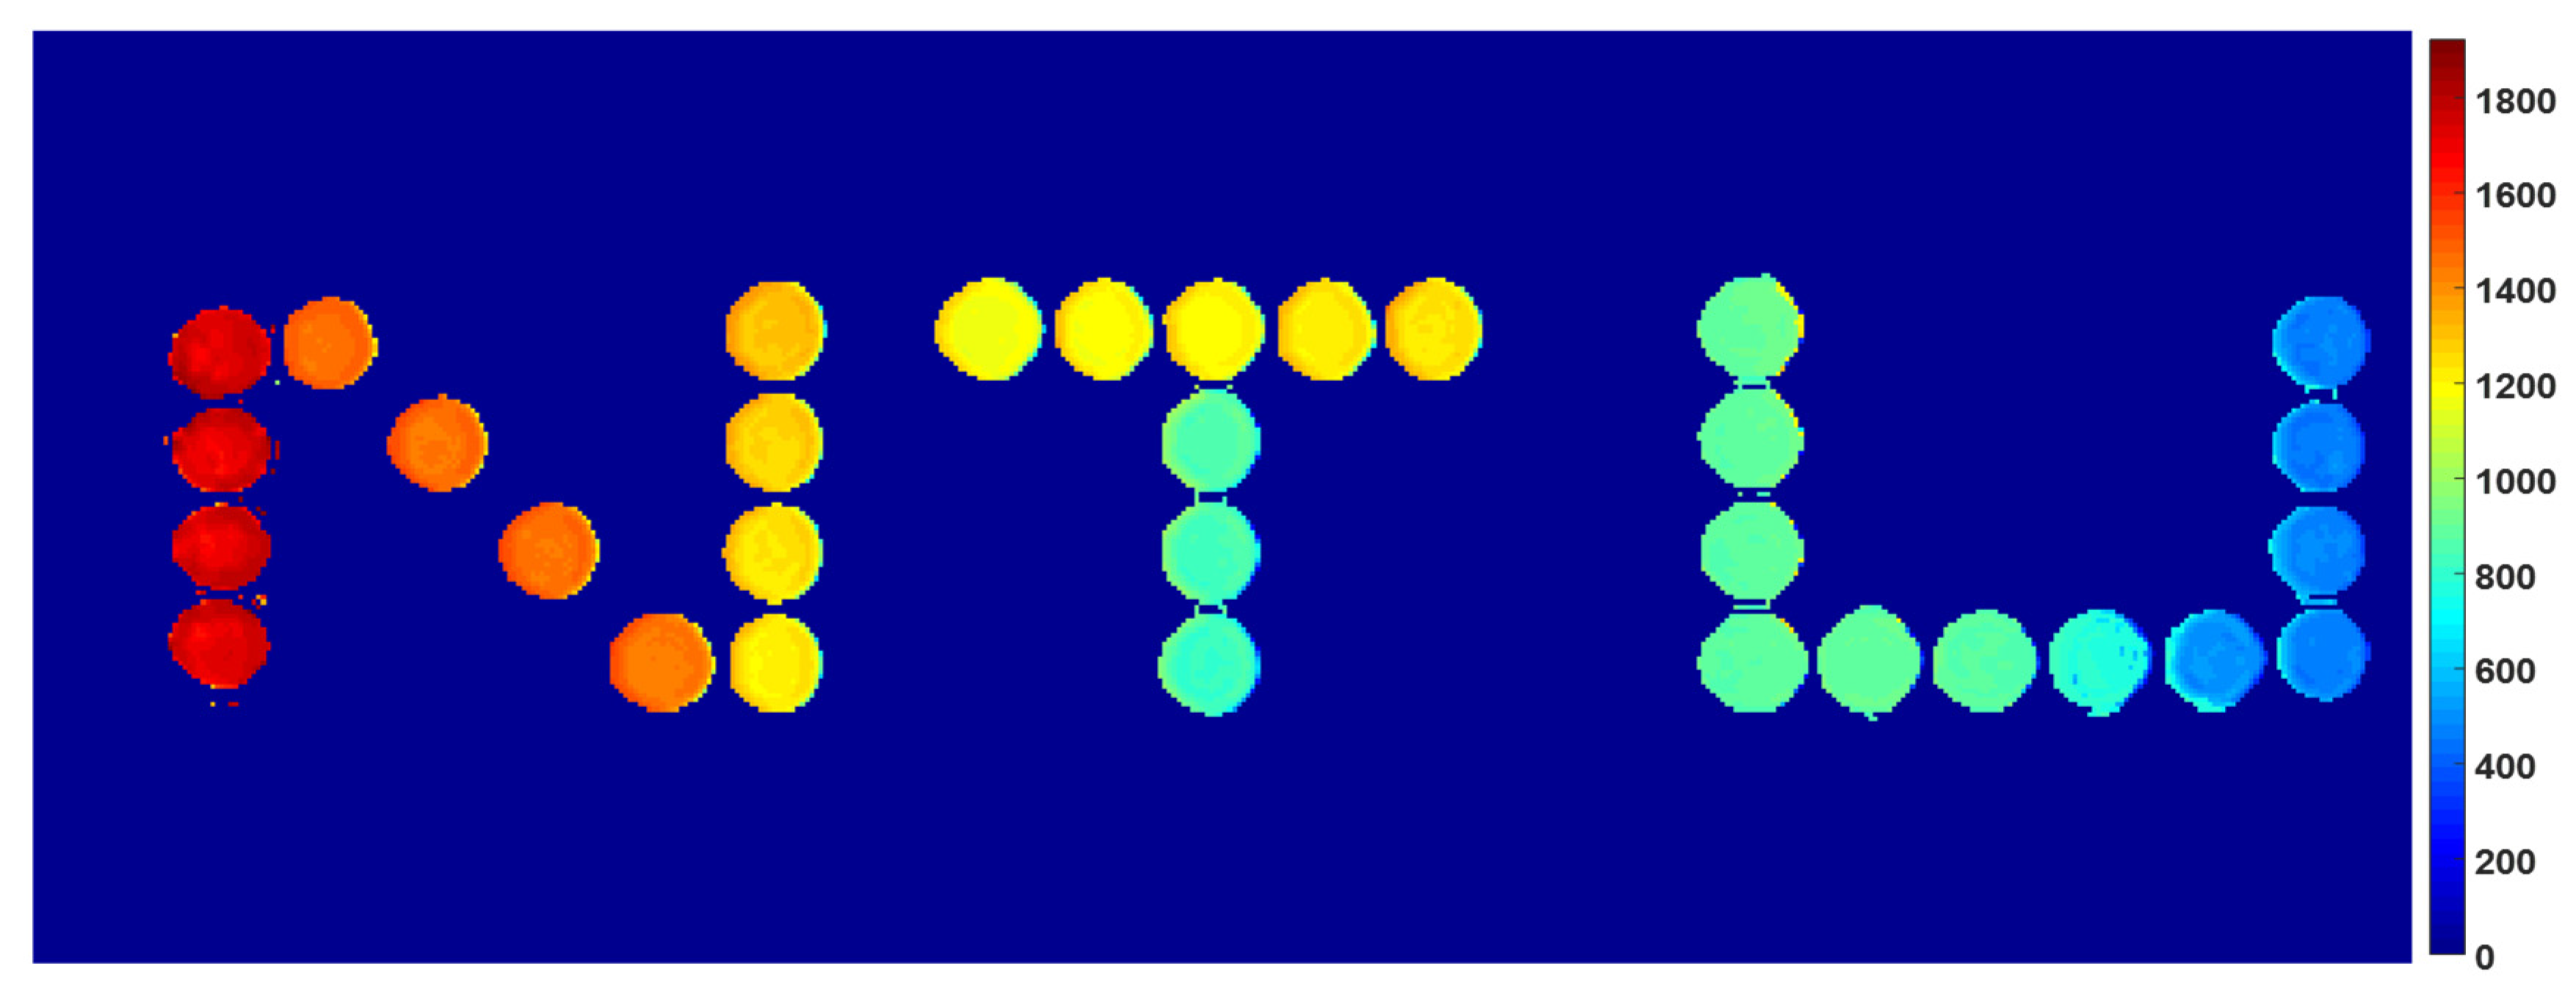
2.2. MRI Measurement
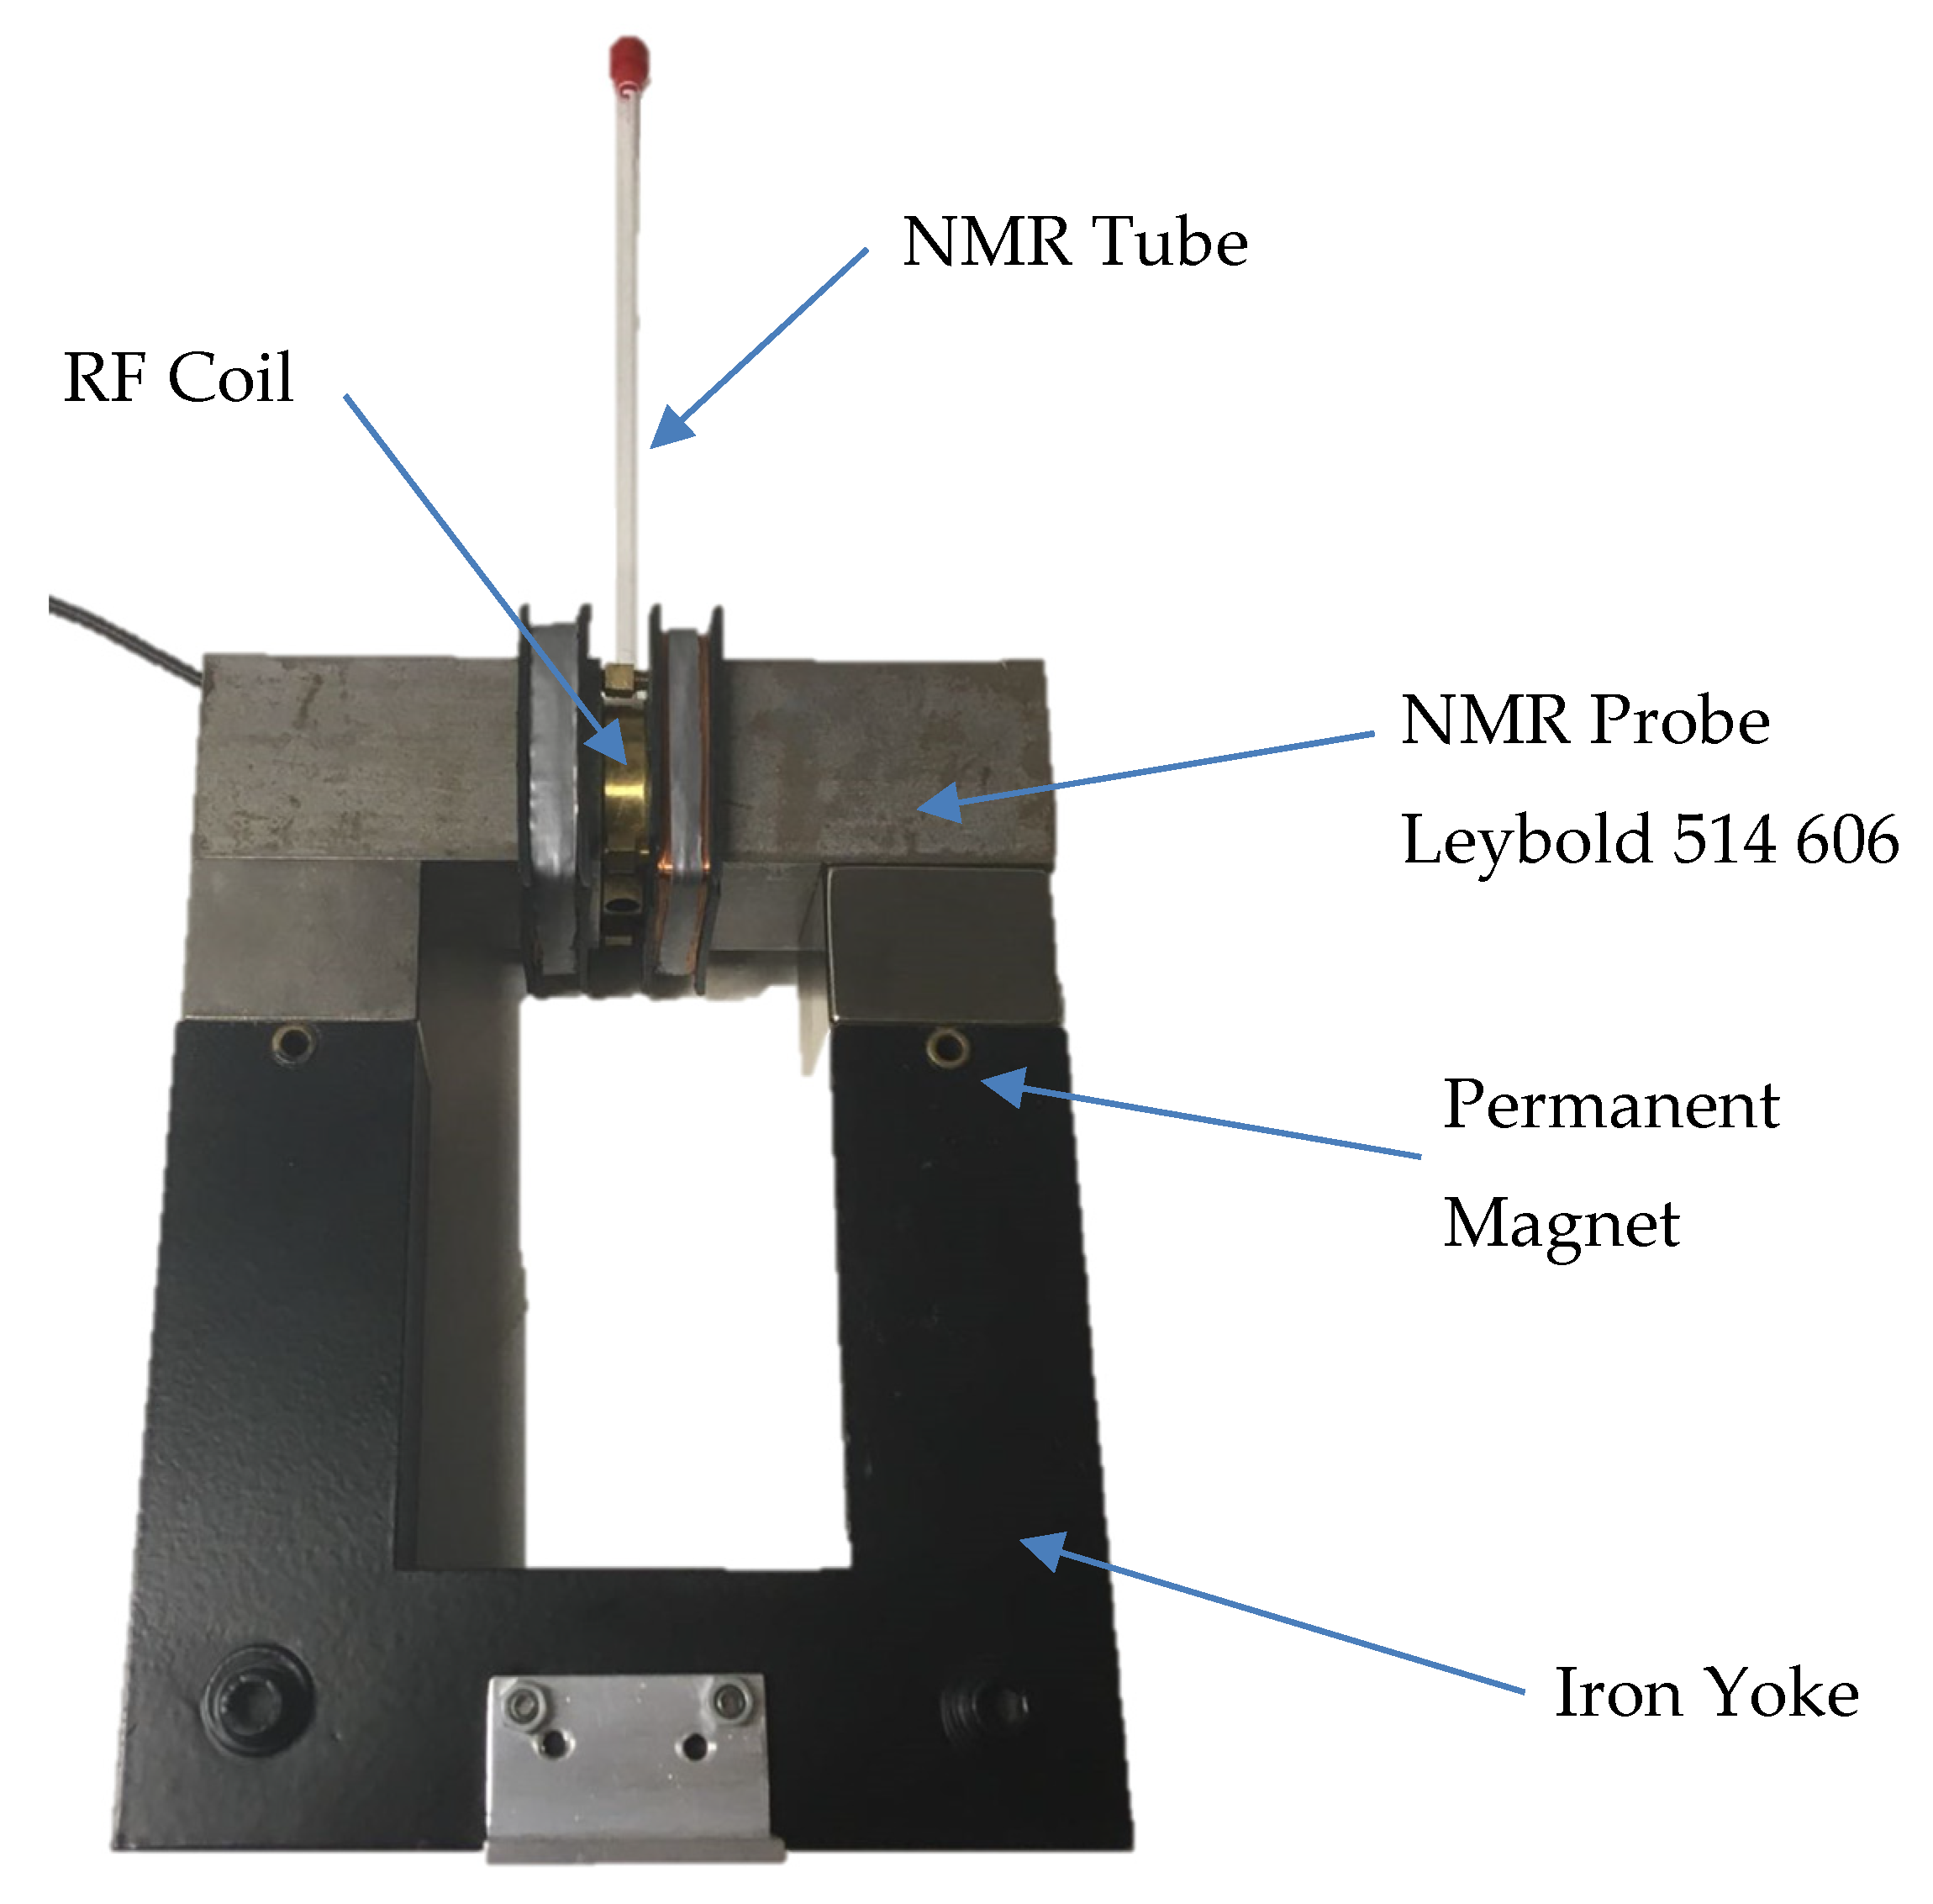
2.3. Magnetic Resonance Sensor Measurement
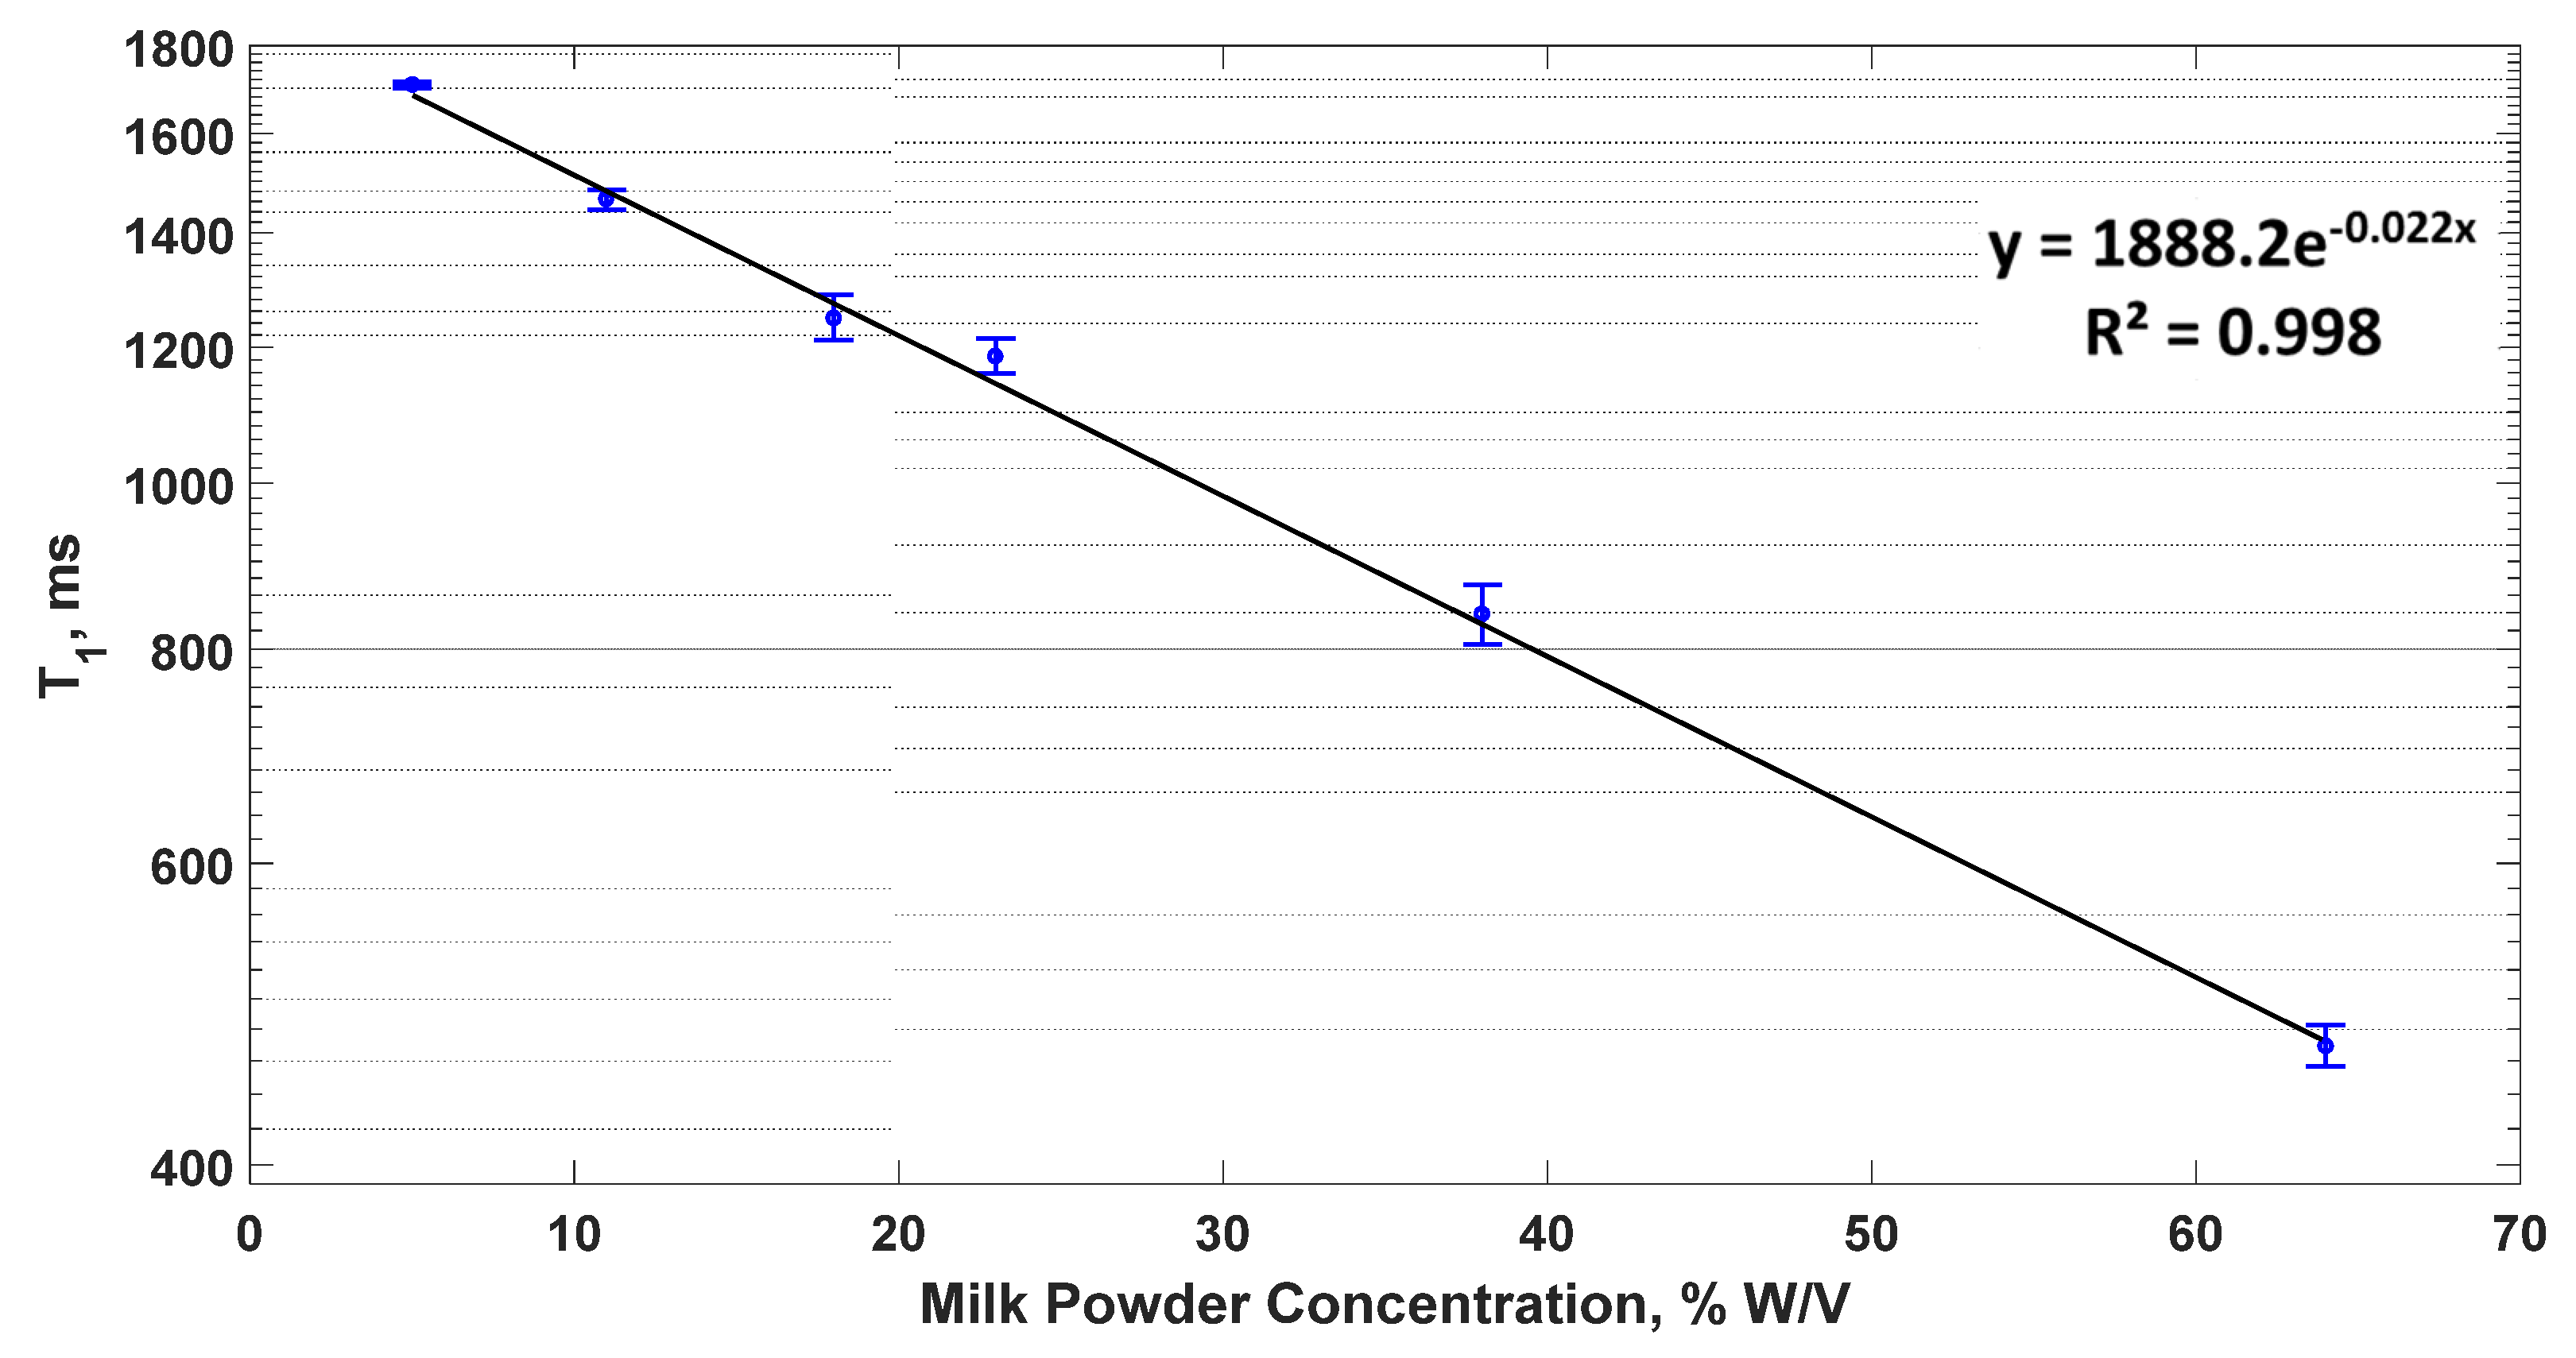
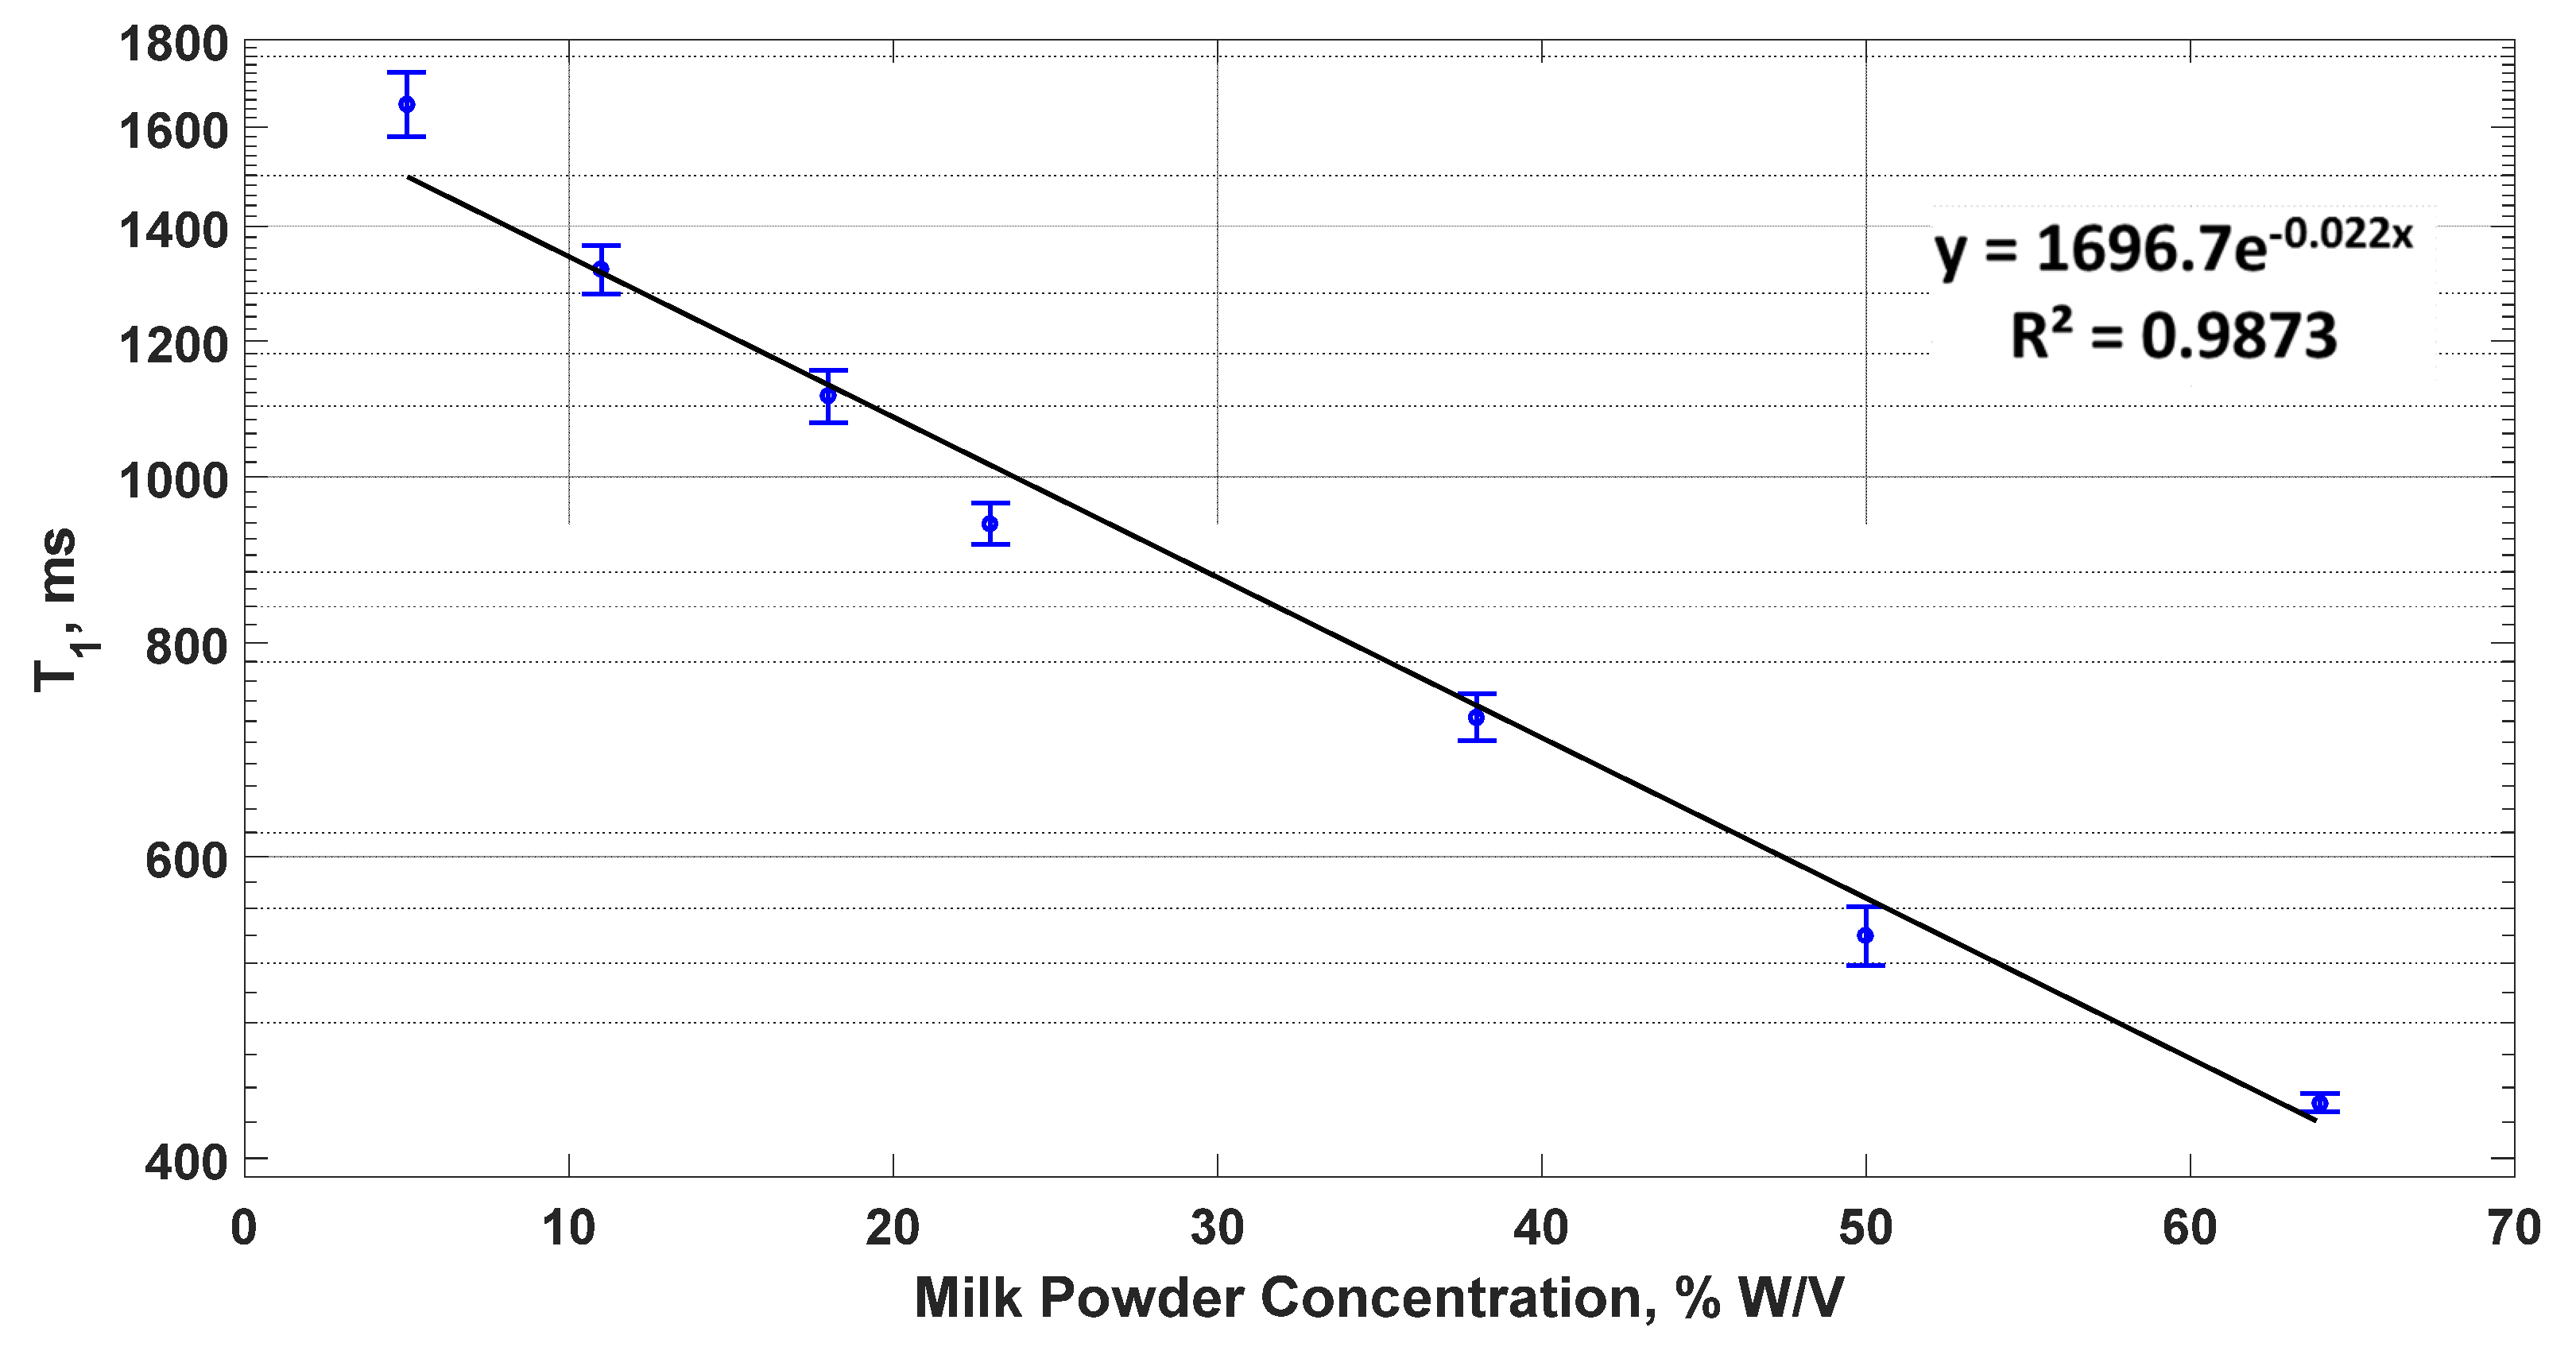
3. Results and Discussion
4. Conclusions
Acknowledgments
Author Contributions
Conflicts of Interest
References
- Blümich, B.; Perlo, J.; Casanova, F. Mobile single-sided NMR. Prog. Nucl. Magn. Reson. Spectrosc. 2008, 52, 197–269. [Google Scholar] [CrossRef]
- Manz, B.; Coy, A.; Dykstra, R.; Eccles, C.D.; Hunter, M.W.; Parkinson, B.J.; Callaghan, P.T. A mobile one-sided NMR sensor with a homogeneous magnetic field: The NMR-MOLE. J. Magn. Reson. 2006, 183, 25–31. [Google Scholar] [CrossRef]
- Blümich, B.; Casanova, F.; Appelt, S. NMR at low magnetic fields. Chem. Phys. Lett. 2009, 477, 231–240. [Google Scholar] [CrossRef]
- Cosgrove, T.; Roberts, C.; Garasanin, T.; Schmidt, R.G.; Gordon, G.V. NMR Spin—Spin relaxation studies of silicate-filled low molecular weight poly (dimethylsiloxane)s. Langmuir 2002, 18, 10080–10085. [Google Scholar] [CrossRef]
- Simon, G.; Birnstiel, A.; Schimmel, K. Network characterisation of end-linked poly (dimethylsiloxane) by 1 H-NMR-spin-spin relaxation. Polym. Bull. 1989, 21, 235–241. [Google Scholar] [CrossRef]
- Christoffersson, J.O.; Olsson, L.; Sjöberg, S. Nickel-doped agarose gel phantoms in MR imaging. Acta Radiol. 1991, 32, 426–431. [Google Scholar] [CrossRef]
- Mitchell, M.D.; Kundel, H.L.; Axel, L.; Joseph, P.M. Agarose as a tissue equivalent phantom material for NMR imaging. Magn. Reson. Imaging 1986, 4, 263–266. [Google Scholar] [CrossRef]
- Métais, A.; Cambert, M.; Riaublanc, A.; Mariette, F. Effects of casein and fat content on water self-diffusion coefficients in casein systems: A pulsed field gradient nuclear magnetic resonance study. J. Agric. Food Chem. 2004, 52, 3988–3995. [Google Scholar] [CrossRef] [PubMed]
- Todt, H.; Guthausen, G.; Burk, W.; Schmalbein, D.; Kamlowski, A. Water/moisture and fat analysis by time-domain NMR. Food Chem. 2006, 96, 436–440. [Google Scholar] [CrossRef]
- MRI Toolbox Website. Available online: http://www.mritoolbox.com/ParameterFitting.htm1 (accessed on 19 October 2017).
- Colsenet, R.; Mariette, F.; Cambert, M. NMR relaxation and water self-diffusion studies in whey protein solutions and gels. J. Agric. Food Chem. 2005, 53, 6784–6790. [Google Scholar] [CrossRef] [PubMed]
Publisher’s Note: MDPI stays neutral with regard to jurisdictional claims in published maps and institutional affiliations. |
© 2018 by the authors. Licensee MDPI, Basel, Switzerland. This article is an open access article distributed under the terms and conditions of the Creative Commons Attribution (CC BY) license (https://creativecommons.org/licenses/by/4.0/).
Share and Cite
Almazrouei, N.K.; Newton, M.I.; Dye, E.R.; Morris, R.H. Novel Food-Safe Spin-Lattice Relaxation Time Calibration Samples for Use in Magnetic Resonance Sensor Development. Proceedings 2018, 2, 122. https://doi.org/10.3390/ecsa-4-04916
Almazrouei NK, Newton MI, Dye ER, Morris RH. Novel Food-Safe Spin-Lattice Relaxation Time Calibration Samples for Use in Magnetic Resonance Sensor Development. Proceedings. 2018; 2(3):122. https://doi.org/10.3390/ecsa-4-04916
Chicago/Turabian StyleAlmazrouei, Najlaa K., Michael I. Newton, Elizabeth R. Dye, and Robert H. Morris. 2018. "Novel Food-Safe Spin-Lattice Relaxation Time Calibration Samples for Use in Magnetic Resonance Sensor Development" Proceedings 2, no. 3: 122. https://doi.org/10.3390/ecsa-4-04916
APA StyleAlmazrouei, N. K., Newton, M. I., Dye, E. R., & Morris, R. H. (2018). Novel Food-Safe Spin-Lattice Relaxation Time Calibration Samples for Use in Magnetic Resonance Sensor Development. Proceedings, 2(3), 122. https://doi.org/10.3390/ecsa-4-04916