Wireless System Integration to Enable Smart Cities and Smart Regions †

 ,
,  ,
,  ,
,  ,
,  and
and 
Abstract
:1. Introduction
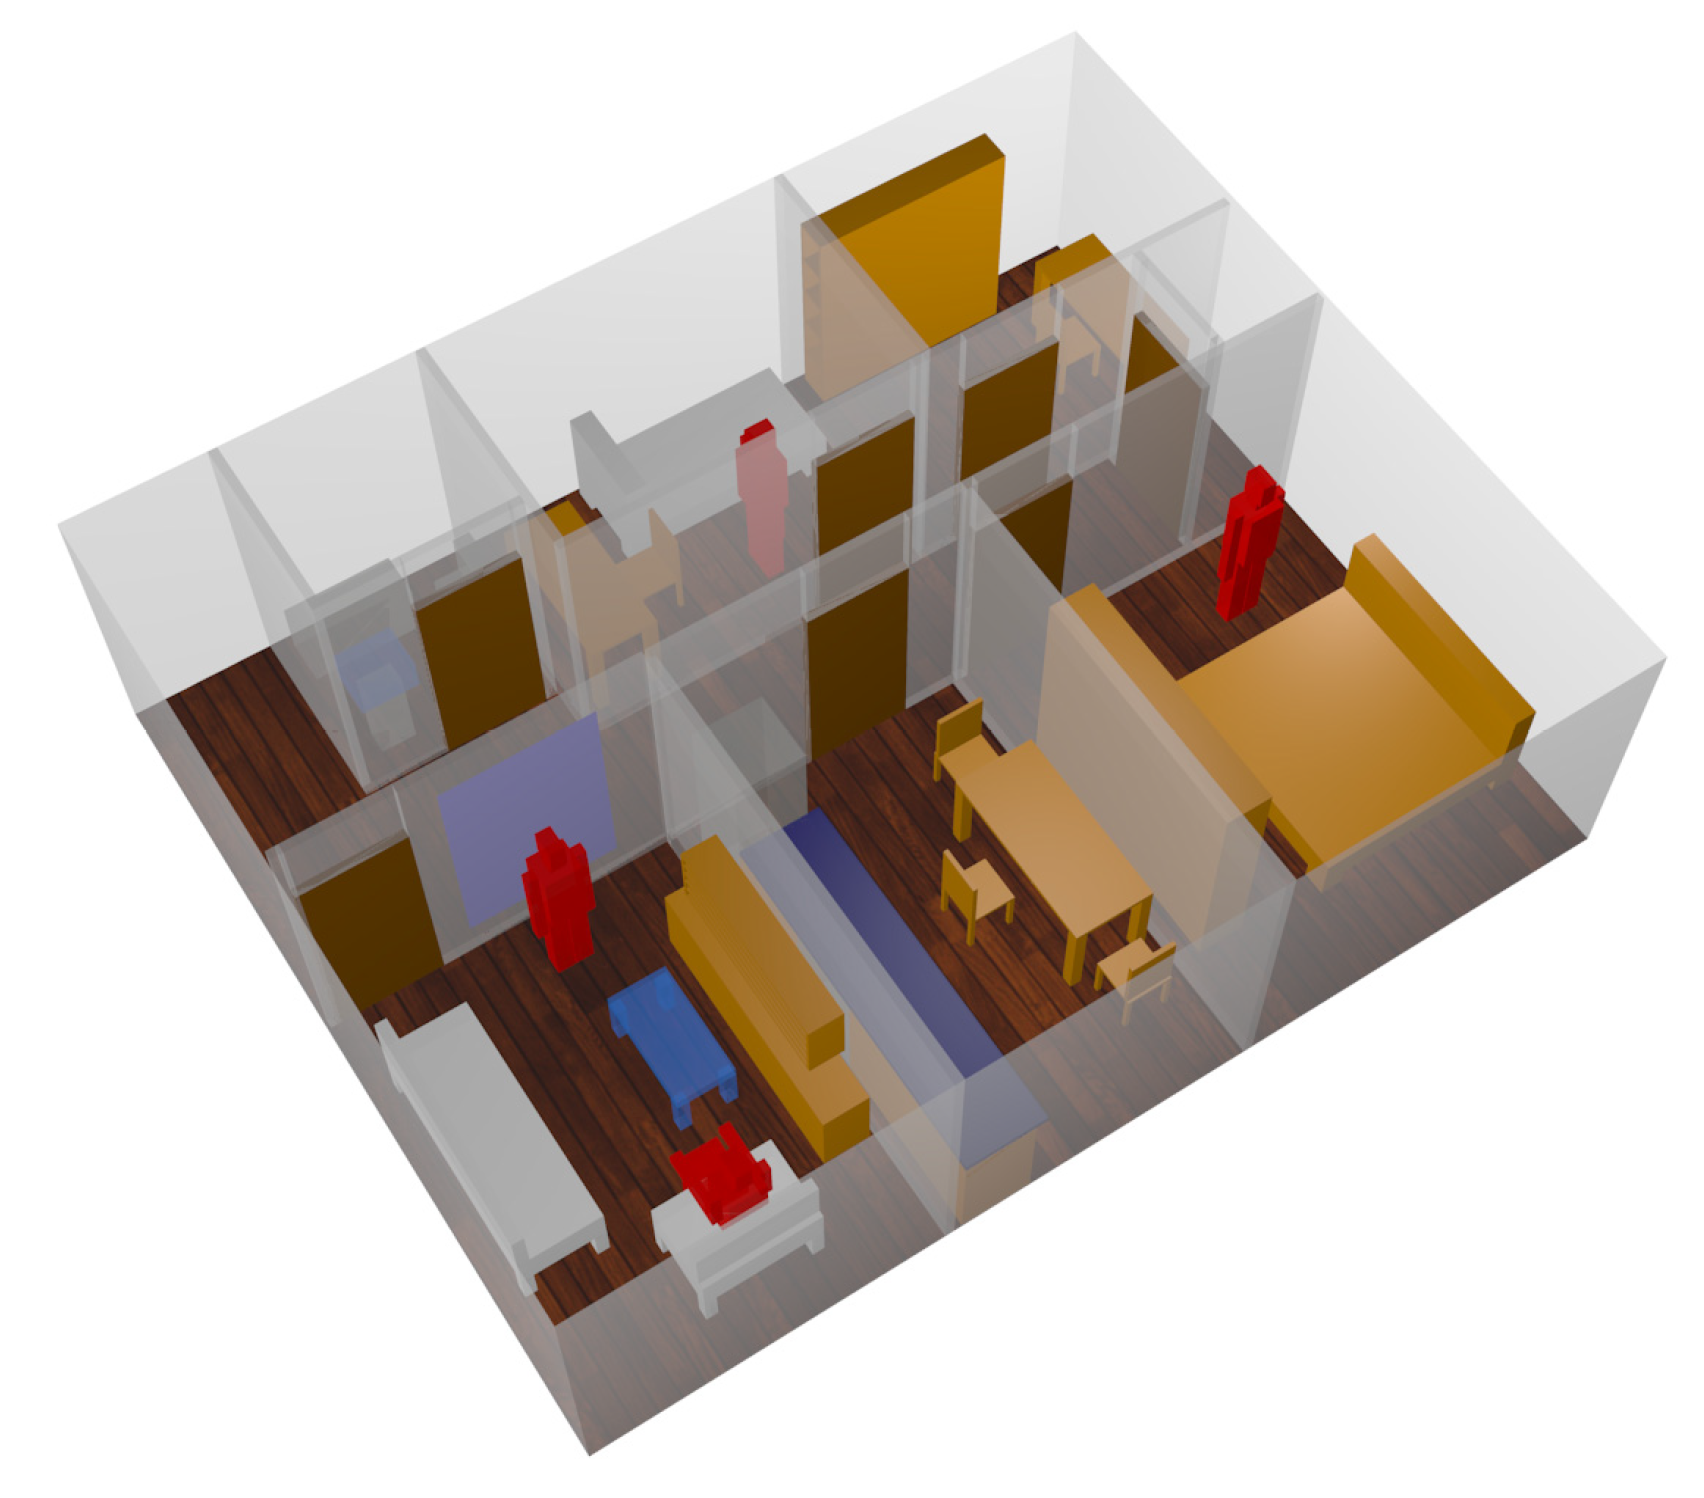
2. Scenario Description and Wireless System Analysis
3. Conclusions
Acknowledgments
Author Contributions
Conflicts of Interest
Abbreviations
| WSN | Wireless Sensor Network |
| WLAN | Wireless Local Area Network |
| WBAN | Wireless Body Area Network |
| WPAN | Wireless Personal Area Network |
| PLMN | Public Land Mobile Networks |
| IoT | Internet of Things |
| MCS | Modulation and Coding Scheme |
References
- López-Iturri, P.; Aguirre, E.; Azpilicueta, L.; Astrain, J.J.; Villandangos, J.; Falcone, F. Challenges in Wireless System Integration as Enablers for Indoor Context Aware Environments. Sensors 2017, 17, 1616. [Google Scholar] [CrossRef] [PubMed]
- Sesma, I.; Azpilicueta, L.; Astrain, J.J.; Villadangos, J.; Falcone, F. Analysis of challenges in the application of deterministic wireless channel modelling in the implementation of WLAN-based indoor location system in large complex scenarios. Int. J. Ad Hoc Ubiquitous Comput. 2014, 15, 171–184. [Google Scholar] [CrossRef]
- Azpilicueta, L.; Rawat, M.; Rawat, K.; Ghannouchi, F.; Falcone, F. A Ray Launching-Neural Network Approach for Radio Wave Propagation Analysis in Complex Indoor Environments. IEEE Trans. Antennas Propag. 2014, 62, 2777–2786. [Google Scholar] [CrossRef]
- Azpilicueta, L.; Rawat, M.; Rawat, K.; Ghannouchi, F.; Falcone, F. Convergence analysis in deterministic 3D ray launching radio channel estimation in complex environments. Appl. Comput. Electromagn. Soc. J. 2014, 29, 256–271. [Google Scholar]


| Parameter | Value |
|---|---|
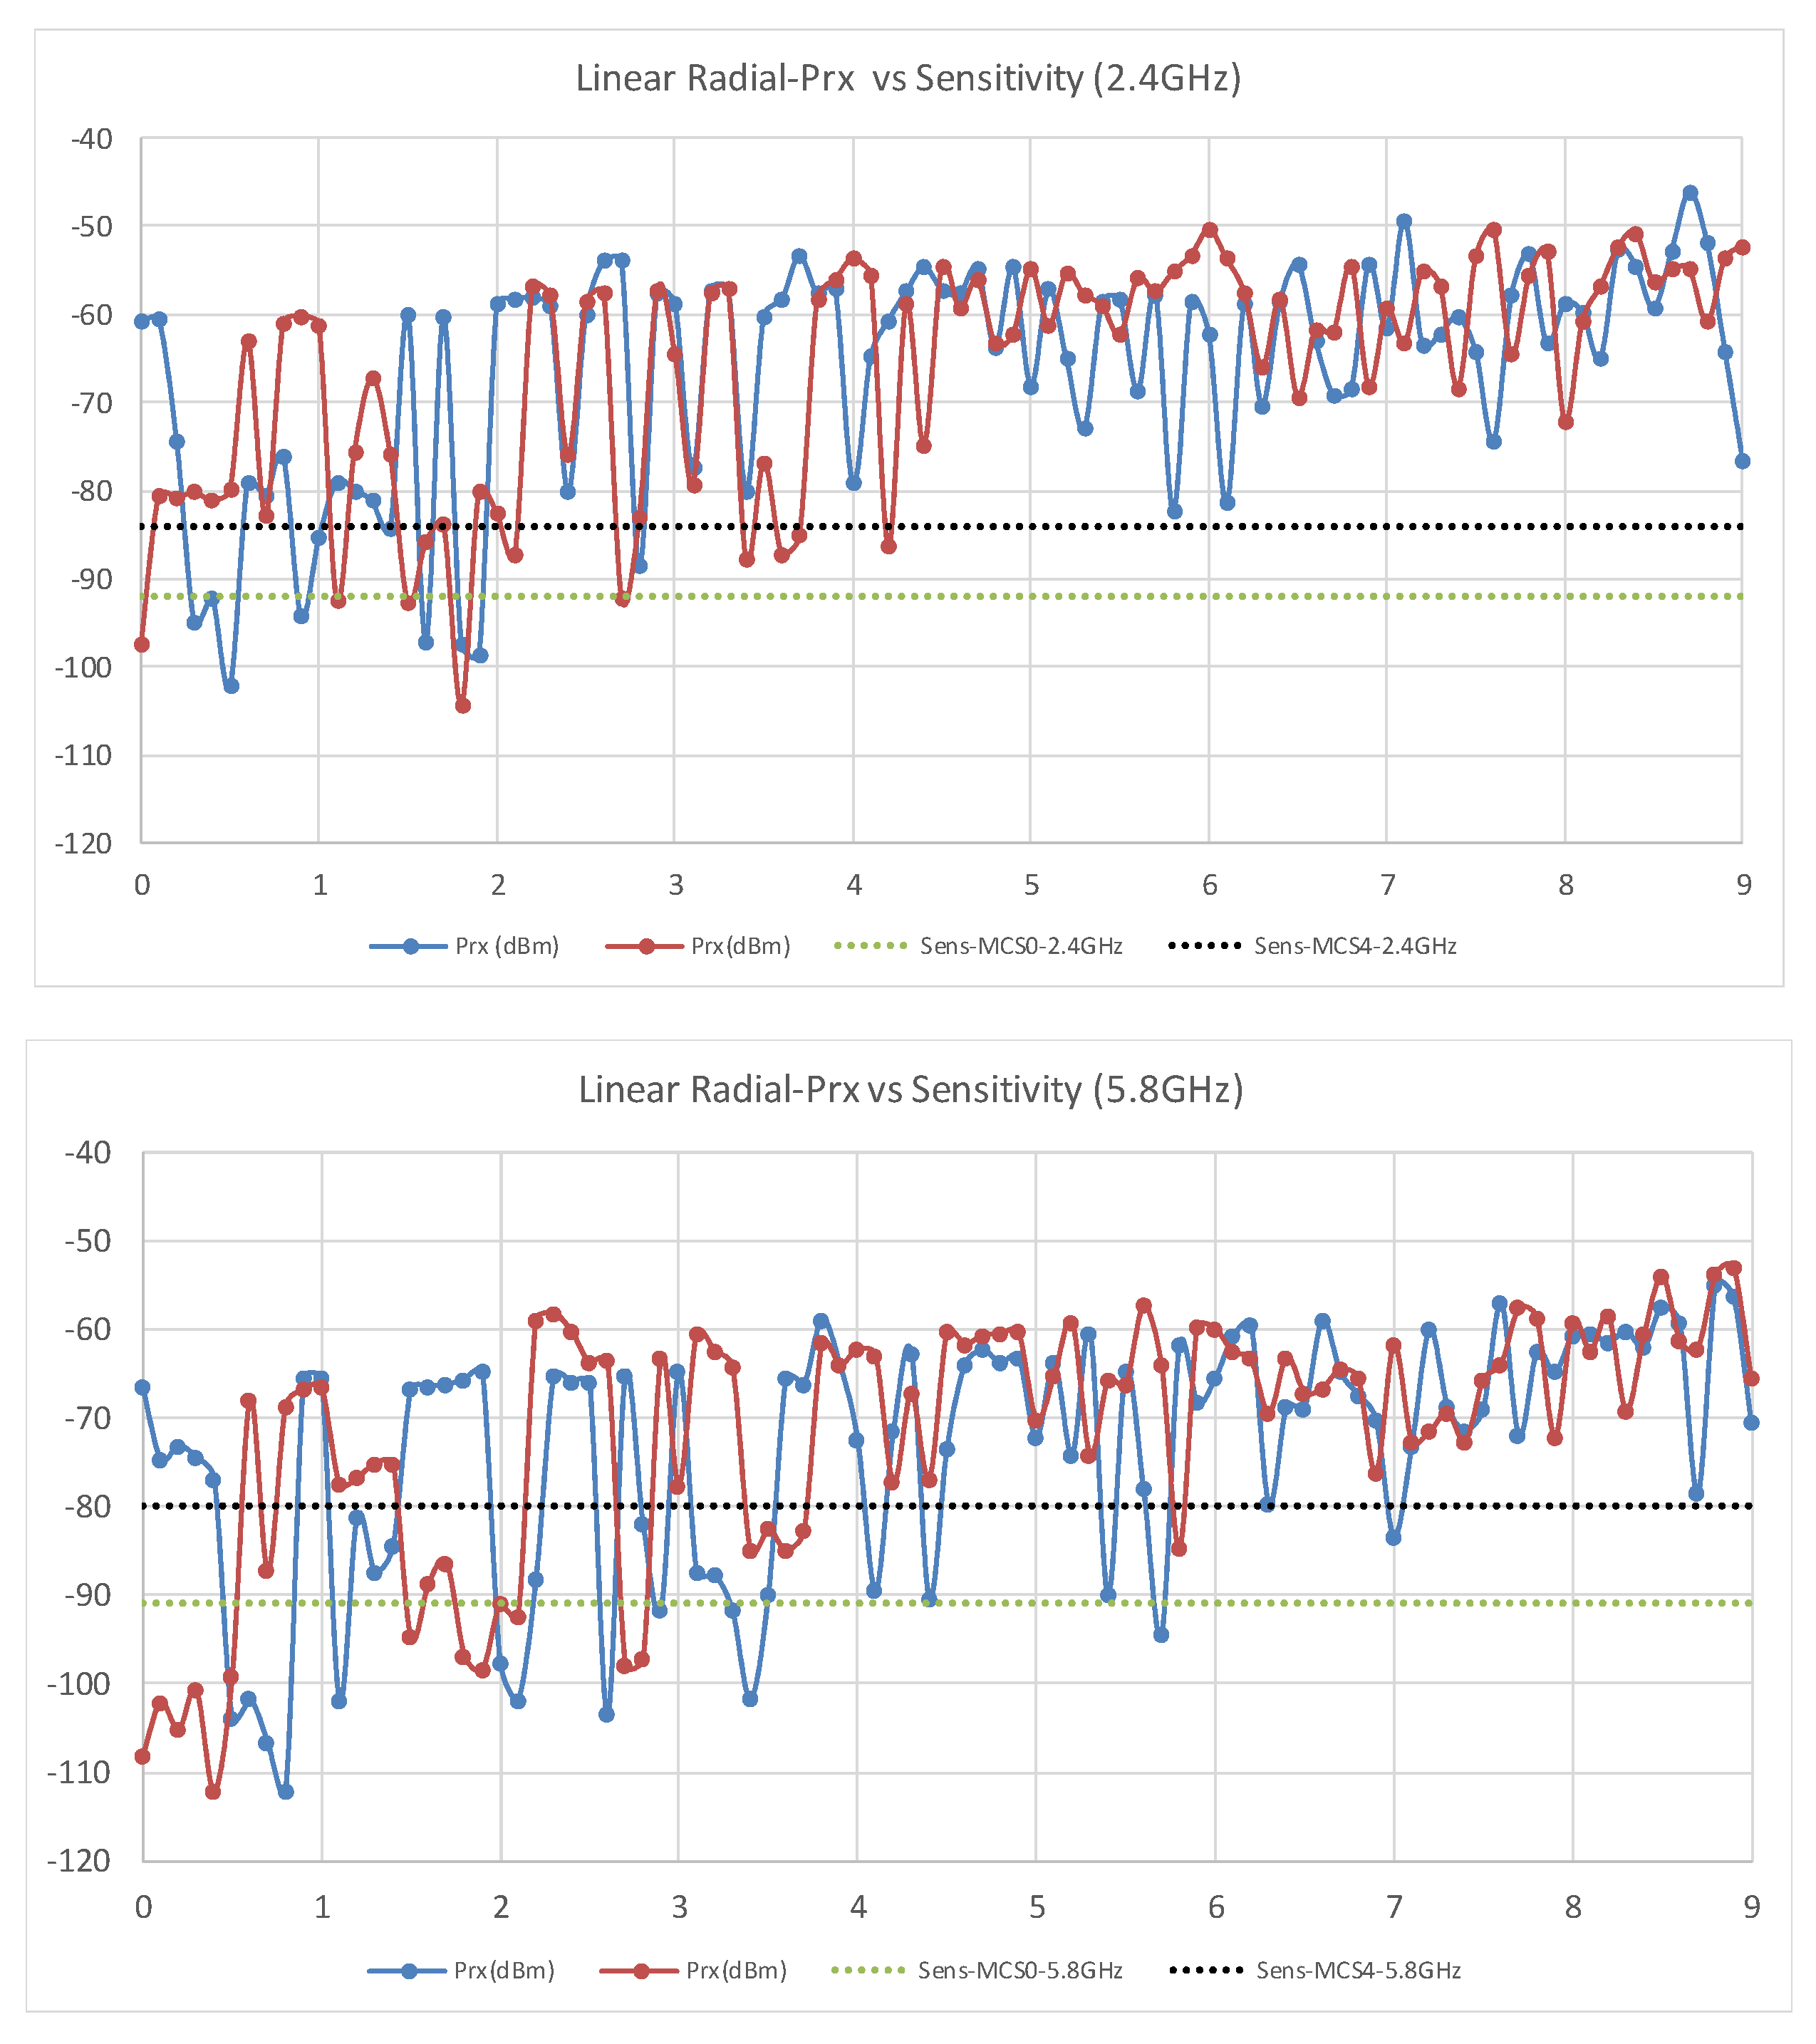
| Operation frequency | 2.45 GHz/5.8 GHz |
| Output power level | 0–10 dBm |
| Permitted reflections | 6 |
| Cuboid resolution | 0.1 m–0.3 m |
| Launched Rays resolution | 1° |
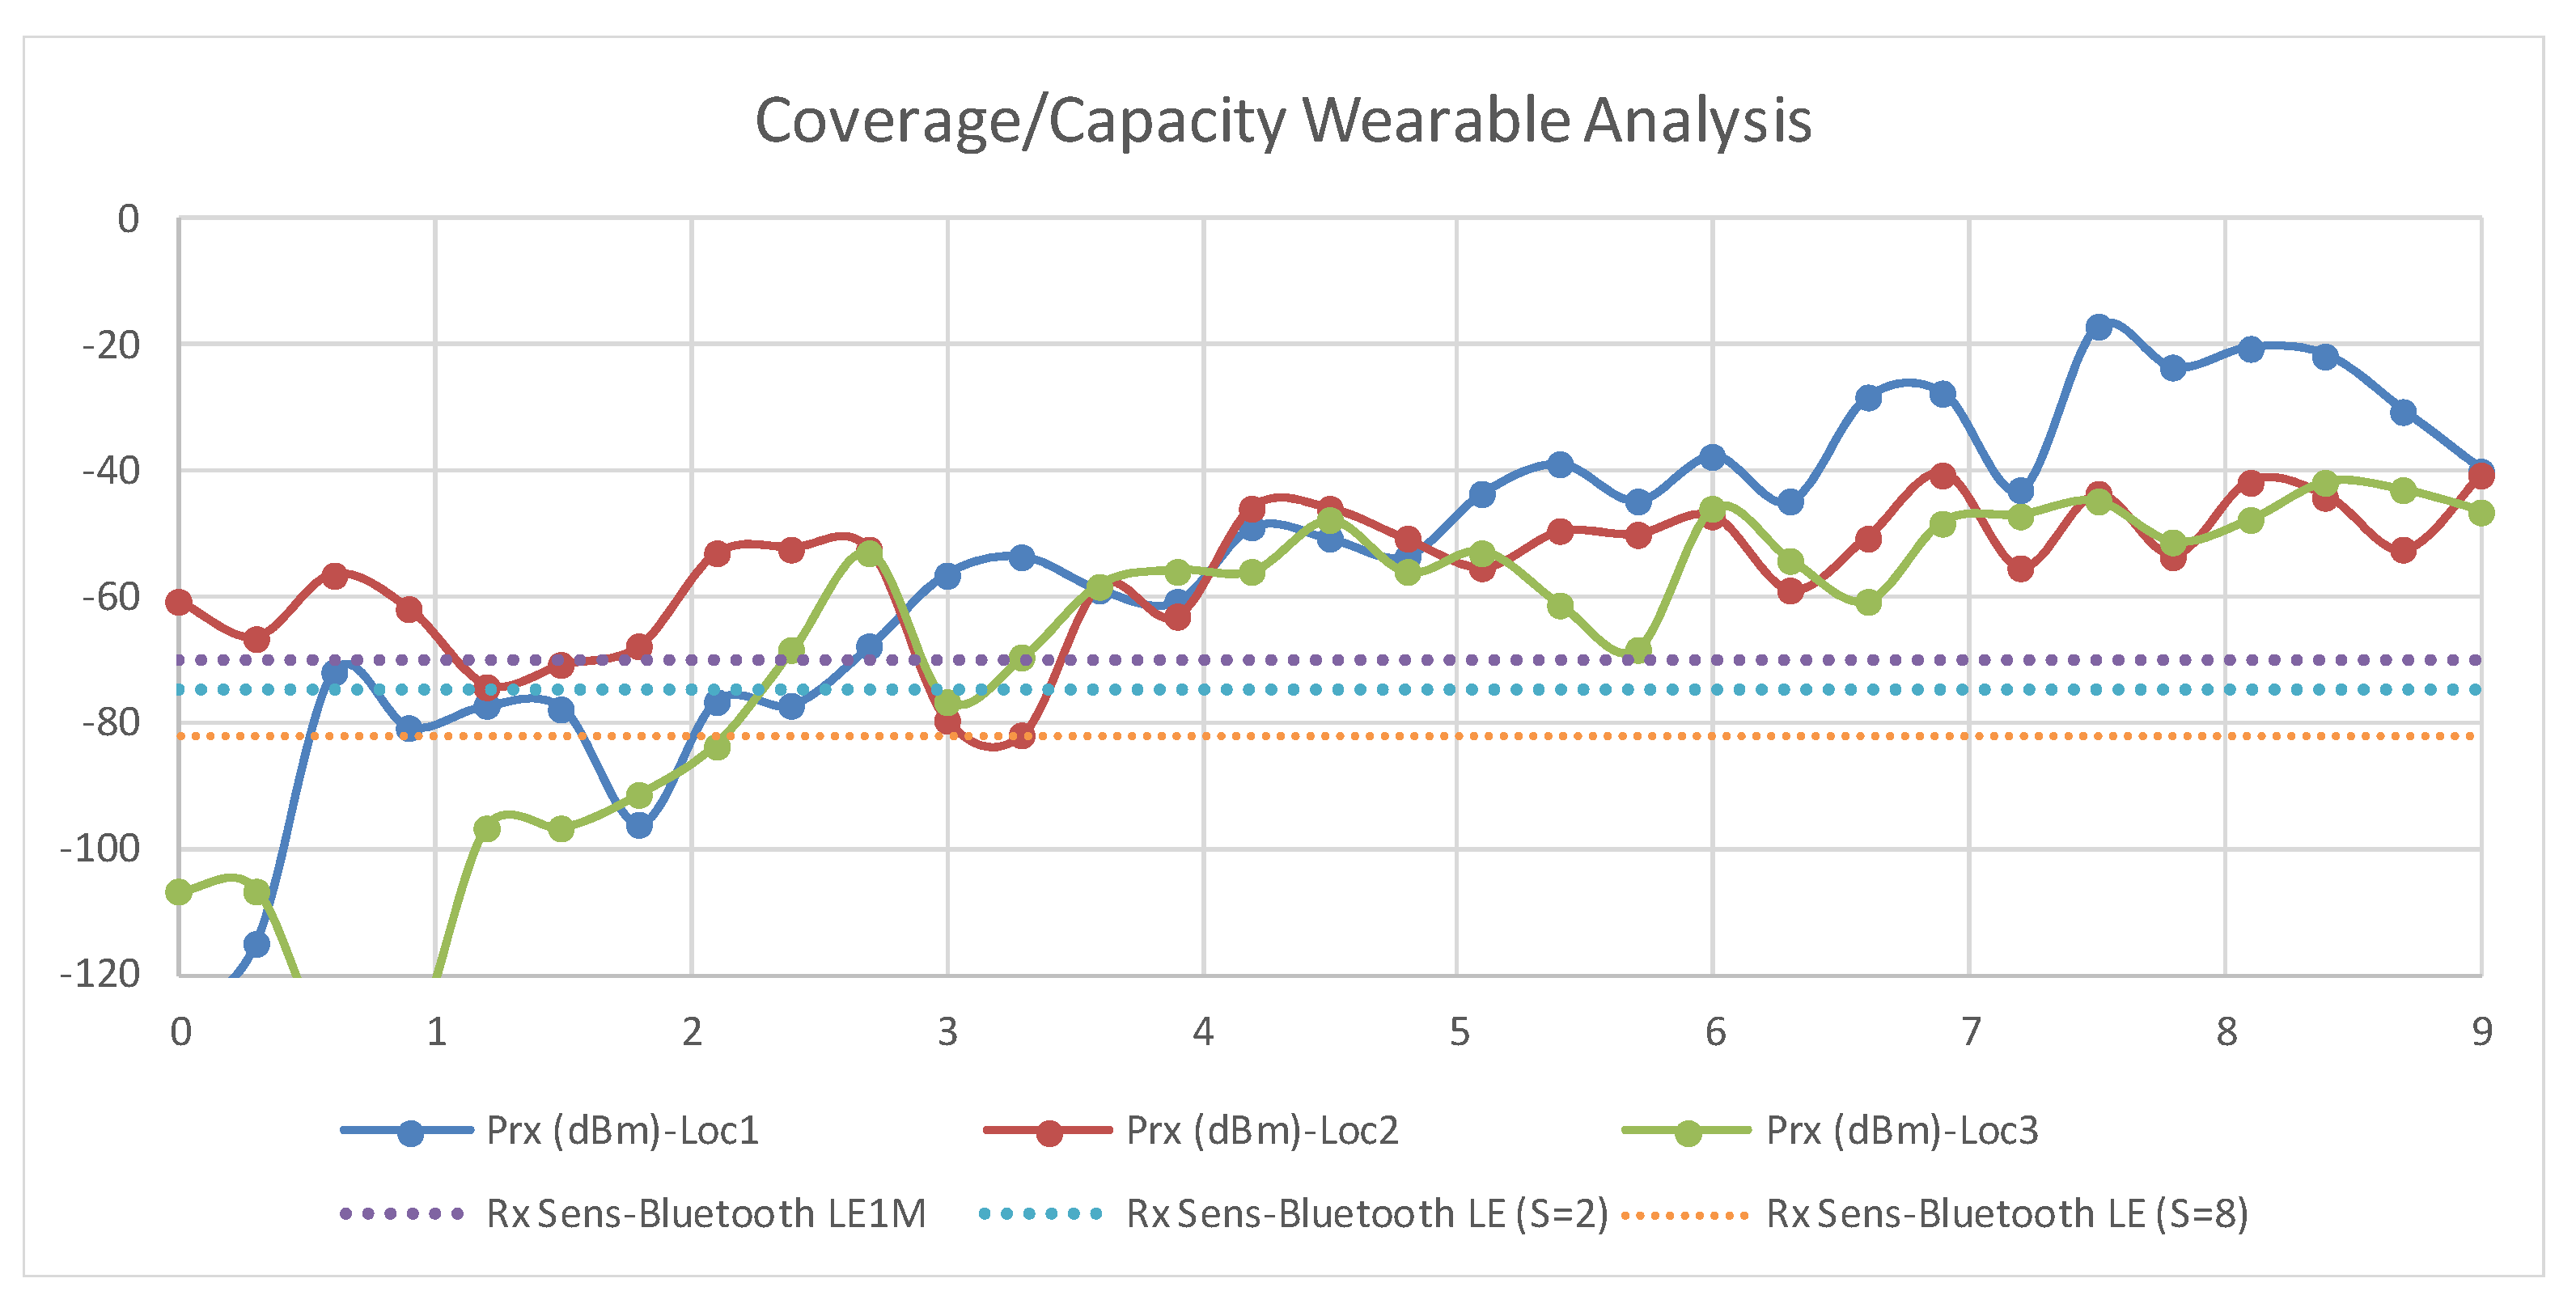
| Modulation and Coding Schemes | 802.11n MCS-0, 802.11n MCS-4, Bluetooth LE1M, Bluetooth LE (S = 2), Bluetooth LE (S = 8) |
Publisher’s Note: MDPI stays neutral with regard to jurisdictional claims in published maps and institutional affiliations. |
© 2018 by the authors. Licensee MDPI, Basel, Switzerland. This article is an open access article distributed under the terms and conditions of the Creative Commons Attribution (CC BY) license (https://creativecommons.org/licenses/by/4.0/).
Share and Cite
Azpilicueta, L.; Lopez-Iturri, P.; Aguirre, E.; Astrain, J.J.; Villadangos, J.; Falcone, F. Wireless System Integration to Enable Smart Cities and Smart Regions. Proceedings 2018, 2, 109. https://doi.org/10.3390/ecsa-4-04909
Azpilicueta L, Lopez-Iturri P, Aguirre E, Astrain JJ, Villadangos J, Falcone F. Wireless System Integration to Enable Smart Cities and Smart Regions. Proceedings. 2018; 2(3):109. https://doi.org/10.3390/ecsa-4-04909
Chicago/Turabian StyleAzpilicueta, Leyre, Peio Lopez-Iturri, Erik Aguirre, Jose J. Astrain, Jesús Villadangos, and Francisco Falcone. 2018. "Wireless System Integration to Enable Smart Cities and Smart Regions" Proceedings 2, no. 3: 109. https://doi.org/10.3390/ecsa-4-04909
APA StyleAzpilicueta, L., Lopez-Iturri, P., Aguirre, E., Astrain, J. J., Villadangos, J., & Falcone, F. (2018). Wireless System Integration to Enable Smart Cities and Smart Regions. Proceedings, 2(3), 109. https://doi.org/10.3390/ecsa-4-04909