Proceeding Paper

How to Define the Urban Comfort in the Era of Smart Cities through the Use of the Do-It-Yourself Approach and New Pervasive Technologies †

ITC-CNR, Construction Technologies Institute—National Research Council of Italy, Lombardia Str., 49-20098 San Giuliano Milanese, Italy
*
Author to whom correspondence should be addressed.
Presented at the 4th International Electronic Conference on Sensors and Applications, 15–30 November 2017; Available online: http://sciforum.net/conference/ecsa-4.
Proceedings 2018, 2(3), 115; https://doi.org/10.3390/ecsa-4-04921
Published: 14 November 2017

Abstract

:
The “Smart” concept applied to the cities intends to improve different fields of the urban context and in particular the life quality of citizens. An important part of the overall well-being is the urban comfort, defined as a function of some environmental parameters. The knowledge and the widespread collection of the geospatial information allow the implementation of a model able to estimate the urban comfort level. In this respect, a dynamic monitoring system was developed following the Do It Yourself (DIY) approach that allow to collect and send data to a cloud server. The article describes the implementation phases of the device, a first experimental application conducted in Milan and a critical analysis of this approach.

1. Introduction

The “smart” concept applied to the cities allowed to spread Wireless Sensor Network (WSN) capable to measure and monitor many parameters with the aim of an efficient management of the city [1]. Different projects and experimentations were conducted in order to get urban environmental parameters. In general two different approaches are considered:
  • The first expected the creation of a dense network of interconnected sensors placed, alternatively, on a specific portion or in the whole urban territory and installed on fixed urban elements (i.e., street lamps). This kind of approach was adopted, for example, in the city of Santander in Spain within “SmartSantander” project [2];
  • The second approach is based on the installation of a dynamic system capable to monitor environmental variables that are then GPS geolocalized and automatically sent to a server by a data connection system. This kind of approach was followed in the Belgrade city in Serbia within the same “SmartSantander” project [2] and in the “CityFeel” project [3].
The final goal of these systems is to monitor several environmental variables and to map the territory in order to inform and to educate citizens, by the identification of the critical zones where to focus the requalification interventions and, consequently, improve the life quality level of users.
The smart approach applied on an urban context contributes to change the citizens’ role from passive users of goods and services to dynamic actors directly involved on cities development.
The Do It Yourself (DIY) approach was applied, with significant results, on different contexts [4]: from the experimentations in the home automation domain in order to increase the energy and environmental performances of buildings, to industrial sector applications. These DIY solutions are often available in an open-source format, thus allowing a tailored replication or a fast updating. Although there are several commercial available solutions that allow to an end-user to buy specific shields that can be used to statically map the territory [5], the present study allow to test the possibility of applying a mobile and smart content to a city using a completely DIY approach. In other contexts, the DIY approach has enabled efficient solutions to be of public domain and to spread fast. By applying this concept to the urban contexts, it is possible to involve people since the implementation phase of monitoring system. Below, the realization process of the dynamic monitoring system is described and its characteristics are provided. This is followed by a description of a practical data collection test.

2. Hardware and Software

The monitoring system, made through a DIY approach, is extremely easy and allows the air overheating in the urban zones to be monitored with the identification of critical areas through a mobile device that integrates a micro-wind system in order to extend its autonomy. For this purpose, a 3D printer, a microcontroller, and several low-cost modules and sensors have been used. The monitored data are managed by an app that communicates with the device via Bluetooth and allows to add geospatial details and to transfer all the information to a cloud server.

2.1. Hardware

The low-cost monitoring system (Figure 1) involves a simple hardware architecture which consists of:
  • Microcontroller;
  • Temperature and relative humidity sensor;
  • Bluetooth module;
  • Power and charging module.
The airflow hits the front part of the device: one part passes through a thin slot placed on the top and flows around the surface of the temperature and relative humidity integrated sensor which is shaded in order to avoid the effects due to sun rays. The other part of the airflow is used by the power charging system realized considering a solution developed by a young maker [6] consisting in an old PC fan that recharges the battery which powers the device. The system described above sends data through the Bluetooth module to an app for mobile devices.

2.2. Software

The app was made with the aid of MIT App Inventor, a visual programming blocks language for Android OS [7]. It was created with the aim to get temperature and relative humidity data through Bluetooth connection, to geolocalize the information through smartphone/tablet GPS and to send complete data package to a cloud server. It is also possible to share the most relevant data on social media. Figure 2 shows the GUI which consists mainly in three icons: (1) Bluetooth connection activation; (2) Cloud server connection; (3) Sharing data. At starting time only the Bluetooth connection icon is activated. Other icons are activated automatically in order to avoid user errors. For example it is not possible to send data to the cloud server when the Bluetooth pairing to the monitoring device is not active. The cloud server icon is active only after the pairing of the two devices (smartphone/tablet and monitoring device). By touching on the icon a streaming of geospatial data is activated. The counter on the lower right corner of the GUI reports the number of data sent. When the streaming data is active, the Bluetooth icon is deactivated. With a new touch on Server connection icon it is possible to stop the streaming data and the sharing data icon is activated in order to share through any social channel the information related to the maximum heat index recorded and related address.

3. Method of Evaluation of Comfort and First Application

3.1. Method of Evaluation of Comfort

Among different comfort indicators [8,9,10,11,12,13,14,15,16,17] the Heat Index (HI) indicator was considered. The HI is calculated considering the air temperature (T) in °F and relative humidity (RH) in % as follows:
HI = −42.379 + 2.04901523 × T + 10.14333127 × RH − 0.22475541 × T × RH − 0.00683783 × T2 − 0.05481717 × RH2 + 0.00122874 × T2 × RH + 0.00085282 × T × RH2 − 0.00000199 × T2 × RH2,
Its value expressed in °F and then converted in °C exploits the physiological discomfort caused by the presence of high T and RH values.
The Table 1 reports the HI ranges and related levels of attention.

3.2. First Application

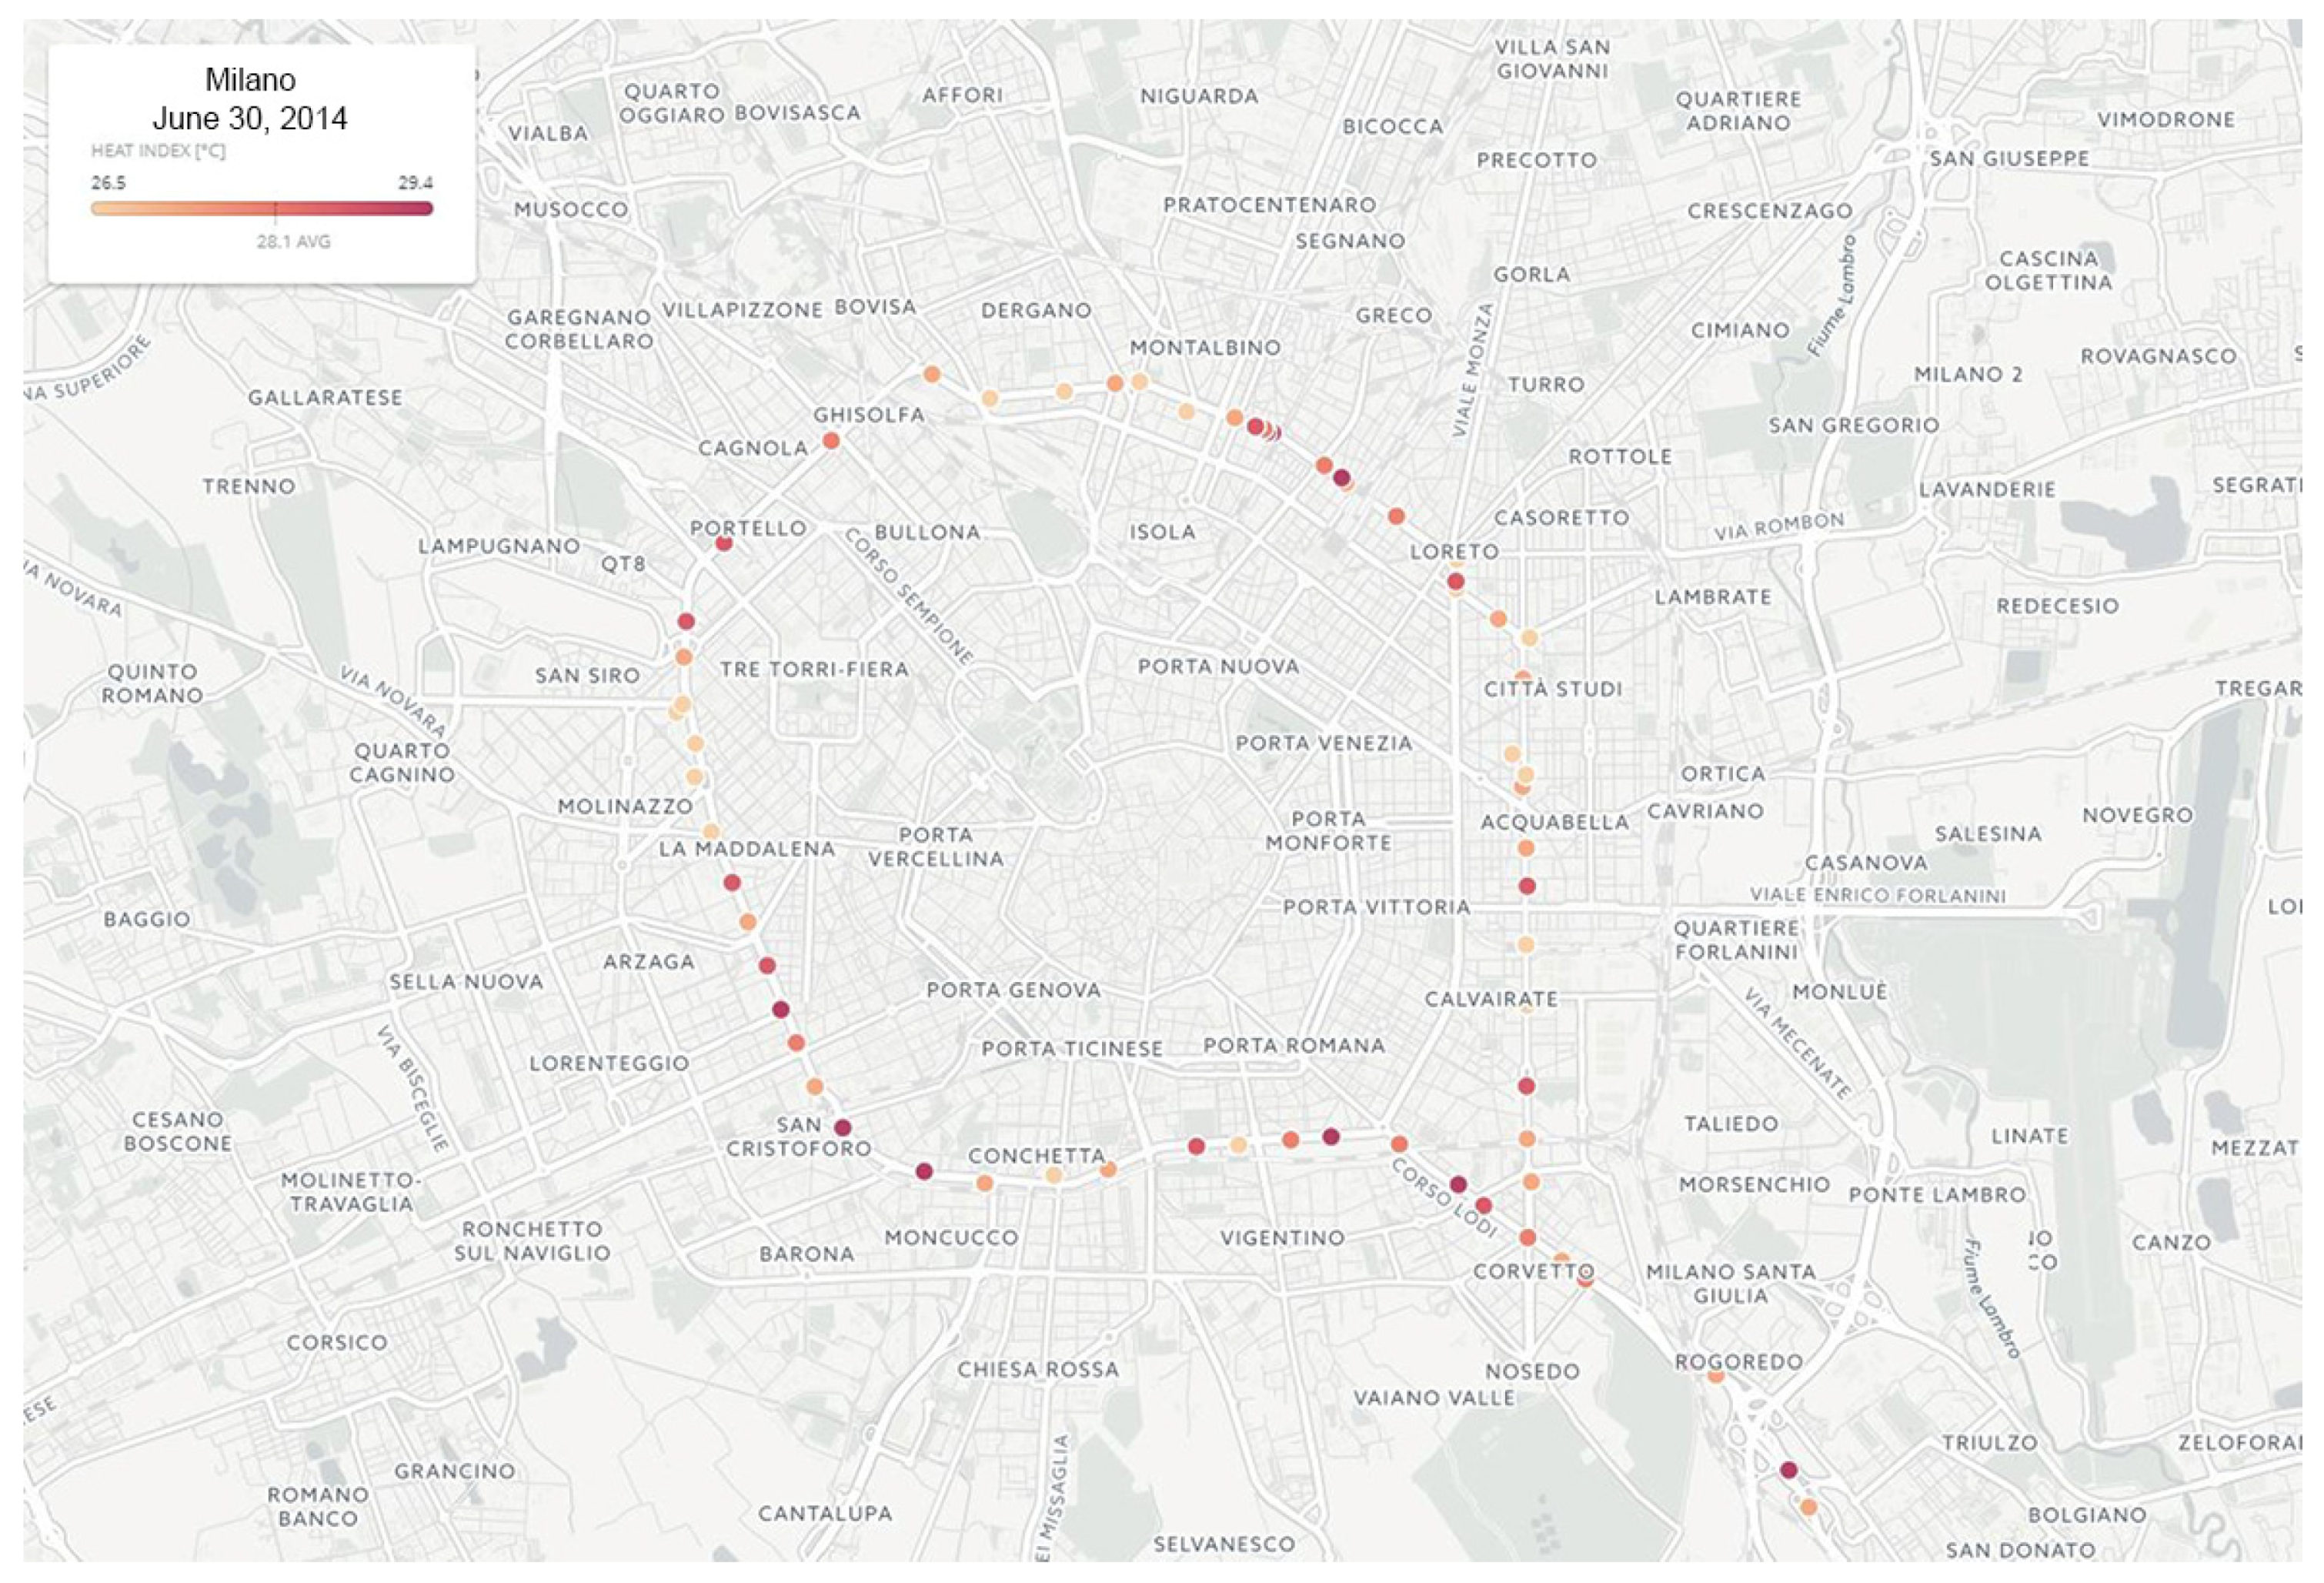
The data retrieved by the monitoring system could be collected in a cloud server and graphically represented through many services and tools (CartoDB, GIS tools, Google Fusion Tables, etc.). The following example shows the results obtained in 30 June 2014, mapped with CartoDB web tool (Figure 3).
In particular the first application was performed in Milan over a ring path of about 15 km from 2:01 PM to 3:18 PM (a total of 77 min) while the monitoring device recorded 442 data readings. The HI index defined considering the collected data, ranks between 26.5 to 29.4 °C, with a mean value of 28.1 °C, which is equal to the “Caution” level of attention.

4. Conclusions

The monitoring system developed according to the DIY approach allows to display useful information of the studied urban district. It is quite clear that considering data collected through a simple field test with a single device it is not enough to know the real distribution and the differences between variables over the territory. It could be useful to realize a network of mobile devices installed capillary on transport systems (i.e., bikes sharing) in order to cover the whole territory and to produce thematic maps. The outdoor environmental comfort expressed through HI index could be used by cyclists or pedestrians for planning a route not in relation to the distance or travelling time but in relation to the most suitable levels of comfort.

Author Contributions

The work presented in this paper is a collaborative development by all of the authors. In particular, Lorenzo Belussi, Italo Meroni and Francesco Salamone have performed the data analysis. Matteo Ghellere and Francesco Salamone have developed the case. Francesco Salamone and Ludovico Danza have developed the software and hardware. Writing of the paper was shared between the authors.

Acknowledgments

This work has been supported within the Framework Agreement between the National Research Council of Italy (CNR) and the Lombardy Region in the framework of the research project INTEGRATE (INnovazioni TEcnologiche per una Gestione RAzionale del Tessuto Edilizio).

Conflicts of Interest

The authors declare no conflict of interest.

References

  1. Filipponi, L.; Vitaletti, A.; Landi, G.; Memeo, V.; Laura, G.; Pucci, P. Smart city: An event driven architecture for monitoring public spaces with heterogeneous sensors. In Proceedings of the 2010 Fourth International Conference on Sensor Technologies and Applications (SENSORCOMM), Venice, Italy, 18–25 July 2010; pp. 281–286. [Google Scholar]
  2. Smartsantander Project. Available online: www.smartsantander.eu (accessed on 18 October 2017).
  3. Gallinelli, P.; Camponovo, R.; Guillot, V. CityFeel-micro climate monitoring for climate mitigation and urban design. Energy Procedia 2017, 122, 391–396. [Google Scholar] [CrossRef]
  4. Kuznetsov, S.; Paulos, E. Rise of the expert amateur: DIY projects, communities, and cultures. In Proceedings of the 6th Nordic Conference on Human-Computer Interaction: Extending Boundaries, Reykjavik, Iceland, 16–20 October 2010; pp. 295–304. [Google Scholar]
  5. Diez, T.; Posada, A. The fab and the smart city: The use of machines and technology for the city production by its citizens. In Proceedings of the 7th International Conference on Tangible, Embedded and Embodied Interaction, Barcelona, Spain, 10–13 February 2013; pp. 447–454. [Google Scholar]
  6. DIY Power Charging System. Available online: http://wonderfulengineering.com/charge-your-smartphone-by-making-this-cool-wind-turbine-using-a-computer-fan/ (accessed on 18 October 2017).
  7. App Inventor. Available online: http://appinventor.mit.edu/explore/ (accessed on 18 October 2017).
  8. D’Ambrosio Alfano, F.R.; Palella, B.I.; Riccio, G. Thermal environment assessment reliability using temperature-humidity indices. Ind. Health 2011, 49, 95–106. [Google Scholar] [CrossRef] [PubMed]
  9. Missenard, F.A. Température effective d’une atmosphere Généralisation température résultante d’un milieu. In Encyclopédie Industrielle et Commerciale, Etude Physiologique et Technique de la Ventilation; Librerie de l’Enseignement Technique: Paris, France, 1933; pp. 131–185. [Google Scholar]
  10. Li, P.W.; Chan, S.T. Application of a weather stress index for alerting the public to stressful weather in Hong Kong. Meteorol. Appl. 2000, 7, 369–375. [Google Scholar] [CrossRef]
  11. Anderson, S.R. Humidex Calculation, Atmosferic Environment Service C.D.S; No. 24-65; Atmosferic Environment Service: Dorval, QC, Canada, 1965. [Google Scholar]
  12. Masterton, J.M.; Richardson, F.A. HUMIDEX: A Method of Quantifying Human Discomfort Due to Excessive Heat and Humidity; Environment Canada: Downside, ON, Canada, 1979. [Google Scholar]
  13. Gagge, P.A.; Stolwijk, J.A.J.; Nishi, Y. An effective temperature scale based on a simple model of human physiological regulatory response. ASHRAE Trans. 1971, 82, 246–252. [Google Scholar]
  14. Steadman, R. The assessment of sultriness. Part I: A temperature-humidity index based on human physiology and clothing science. J. Appl. Meteorol. 1979, 18, 861–873. [Google Scholar] [CrossRef]
  15. Höppe, P. The physiological equivalent temperature—A universal index for the biometeorological assessment of the thermal environment. Int. J. Biometeorol. 1999, 43, 71–75. [Google Scholar] [CrossRef] [PubMed]
  16. Blazejczyk, K. New indices to assess thermal risks outdoors. In Proceedings of the 11th International Conference on Environmental Ergonomics XI, Ystat, Sweden, 22–26 May 2005; pp. 222–225. [Google Scholar]
  17. Blazejczyk, K. Multiannual and seasonal weather fluctuations and tourism in Poland. In Climate Change and Tourism Assessment and Copying Strategies; Amelung, B., Blazejczyk, K., Matzarakis, A., Eds.; Maastricht, The Netherlands; Warsaw, Poland; Freiburg, Germany, 2007; pp. 69–90. [Google Scholar]
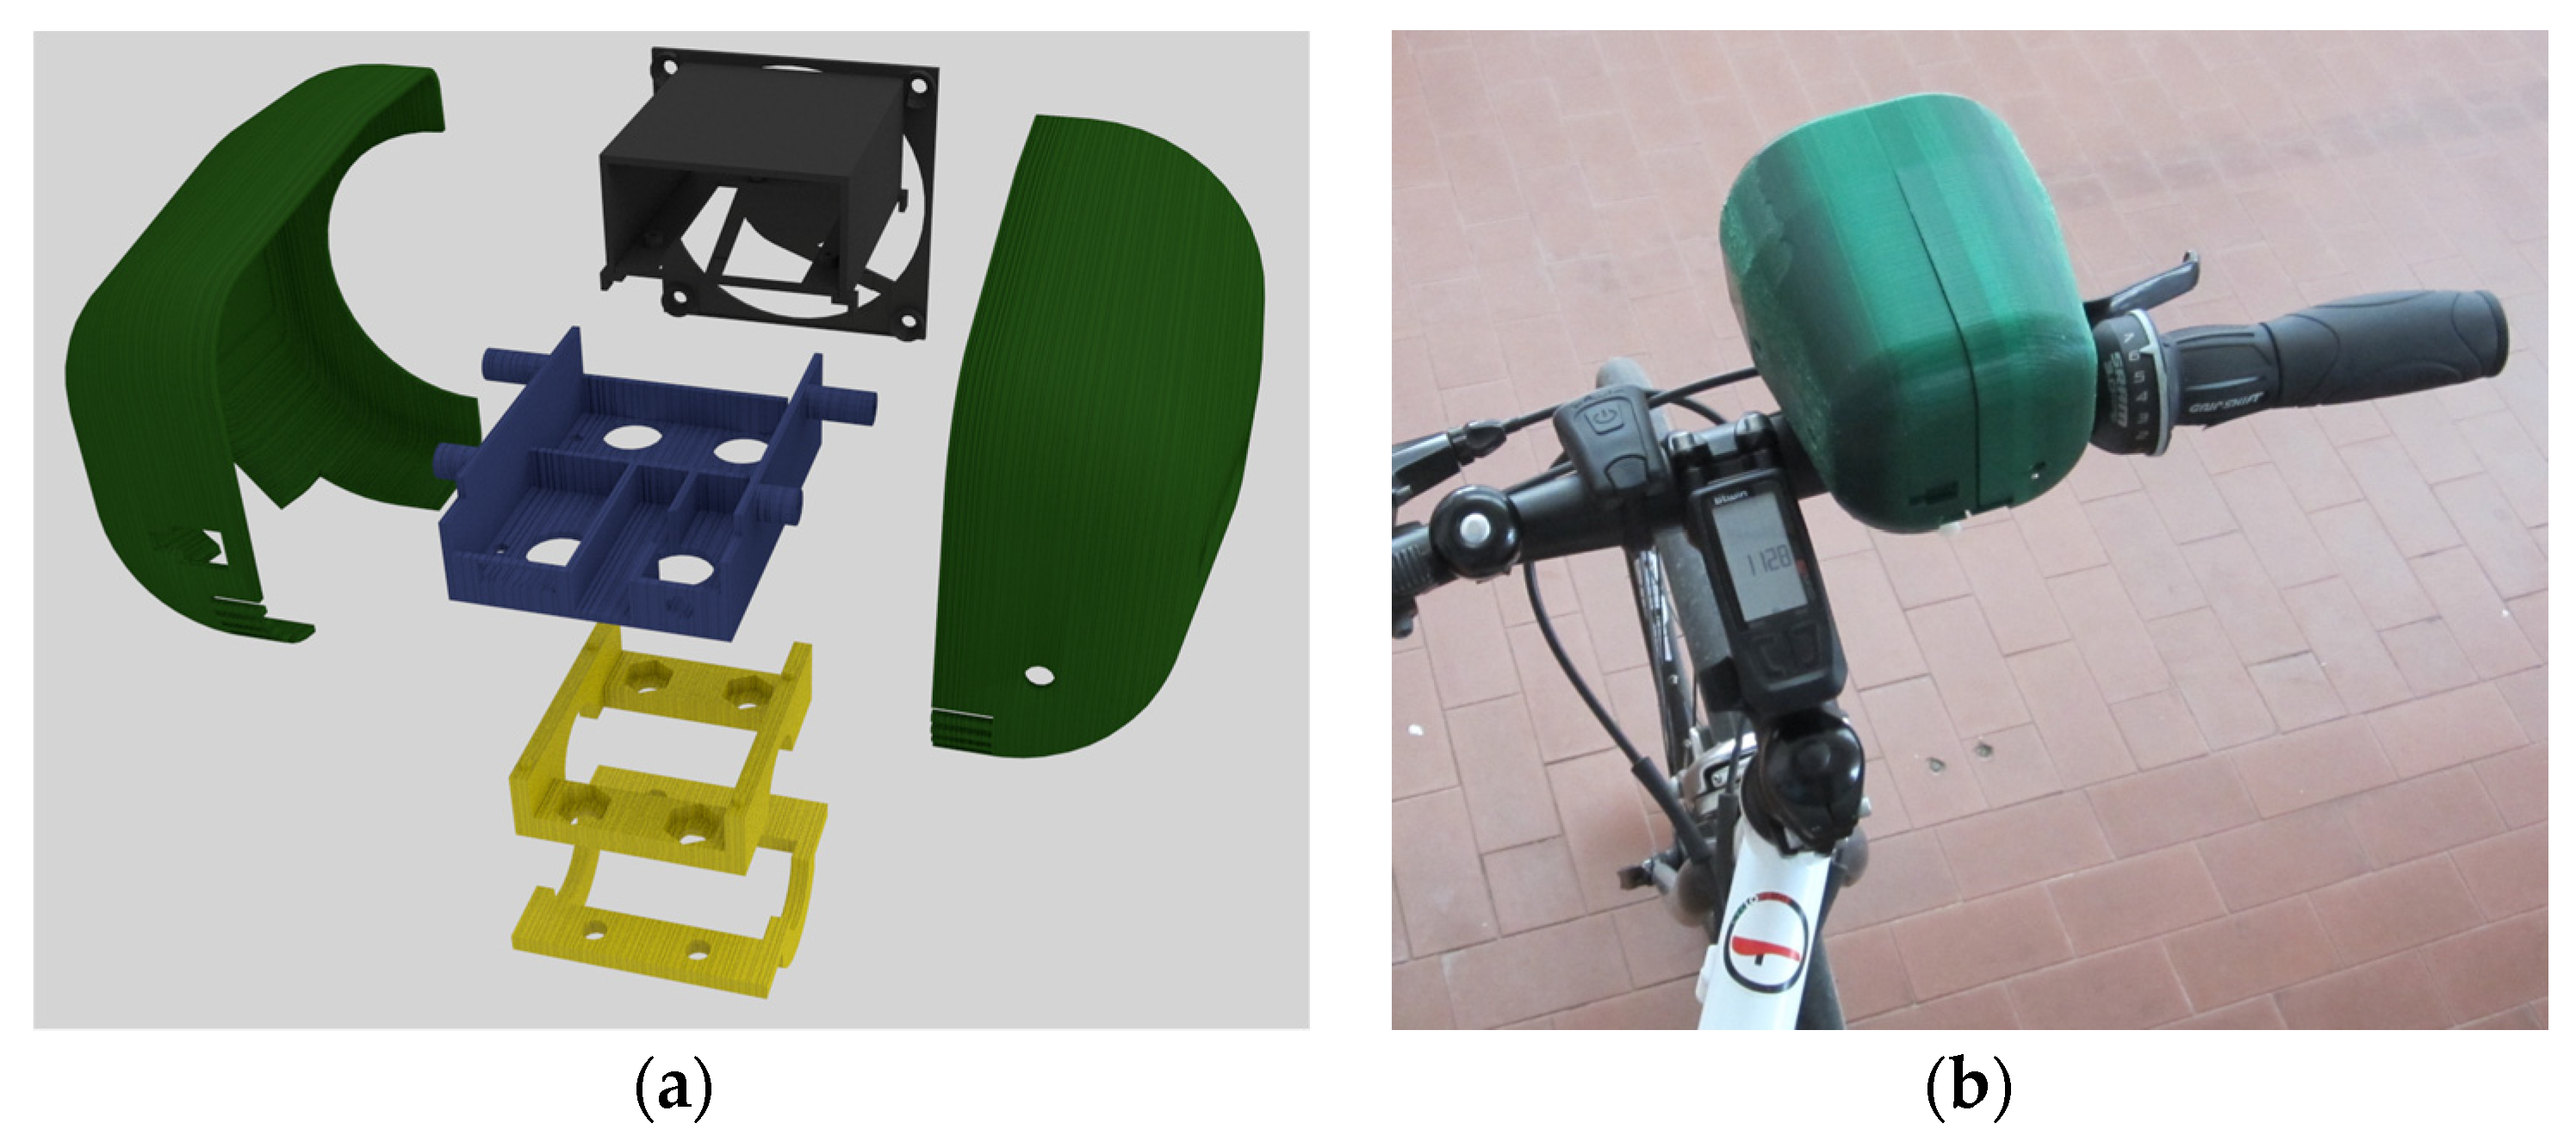
Figure 1. Monitoring system: (a) assembly scheme rendering; (b) as installed.
Proceedings 02 00115 g001
Figure 2. Mobile device app for Android OS.
Proceedings 02 00115 g002
Figure 3. HI profile over Milan on 30 June 2014.
Proceedings 02 00115 g003
Table 1. Range of values reached by Heat Index and related levels of attention.
CategoryRange HI
Caution27 [°C] ≤ HI < 32[°C]
Extreme caution32 [°C] ≤ HI < 41 [°C]
Danger41 [°C] ≤ HI < 54 [°C]
Extreme DangerHI ≥ 54 [°C]
Publisher’s Note: MDPI stays neutral with regard to jurisdictional claims in published maps and institutional affiliations.