Proceeding Paper

Deterministic Propagation Modeling for Intelligent Vehicle Communication in Smart Cities †

1
Electrical and Electronic Engineering Department, Universidad de las Fuerzas Armadas ESPE, Sangolquí 171-5-231B, Ecuador
2
School of Engineering and Sciences, Tecnológico de Monterrey, Monterrey 64849, Mexico
3
Electrical and Electronic Engineering Department, Public University of Navarre, 31006 Pamplona, Spain
4
Mathematical Engineering and Computer Science Department, Public University of Navarre, 31006 Pamplona, Spain
*
Author to whom correspondence should be addressed.
Presented at the 4th International Electronic Conference on Sensors and Applications, 15–30 November 2017; Available online: https://sciforum.net/conference/ecsa-4.
Proceedings 2018, 2(3), 107; https://doi.org/10.3390/ecsa-4-04898
Published: 14 November 2017

Abstract

:
Vehicular Ad Hoc Networks (VANETs) are envisaged to be a critical building block of Smart Cities and Intelligent Transportation System (ITS) where applications for pollution and congestion reduction, vehicle mobility improving, accidents prevention and safer roads are some of the VANETs expected benefits into the Intelligent Vehicle Communications. Although there is a significant research effort in Vehicle-to-Infrastructure (V2I) communication radio channel characterization, the use of more general methods than theoretical and empirical models is required to understand more accurately the propagation phenomena in urban environments. In this work, a deterministic computational tool based on an in-house 3D Ray-Launching algorithm and standard IEEE 802.11p, is used to represent and analyze some large-scale and small-scale urban radio propagation phenomena for V2I, including the vehicles movement effects on each of the multipath components. Results show the impact of factors as distance, frequency, location of antenna transmitters (TX), obstacles and vehicles speed, in the V2I channel propagation. These results are useful for radio-planning Wireless Sensor Networks (WSNs) designers and deployment of urban Road Side Units (RSUs).

1. Introduction

Vehicle-to-Infrastructure (V2I) is the next generation of Intelligent Transportation Systems (ITS). V2I technologies capture vehicle-generated traffic data, wirelessly providing information such as advisories from the infrastructure to the vehicle that inform the driver of safety, mobility, or environment-related conditions [1]. The V2I Communications is the bi-directional wireless exchange of data (control and information) between vehicles and Road Side Units (RSUs). In 1999, the U.S. Federal Communication Commission (FCC) allocated a 75 MHz spectrum at 5.9 GHz to be used as V2V and V2I communications known as Dedicated Short Range Communications (DSRC), and the IEEE 802.11p standard [2] was developed for operation at 5.9 GHz.
According Bengi et al. in [3], to design accurate propagation models for realistic V2I-enabled applications it is necessary to take into account that V2I have unique characteristics in terms of antenna heights, placement of the RSUs, environment type (e.g., urban, suburban, highway) and specific considerations for small scale fading due to particular location of antennas. In urban environments, a combination of different object types as buildings, vehicles, and vegetation, as well as their number, size, and density, has a profound impact on the radio propagation [4]. Some propagation impairments as reflection from, diffraction around and transmission loss through objects (influence of vegetation, building entry loss, cars, trees, pedestrians, etc.), external environment, give rise to issues such as temporal and spatial variation of path loss and multipath effects from reflected and diffracted components of the wave.
On the other hand, current state-of-the art simulators focus mainly on V2V or V2I communications operating in cellular sense and, although the literature includes many propagation models and channel simulators for V2V systems [5,6], there is a need for further studies to investigate V2I propagation using 3D deterministic tools in complex environments as the urban. While V2I field test provides useful insight for specific in-situ scenarios [7], deterministic Ray Launching simulators are suited for vehicular propagation analysis of electrical-large scenarios, as urban scenarios, yielding a reasonable tradeoff between accuracy and computational cost. In this work, a hybrid deterministic method has been used to analyze the V2I propagation phenomena, specifically an in-house 3D Ray-Launching (3D-RL) algorithm, based on Geometrical Optics (GO), Geometrical Theory of Diffraction (GTD) and Uniform Theory of Diffraction (UTD). The detailed operating mode of the algorithm has been previously published [8], and validated in transportation systems [9].
The remaining parts of the paper are outlined as follow: modeling and scenery simulation are explained in Section 2. Section 3 presents the V2I analysis, along the main avenues and streets, of Received Signal Strength (RSS), Root-Mean-Square Delay Spread (RMS delay spread), Coherence Bandwidth (CB), Power delay Profile (PDP) and Doppler Shift (fd). Conclusions and future work are summarized in Section 4.

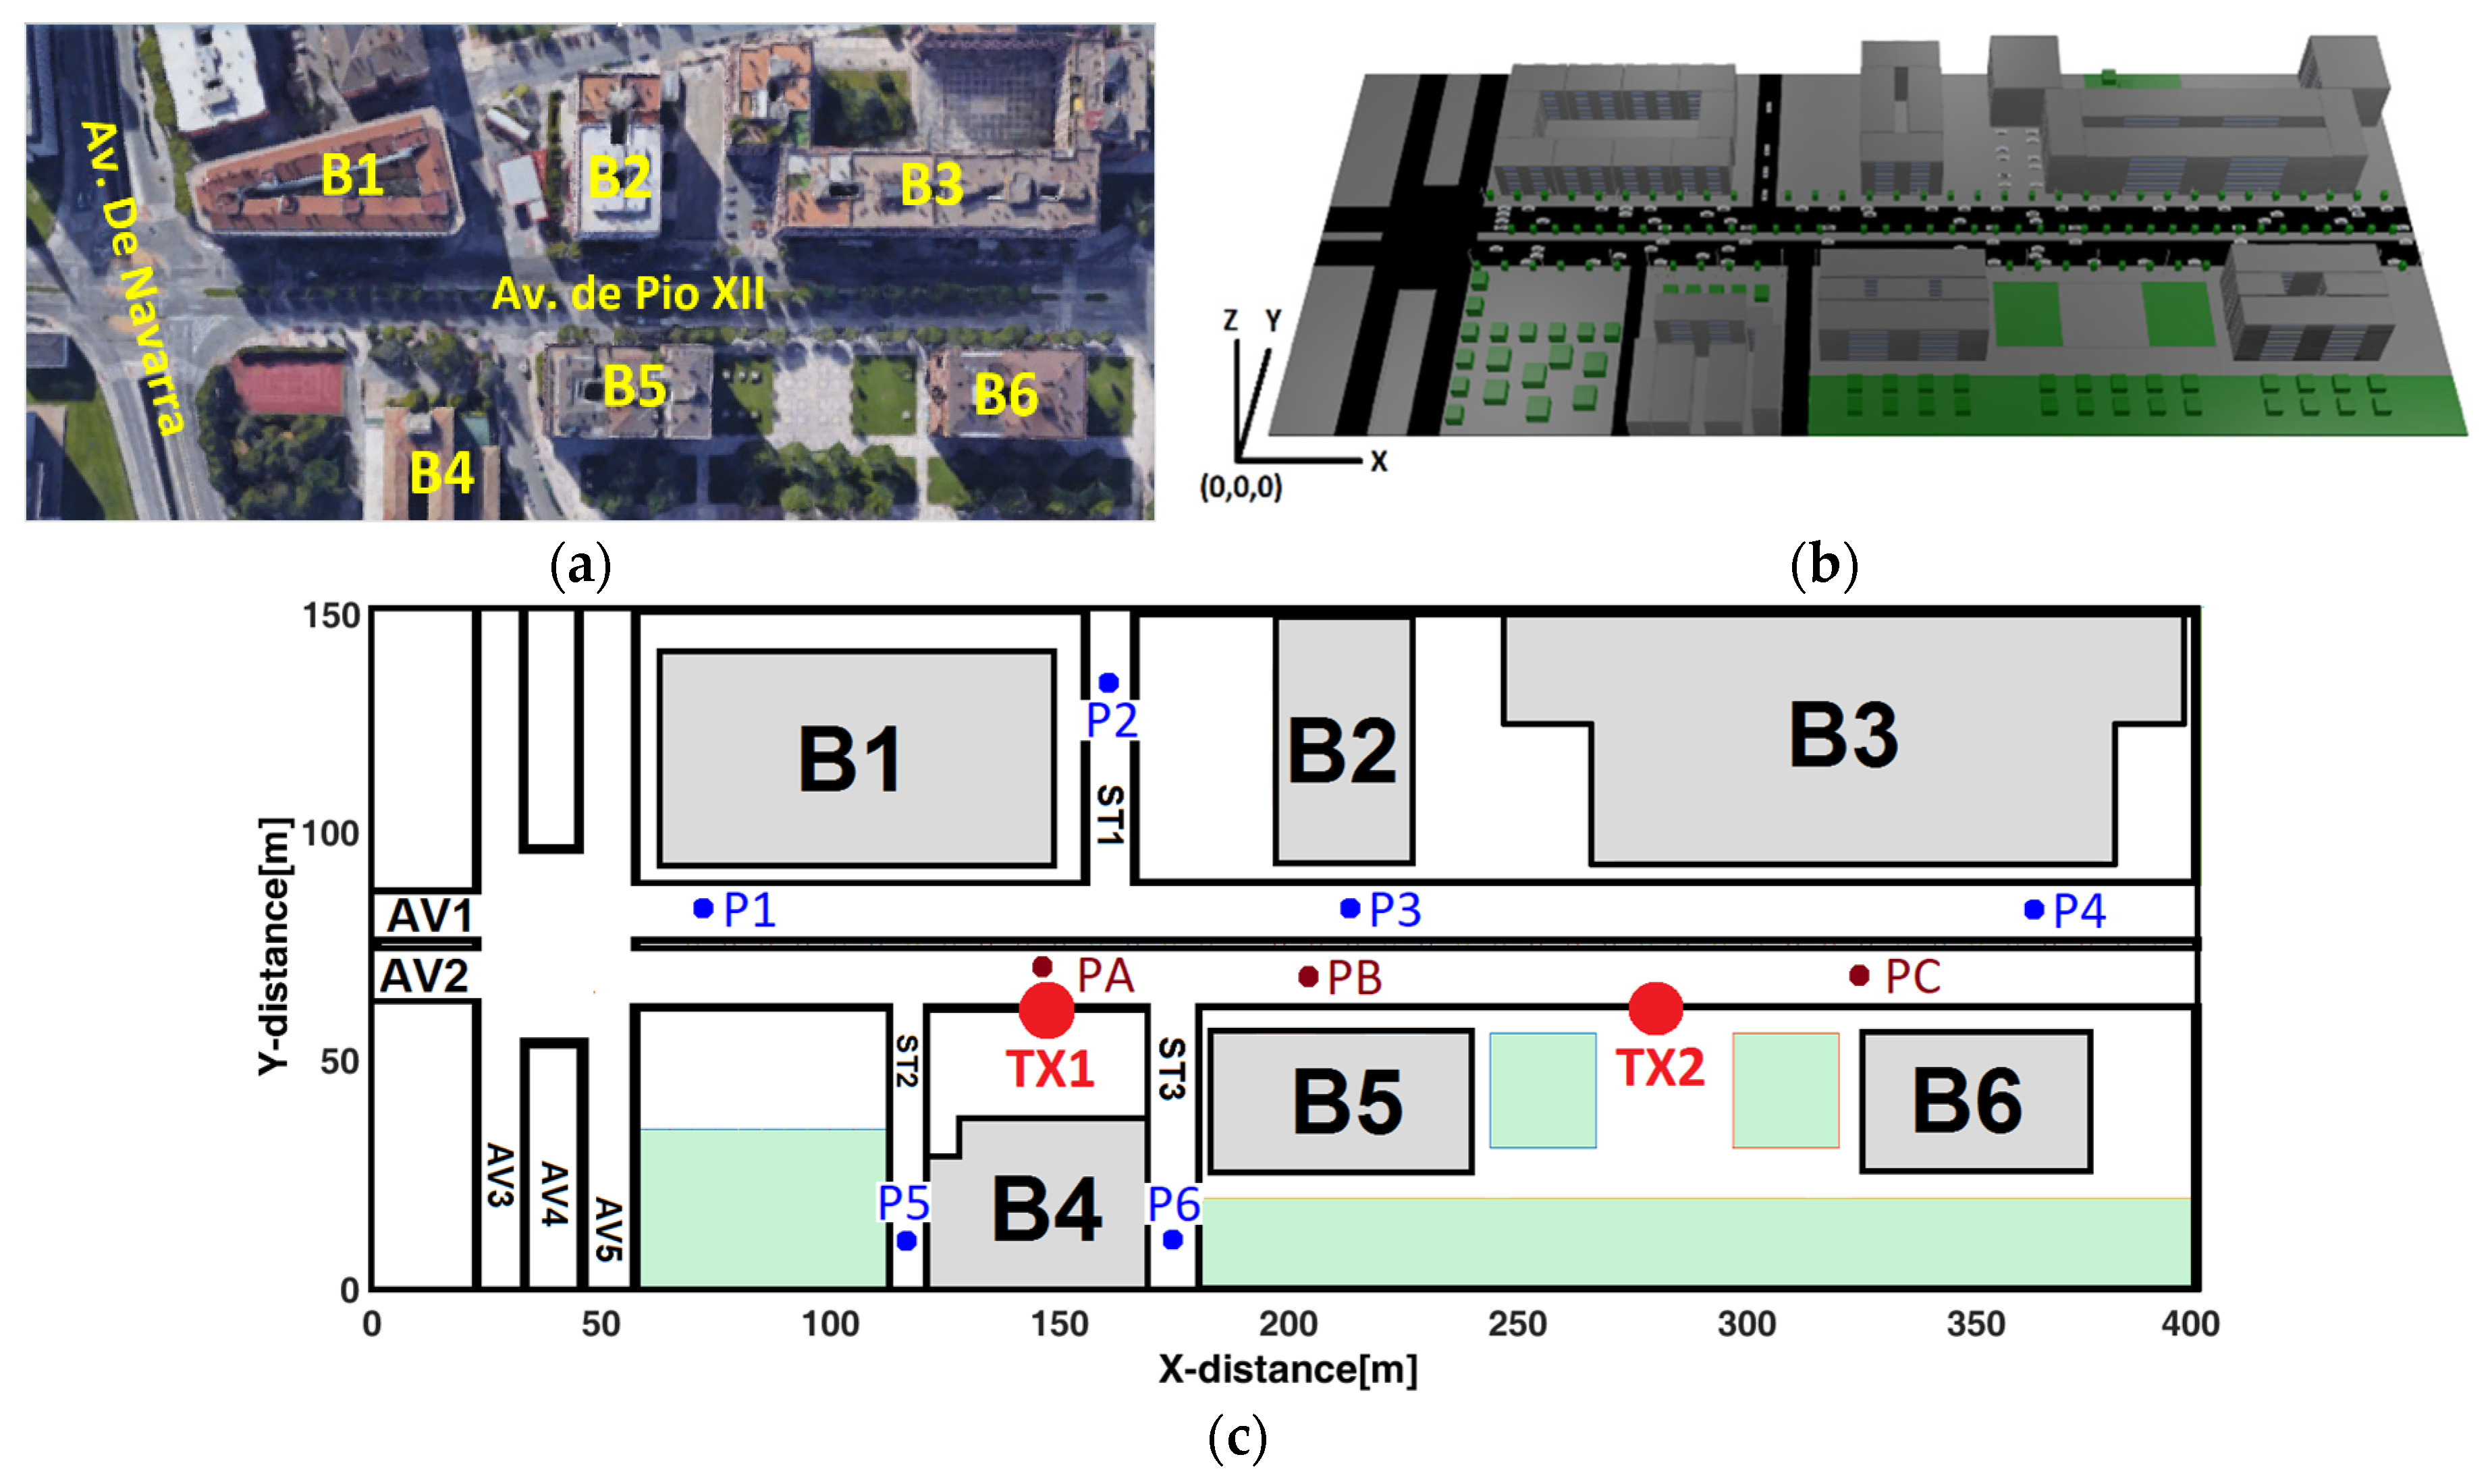
2. Simulation Urban Scenario

This section describes the modeled urban scenario with its reference points and the main simulation parameters.
Figure 1a shows a google map (http://www.google.com/maps) aerial view of the urban scenario, Figure 1b is a simulated 3D frontal-view and Figure 1c is a 2D frontal-view that describe the relative position (x,y). Table 1 shows scenario reference identifying the interest areas used afterwards in this document.
The modeled and simulated urban scenario is a replica of a location in Pamplona, Spain (42°48′22.15 N, 1°39′39.14 W) and was referenced using google maps tool. The area encompasses 1320,000 m3 (400 m × 150 m × 22 m) of scenario and includes typical elements of an urban environment. The simulation analysis was carried out at 5.9 GHz (IEEE 802.11p). Simulation parameters are summarized in Table 2.

3. Results

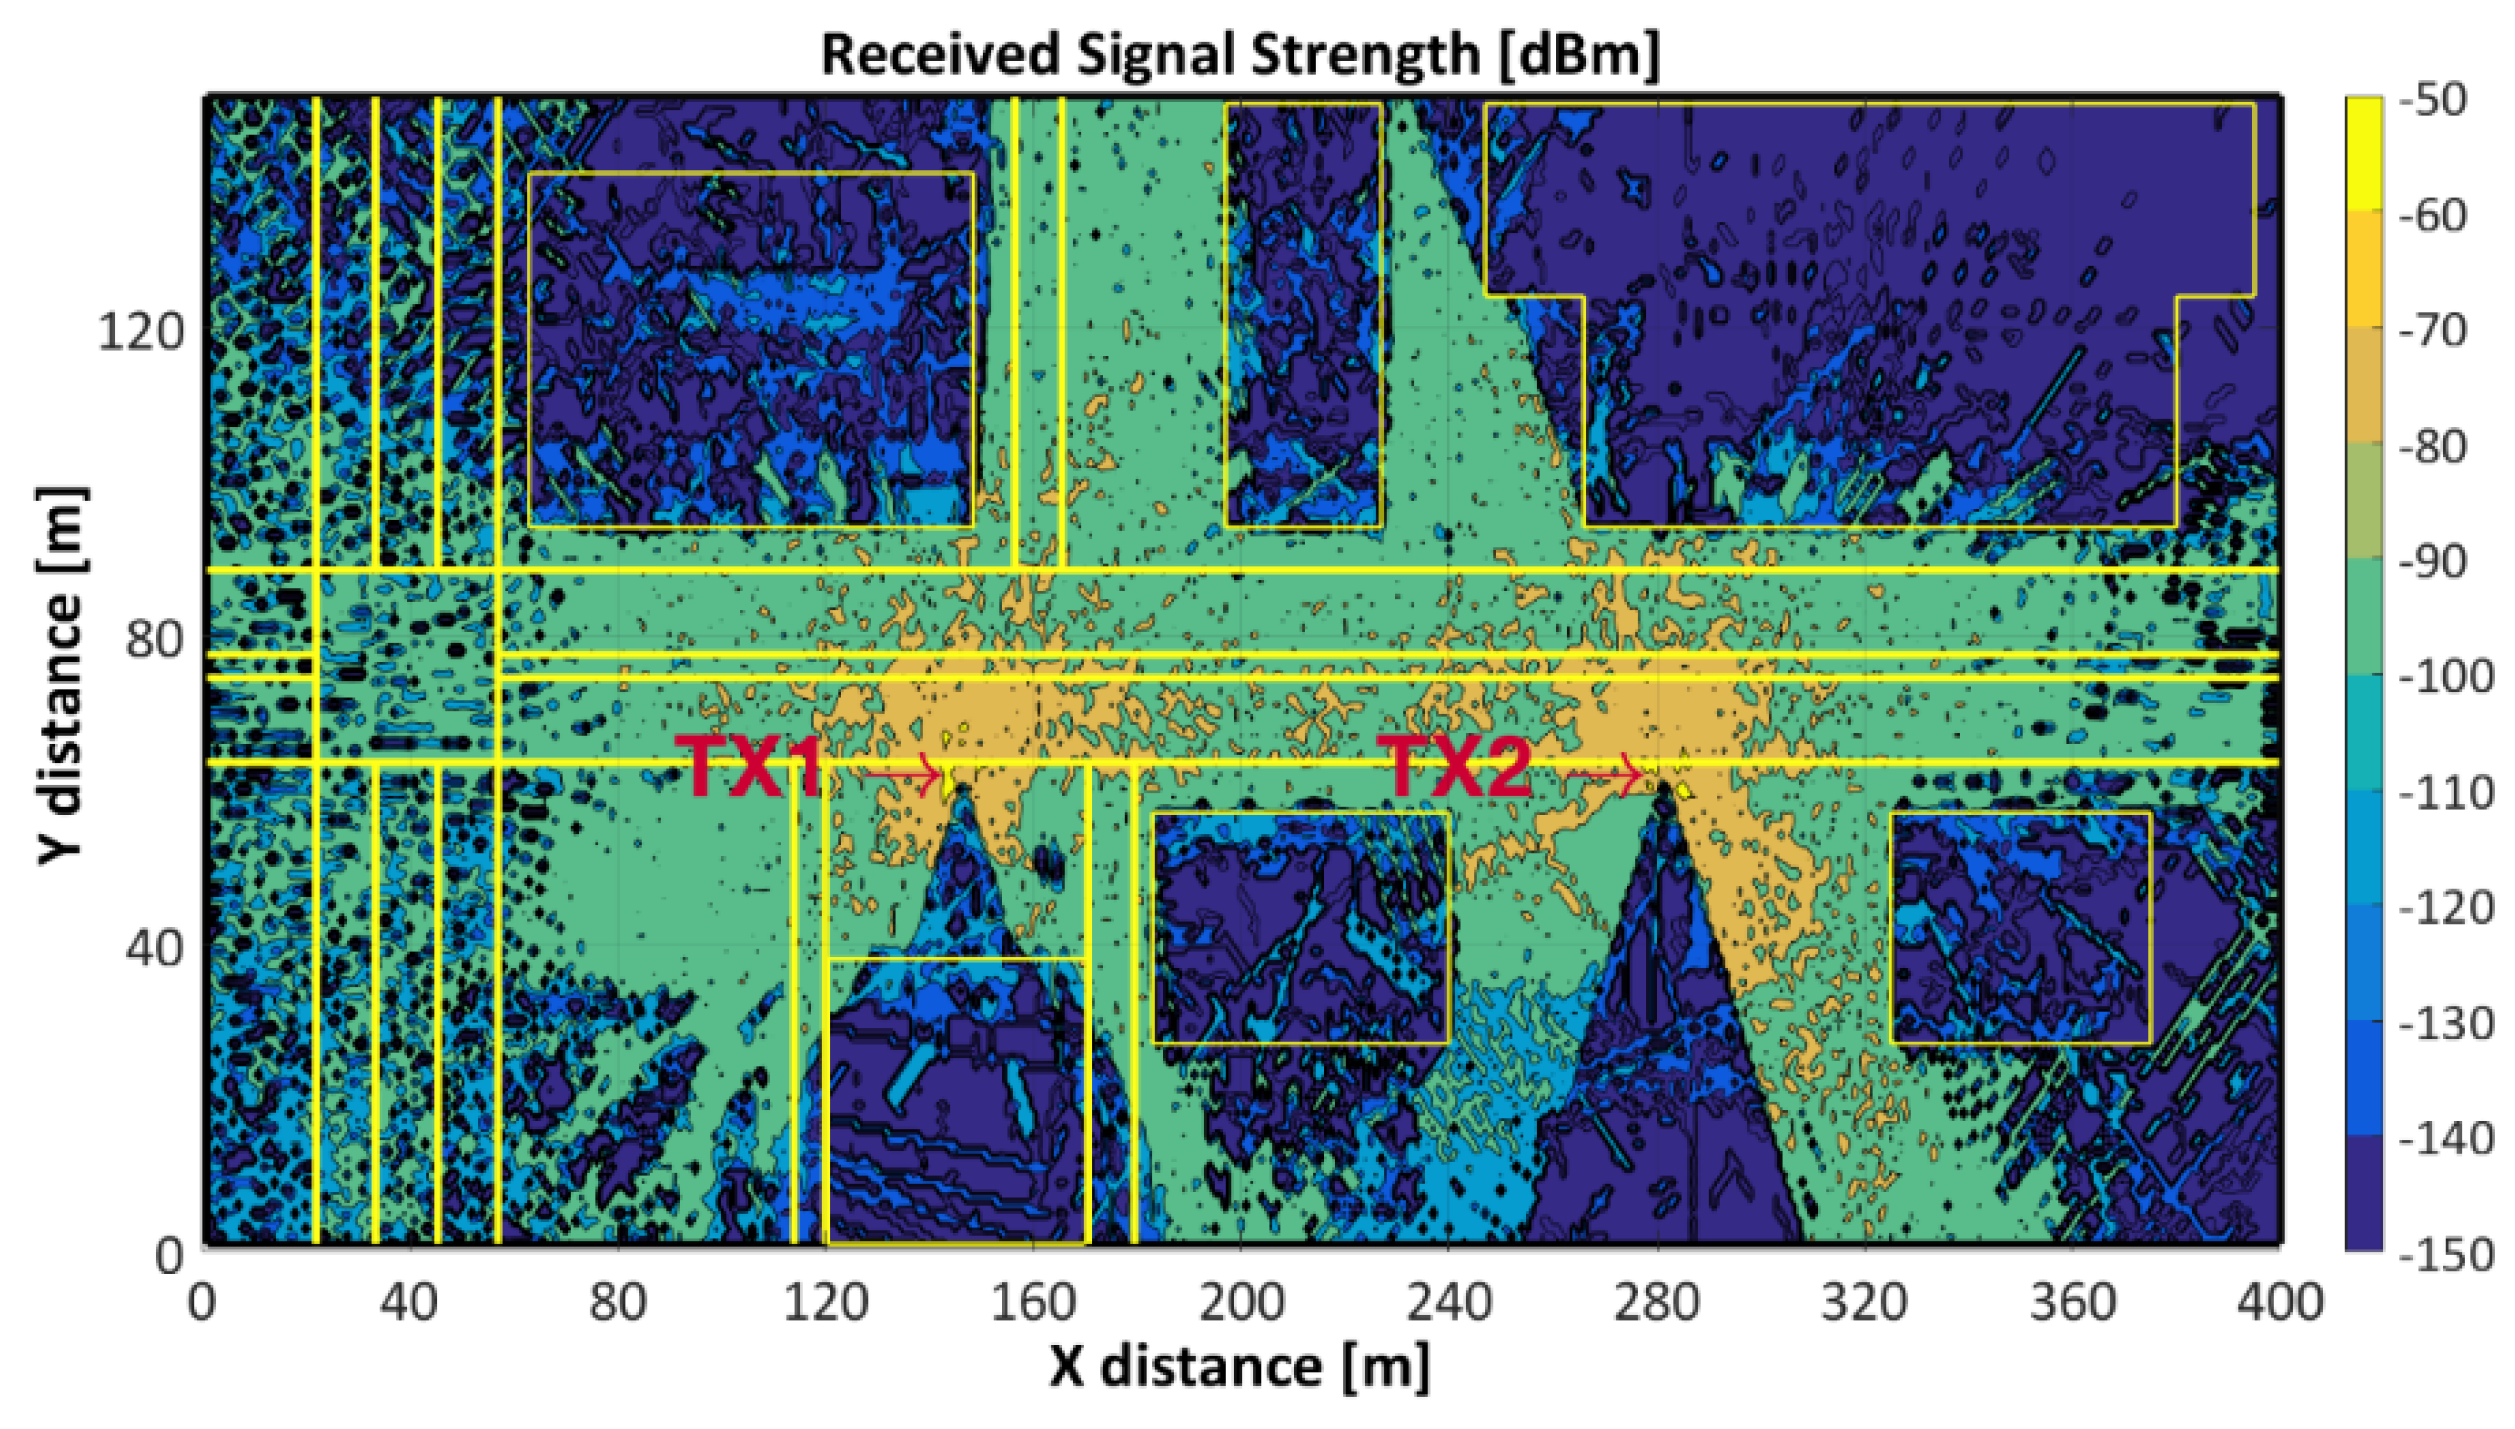
3.1. Received Signal Strength (RSS)

Figure 2 illustrates a surf plot of the TX1–TX2 jointly RSS at Z-plane of 1.5 m, the height of the receiver (RX) in cars. RSS levels above the Received Signal Threshold RST (−120 dBm), are received along AV1, AV2, ST1 while RSS levels below the RST are notorious along the AV3, AV4, AV5. Fluctuating RSS levels (−90 dBm and below) are present at the roundabout, ST2 and ST3. Special attention deserves ST2 and ST3 where RSS values below −120 dBm (P5, P6) are caused for the blocking of the radiated TX1 signal by the metallic support of the lamppost; TX1 was placed 0.5 m far from the lamppost (y axis). Additional simulated RSS levels from P1 to P6 are detailed in Table 3.
According Gonzalvez et al. in [7] the effectiveness of cooperative systems using RSUs for V2I communications is strongly dependent of how efficiently RSUs are being deployed. Based on the simulated results, different TX placement configurations could be suggested to achieve RSS levels above to −120 dBm; one of these configuration could be as follows:
-
TX1 and TX2 in the same simulated placement to give coverage to AV1, AV2, ST1.
-
Two additional TX’s, one for coverage ST2 and another for ST3.
-
One TX, for coverage the roundabout, AV4, AV5 and AV6 areas.

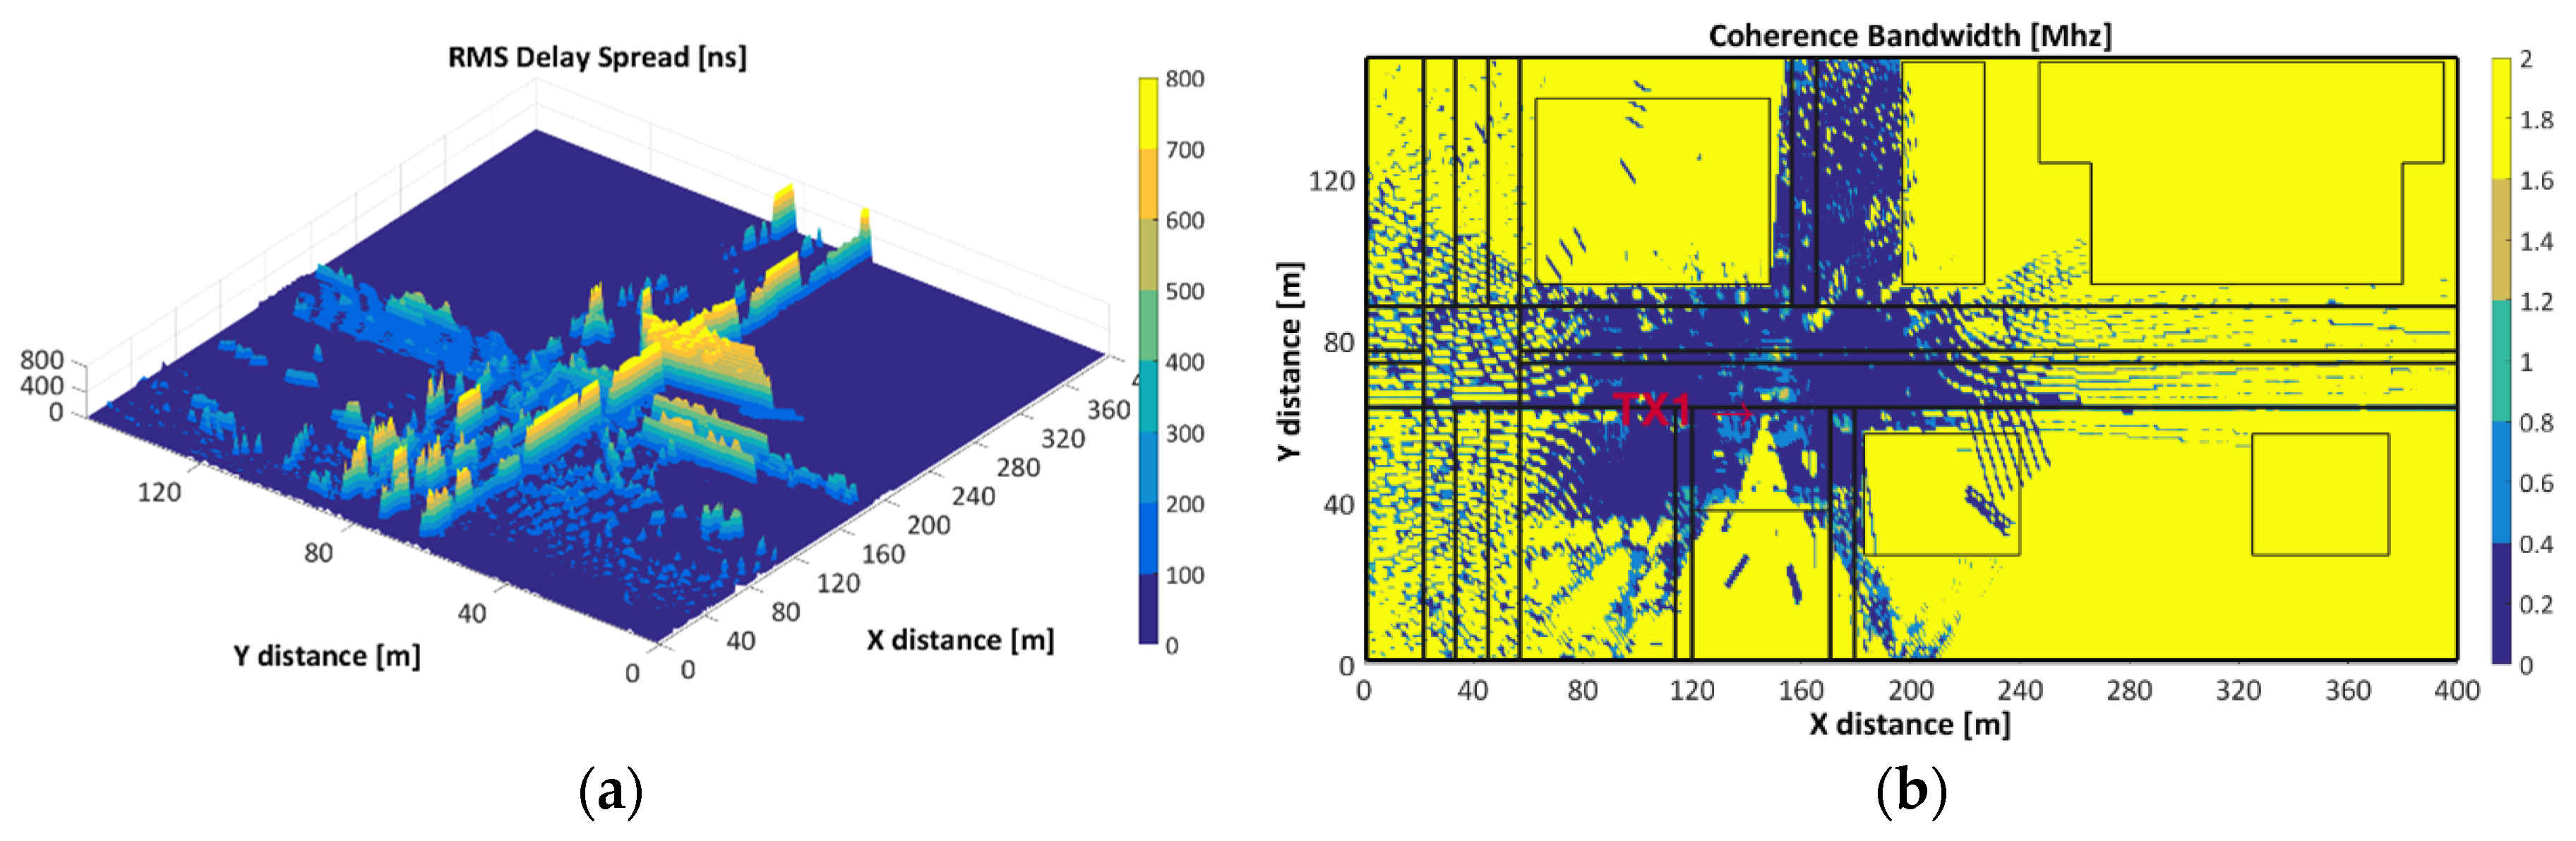
3.2. Time Dispersion Parameters

3.2.1. Root Mean Square Delay Spread (RMS Delay Spread) and Coherence Bandwidth (CB)

Figure 3a depicts the RMS delay spread and 3b the coherence bandwidth for TX1 at z-plane of 1.5 m. From Figure 3a, it is notorious the high values of RMS delay spread near the antenna, and zones under LoS with TX1: AV1, AV2 and ST1. The presence of trees and cars causes the highest RMS delay spread along AV1 and AV2. Lowest RMS delay spread values keep close relationship with lowest values of RSS due to the NLoS conditions, as it is the case of ST2 (P5) and ST3 (P6). Jointly RMS delay spread analysis for TX1 and TX2 shows high levels along AV1, AV2, ST3 and the middle-upper area of ST2 and ST3.
Figure 3b depicts the CB values (frequency correlation function was considered above 0.9) and shows its inverse relationship with the RMS delay spread and RSS. Low RSS values are correspondent with high CB values which is an indicator of channel availability for other transmitters than TX1, conversely, low CB values keep correspondence with high RSS values, mainly at the vicinity of TX1 due to its strong multipath environment, which means high channel occupancy. CB analysis for TX1 and TX2 shows high channel occupancy at AV1, AV2, ST3 and the middle-upper area of ST2 and ST3.

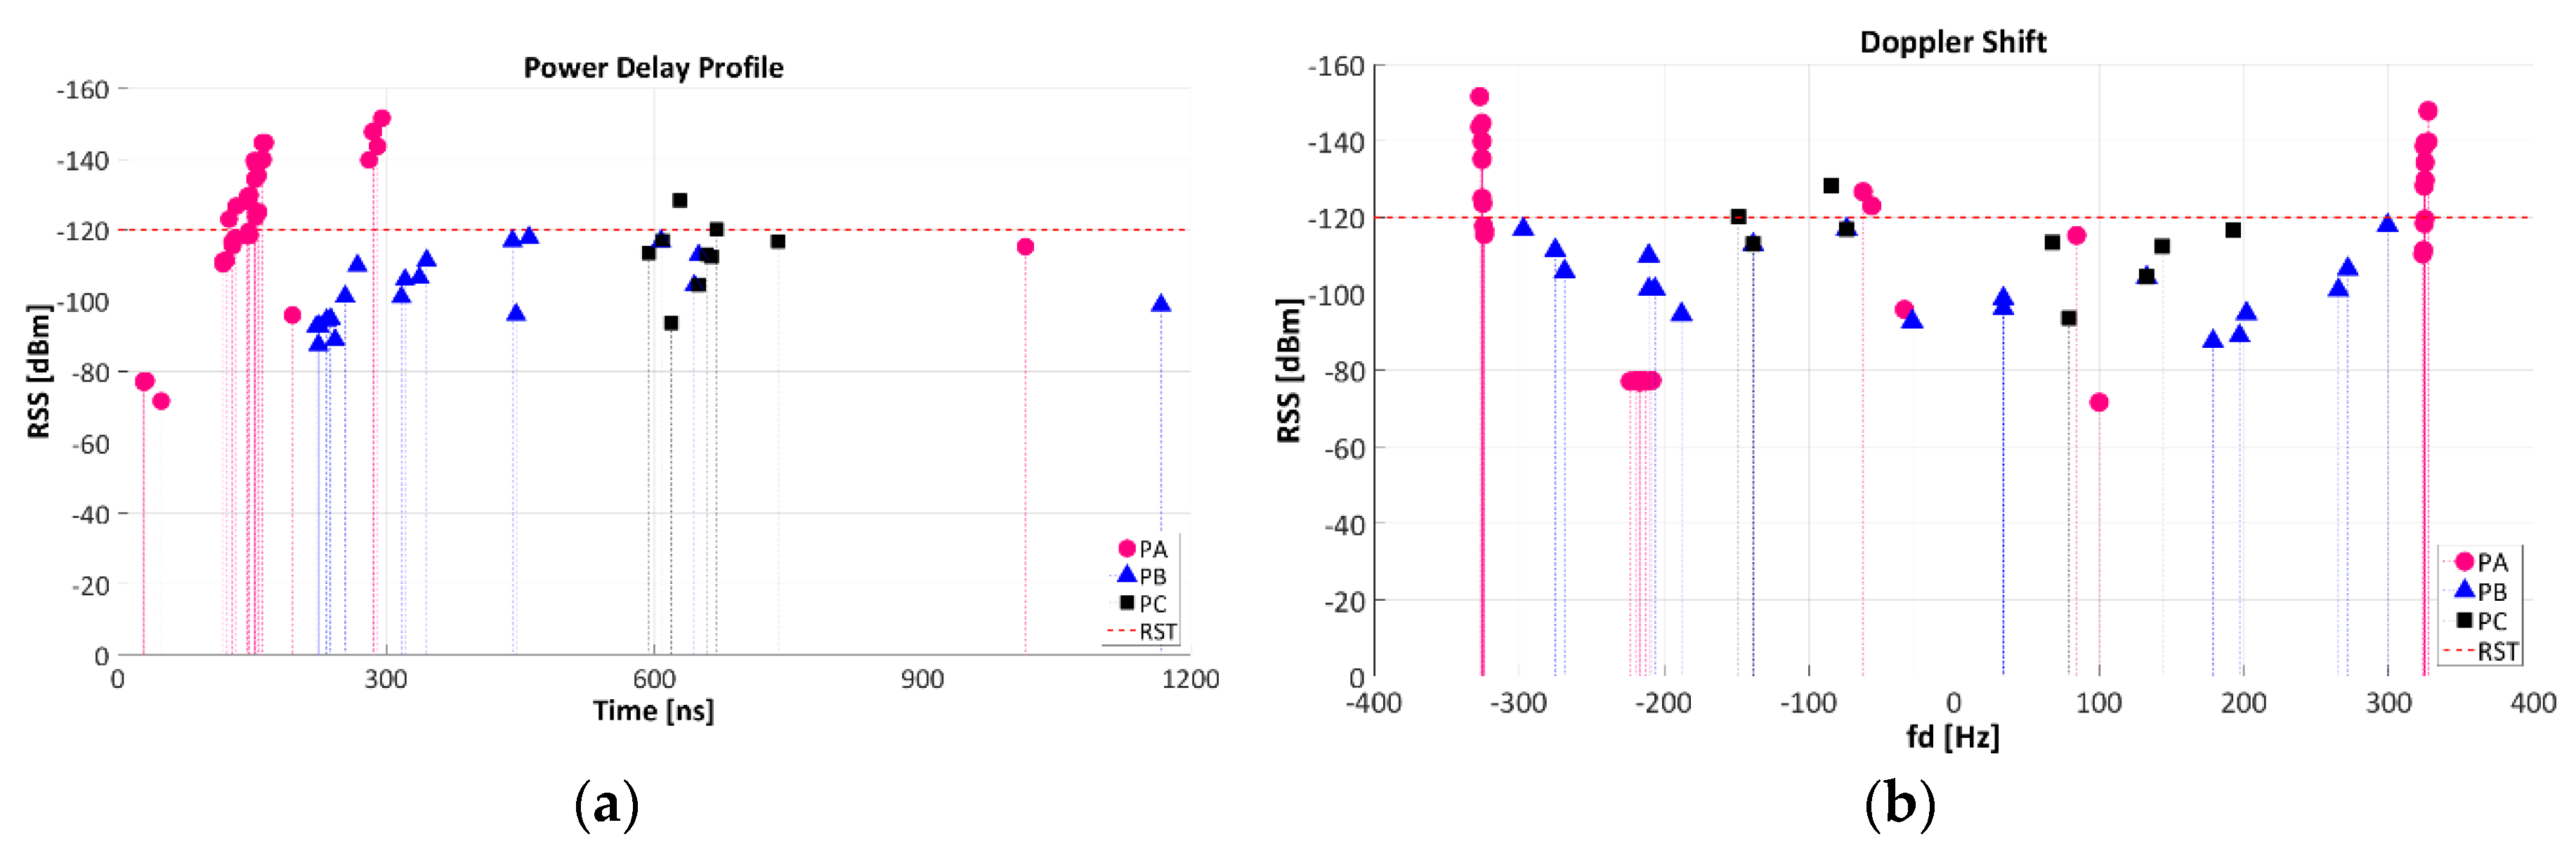
3.2.2. Power Delay Profile (PDP) and Doppler Shift (fd)

Figure 4 illustrates: (a) the Power Delay Profile and (b) the Doppler Shift at Z-plane of 1.5 [m], for 3 different locations along AV2: PA (149, 70) [m], PB (204, 70) [m] and PC (323, 70) [m], when TX1(146,63) is radiating. Figure 4a shows a large number of power rays (echoes) in a time span of 0 to 1200 ns showing a high dispersive nature of this environment causing reflected, refracted, and difracted rays that arrive to PA, PB and PC points. The highest density of rays is at PA, which is in LoS and closest (first ray arrive at 20 ns) to TX1; conversely the lowest density is at PC, which is LoS and farthest to TX1. Additional analysis deserve the presence of power rays with RSS below RST at PA, even when PA is in LoS and closest to TX1: those values are mainly reflected rays caused by the line of trees located among AV1 and AV2.
Figure 4b shows the effect of Doppler Shift resulting of the realtive motion between TX1 and three different cars (PA, PB, PC) which are traveling at a velocity (v) of 60 km/h. The relative motion between cars and TX, results in random frequency modulation due to different Doppler Shifts on each of the multipath components [10]. Doppler Shift is given by:
fd = 1 2 π · Δ Δ t = v λ · Cos θ
where v = 60 km/h. For Cosθ = 1, fdmax = 328 [Hz]
The maximum simmulated fd values (−326.96 to 326.98) correspond to PA which is closest to TX1 and under LoS conditions. Positive fd values means that PA is moving directly toward the TX and the apparent received frequency is f = fc + fd = (5.9 × 10⁹ + 326.96) [Hz]. On the other hand negative fd values means that PA is moving directly away the TX and the apparent received frequency is f = fc − fd = (5.9 × 10⁹ − 326.96) [Hz]. The fd for PB is between (−297.05 to 299.42) [Hz] and for PC is between (−148.80 to 192.65) [Hz].

4. Conclusions and Future Work

Radio propagation analysis with the aid of hybrid deterministic code based on 3D Ray Launching enables us an accurate estimation, with affordable computational cost, of an urban V2I large-scale and small-scale radio propagation parameters such as RSS, RMS delay spread, CB, PDP and Doppler Shift at frequency of 5.9 GHz (IEEE 802.11p). A large urban scenario (400 m × 150 m × 22 m) was characterized in 3D high level of detail which permit an accurate results of radio propagation parameters that could be replicated in similar environments and be useful for radio-planning WSNs designers in V2I communication systems.
Results show the impact of factors as distance, frequency, location of TX, conditions of LoS, and vehicles speed, in the V2I channel propagation parameters. The jointly TX1 and TX2 offers consistent RSS values above the RST (−120 dBm), where the V2I communication is feasible, however, there are specific areas (P5, P6) with RSS values below the RST. The presence of trees causes Quasi Line-of-sight (QLoS) between TX-RX and intense dispersive signal conditions which is evident in the PDP mainly at closest points to the TX, while the most remarkable NLoS condition is given by the absorption of the signal by the metallic support of the lamppost, fact that need to be take into account in the radio-planning phase. The highest RMS delay spread were registered in the vicinity of the TX and along the line of trees of the main avenues. On the other hand, high CB values are present in areas with the lowest RSS which means channel availability for other transmitters. The relative motion of the cars respect to the TX, measured by the Doppler Shift on each of the multipath components, shows its highest values for vehicles traveling in the vicinity of the TX. Taking into account the aforementioned analysis, a four TX emplacement configuration is suggested to provide V2I wireless communication with consistent RSS values above the defined RST.
A measurement campaign would be considered as a future work to validate the 3D-RL simulation results. Urban areas with high CB and RSS levels below the RST would be of special interest in research fields as cognitive radio. Further analysis requires the conditions of NLoS caused by metallic lamppost supports where the TX were installed.

Author Contributions

Fausto Granda, Leyre Azpilicueta and Cesar Vargas-Rosales conducted the simulation and analysis of wireless propagation phenomena and scenario impact. Peio López-Iturri, Erik Aguirre, José Javier Astrain, Jesus Villandangos and Francisco Falcone conceived and prepared the characterization and modelling the urban scenario. Leyre Azpilicueta and Fausto Granda prepared the manuscript.

Acknowledgments

The authors would like to acknowledge the support and collaboration of the Focus Group of Telecommunications and Networks at Tecnológico de Monterrey.

Conflicts of Interest

The authors declare no conflict of interest. The statements made herein are solely the responsibility of the authors.

References

  1. United States Department of Transportation (USDOT). Vehicle-to-Infrastructure (V2I) Resources. Available online: https://www.its.dot.gov/v2i/index.htm (accessed on 16 October 2017).
  2. The Institute of Electrical and Electronics Engineers. IEEE Std 802.11 p-2010. Part 11: Wireless LAN Medium Access Control (MAC) and Physical Layer (PHY) Specifications-Amendment 6: Wireless Access in Vehicular Environments; IEEE: w York, NY 10016-5997, USA, 2010. [Google Scholar]
  3. Aygun, B.; Boban, M.; Vilela, J.P.; Wyglinski, A.M. Geometry-based propagation modeling and simulation of vehicle-to-infrastructure links. In Proceedings of the 2016 IEEE 83rd Vehicular Technology Conference (VTC Spring), Nanjing, China, 15–18 May 2016. [Google Scholar]
  4. Viriyasitavat, W.; Boban, M.; Tsai, H.M.; Vasilakos, A. Vehicular communications: Survey and challenges of channel and propagation models. IEEE Veh. Technol. Mag. 2015, 10, 55–66. [Google Scholar] [CrossRef]
  5. Boban, M.; Barros, J.; Tonguz, O.K. Geometry-Based Vehicle-to-Vehicle Channel Modeling for Large-Scale Simulation. IEEE Trans. Veh. Technol. 2014, 63, 4146–4164. [Google Scholar] [CrossRef]
  6. Matolak, D.W. Modeling the vehicle-to-vehicle propagation channel: A review. Radio Sci. 2014, 49, 721–736. [Google Scholar] [CrossRef]
  7. Gozalvez, J.; Sepulcre, M.; Bauza, R. IEEE 802.11p Vehicle to Infrastructure Communications in Urban Environments. IEEE Commun. Mag. 2012, 50. [Google Scholar] [CrossRef]
  8. Azpilicueta, L.; Rawat, M.; Rawat, K.; Ghannouchi, F.; Falcone, F. Convergence analysis in deterministic 3D ray launching radio channel estimation in complex environments. Appl. Comput. Electromagn. Soc. J. 2014, 29, 256–271. [Google Scholar]
  9. Azpilicueta, L.; Vargas-Rosales, C.; Falcone, F. Deterministic Propagation Prediction in Transportation Systems. IEEE Veh. Technol. Mag. 2016, 11, 29–37. [Google Scholar] [CrossRef]
  10. Rappaport, T. Wireless Communications: Principles and Practice, 2nd ed.; Prenctice Hall, Ed.; Communications Engineering and Emerging Technologies Series; Prentice Hall PTR: Upper Saddle River, NJ, USA, 2002. [Google Scholar]
Figure 1. Urban scenario where, (a) is a google map aerial view, (b) is a 3D schematic frontal view and (c) is 2D aerial view.
Proceedings 02 00107 g001
Figure 2. TX1 and TX2 jointly Received Signal Strength [dBm] at Z-plane of 1.5 m.
Proceedings 02 00107 g002
Figure 3. (a) RMS delay spread and (b) CB at Z-plane of 1.5 m.
Proceedings 02 00107 g003
Figure 4. (a) Power delay profile (PDP) and (b)Doppler Shift (fd).
Proceedings 02 00107 g004
Table 1. Scenario reference.
ReferenceAbbreviationCoordinates (x, y, z) [m]
Main AvenuesAV1/AV2(x, 83, 0)/(x, 69, 0)
StreetsST1/ST2/ST3(161, y, 0)/(117, y, 0)/(175, y, 0)
Transmitter antennas (TX)TX1/TX2(146, 63, 3.5)/(281, 63, 3.5)
Passenger carsP1/P2/P3(70, 83, 1.5)/(161, 40, 1.5)/(210, 83, 1.5).
P4/P5/P6(370, 83, 1.5)/(117, 10, 1.5)/(175, 10, 1.5).
PA/PB/PC(149, 70, 1.5)/(204, 70, 1.5)/(323, 10, 1.5).
BuildingsB1, B2, B3, B4, B5, B6Not applicable
Table 2. Simulation parameters.
ParametersValues
TX: Pt/Gain/Frequency/Height.0 dBm/0 dB/5.9 GHz/3.5 m
RX: RST/Gain/Frequency/Height.−120 dBm/0 dB/5.9 GHz/1.5 m
Antenna Polarization (RX, TX)Omnidirectional
3D Ray tracing: angular resolution/Reflections1 degree/7
Scenario size/Unitary volume analysis(400 × 150 × 22) m/1 m3 (1 × 1 × 1) m
Table 3. Received Signal Strength.
TXRXRSS [dBm]
TX1P1/P2/P3/P4/P5/P6−94.66/−88.07/−81.44/−127.30/−122.81/−123.62
TX2P1/P2/P3/P4/P5/P6−200.00/−200.00/−95.61/−85.55/−200.00/−194.65
TX1+TX2P1/P2/P3/P4/P5/P6−94.66/−88.07/−81.28/−85.55/−122.81/−123.62
Publisher’s Note: MDPI stays neutral with regard to jurisdictional claims in published maps and institutional affiliations.

