Proceeding Paper

Associations between Commonly Used Characteristics in Frailty Assessment and Mental State in Frail Elderly People †

1
MAmI Research Lab, University of Castilla-La Mancha, Ciudad Real 13071, Spain
2
Health Service of Castilla-La Mancha, Geriatric Services, Residencia Asistida de Ancianos, Ciudad Real 13005, Spain
*
Author to whom correspondence should be addressed.
Presented at the 12th International Conference on Ubiquitous Computing and Ambient Intelligence (UCAmI 2018), Punta Cana, Dominican Republic, 4–7 December 2018.
Proceedings 2018, 2(19), 1247; https://doi.org/10.3390/proceedings2191247
Published: 17 October 2018
(This article belongs to the Proceedings of UCAmI 2018)

Abstract

:
This paper presents a cross-sectional study to analyze the impact on cognitive decline of a set of characteristics used for frailty assessment in elderly people. Considered characteristics come from several dimensions, including anthropometric, biological, nutritional, functional and mobility. Cognitive functioning is estimated by the Mini-Mental State Examination test. Additionally, mobility dimension is assessed from two perspectives: one based on direct observation of ambulation through subjective gait analyses; and the other performing explicit gait trials by using the instrumentation provided. In order to accomplish the purpose of this research, a multiple logistic regression analysis is carried out. Variables are grouped according to popular and/or standardized categories adopted in other clinical studies. Mini-Mental State Examination represents the dependent variable, while the characteristics for frailty assessment make up the set of explanatory variables. The multiple logistic regression is performed using a sample of 81 frail elders from two nursing homes in Spain. The results obtained indicate that frail elders aged 90 years of older, with moderate dependence in daily functioning, moderate risk of falls and with a stride interval gait variability greater than 6% were most likely to suffer cognitive decline, representing what is called cognitive frails.

1. Introduction

Frailty is a geriatric multifactorial syndrome recognizable by an increased risk of adverse health outcomes due to cumulative decline of multiple physiological systems. It results in a low metabolic reserve and a difficulty in maintaining organic homeostasis after stressor events [1]. The frailty cycle proposed by Fried et al. [2] attempts to describe the origin and progression of this syndrome, modelling the biological, physiological and functional alterations that lead to different frailty states and how these alterations are interrelated.
The Fried’s cycle, mentioned above, is a well-known definition of frailty widely accepted by the international scientific community. However, it is mainly focused on physiological and functional changes, which encloses physical inactivity monitoring (including slowness in gait); energy dysregulation; undernutrition examination; loss of muscle mass control and self-reported indications of weakness and fatigue. It does not consider mental state and cognitive functioning. Therefore, the relationship between frailty and cognition (and vice versa) remains unclear and studies about it are scarce.
Avila-Funes et al. [3] infer that cognitive decline enhances the predictive validity of frailty for the occurrence of adverse outcomes in a four-year longitudinal study.
Conversely, other longitudinal studies attempts to estimate the cognitive impairment progression in the elderly, without explicitly considering frailty status. In this sense, Farias et al. [4] report that annual conversion from Mild Cognitive Impairment (MCI) to dementia ranges from 10% to 15% in clinic samples, while conversion rates in community-based studies are often substantially lower, ranging from 3.8% to 6.3% per year. MCI is used to describe the transition between normal cognition and Alzheimer’s disease (AD) in Farias’ work.
In terms of frailty assessment, Farias et al. only consider functional evaluation through the CRD [5] measure of everyday functioning. The CDR is based on a structured caregiver interview. Scores are obtained in 6 different functional domains (memory, orientation, judgment and problem solving, community affairs, home and hobbies, and personal care).
In the literature, we can also find longitudinal cohort studies that have identified associations between frailty and cognitive functioning. They consider different frailty status, e.g., non-frail, prefrail and frail; and different levels of cognitive impairment, e.g., MCI, severe cognitive impairment, mild AD and moderate AD [6,7,8,9]. All these works report that associations between frailty and cognitive impairment become stronger as the severity of frailty syndrome increases, also augmenting the presence of adverse health outcomes (functional disability, hospitalization and mortality). This is called cognitive frail by Feng et al. [10].
All works looking for associations between frailty and mental state that were presented in the last paragraph rely on the frailty phenotype proposed by Fried et al. [2] to characterize the syndrome and to study its relationship with cognitive decline. Conversely, our proposal is to assess frailty syndrome from a multidimensional point of view, that extends the Fried’s phenotype. It will consider characteristics from different nature, such as anthropometric, biological, nutritional, functional and mobility dimensions and study their impact on mental state.
This paper presents a cross-sectional study focused on elders previously diagnosed as frail according to the Fried’s phenotype criteria [2]. As reported in longitudinal studies, frail condition is the one where cognitive decline has more presence. Thus, we attempt to go deeper in this specific frail status through the multidimensional analysis proposed. Mini-Mental State Examination (MMSE) [11] is the tool used to assess mental state in each of the related works. MMSE is a 30-point questionnaire that is used extensively in clinical settings to estimate the severity and progression of cognitive decline and to follow the course of cognitive changes over time. The current study uses the Spanish variant of MMSE [12] with a 35-point score.

2. Objective

The aim of this work is to study the associations between commonly characteristics used to assess the progression of frailty syndrome and mental state in frail elderly people. We try to infer which is the impact on cognitive decline of several estimated characteristics coming from anthropometric, biological, nutritional, functional and mobility dimensions. Mental/cognition state is determined by the MMSE test. The rest of considered characteristics are thoroughly explained in Section 3.2.
In order to accomplish this purpose a multiple logistic regression analysis [13] is carried out (Section 3.4). MMSE score will represent the dependent variable, while the commonly characteristics used to assess frailty will make up the set of explanatory variables.
Concerning the explanatory variables, it is important to highlight the way mobility assessment is performed from two different perspectives. On the one hand, mobility is analyzed through methods based on direct observation of gait/ambulation and balance, which may be considered a subjective analysis because of manually scoring by a specialist; on the other, gait is quantitatively characterized using the infrastructure and wearable devices introduced in Section 3.1.
With the addition of explicit gait trials through the instrumentation provided, our aim is to complement observational gait analysis to achieve a more reliable characterization of the gait cycle.

3. Materials and Methods

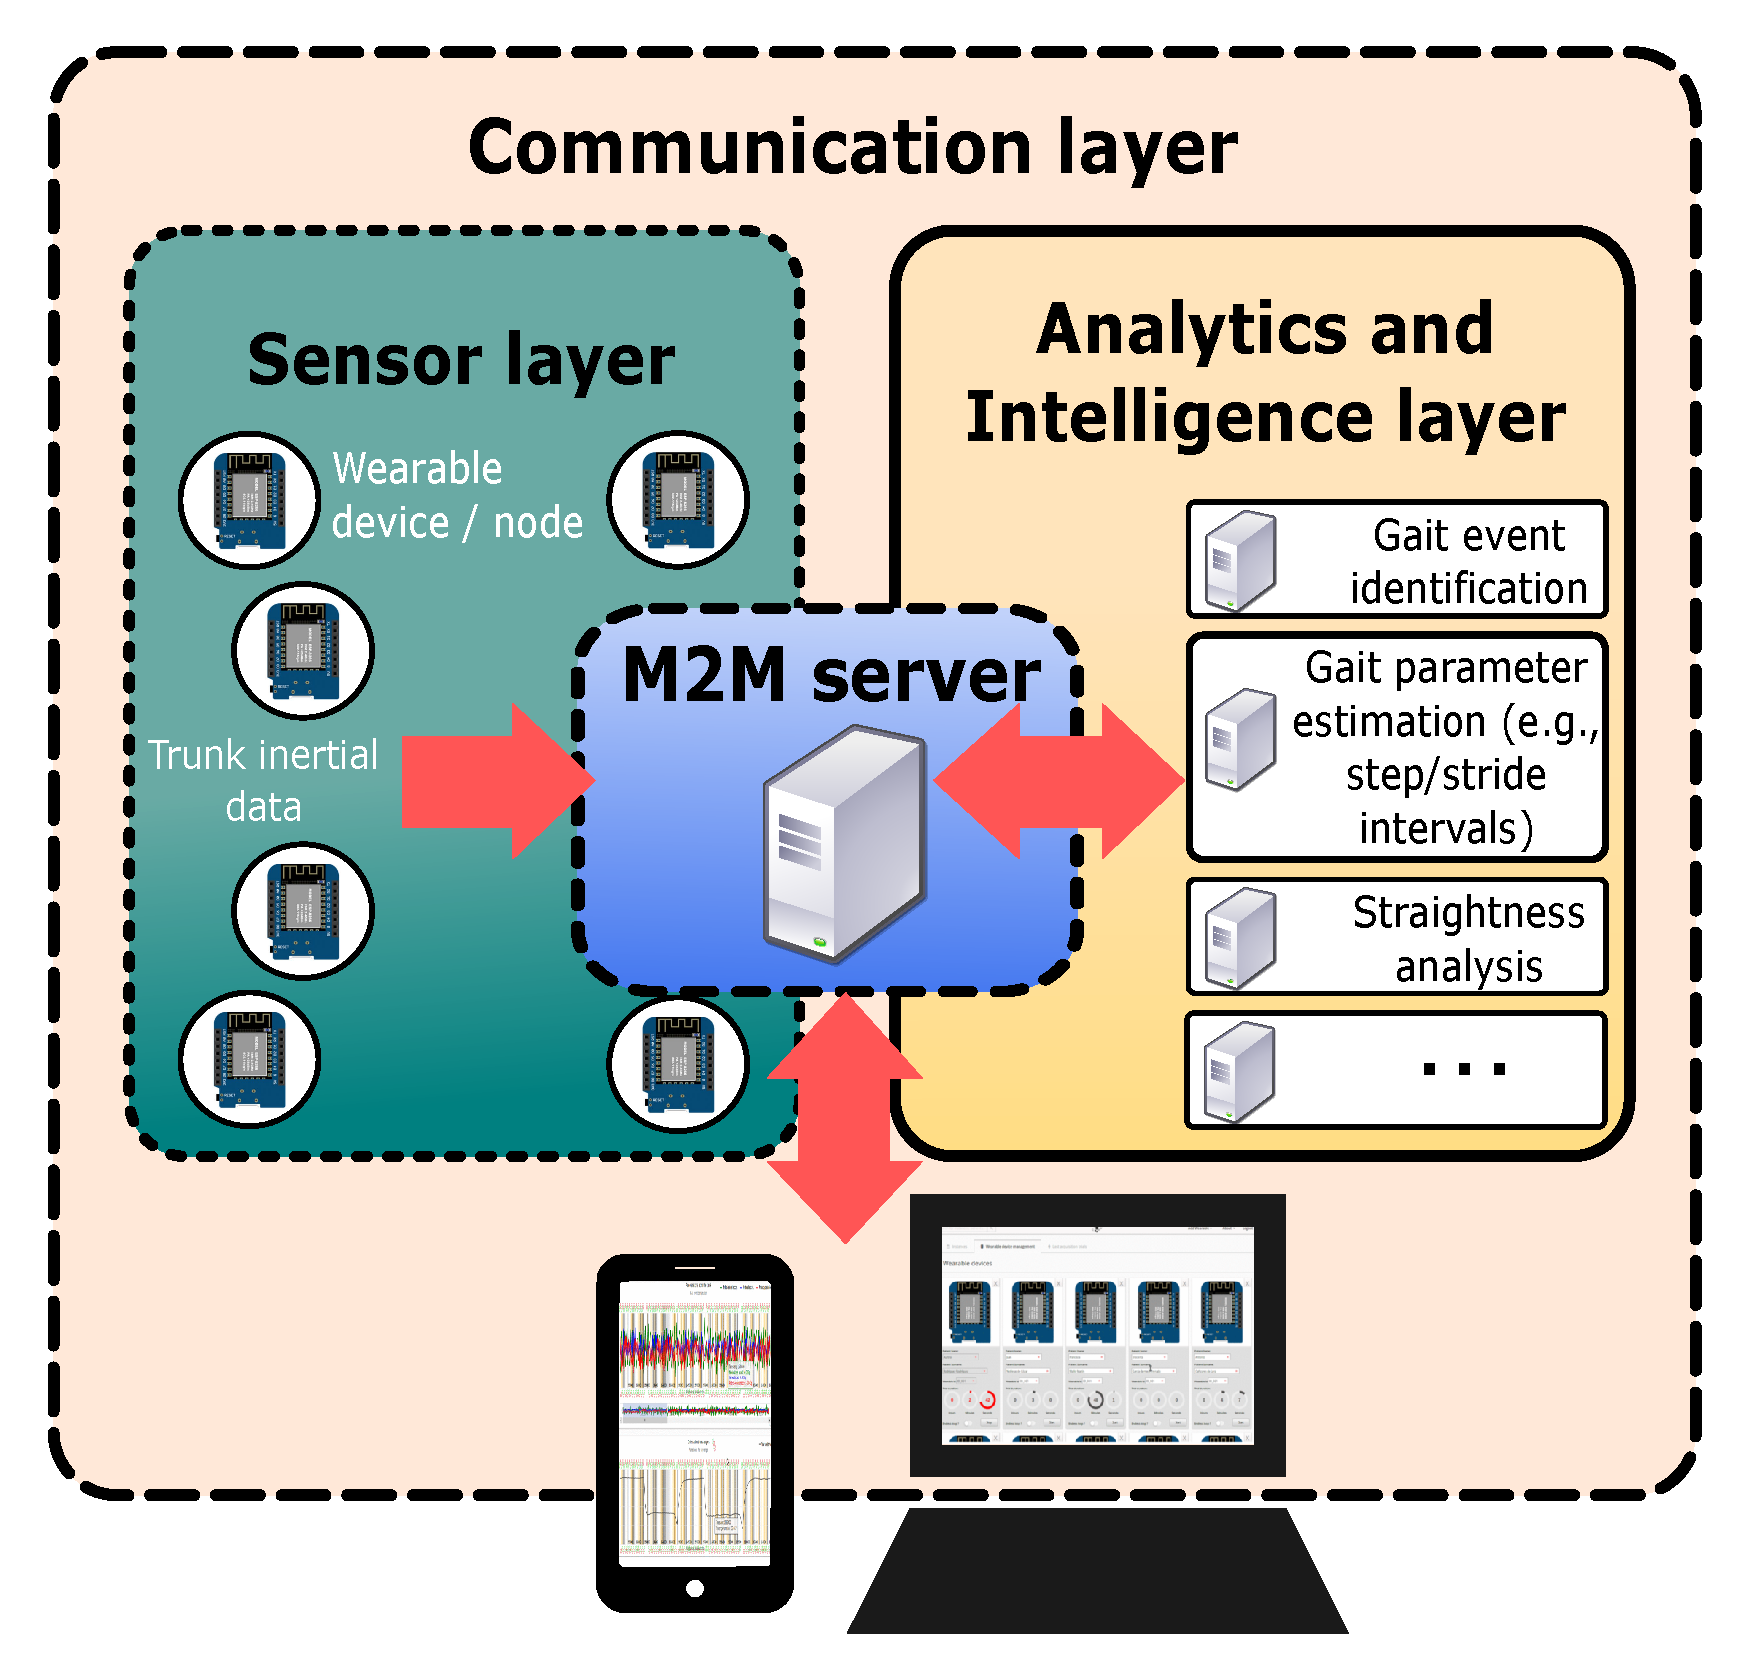
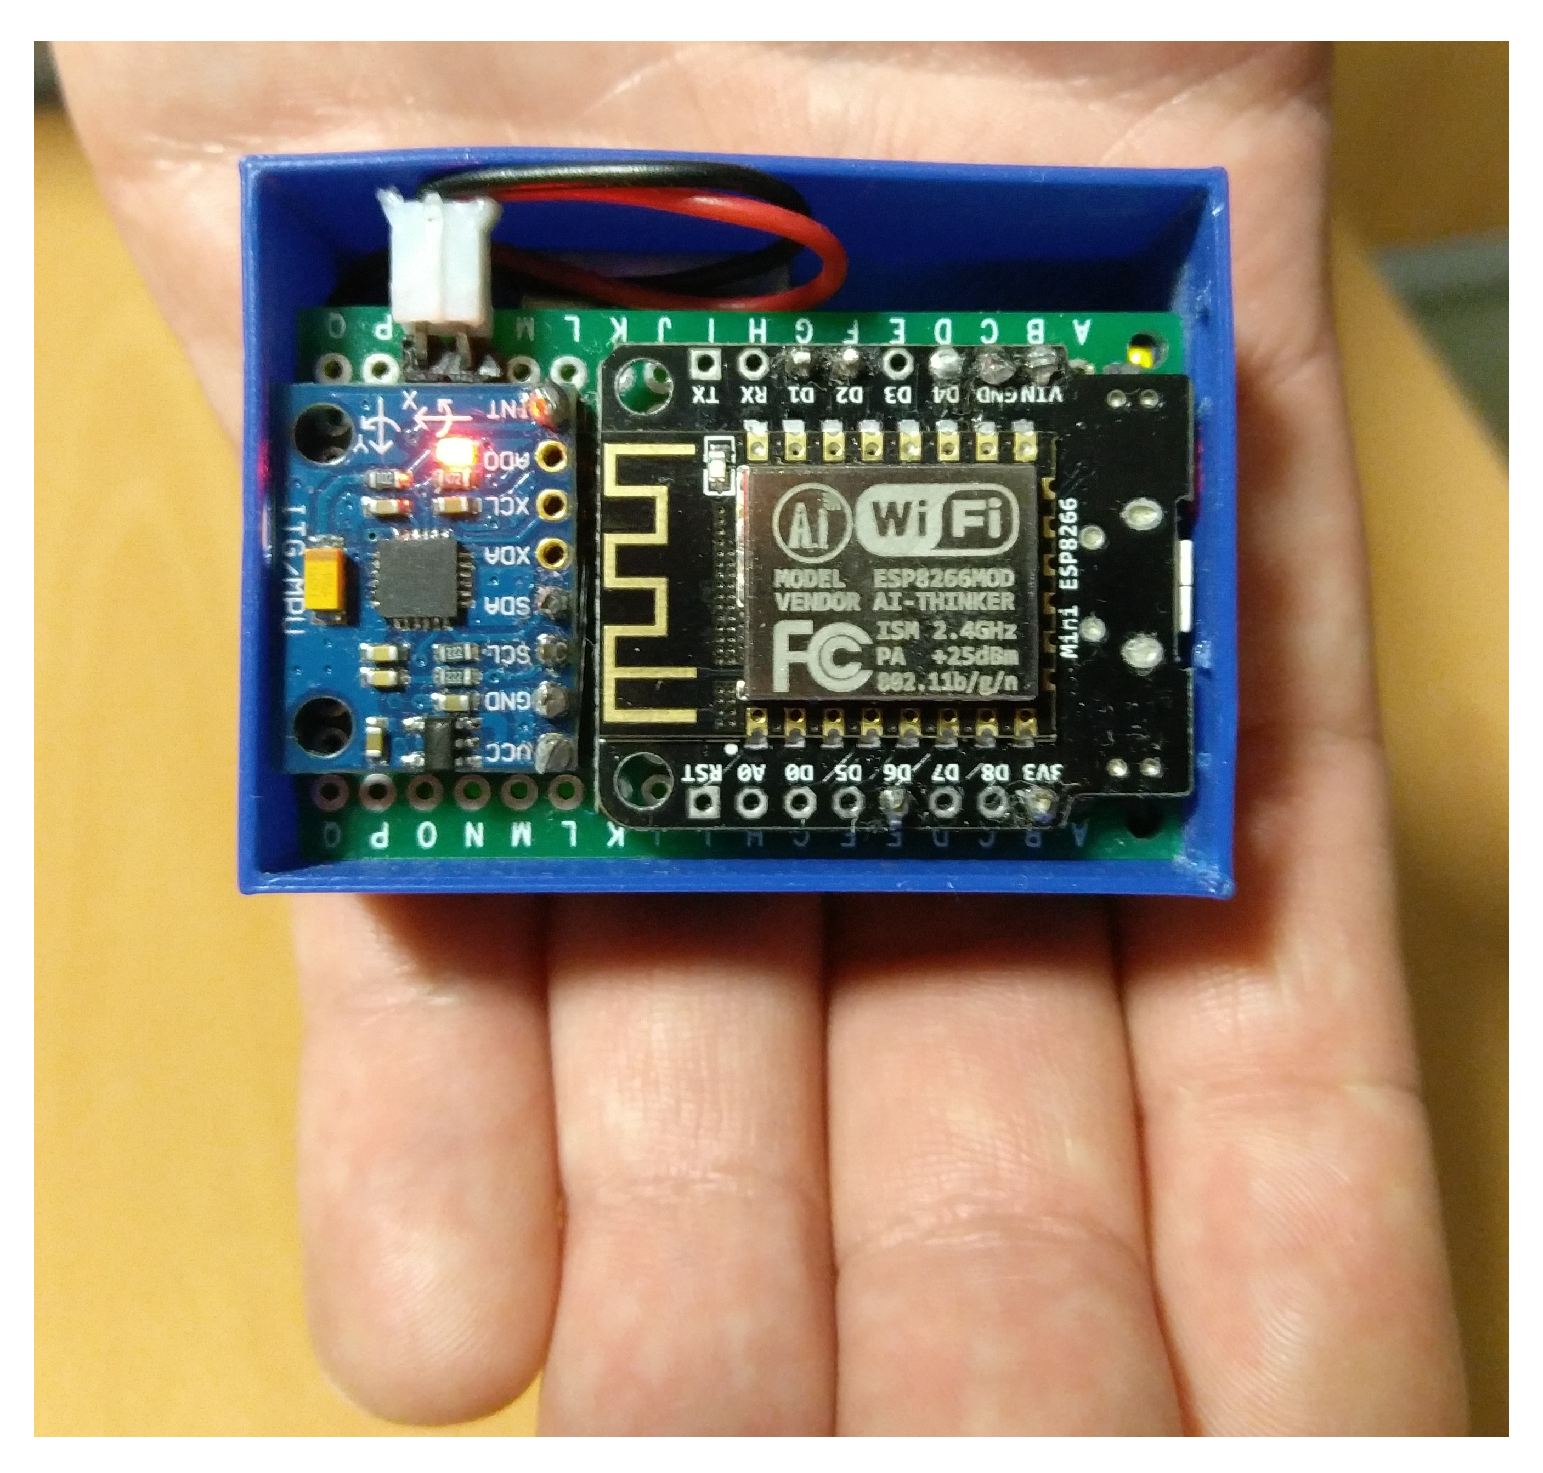
3.1. Instrumentation

The infrastructure provided to demarcate gait events from explicit trials has been introduced in a previous work [14]. Specifically, the infrastructure is conceived to be deployed in Assisted Living Environments. An overview is provided in Figure 1. It consists of a M2M (Machine-to-Machine.) server/broker used to communicate the Sensor layer, responsible for acquiring inertial raw data during gait trials, with the Analytics and Intelligence layer where this data is processed.
The core processing module in the Analytics and Intelligence layer intends to identify heel-strikes (This gait event occurs when one heel contacts the ground for the first time. It marks the beginning of a new gait cycle/stride.) and toe-off (This gait event occurs when toe lifts off the ground. It represents the final period of foot contact followed by a swing phase.) events from gathered inertial data. In addition, further processing stages are performed in this layer, for instance, to estimate derived gait parameters such as step or stride intervals or to carry out a straightness analysis which is able to segment straight paths within the gait trials, discarding turns and short stops.
Inertial raw data is acquired in the Sensor layer thanks to a set of wearable devices (nodes) connected to the same wireless local area network than the M2M broker. One single node attached to the upper cloth of each participant, close to the T1 thoracic vertebra, makes possible to gather trunk acceleration and orientation at 50 Hz uniform sample rate during explicit gait trials. Each wearable device is equipped with a wireless transceiver in combination with a 6-DoF IMU (Six Degrees of Freedom Inertial Measurement Unit (tri-axial accelerometer + tri-axial gyroscope).) which is wired to an embedded 32-bit micro-controller.
Figure 2 shows one node from the Sensor layer which has been used in the gait trials. The inertial-based wearable device has been attached to the the upper cloth, as previously indicated (upper back).
Trunk accelerations and orientations coming from each node are transmitted, passing through the M2M server, to the Gait event identification service in the Analytics and Intelligence layer. This is an offline service that demarcates heel-strikes and toe-off events from trunk accelerations, once the gait trial has finished. The Gait event identification service uses the algorithm for heel-strike and toe-off event demarcation that was introduced in our previous work [15]. This algorithm helps to identify these events from acceleration data through the scale-space filtering idea. Cut-off points between filtered acceleration signals as a result of convolving with varying levels/scales of Gaussian filters and other robust features against temporal variation and noise are used to identify peaks that correspond to gait events.
Communication layer concludes this review about the infrastructure used to accomplish quantitative gait analysis. It includes a web client application that allows us to manage each connected node in order to start/stop a gait trial. Moreover, it provides an interface through the different services in the Analytics and Intelligence layer so that detected gait events can be marked on the acceleration signals or summarized information about the estimated gait parameters can be obtained.
More specific details about the infrastructure can be found in our previous work [14].

3.2. Subjects, Variables and Protocol

Table 1 shows a summary description of the elders who participate in this study. The sample was made up of 81 frail elders from two nursing homes: Residencia Andamarc and Residencia Asistida de Ancianos Gregorio Marañón, both located in Ciudad Real (Spain).
Several dimensions related to frailty assessment were evaluated. Particularly, age and sex were considered, together with the BMI (Body Mass Index.) characteristic from the anthropometric perspective. Nutritional condition was examined through the MNA (Mini Nutritional Assessment.) test [16,17]. The biological dimension was also included by measuring blood concentrations of leukocytes, lymphocytes, proteins and total cholesterol. In addition, criteria for estimating person’s daily functioning, particularly the Activities of Daily Living (ADL) and mobility, were also considered through the 10-items Barthel scale [18,19].
Mobility assessment was reinforced with the Tinetti Performance Oriented Mobility Assessment (POMA), also known as the Tinetti test [20]. The Tinetti’s overall score facilitates an estimate of the risk of fall in the elderly. It is important to note that this test not only considers gait, but also balance abilities.
The observational estimations of gait performance through the Tinetti test were accompanied by explicit gait trials, as part of quantitative gait analyses carried out in the facilities of both nursing homes. Specifically, heel-strikes events from both legs where demarcated by using the inertial-based wearable introduced in the Instrumentation section.
Stride intervals were computed from the heel-strikes while walking at a comfortable speed along a 20-m straight line. The gait trial duration was 1 min and 30 s long per participant. Every time the end of the straight path was reached the participant turned around and continued walking in the opposite direction until the time of the trial was over.
The acceleration segments corresponding to turns were automatically discarded from each gait trial by the wearable system [14]. This was done in this manner since the strides taken while turning were no representative of the gait cycle performed at normal pace. Furthermore, the previous stride to the turn and the subsequent one after it were also automatically removed to avoid acceleration and deceleration stages, which also skews the normal gait pattern of each participant. Mean and Coefficient of Variation (CV) were computed from the stride interval time series of each participant.
Lastly, the MMSE test introduced before was obtained for all the participants in the study to examine their mental state and the risk of suffering cognitive impairment.
All considered variables were categorized as shown in Table 1. This data transformation intended to accommodate continuous values to discrete categories for the multiple logistic regression analysis conducted afterwards.

3.3. Descriptive Statistical Analysis

The categorization indicated in the last section allows to reduce data complexity from continuous variables to “singular units of meaning” (categories), highlighting the systematic structure behind the original dataset and retrieving more conceptual meaning from the acquired data. This preprocessing was very appropriate because of the small sample size handled in the study (n = 81).
Based on the descriptive statistical analysis that draws up the absolute (n) and relative (%) frequencies reported in Table 1, it can be observed that all the frail elders included in the sample were aged 75 years or over, with slight prevalence of elderly people aged 85 or older (63%). With regard to sex, the study sample was well-balanced with 48% women compared to 52% of men.
The BMI characteristic from the anthropometric dimension was divided into the three standard weight status categories associated to the BMI percentages: normal (<25%), overweight (25% ≤ BMI < 30%) and obese (≥30%). There was a clear predominance of overweight (43.2%) and obese (38.3%) patterns over normal weight (18.5%).
The scores referred to the nutritional condition evaluated through the MNA test were also divided into the same categories defined by the 30-point scale MNA tool [16]: malnutrition status (<17 points), risk of malnutrition (17 ≤ MNA < 24) and normal nutritional status (24 ≤ MNA ≤ 30). Paying attention to the frequencies of these categories in Table 1, it can be observed that there were no participants in malnutrition condition in the sample. Around 60% of the elders had normal nutritional state. However, near 40% were within the risk of malnutrition range.
Leukocytes, lymphocytes and protein levels in serum were categorized using the current reference ranges accepted by healthcare professionals for low, normal and high concentrations of these biological markers. As can be seen in the summary description, most elders (above 70%) had normal levels for these characteristics, while high levels of leukocytes and lymphocytes were found in no more than 5% of the sample. There were no elders with high level of total serum protein (≥8.3 g/dL) in the whole sample. On the other hand, around  20% of the participants had leukocytes, lymphocytes or proteins deficiencies.
Total cholesterol was also provided by the blood tests carried out in the study. On the basis of the frequencies referred to cholesterol levels, the majority of the sample (87.6%) had normal values according to cholesterol management guidelines [21]. Only 12.4% of the elders fell outside the normal range exhibiting moderate to high cholesterol. None of the participants reported very high levels.
Regarding Barthel index, there was no person scored as severe dependent or completely dependent in the sample. Therefore, moderate dependence, mild dependence and independent were the three scale levels considered as categories in our analysis. There was no clear prevalence of one group over the rest, being the independent group the least numerous in the sample (28.4%), compared to the 37% and 34.6% for the mild and moderate groups, respectively.
Due to particular characteristics of the sample, the Tinetti test had more discriminatory strength than the Barthel index between the frail elders involved in the study. Specifically, 44.4% of the participants were scored with a moderate risk of fall, while 22.2% had an increased severe risk of falling. The abscence of risk (>24 points), denoting strong gait and balance performance, was found in one-third of the sample. Again, categories previously defined by the corresponding test were used in our analysis.
In order to enrich the gait characterization provided by the Tinetti test, temporal gait parameters were estimated by using the instrumentation introduced in Section 3.1. Initially, cadence (Steps per minute.)and mean and CV from the step interval time series were considered together with mean and CV from the stride intervals. However, the strong multicollinearity between these predictors led to biased estimates and inflated standard errors in the subsequent logistic regression analysis. Particularly, stride interval mean, step interval mean and cadence were highly correlated (correlation coefficient R∼1). Similarly happened with CV from step intervals and CV from stride interval time series (R∼1). Because of the relevance of stride-to-stride (stride interval) variability in the literature associating gait performance with cognitive decline (e.g., [22,23,24]), it was decided to retain stride interval statistics and remove cadence and step interval parameters to avoid collinearity.
Four categories were established to split continuous values from the stride interval mean. The lower and upper ones were fixed according to stride times observed in empirical studies involving elderly populations [15,25]. In these studies, elders without evidence of gait disorder or known motion limitation performed controlled gait trials gathering stride intervals in the range from 900 to 1550 ms (milliseconds). Therefore, two categories, <1000 ms and ≥1400 ms, were considered together with two inner intervals equidistantly-separated in [1000, 1200) and [1200, 1400) ms. The sample underlined the group of elders within the <1000 ms category was the most reduced (16% of the sample).
The ranges of the categories selected for the stride interval CV were also chosen in accordance with CVs reported in other studies about stride interval variability in elders with/without falling history [15,26,27,28]. These studies shown similar results, with healthy elderly population within the range of 1.7 to 2.6% for the stride interval CV [27] and those with a history of fall within 3.0  ± 2.8%  [28]. Therefore, stride interval variability above 6% of coefficient of variation might be considered high. Only 12.3% of our study sample presented this value.
Lastly, the MMSE (35-point Spanish variant used) reflected that 68% of the elders were presumably out of cognitive impairment risk depending on the MMSE criterion (MMSE ≥ 23). Conversely, 32% had a score under 23 points which indicates that, according to the MMSE test [12], there is a high probability of cognitive decline.

3.4. Multiple Logistic Regression

The study sample presented in Section 3.2 and Section 3.3 was used for statistical inference with the aim of building a multiple linear regression model for the MMSE score (as a continuous variable). In order to fit the inference model, Factor Analysis (FA) technique was tested.
FA attempts to identify latent relations (factors) between variables simplifying the linear regression model and reducing its dimensionality. Factors can be interpreted in terms of patterns of association among explanatory variables with different impacts on the dependent variable (MMSE score in this particular case). These explanatory patterns may be easily interpreted by humans.
However, FA assumes there is a strong linear relationship (high correlation) between explanatory variables and that there is no multicollinearity. This second assumption was faced reducing our set of considered temporal gait variables, as previously explained in Section 3.2. Nevertheless, the analysis of correlations among resultant variables shown that there were low to moderate correlations (R ∼ 0.35 at best). Therefore, FA would not provide good explanatory factors in these conditions. This was confirmed with the application of the Kaiser-Meyer-Olkin (KMO) test. This tool measures sampling adequacy for each explanatory variable in the model and for the complete model.
More specifically, KMO value under 0.50 means that there are large partial correlations compared to the sum of correlations. In other terms, there are widespread correlations which are a large problem for FA. For our study sample the value obtained for KMO was ∼0.40, so that FA was unacceptable.
Once FA was ruled out, binomial logistic regression [13] was considered to fit an inference model for the MMSE score. Logistic regression is better placed to deal with non-highly-correlated variables than FA, moreover, it also fits better when the sample size is small, as in the current study (n = 81). However, this kind of multiple regression provides a single binary categorical response (dependent variable) from a set of multiple explanatory variables which can be discrete, continuous or a combination.
The variables and categories that were established for each of the dimensions presented in Section 3.2 were considered as candidates for the set of independent variables. In this case, all selected explanatory variables were discretized in this multiple logistic regression model (using the categorization provided).
Concerning the binary response, the binomial logistic regression estimated the probability that cognitive impairment existed (MMSE < 23) or not. Besides fitting a model to make predictions about mental state, the binomial logistic regression allowed to study the impact of the explanatory variables (characteristics in frailty assessment) on the probability of existence of cognitive decline. The latter is the main aim of the presented study, as indicated in Section 2.
Previously to fit the multiple regression model, each of the categorical variables from Table 1 was individually compared to the MMSE dependent variable by using the Chi-square test of independence. This allows us to check if they were related or not. The significance level adopted was 5% so that the null hypothesis (independence) was rejected for this test if the p-value was less than 0.05. Null hypothesis rejection indicates that there was relationship between the MMSE and the particular explanatory variable being tested. Those categorical variables showing dependence with MMSE were the ones considered in the multiple logistic regression analysis.
The R (R is a free multiplatform software environment for statistical computing, numerical analysis and graphics [29].) software environment was used for the multiple logistic regression analysis. As will be explained in the Results Section, using the binomial logistic regression implementation in the R package the model did not converge at the first attempt, given large standard errors. The problem was solved using the bias reduced method of logistic regression proposed by Firth [30,31] which is implemented in the brglm package in R.

4. Results

Table 2 contains the comparison between the MMSE dichotomous variable, indicating the presence of cognitive decline and the rest of categorical variables used in the characterization of frailty. Each row represents a contingency table accompanied by the resulting p-value from the Chi-square test.
As can be observed, there were significant associations (marked with an asterik) between MMSE and age (p-value = 6.6× 10 5 ), MMSE and the Barthel scale (p-value = 0.0008 ), MMSE and the Tinetti test (p-value = 0.003 ) and MMSE and the stride interval CV (p-value = 0.0006 ).
The presence of cognitive decline (MMSE < 23) correlated individually with greater numbers of elderly people aged 90 years or over; correlated individually with moderate dependence according to the Barthel scale (scores in the [61, 91) interval); correlated individually with elders in moderate and severe risk of fall (scores 24 in the Tinetti test); and also, the presence of cognitive decline (MMSE < 23) correlated individually with percentages in the stride interval variability mainly in the [4, 6] and >6 intervals. The rest of variables did not reject the null hypothesis in the Chi-square test, consequently they were considered not related to the MMSE and excluded from the multiple logistic regression analysis.
The multiple logistic regression analysis was carried out to study the presence of cognitive decline (high probability of cognitive impairment when MMSE < 23) in relation to age, Barthel and Tinetti scoring and the stride interval CV. The classic logistic regression algorithm (glm() function with parameter family=binomial.) implemented in R did not converge because of the phenomenon known as “separation” which avoided fitting the model properly at the first attempt.
Displaying extremely large standard errors is the only symptom of the separation problem in the fitted model. Separation or monotone likelihood occurs in the fitting process if the likelihood converges while at least one predictor estimate diverges to infinity. Separation primarily happens in small samples with unbalanced and highly predictive risk factors, which is quite common in binary response models [31]. In simple terms, the separation occurs when at least one explanatory variable perfectly separates zeroes and ones in the target variable.
A solution to the separation problem is to use a form of penalized regression which reduces the bias of maximum likelihood estimates and produces robust standard errors. The procedure developed by Firth [30] relies on a Bayesian approach to reduce the bias of maximum likelihood estimates solving the separation problem.
The Firth’s bias reduced method of logistic regression was used to fit a model for the MMSE in relation to age, Barthel and Tinetti scoring and the stride interval CV. Results are shown in Table 3. The significance level adopted was p = 0.05.
The odds ratio for the frail elderly people with high probability of cognitive decline (MMSE < 23) was 6.23 times higher among those aged 90 years or older than in frail elders aged between 75 and 79 years old. The other age categories were far away from the minimum significance level in the fitted model so that their relation with MMSE had not to be considered.
Regarding the Barthel scale, frail elders with moderate dependence, with scores in the [61, 91) range, had odds ratio 6 times higher than the independent ones. In other terms, they were six times more likely to have cognitive decline (MMSE < 23) than those with 100 points in the Barthel scale. p-value for the mild dependence category was over the significance threshold (<0.05) which indicated that this odds ratio, coming from the fitted logistic model, was not useful for infering relations between the presence of cognitive decline and mild dependence in performing ADL activities.
None of the odds ratios in the Tinetti test categories was under the significance level (<0.05), however the moderate risk of fall category had an odds ratio which fell within the <0.1 significance level (p-value = 0.097), marked with a (·) symbol in Table 3. We can not make a strong assumption about it, however a larger sample probably would made the model converge within the p-value = 0.05 significance level for the moderate risk of fall. A glance at this category of the Tinetti test considering the threshold at p-value = 0.1 indicates that frail elders with moderate risk of falls (scores in the [19, 24] interval) are around 4 times more likely to have cognitive decline than elders in absence of risk of fall.
Lastly, the logistic inference model indicated that those elders with a stride interval variability within the [2, 4) range of percentages had 0.12 times lower possibilities of having cognitive decline than those with a variation bigger than 6% (which represents high gait variability). The odds ratio is less than 1 due to the choice made while selecting the reference category for stride interval CV in the input parameters of the logistic regression algorithm in R.
In this case, stride interval CV >6% points out greater risk of having cognitive decline than a stride variability within the [2, 4) range. It is enough to invert the odds ratio to get more self-explanatory meaning in this sense. Therefore, frail elders with a stride interval CV > 6% had 1/0.12 = 8.33 times higher possibilities of suffering cognitive impairment than those with more regular stride intervals around 2% or 3% of CV.

5. Discussion

The multiple logistic regression analysis performed in Section 4 results in a fitted model that can be used to infer information about the impact on the mental state of some of the dimensions, variables and categories that were initially considered in the cross-sectional study. As it will be discussed here, not all of them are finally relevant in the frail elderly population.
With regard to the anthropometric dimension, the Chi-square tests reject that there were real associations inferred from the sample data and extrapolated to the frail elderly population between the pairs [Sex and MMSE] and [BMI and MMSE]. Age variable, for its part, held association with the mental state, thus, it was the only anthropometric variable included in the logistic regression. Particularly, the fitted model provides certainty regarding the strong presence of cognitive decline in frail elderly population aged 90 years of older, in comparison with those under 80 years old.
Neither the nutritional dimension (MNA variable) nor the biological (Leukocytes, Lymphocytes, Proteins and Cholesterol) shown relationships with the mental state that could be extrapolated to the frail elderly population, according to the Chi-square tests. Therefore, they were not considered in the logistic regression.
Daily functioning estimated through the Barthel scale, for its part, shown associations scalable to the frail elderly population. In fact, the fitted regression model provides certainty regarding the strong presence of cognitive decline in frail elders under <90 points in the Barthel scale, in comparison with those with perfect daily functioning capabilities.
Regarding the mobility assessment, both, quantitative gait analysis (through the stride interval variability) and subjective gait analysis (through the Tinetti test) held individual relationships with the MMSE variable in the Chi-square tests. By contrast, stride interval mean had not relationship with the MMSE. It is important to highlight that there were other quantitative gait variables initially considered (cadence and step interval mean/variability) that were discarded in the first stages to avoid strong multicollinearity problems. Stride interval was selected due to its relevance in the literature associating gait performance with cognitive decline (Section 3.3).
The multiple logistic regression fitted model reflects the strong association between stride interval variability and mental state, being high stride interval variability (>6%) the most influencing factor to develop cognitive decline in the multivariate model.
The fitted model can not ensure assumptions of association between the mental state and the gait and balance examination performed by the Tinetti test. This is because the p-value obtained does not reject the Null hypothesis. If the significance level adopted is moved up to <0.1, the moderate risk of falls (Tinetti test scored between 19 and 24) may be considered. It reflects 4 times more possibilities of developing cognitive decline than perfect mobility state and absence of risk of fall.

6. Conclusions and Future Work

A key limiting factor in this work is the sample size used (n = 81). Including new frail elders to the multiple logistic regression analysis might provide higher level of granularity in the dependent variable (MMSE). For the time being, the performed analysis is a binary logistic regression, thus, we can only divide MMSE into two categories, one for the presence of cognitive impairement (MMSE < 23) [12] and one for the absence (MMSE ≥ 23). New records makes possible to attempt to fit a multinomial logistic regression so that a categorically distributed MMSE dependent variable could be achieved instead, dividing mental state in mild, moderate and severe categories.

Author Contributions

Conceptualization, I.G., F.J.N. and J.B.; Methodology, I.G., F.J.N. and R.H.; Software, I.G. and J.F.; Hardware, I.G.; Validation, R.C.G. and F.J.N.; Formal Analysis, I.G. and F.J.N.; Investigation, I.G., R.C.G. and J.F.; Resources, R.C.G. and F.J.N.; Data Curation, I.G. and J.F.; Writing-Original Draft Preparation, I.G. and R.C.G.; Writing-Review & Editing, R.H.; Supervision, R.H., F.J.N. and J.B.; Project Administration, J.B.; Funding Acquisition, J.B.

Acknowledgments

We want to especially thank the participants and healthcare professionals who helped us to carry out the different tests and gait trials in both nursing homes: Residencia Andamarc and Residencia Asistida de Ancianos Gregorio Marañón. We also want to thank the Plan Propio de Investigación from Castilla-La Mancha University for its support in this research.

Conflicts of Interest

The authors declare no conflict of interest.

References

  1. Rizos, L.R.; Soler, P.A. Fragilidad como predictor de episodios adversos en estudios epidemiológicos: RevisióN de la literatura. Revista Española de Geriatría y Gerontología 2013, 48, 285–289. [Google Scholar] [CrossRef] [PubMed]
  2. Fried, L.P.; Tangen, C.M.; Walston, J.; Newman, A.B.; Hirsch, C.; Gottdiener, J.; Seeman, T.; Tracy, R.; Kop, W.J.; Burke, G.; et al. Frailty in older adults: Evidence for a phenotype. J. Gerontol. Biol. Sci. Med. Sci. 2001, 56, M146–M157. [Google Scholar] [CrossRef] [PubMed]
  3. Avila-Funes, J.; Helmer, C.; Amieva, H.; Barberger-Gateau, P.; Goff, M.L.; Raoux, N.; Ritchie, K.; Carrière, I.; Tavernier, B.; Tzourio, C.; et al. Cognitive impairment improves the predictive validity of the phenotype of frailty for adverse health outcomes: The three-city study. J. Am. Geriatr. Soc. 2009, 57, 453–461. [Google Scholar] [CrossRef] [PubMed]
  4. Farias, S.T.; Mungas, D.; Reed, B.R.; Harvey, D.; DeCarli, C. Progression of mild cognitive impairment to dementia in clinic-vs community-based cohorts. Arch. Neurol. 2009, 66, 1151–1157. [Google Scholar] [CrossRef]
  5. Morris, J.C. The Clinical Dementia Rating (CDR): Current version and scoring rules. Neurology 1993, 43, 2412–2412. [Google Scholar] [CrossRef]
  6. Samper-Ternent, R.; Snih, S.A.; Raji, M.A.; Markides, K.S.; Ottenbacher, K.J. Relationship between frailty and cognitive decline in older Mexican Americans. J. Am. Geriatr. Soc. 2008, 56, 1845–1852. [Google Scholar] [CrossRef]
  7. Boyle, P.A.; Buchman, A.S.; Wilson, R.S.; Leurgans, S.E.; Bennett, D.A. Physical frailty is associated with incident mild cognitive impairment in community-based older persons. J. Am. Geriatr. Soc. 2010, 58, 248–255. [Google Scholar] [CrossRef]
  8. Chong, M.S.; Tay, L.; Chan, M.; Lim, W.S.; Ye, R.; Tan, E.K.; Ding, Y.Y. Prospective longitudinal study of frailty transitions in a community-dwelling cohort of older adults with cognitive impairment. BMC Geriat. 2015, 15. [Google Scholar] [CrossRef]
  9. Lee, Y.; Kim, J.; Chon, D.; Lee, K.E.; Kim, J.H.; Myeong, S.; Kim, S. The effects of frailty and cognitive impairment on 3-year mortality in older adults. Maturitas 2018, 107, 50–55. [Google Scholar] [CrossRef]
  10. Feng, L.; Nyunt, M.S.Z.; Gao, Q.; Feng, L.; Yap, K.B.; Ng, T.P. Cognitive Frailty and Adverse Health Outcomes: Findings From the Singapore Longitudinal Ageing Studies (SLAS). JAMDA 2017, 18, 252–258. [Google Scholar] [CrossRef]
  11. Folstein, M.F.; Folstein, S.E.; McHugh, P.R. Mini-mental state. J. Psychiatr. Res. 1975, 12, 189–198. [Google Scholar] [CrossRef]
  12. Lobo, A. El Mini Examen Cognoscitivo, un test sencillo, práctico, para detectar alteraciones intelectuales en pacientes psiquiátricos. J. Rev. Psiquiatr. Psicol. Med. 1980, 14, 39–57. [Google Scholar]
  13. Hilbe, J.M. Logistic Regression. In International Encyclopedia of Statistical Science; Lovric, M., Ed.; Springer: Berlin/Heidelberg, Germany, 2011; pp. 755–758. [Google Scholar] [CrossRef]
  14. González, I.; Fontecha, J.; Bravo, J. Relationship between stride interval variability and aging: Use of linear and non-linear estimators for gait variability assessment in assisted living environments. JAIHC 2017, 1–15. [Google Scholar] [CrossRef]
  15. González, I.; Fontecha, J.; Hervás, R.; Bravo, J. Estimation of Temporal Gait Events from a Single Accelerometer Through the Scale-Space Filtering Idea. J. Med. Syst. 2016, 40, 251. [Google Scholar] [CrossRef]
  16. Vellas, B.; Guigoz, Y.; Garry, P.; Nourhashemi, F.; Bennahum, D.; Lauque, S.; Albarade, J. The Mini Nutritional Assessment (MNA) and its use in grading the nutritional state of elderly patients. Nutrition 1999, 15, 116–122. [Google Scholar] [CrossRef]
  17. Casanovas, A.S. The Mini Nutritional Assessment. Twenty years contributing to nutritional assessment. Rev. Esp. Geriatr. Gerontol. 2012, 47, 245–246. [Google Scholar] [CrossRef]
  18. Mahoney, F.; Barthel, D. Functional Evaluation: The Barthel Index. Md. State Med. J. 1965, 14, 56–61. [Google Scholar]
  19. Collin, C.; Wade, D.; Davies, S.; Horne, V. The Barthel ADL Index: A reliability study. Int. Disabil. Stud. 1988, 10, 61–63. [Google Scholar] [CrossRef]
  20. Tinetti, M.E. Performance-oriented assessment of mobility problems in elderly patients. J. Am. Geriatr. Soc. 1986, 34, 119–126. [Google Scholar] [CrossRef]
  21. Cholesterol Levels: What You Need to Know. In NIH Medline Plus; 2012. Available online: https://medlineplus.gov/magazine/issues/summer12/articles/summer12pg6-7.html (accessed on 16 October 2018).
  22. Muir, S.W.; Speechley, M.; Wells, J.; Borrie, M.; Gopaul, K.; Montero-Odasso, M. Gait assessment in mild cognitive impairment and Alzheimer’s disease: The effect of dual-task challenges across the cognitive spectrum. Gait Posture 2012, 35, 96–100. [Google Scholar] [CrossRef]
  23. Bahureksa, L.; Najafi, B.; Saleh, A.; Sabbagh, M.; Coon, D.; Mohler, M.J.; Schwenk, M. The Impact of Mild Cognitive Impairment on Gait and Balance: A Systematic Review and Meta-Analysis of Studies Using Instrumented Assessment. Gerontology 2016, 63, 67–83. [Google Scholar] [CrossRef] [PubMed]
  24. Beauchet, O.; Launay, C.P.; Sekhon, H.; Barthelemy, J.C.; Roche, F.; Chabot, J.; Levinoff, E.J.; Allali, G. Association of increased gait variability while dual tasking and cognitive decline: Results from a prospective longitudinal cohort pilot study. GeroScience 2017, 39, 439–445. [Google Scholar] [CrossRef] [PubMed]
  25. González, I.; López-Nava, I.H.; Fontecha, J.; Muñoz-Meléndez, A.; Pérez-SanPablo, A.I.; Quiñones-Urióstegui, I. Comparison between passive vision-based system and a wearable inertial-based system for estimating temporal gait parameters related to the GAITRite electronic walkway. J. Biomed. Inform. 2016, 62, 210–223. [Google Scholar] [CrossRef] [PubMed]
  26. Matsuda, K.; Ikeda, S.; Nakahara, M.; Ikeda, T.; Okamoto, R.; Kurosawa, K.; Horikawa, E. Factors affecting the coefficient of variation of stride time of the elderly without falling history: A prospective study. JPTS 2015, 27, 1087–1090. [Google Scholar] [CrossRef] [PubMed]
  27. Owings, T.M.; Grabiner, M.D. Variability of step kinematics in young and older adults. Gait Posture 2004, 20, 26–29. [Google Scholar] [CrossRef]
  28. Hausdorff, J.M.; Rios, D.A.; Edelberg, H.K. Gait variability and fall risk in community-living older adults: A 1-year prospective study. Arch. Phys. Med. Rehabil. 2001, 82, 1050–1056. [Google Scholar] [CrossRef]
  29. The R Project for Statistical Computing. Available online: https://www.r-project.org/ (accessed on 16 October 2018).
  30. Firth, D. Bias reduction of maximum likelihood estimates. Biometrika 1995, 82, 667–667. [Google Scholar] [CrossRef]
  31. Heinze, G.; Schemper, M. A solution to the problem of separation in logistic regression. Stat. Med. 2002, 21, 2409–2419. [Google Scholar] [CrossRef]
Figure 1. Overview of the infrastructure provided by González et al. [14] which has been used to demarcate gait events and estimate derived gait parameters (stride intervals).
Proceedings 02 01247 g001
Figure 2. Inertial-based device attached close to the thoracic area (upper back). It was used to acquire trunk acceleration and orientation during gait trials.
Proceedings 02 01247 g002
Table 1. Description of anthropometric, biological, nutritional, functional and cognitive related characteristics of the sample of frail elders under study (n = 81).
VariableCategoryn(%)
Age (in years) [ 75 , 80 ) 19 ( 23.4)
[ 80 , 85 ) 11 ( 13.6)
[ 85 , 90 ] 23 ( 28.4)
90 28 ( 34.6)
Sexfemale 39 ( 48 )
male 42 ( 52 )
BMI(%) anormal < 25 15 ( 18.5)
overweight [ 25 , 30 ) 35 ( 43.2)
obese 30 31 ( 38.3)
MNA(/30) bnormal [ 24 , 30 ] 49 ( 60.5)
risk [ 17 , 24 ) 32 ( 39.5)
malnutrition < 17 0 ( 0 )
Leukocytes ( μ L)low 4500 15 ( 18.5)
normal ( 4500 , 11000 ) 62 ( 76.5)
high 11000 4 ( 5 )
Lymphocytes ( μ L)low 1500 20 ( 24.7)
normal ( 1500 , 4000 ) 58 ( 71.6)
high 4000 3 ( 3.7)
Proteins (g/dL)low 6 17 ( 21 )
normal ( 6 , 8.3) 64 ( 79 )
high 8.3 0 ( 0 )
Cholesterol (mg/dL)normal < 200 71 ( 87.6)
high [ 200 , 240 ] 10 ( 12.4)
very high > 240 0 ( 0 )
Barthel scale (/100)moderate dependence [ 61 , 91 ) 28 ( 34.6)
mild dependence [ 91 , 99 ] 30 ( 37 )
independent 100 23 ( 28.4)
Tinetti test (/28)absence risk of fall > 24 27 ( 33.4)
moderate risk [ 19 , 24 ] 36 ( 44.4)
severe risk < 19 18 ( 22.2)
Stride interval mean < 1000 13 ( 16 )
[ 1000 , 1200 ) 24 ( 29.6)
[ 1200 , 1400 ) 23 ( 28.4)
(msec) 1400 21 ( 26 )
Stride interval CV(%) c < 2 4 ( 5 )
[ 2 , 4 ) 30 ( 37 )
[ 4 , 6 ] 37 ( 45.7)
> 6 10 ( 12.3)
MMSE(/35) dimpairement < 23 26 ( 32 )
no impairement [ 23 , 35 ] 55 ( 68 )
a Body Mass Index. b Mini Nutritional Assessment. c Coefficient of Variation. d Mini-Mental State Examination.
Table 2. Comparison between MMSE (mental state) and the explanatory variables: age, sex, BMI, MNA, leukocytes, lymphocytes, proteins, cholesterol, Barthel scale, Tinetti test, stride interval mean and stride interval CV from the elderly individuals studied (n = 81). Contingency tables and Chi-squared tests are presented.
MMSE (Mental State)
VariableCategoryn(%)NO Cognit. Impairment (%)Cognit. Impairment (%)p-Value a
Age (in years) [ 75 , 80 ) 19 ( 23.4) 16 ( 29.1) 3 ( 11.5) 6.6× 10 5 (*)
[ 80 , 85 ) 11 ( 13.6) 11 ( 20 ) 0 ( 0 )
[ 85 , 90 ] 23 ( 28.4) 18 ( 32.7) 5 ( 19.25)
90 28 ( 34.6) 10 ( 18.2) 18 ( 69.25)
Sexfemale 39 ( 48 ) 23 ( 41.8) 16 ( 61.5) 0.155
male 42 ( 52 ) 32 ( 58.2) 10 ( 38.5)
BMI(%) bnormal < 25 15 ( 18.5) 10 ( 18.2) 5 ( 19.2) 0.316
overweight [ 25 , 30 ) 35 ( 43.2) 21 ( 38.2) 14 ( 53.8)
obese 30 31 ( 38.3) 24 ( 43.6) 7 ( 27 )
MNA(/30) cnormal [ 24 , 30 ] 49 ( 60.5) 35 ( 63.6) 14 ( 53.8) 0.549
risk [ 17 , 24 ) 32 ( 39.5) 20 ( 36.4) 12 ( 46.2)
Leukocytes ( μ L)low 4500 15 ( 18.5) 9 ( 16.4) 6 ( 23.1) 0.747
normal (4500, 11,000) 62 ( 76.5) 43 ( 78.2) 19 ( 73.1)
high 11 , 000 4 ( 5 ) 3 ( 5.4) 1 ( 3.8)
Lymphocytes ( μ L)low 1500 20 ( 24.7) 13 ( 23.6) 7 ( 26.9) 0.946
normal ( 1500 , 4000 ) 58 ( 71.6) 40 ( 72.7) 18 ( 69.2)
high 4000 3 ( 3.7) 2 ( 3.7) 1 ( 3.9)
Proteins (g/dL)low 6 17 ( 21 ) 11 ( 20 ) 6 ( 23.1) 0.979
normal ( 6 , 8.3) 64 ( 79 ) 44 ( 80 ) 20 ( 76.9)
Cholesterol (mg/dL)normal < 200 71 ( 87.6) 51 ( 92.7) 20 ( 77 ) 0.092
high [ 200 , 240 ] 10 ( 12.4) 4 ( 7.3) 6 ( 23 )
Barthel scale (/100)moderate depend. [ 61 , 91 ) 28 ( 34.6) 12 ( 21.8) 16 ( 61.5) 0.0008 (*)
mild dependence [ 91 , 99 ] 30 ( 37 ) 22 ( 40 ) 8 ( 30.8)
independent 100 23 ( 28.4) 21 ( 38.2) 2 ( 7.7)
VariableCategoryn(%)NO Cognit. Impairment(%)Cognit. Impairment(%)p-Value a
Tinetti test(/28)absence risk of fall > 24 27 ( 33.4) 25 ( 45.4) 2 ( 7.7) 0.003 (*)
moderate risk [ 19 , 24 ] 36 ( 44.4) 20 ( 36.4) 16 ( 61.5)
severe risk < 19 18 ( 22.2) 10 ( 18.2) 8 ( 30.8)
Stride interval mean < 1000 13 ( 16 ) 11 ( 20 ) 2 ( 7.7) 0.116
[ 1000 , 1200 ) 24 ( 29.6) 19 ( 34.6) 5 ( 19.2)
[ 1200 , 1400 ) 23 ( 28.4) 14 ( 25.4) 9 ( 34.6)
(msec) 1400 21 ( 26 ) 11 ( 20 ) 10 ( 38.5)
Stride interval CV(%) d < 2 4 ( 5 ) 4 ( 7.3) 0 ( 0 ) 0.0006 (*)
[ 2 , 4 ) 30 ( 37 ) 27 ( 49 ) 3 ( 11.5)
[ 4 , 6 ] 37 ( 45.7) 21 ( 38.2) 16 ( 61.5)
> 6 10 ( 12.3) 3 ( 5.5) 7 ( 27 )
Table 3. Multiple logistic regression analysis for the presence of cognitive decline (MMSE < 13) in a frail elderly population.
VariableCategoryp-valueOR a95% CI b
Age (in years) [ 75 , 80 ) (ref)-1
[ 80 , 85 ) 0.539 0.36 0.01 9.19
[ 85 , 90 ] 0.903 1.11 0.20 6.26
90 0 . 041 6 . 23 ( ) 1 . 07 36 . 34
Barthel scale(/100)independent(ref)-1
mild dependence 0.143 3.87 0.63 23.82
moderate dependence 0 . 049 6 . 00 ( ) 1 . 00 35 . 88
Tinetti test(/28)absence risk of fall(ref)-1
moderate risk 0.097 4.04( · ) 0.77 21.16
severe risk 0.684 1.47 0.22 9.74
Stride interval CV(%) > 6 (ref)-1
[ 4 , 6 ] 0.361 0.42 0.07 2.69
[ 2 , 4 ) 0 . 050 0 . 12 ( ) 0 . 02 1 . 03
< 2 0.756 0.54 0.01 25.86
a Odds ratio for presence of cognitive impairment. b Confidence interval dor ossd ratio. * Significance level p-value = 0.05. · Significance level p-value = 0.1.
Publisher’s Note: MDPI stays neutral with regard to jurisdictional claims in published maps and institutional affiliations.

