Proceeding Paper

Smart Energy Management for Unlocking Demand Response in the Residential Sector †

School of Engineering, Cardiff University, Cardiff CF24 3AA, UK
*
Author to whom correspondence should be addressed.
Presented at Sustainable Places 2018 (SP 2018), Aix-les Bains, France, 27–29 June 2018.
Proceedings 2018, 2(15), 1136; https://doi.org/10.3390/proceedings2151136
Published: 24 August 2018
(This article belongs to the Proceedings of Sustainable Places 2018)

Abstract

:
This paper presents a smart energy management system for unlocking demand response in the UK residential sector. The approach comprises the estimation of one-hour energy demand and PV generation (supply) for scheduling the 24-h ahead demand profiles by shifting potential flexible loads. Real-time electrical demand is met by combining power supplies from PV, grid and batteries while minimizing consumer’s cost of energy. The results show that the peak-to-average ratio is reduced by 22.9% with the cost saving of 34.6% for the selected day.

1. Introduction

With the increasing penetration of variable renewable energy resources (VRES), such as solar and wind, energy management strategies need to become more sophisticated for multi-vector energy systems [1,2]. Integrating the intermittent and heterogeneous VRES while maximizing the utilization of the ageing utility infrastructure is critical for the optimal planning and operation of the energy sector [3]. Buildings account for 40% of overall energy consumption in Europe [4]. Reducing energy consumption and cost without compromising occupant comfort is an important concern in both smart buildings and grids. One of the effective solutions is to use an optimal energy management system in buildings to balance supply and demand under a demand response (DR) scheme that compensates users for their flexibility in terms of the energy used from the grid and time of use.
This study presents a smart energy management system primarily designed for the UK domestic sector. Three levels of optimization are adopted. First, day-ahead load shifting is scheduled in response to the varying utility price. Second, supply and loads during the next hour are balanced. And finally, real-time energy supply is met from the combined power flow while minimizing cost.

2. Domestic Energy Consumption and Supplies

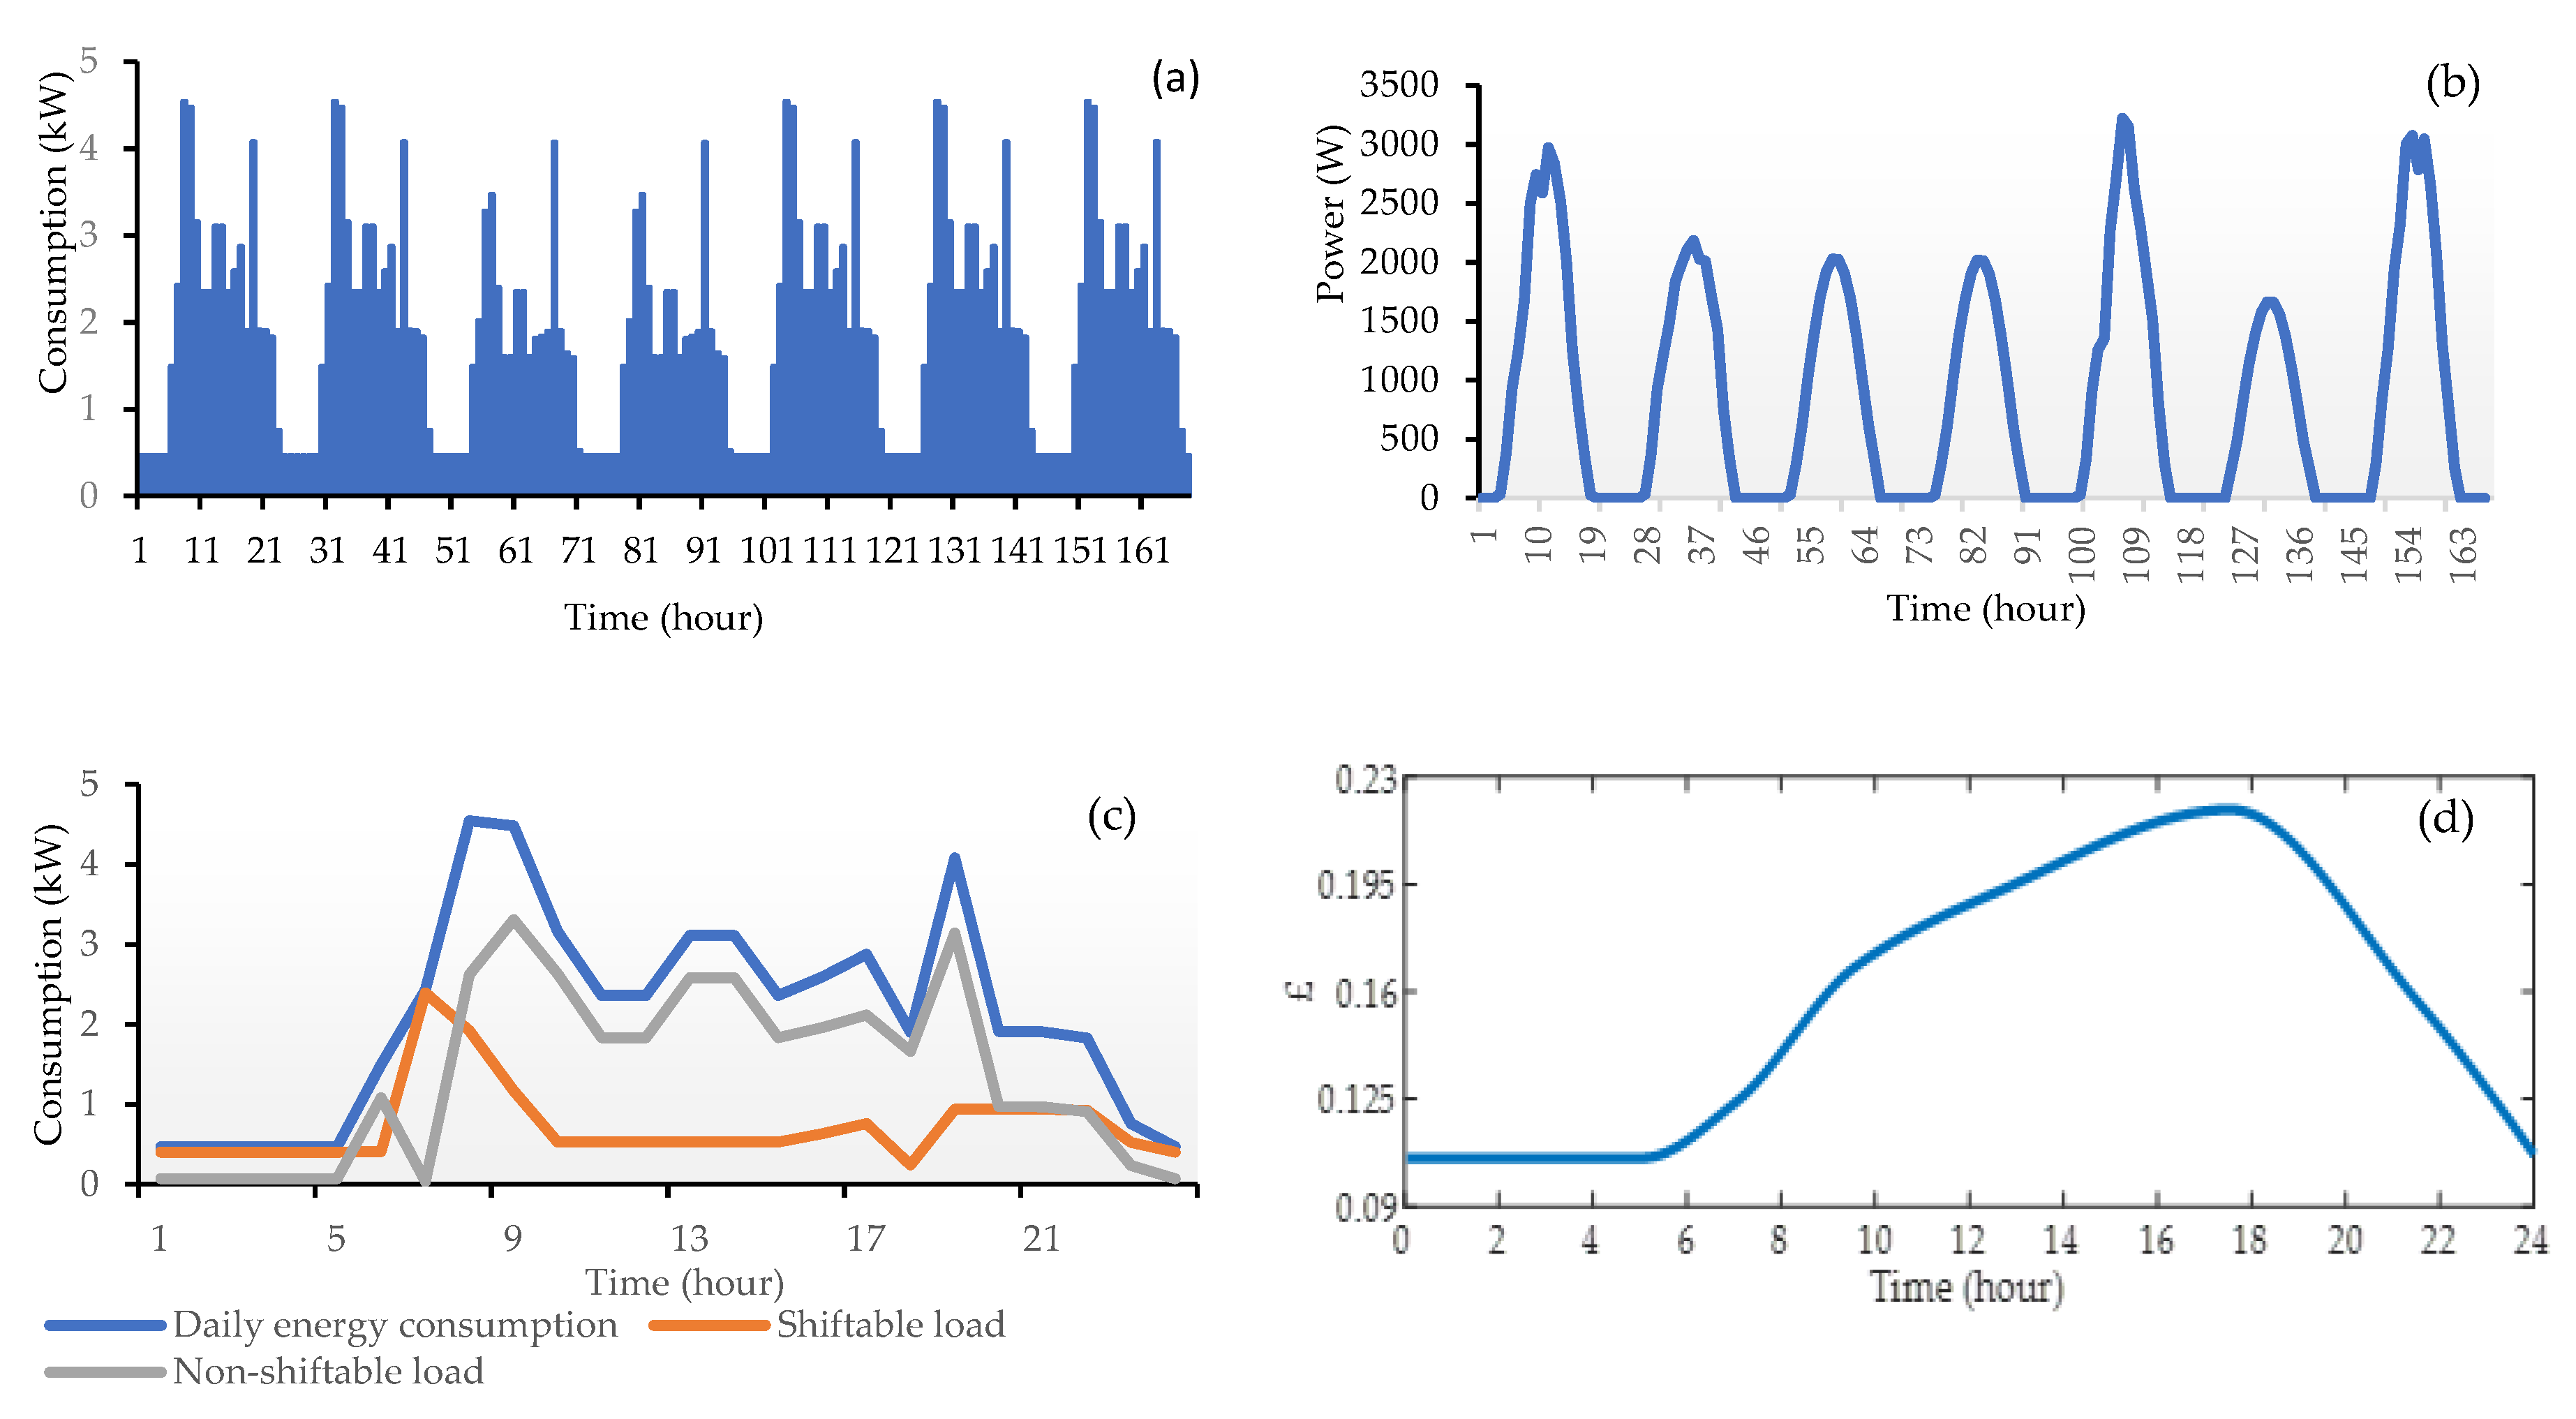
2.1. Typical Energy Profiles in Domestic Buildings

Figure 1a–d show a series of profiles of domestic energy consumption and generation. A diurnal pattern is evident in Figure 1a, while the weekly waveform illustrates repeated energy consumption after each 24-h period. Figure 1b illustrates the weekly PV power profiles. Power output from the PV system starts to increase at approximately 5 a.m. and reaches its maximum at mid-day and then reduces gradually down to zero at around 8 p.m. Figure 1c include three curves, including overall daily energy consumption, and shiftable non-shiftable loads. In terms of the overall consumption, there are two peaks in the curve, maximizing at 4.21 kW at 8 a.m. and 7 p.m. Energy demand fluctuates within the day. Low consumption is observed at night between 12 a.m. and 5 a.m Figure 1d illustrates a daily price profile of the grid electricity where the cost is relatively high between 5 p.m. and 9 p.m.

2.2. Shiftable Loads and Non-Shiftable Loads
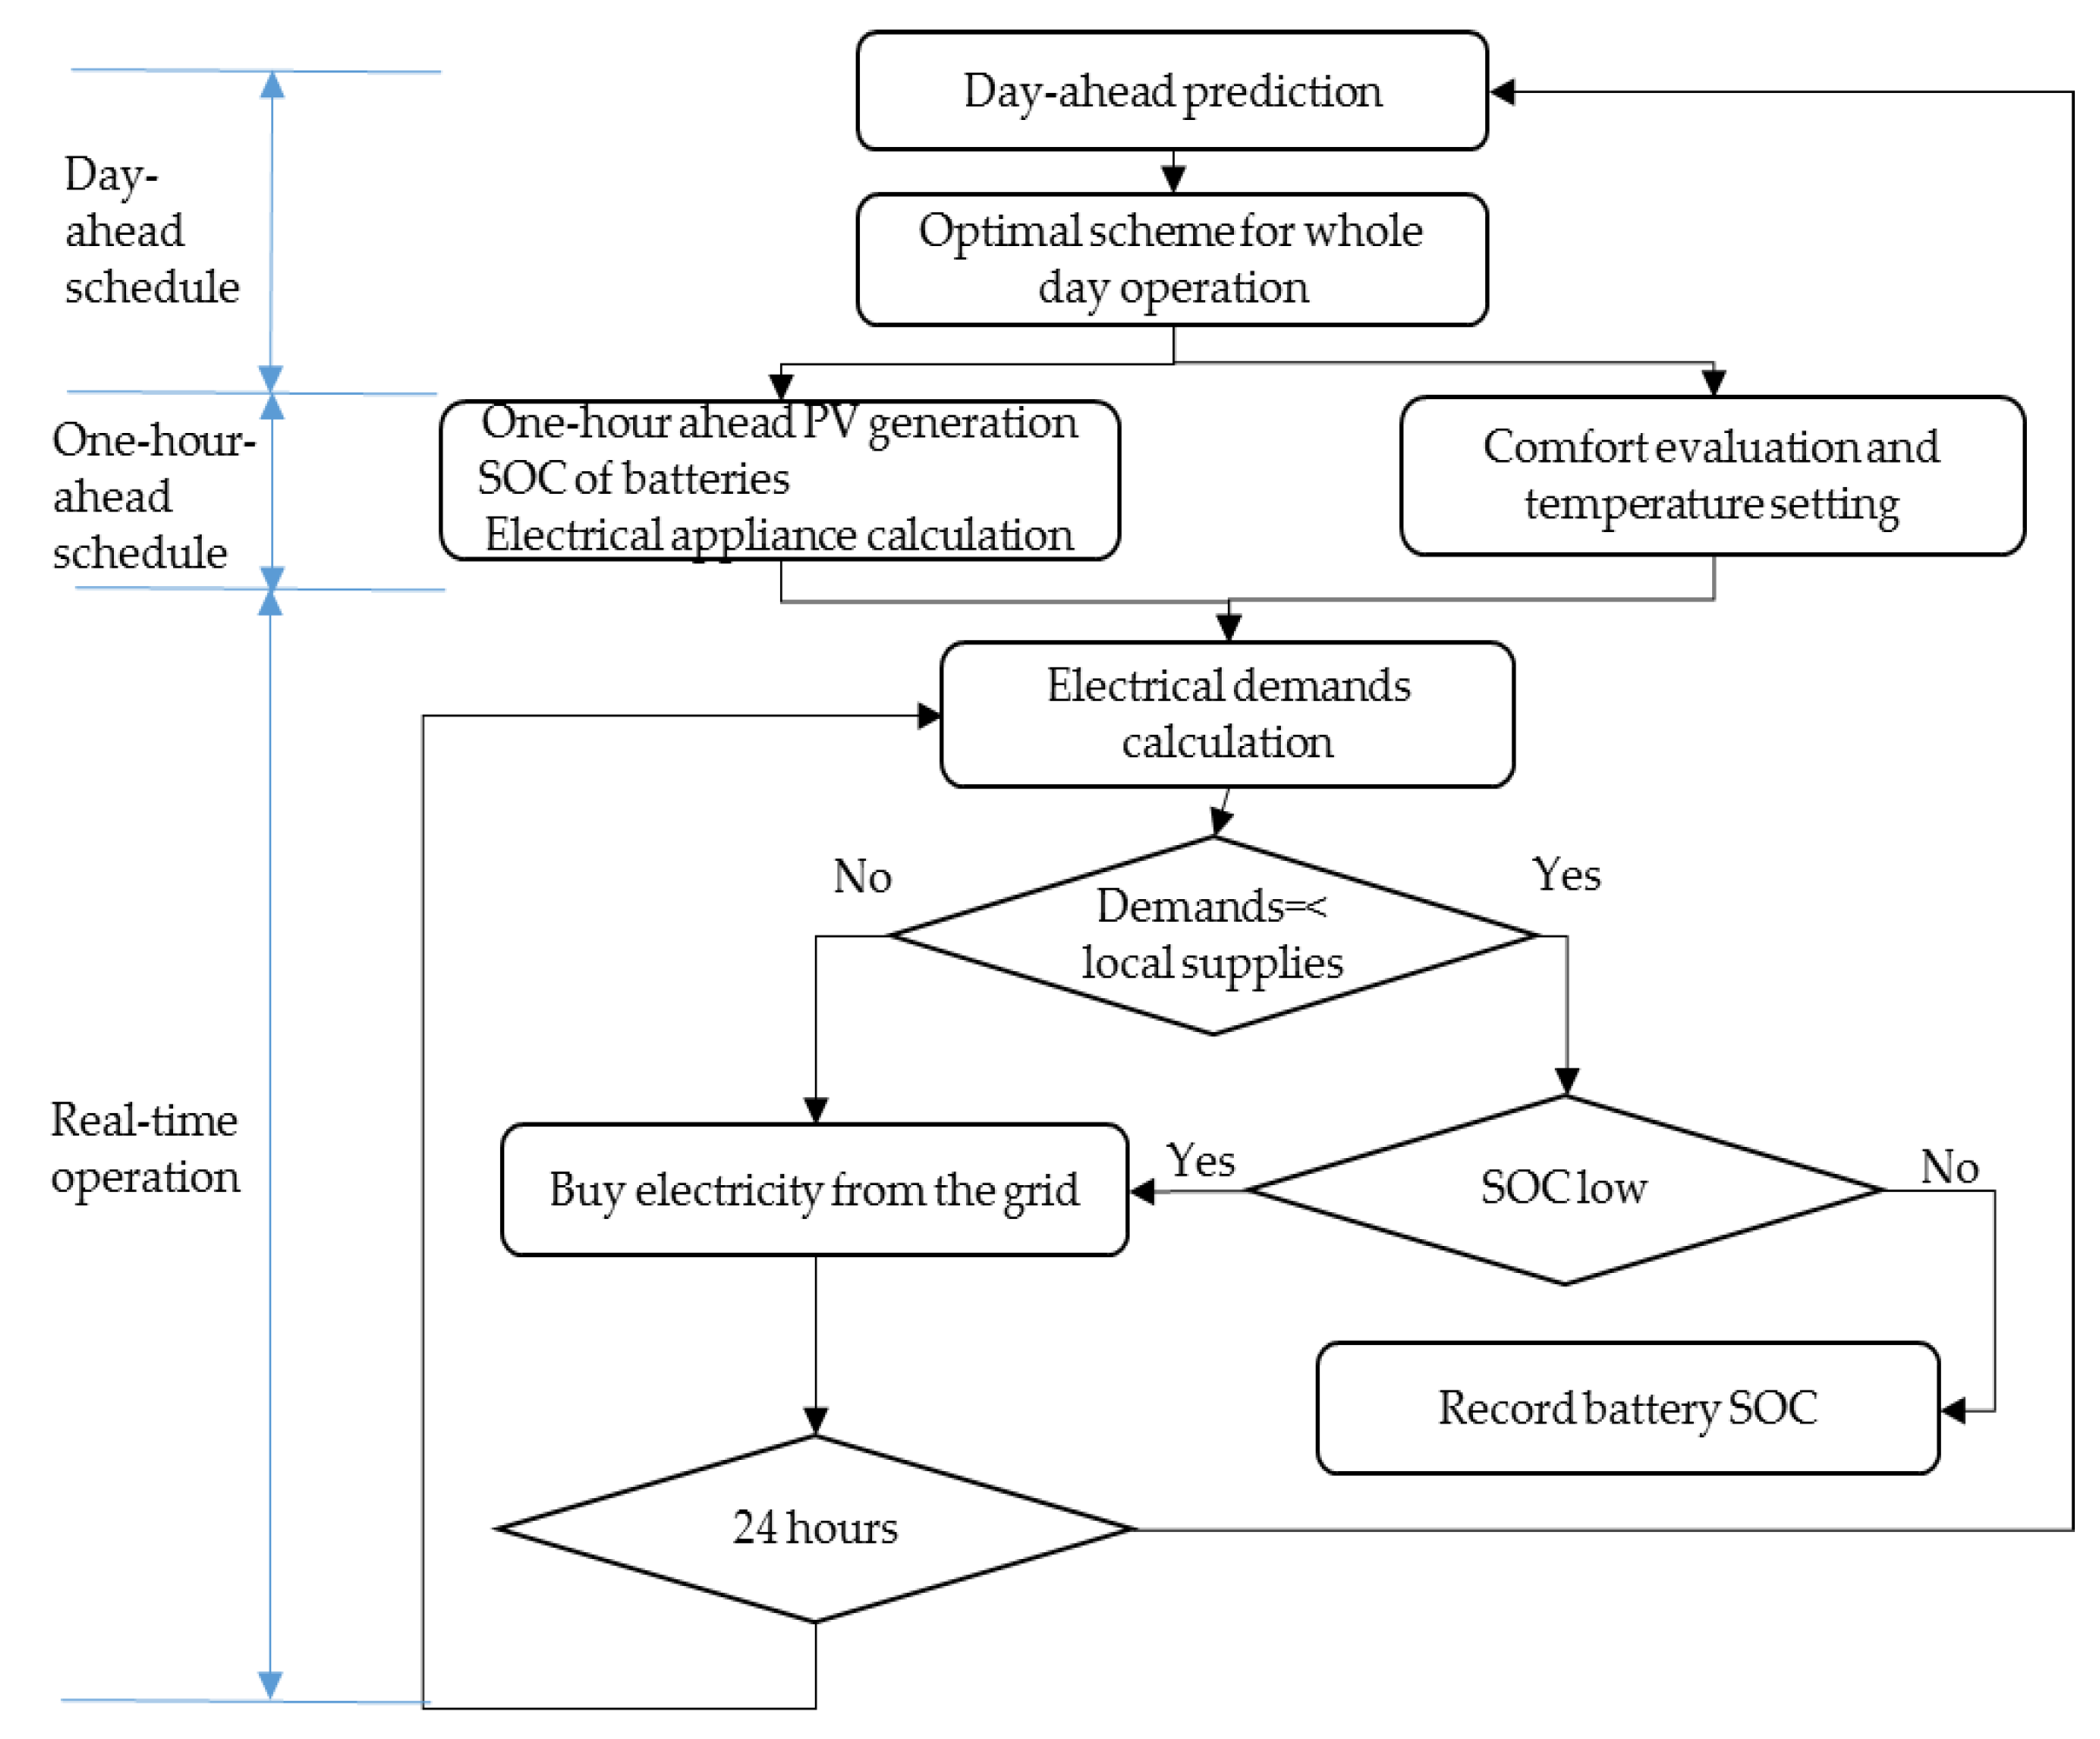
Key appliances in a residential building include lights, kitchen equipment (oven, hob, kettle), air conditioner, dish washer, washing machine, and electrical vehicle. They can be divided into two groups, namely, non-shiftable and shiftable appliances. Non-shiftable loads are used in a specific period with non-changed power level. These appliances include essential equipment, such as kettle, cooker, fridge and air conditioner etc. In terms of the appliances, such as washing machine and electrical vehicle, they can be moved to another time to use. For instance, we can switch on shiftable appliance (washing machine) at off-peak hour to reduce the energy costs.

3. Methodology

Figure 2 shows the flow chart of the methodology. First, we predict the overall energy consumption according to the information of weather forecasting. The initial state of the energy storage and daily electricity price are estimated. As stated in Section 2.2, the main domestic loads are divided into shiftable and non-shiftable load groups where shiftable load could be rescheduled to define day-ahead appliances’ operation. One-hour ahead comfort setting are clarified to configure the energy consumption profile. Dynamic programming framework is used to optimize the real-time operation where PV, battery and grid electricity are combined to an optimal supplying power flow to balance the electrical demand under the objective proposed.

3.1. Top-Level Optimisation

By re-scheduling shiftable appliances, the energy cost can be reduced to some extent which however, could deteriorate users’ comfort. Furthermore, the high electrical demand takes place between 5 p.m. and 9 p.m. while grid electricity price gradually increases to its peaks. There is a need to adopt better adjustable method to satisfy both comfort and economic requirement for domestic users. Energy storage system, such as batteries are a good option for domestic electricity demand shifting/shedding/peak reduction. They can be regarded as either time shiftable/power shiftable loads or power supply resource. In this study, batteries are used to balance demand and supply which therefore minimizes both discomfort and the cost.

3.2. Real-Time Operation
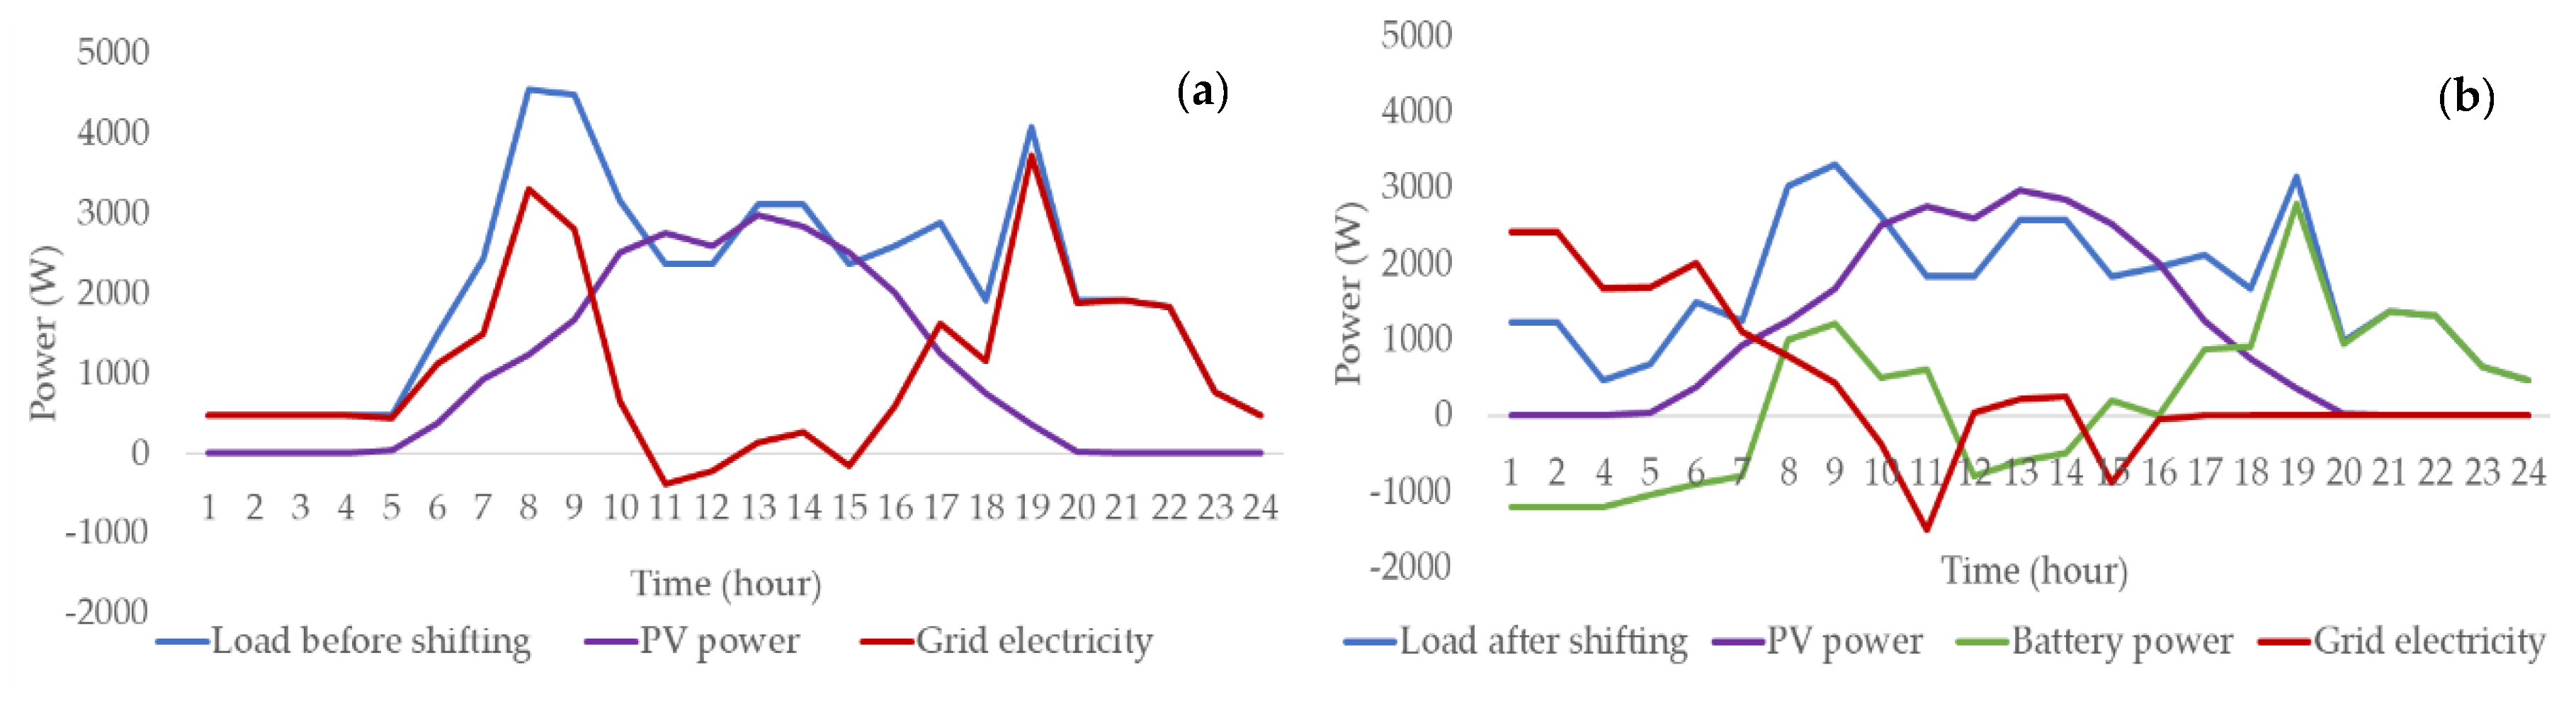
J = m i n ( C 1 · ( w g r i d ( t ) ) · h 1 ( t ) + ( α ·   ( w b a t t e r i e s ( t ) ) · h 2 ( t ) + ( β ·   ( w P V ( t ) ) ) · h 3 ( t )
s. t.
0 < w p v < w m a x  
S O C m a x < S O C < S O C m i n
C g r i d m i n < C 1 < C g r i d m a x  
w l o a d ( t ) = w g r i d ( t ) + w p v ( t ) + w b a t t e r y ( t )  
Equations (1)–(5) deliver the objective of the real-time operation and the constraints over the optimization. Equation (1) contains three factors, namely the cost of buying electricity from the power grid, the cost by using battery (SOC related) and the cost by using PV power. Equations (2)–(4) provide the limits for solar power, batteries charging/discharging power and grid power cost. Equation (5) presents the power balance over the operation.

4. Case Study

The optimal strategy is tested via the energy system in a detached 3-bedroom house. The house is located in London with 101.25 m2 space. Simulation is executed over one summer day. Daily energy consumption and supplies are evaluated. Figure 3 shows the results. Over the peak hours between 5 p.m. and 9 p.m., grid electricity usage is reduced while more grid power is consumed over the night from midnight to 7 a.m. as shown in Figure 3b. Table 1 summarizes the main indicator comparison between the schemes without and with optimization. With demand response scheme, the peak demand decreases from 4.54 kW to 3.5 kW and the energy cost decreases from £2.98 to £1.95.

5. Conclusions

This study developed an optimal operation scheme for an energy system in a domestic house. The investigation indicates that, with assistance from energy storage to realize peak shafting, the peak demand reduces from 4.54 kW to 2.84 kW. The peak-to-average ratio decrease by 22.9% with 34.6% cost saving. Some sensitive factors, such as weather variations, long-term energy price, may affect the study results, which can be considered in the future research.

Author Contributions

X.C. and M.M. conceptualized the research; X.C. devised the methodology; X.C. and K.W. developed software; X.C. and M.M. analyzed the results; and all authors contributed to the manuscript.

Funding

This work has received funding via the project, TowArds Building rEady for Demand rEsponse (TABEDE), Grant Agreement No. 766733, under European Union’s Horizon H2020 Framework Programme.

Conflicts of Interest

The authors declare no conflict of interest.

References

  1. Horbach, J.; Rammer, C. Energy transition in Germany and regional spill-overs: The diffusion of renewable energy in firms. Energy Policy 2018, 121, 404–414. [Google Scholar] [CrossRef]
  2. Weir, T. Renewable energy in the Pacific Islands: Its role and status. Renew. Sustain. Energy Rev. 2018, 94, 762–771. [Google Scholar] [CrossRef]
  3. Mourshed, M.; Robert, C.; Ranalli, A.; Messervey, T.; Reforgiato, D.; Contreaue, R.; Becue, A.; Quinn, K.; Rezgui, Y.; Lennard, Z. Smart grid futures: Perspectives on the integration of energy and ICT services. Energy Procedia 2015, 75, 1132–1137. [Google Scholar] [CrossRef]
  4. Arteconi, A.; Hewitt, N.J.; Polonara, F. Domestic demand-side management (DSM): Role of heat pumps and thermal energy storage (TES) systems. Appl. Therm. Eng. 2013, 51, 155–165. [Google Scholar] [CrossRef]
Figure 1. (a) Weekly electricity consumption. (b) Weekly PV generation. (c) Daily load profiles. (d) Daily electricity price.
Proceedings 02 01136 g001
Figure 2. Flow chart of DR-enabled energy management strategy.
Proceedings 02 01136 g002
Figure 3. Daily demand and supplies (a) without optimization, and (b) with optimization.
Proceedings 02 01136 g003
Table 1. Comparison between the main indicators.
ParameterWithout OptimizationWith Optimization
Demand (kWh)50.0940.08
Electricity bought (kWh)25.2811.88
Electricity sold (kWh)0.772.82
PV energy (kWh)24.8124.81
Peak demand (kW)4.543.50
Electricity cost (£)2.981.95
Publisher’s Note: MDPI stays neutral with regard to jurisdictional claims in published maps and institutional affiliations.

