Abstract
The readout methods for inductively coupled resonance sensors were simulated using a lumped element model. The purpose of the study was to analyze the readout methods at high frequencies where the self-resonance of the reader coil is likely to interfere with the measurements. Furthermore, the changes in the reading distance cause measurement errors. This phenomenon was studied using simulation. In addition, an algorithm that compensates these errors was tested. The simulation results were in agreement with the test measurements. In addition, the tested error compensation improved the resonance frequency estimates calculated using the simulated and measured data.
1. Introduction
Inductively coupled resonating structures can be used as wireless sensors. A typical sensor is made of a coil and a capacitor and it is often tuned to resonate at HF frequencies. These sensors can be utilized in many applications [1]. One popular application is a pressure sensor, which is based on a pressure dependent capacitive element. Furthermore, the sensing function can also be implemented by using coils whose inductance is modulated by the measured quantity. These two components alter the resonance frequency of the sensor. The methods for determining the resonance frequencies of these sensors vary [1]. One key benefit of this measurement method is the simplicity of the sensor structures. This enables the use of unconventional processing methods and materials in fabrication.
The coil is typically the largest component in the sensor. In addition, avoiding vias and multilayer conductive patterns in the sensor design will make the fabrication process even more straightforward. Thus, single-turn or single-layer coils combined with finger electrode capacitors can be used in the sensing applications. Another option is to utilize the self-resonance of the coils without a separate capacitor [2]. However, the resonance frequencies of these structures are often at the VHF and UHF frequencies near to the self-resonance frequency of the reader coil. This is not an optimal situation for many tested readout methods and the variation in the inductive coupling may cause a shift in the resonance frequency estimates. This problem can be minimized by optimizing the readout configuration (sensor coil, reader coil and parallel capacitances) or by using compensation algorithms [3,4].
In this study, impedance measurements were simulated based on a lumped element model [5]. The overall behavior of the model was tested by measurements. In addition, the compensation algorithm that mitigates the errors in the resonance estimates [4,6,7] was applied to the impedance data.
2. Methods
The performance of two methods for estimating the resonance frequency of inductively coupled LC circuits was studied at high frequencies. The first method estimates the frequency of the peak (fmax) in the real part of the impedance spectrum and the second identifies the frequency of a dip (fp) in the impedance phase data, see Figure 1c. The latter is also called the phase-dip method. Simulation was used to create test data that imitates the situation where the inductive coupling is altered as the reading distance varies. In simulation, various configurations can be easily tested and all components in the system are known and can be accurately manipulated. Thus, the resonance frequency of the circuit (f0) can be calculated using the basic equation for the LC resonator [8].
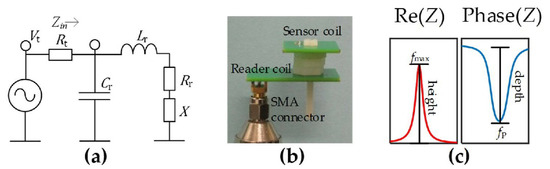
Figure 1.
(a) The lumped element model used in the simulations (b) The resonance coil was co-axially placed away from the reader coil and the distance was set by using plastic washers. (c) The resonance frequency estimates (fmax or fp) and the corresponding height or depth were estimated from the impedance data.
An electrical configuration that represents the readout of an inductively coupled resonance sensor was realized using lumped element components (Figure 1a) and simulated in a Matlab® environment as described in [5]. The inductively coupled circuit was included in the model as a component (X) in series with the reader coil [8]. The simulation results were expressed as the spectrum of the real part of impedance or the phase of the impedance. The resonance frequency estimates and the corresponding magnitudes (height or depth) of the resonance curves (Figure 1c) were extracted from the data and used in a compensation algorithm [7]. The baseline of the spectral curve of the reader coil was removed before the feature extraction process.
The parameters used in the simulations are shown in Table 1. The effect of the self-resonance of the reader coil on the resonance frequency estimate was studied by simulation (Cases 1–4) where the resonance frequency of the circuit (f0) was incrementally set closer to the self-resonance frequency of the coil (fr). The overall suitability of the simulated model was tested by measurements using an impedance analyzer (Agilent 4396B) and a single-turn reader coil on PCB (diameter 12 mm, SMA connector). The tested resonance circuit had a coil with a similar geometry but not an attached connector. 3.3 pF, 1.5 pF and 1 pF capacitors were mounted in parallel with the sensor coil (Cases 5–7) to imitate the simulated cases. In the measurement setup, the coils were positioned co-axially using a plastic screw (Figure 1b). The reading distance was varied using plastic washers.

Table 1.
The parameter values used in the simulation.
3. Results
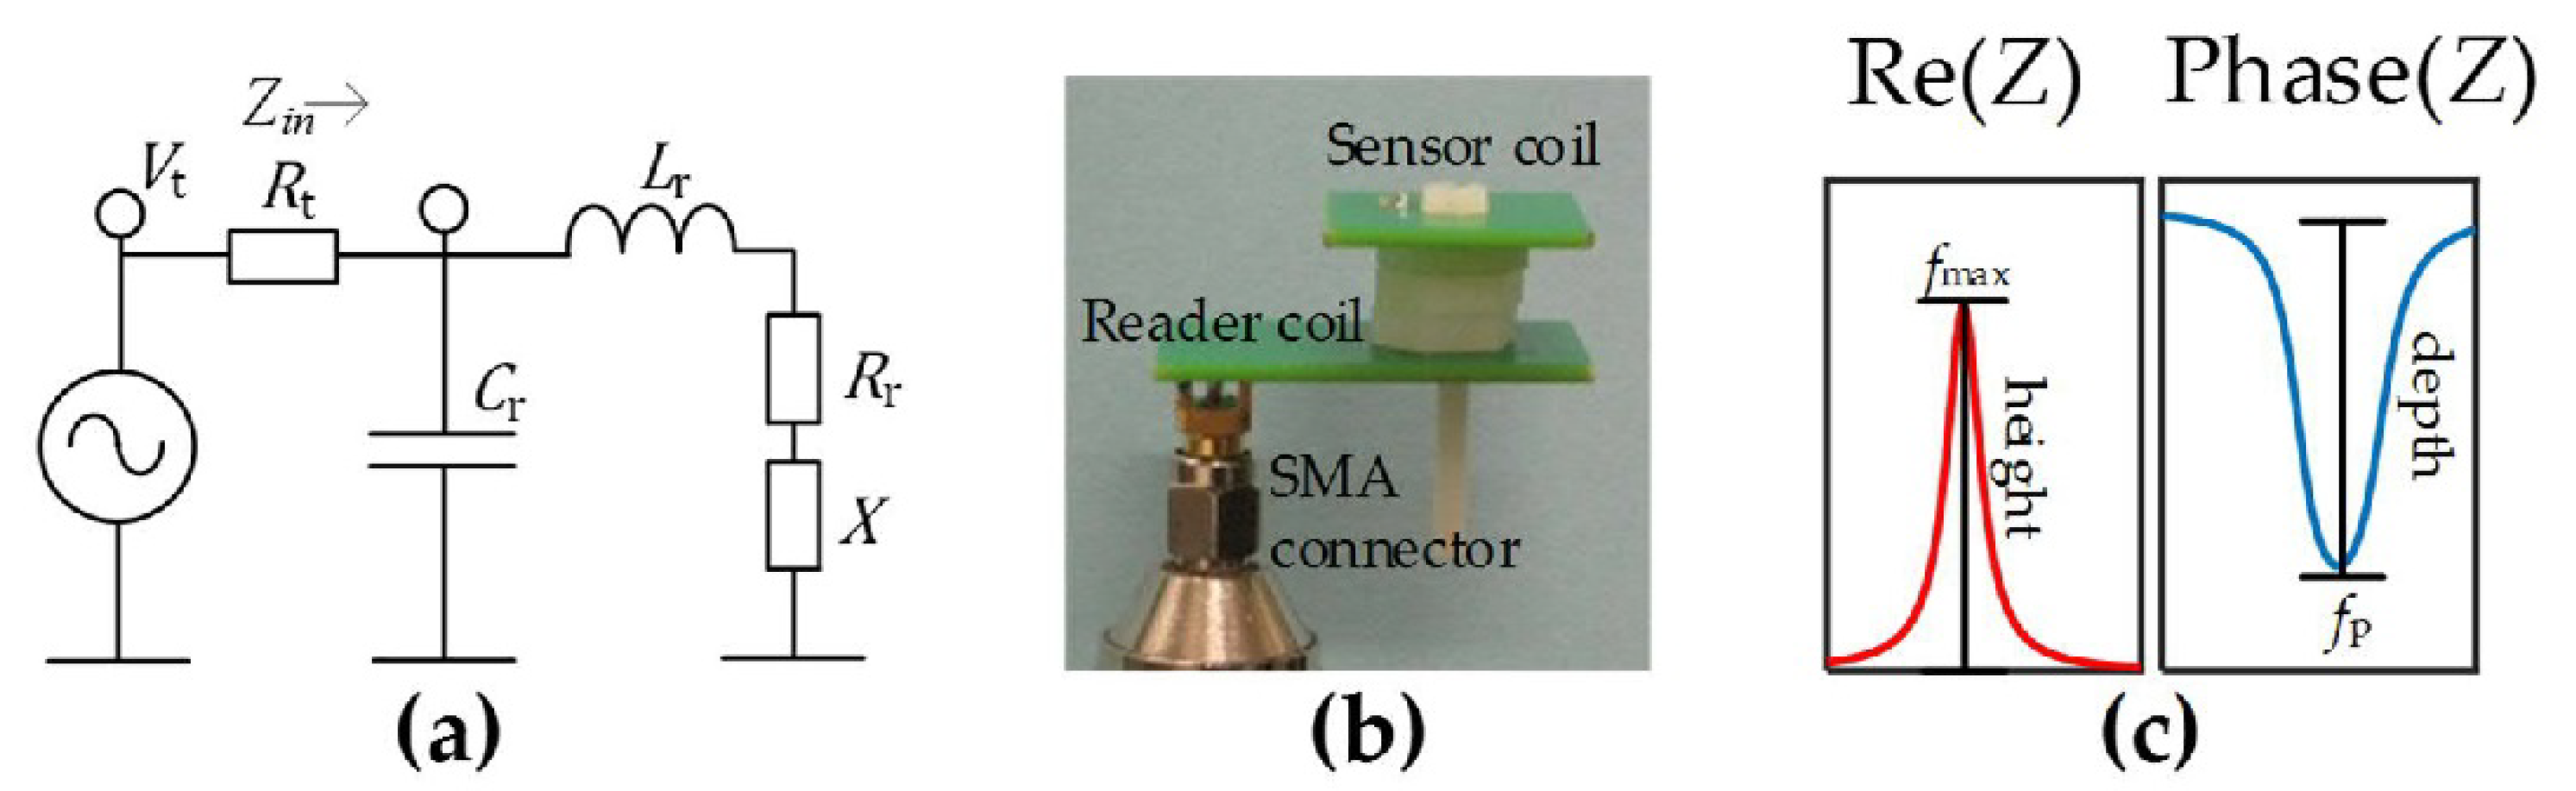
The simulated and measured resonance curves are shown in Figure 2. The responses were similar when the inductive coupling was varied. This can be seen mostly as the variation in the magnitude (height or depth) of the resonance curves except in Figure 2g where the height of the resonance peak is not clearly influenced by the inductive coupling. However, the simulated and measured curves are not identical because the parameters of the tested physical system can be estimated only with limited accuracy. The inductive coupling affects the position of the resonance curve in the frequency axis. Furthermore, the proximity of the resonance curve of the reader coil has an effect on the curves as well. The resonance of the reader coil can be seen as an additional resonance curve to the right of the resonance curve of the sensor in Cases 3, 4, 6, and 7. This has to be taken account when estimating the resonance frequency.

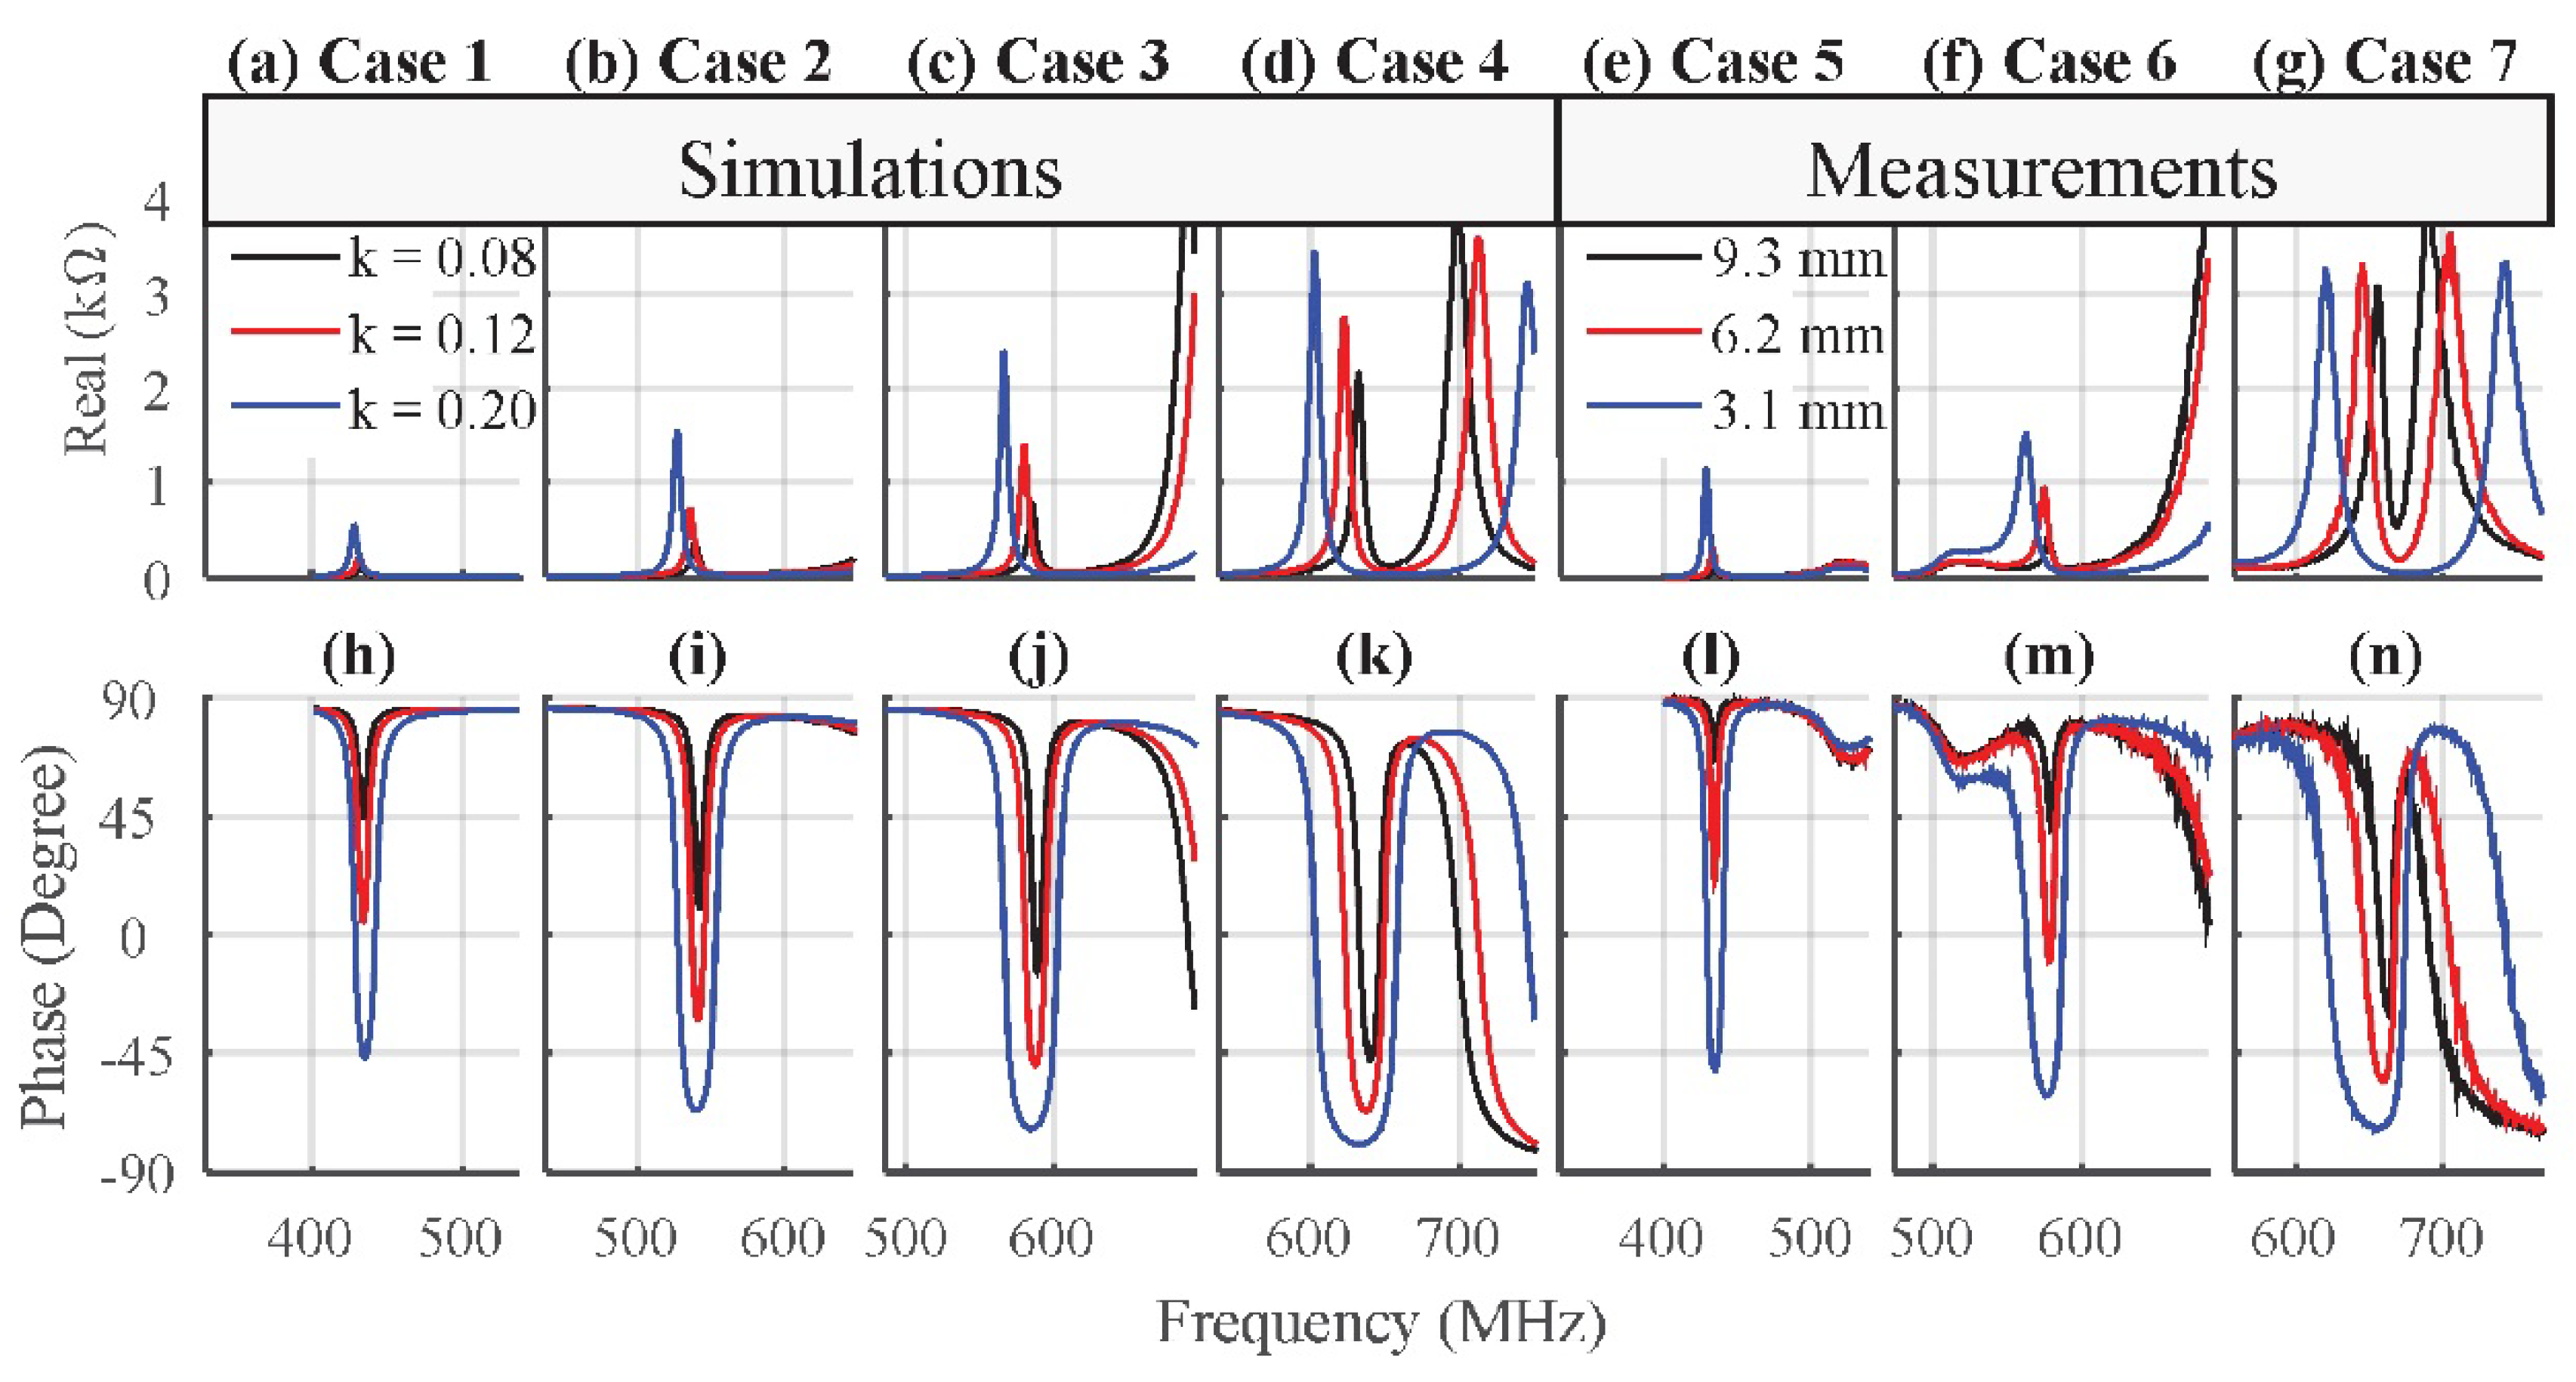
Figure 2.
The raw data of four simulated cases and three test measurements that was used to compare readout methods. (a–d) The simulated real part of the impedance when the coupling coefficient was varied (k = 0.08, 0.12, 0.20) in Cases 1 to 4. (e–g) The test measurements of the real part of the impedance when the reading distance was varied (9.3 mm, 6.2 mm, 3.1 mm) in Cases 5 to 7. (h–k) The corresponding simulated phase angle and the measured phase angle (l–n).
The differences between the frequency estimates extracted from the simulated impedance data and the calculated value f0 are shown in Figure 3a and by using the error compensation algorithm in Figure 3b. The corresponding differences between the resonance estimates from the measured curves and the value at the 12.4 mm measurement distance are illustrated in Figure 3c,d. When the compensation was not used, the behavior of the differences in the simulated and measured cases were similar. For both tested readout methods, the differences increased as the inductive coupling increased. In addition, the differences were larger when the sensor resonance was set near to fr. Among the tested cases, the best results with the uncompensated estimates were achieved using the phase-dip method in Cases 1 and 2. The compensation improved the estimates in Cases 1–3. The compensation also works for the measured resonance estimates but the method would benefit from more data. The best results were achieved in Case 1 using the feature fmax. The compensation did not improve the results much in Case 4 and was not even applied in Case 7 because there was no clear relation between fmax and the corresponding height.
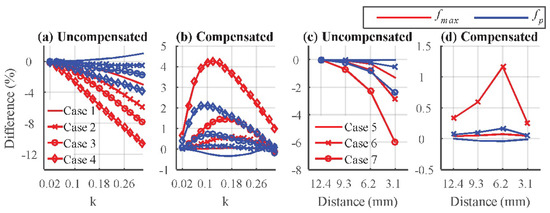
Figure 3.
(a) The difference in the simulated resonance frequency estimates compared with the resonance frequency calculated using the basic equation for the LC resonator; (b) The corresponding differences after the error compensation algorithm was applied; (c) The difference in the measured resonance estimates compared with the value measured at the 12.4 mm distance; (d) The corresponding compensated estimates from the measurements.
4. Discussion
The tested lumped element model was able to predict the overall behavior of the resonance curves in the tested frequency range. As the inductive coupling increases so does the difference between the resonance estimates and f0. This phenomenon is stronger in the near proximity of the self-resonance frequency fr of the reader coil. Thus, it is not advisable to set the resonance sensors to operate exactly at fr. The tested cases were more suitable for the phase-dip method when the compensation was not used and the results are in line with the results achieved in [5]. In general, the compensation was able to mitigate the effect of the varying inductive coupling. In some tested cases, the compensation suffered from the fact that the relation between the resonance estimates and corresponding height or depth was not truly linear. The situation was worse near to the resonance frequency of the coil.
Acknowledgments
This study was funded by Business Finland as a part of the Human Spare Parts research program.
References
- Huang, Q.-A.; Dong, L.; Wang, L.-F. LC Passive Wireless Sensors Toward a Wireless Sensing Platform: Status, Prospects, and Challenges. J. Microelectromech. Syst. 2016, 25, 822–841. [Google Scholar] [CrossRef]
- Yousaf, A.; Khan, F.A.; Reindl, L. Passive Wireless Sensing of Micro coil parameters in fluidic environments. Sens. Actuators A Phys. 2012, 186, 69–79. [Google Scholar] [CrossRef]
- Potyrailo, R.A.; Mouquin, H.; Morris, W.G. Position-independent chemical quantitation with passive 13.56- MHz radio frequency identification (RFID) sensors. Talanta 2008, 75, 624–628. [Google Scholar] [CrossRef] [PubMed]
- Salpavaara, T.; Verho, J.; Kumpulainen, P.; Lekkala, J. Readout methods for an inductively coupled resonance sensor used in pressure garment application. Sens. Actuators A Phys. 2011, 172, 109–116. [Google Scholar] [CrossRef]
- Salpavaara, T.; Lekkala, J. A model based analysis of the measurement errors in inductively coupled passive resonance sensors. In Proceedings of the XXI IMEKO World Congress, Pague, Czech Republic, 30 August–4 September 2015. [Google Scholar]
- Salpavaara, T.; Verho, J.; Kumpulainen, P. Performance of a Near-Field Radio-Frequency Pressure Sensing Method in Compression Garment Application. In Proceedings of the Wireless Mobile Communication and Healthcare: Second International ICST Conference, MobiHealth 2011, Cos Island, Greece, 5–7 October 2011. [Google Scholar]
- Salpavaara, T. Inductively Coupled Passive Resonance Sensors: Readout Methods and Applications. Ph.D. Thesis, Tampere University of Technology, Tampere, Finland, 1 March 2018. [Google Scholar]
- Terman, F.E.; Helliwell, R.A.; Pettit, J.M.; Watkins, D.A.; Rambo, W.R. Electronic and Radio Engineering, 4th ed.; McGraw Hill: New York, NY, USA, 1955. [Google Scholar]

Publisher’s Note: MDPI stays neutral with regard to jurisdictional claims in published maps and institutional affiliations. |
© 2018 by the authors. Licensee MDPI, Basel, Switzerland. This article is an open access article distributed under the terms and conditions of the Creative Commons Attribution (CC BY) license (https://creativecommons.org/licenses/by/4.0/).