Proceeding Paper

Impedimetric Characterization of Interdigitated Electrode Arrays for Biosensor Applications †

1
Research Centre for Microtechnology, Vorarlberg University of Applied Sciences, 6850 Dornbirn, Austria
2
Department of Microsystems Engineering (IMTEK), University of Freiburg, 79110 Freiburg, Germany
3
Freiburg Center for Interactive Materials and Bioinspired Technologies (FIT), University of Freiburg, 79110 Freiburg, Germany
*
Authors to whom correspondence should be addressed.
Presented at the Eurosensors 2018 Conference, Graz, Austria, 9–12 September 2018.
Proceedings 2018, 2(13), 899; https://doi.org/10.3390/proceedings2130899
Published: 30 November 2018
(This article belongs to the Proceedings of EUROSENSORS 2018)

Abstract

:
We present recent results of the electrochemical impedance spectroscopy (EIS) measurements for interdigitated electrode arrays (IDAs) ranging from several micrometers down to hundreds of nanometers. Simulations have shown that the electric field strength between the electrodes scales with the gap size. Therefore, electrodes of varying gap sizes were fabricated and functionalized with ssDNA to empirically validate these findings. The results have shown that the impedimetric response strongly correlates with the width of the electrode fingers: the smaller the electrode gap, the larger the impedance increase.

1. Introduction

Impedimetric biosensors range among the most promising techniques for biomedical point-of- care testing, due to their low complexity and label-free operation [1]. For impedance-based sensing a small sinusoidal voltage is applied and the resulting current is measured as a function of frequency. By altering the electrode surface, e.g., by biomolecule binding, a measurable interfacial impedance change is induced [2]. The most important factor determining the sensor sensitivity is the electric field generated between the electrodes [3], which depends on the sensor geometry. It has been shown that the electrode gap width has the most significant influence on the sensitivity of IDA biosensors and the electric field strength [3]. For gap sizes in the nanometer range (nanogaps), the applied electric field is confined much closer to the area where biomolecule binding takes place. Existing studies only investigated the influence of electrode spacing for a narrow range. In contrast, our study presents the impedimetric response for electrode gap widths ranging from micrometer to nanometer scale. Electrodes of varying gap sizes were fabricated and functionalized with ssDNA to empirically validate the findings. The results have shown that the impedimetric response strongly correlates with the width of the electrode fingers: the smaller the electrode gap, the larger the impedance increase.

2. Materials and Methods

2.1. Chemicals and Reagents

Phosphate buffered saline (PBS), anti-fluorescein antibody conjugated with horseradish peroxidase (Ab-HRP), 2,2′-azino-bis(3-ethylbenzothiazoline-6-sulphonic acid) (ABTS) and Casein blocking solution were obtained from Sigma-Aldrich (Darmstadt, Germany). Thiolated ssDNA with 6-fam label (sequence: 5′-tca gtt ttg cat gga ttt gca ca-3′) was provided by Biomers.net GmbH (Ulm, Germany). Other chemicals were of analytical quality and were used without further treatment.

2.2. Manufacturing and Functionalization of Gold IDAs

The nanogap IDA electrodes were fabricated by a lift-off free fabrication approach. An exact description of this process has already been published [4]. This process was used for gap sizes up to 2 μm. For larger gaps up to 50 μm, a conventional lift-off process was applied. A positive tone photoresist (MEGAPOSIT SPR955-CM, DOW Chemicals, Midland, MI, USA) with a thickness of 500 nm was structured by direct laser writing (DWL66+, Heidelberg Instruments, Heidelberg, Germany) and gold was evaporated by e-beam evaporation (Balzers BAK 550, Balzers, Liechtenstein). The lift-off was performed in acetone followed by an IPA and DI rinse. Immediately prior to use, the gold IDAs were exposed to oxygen plasma for 20 s to remove organic residues. For the DNA immobilization studies 20 μL of 1 μM thiolated ssDNA was incubated for 20 h at room temperature. Subsequently, the chips were rinsed with 10 mM PBS buffer.

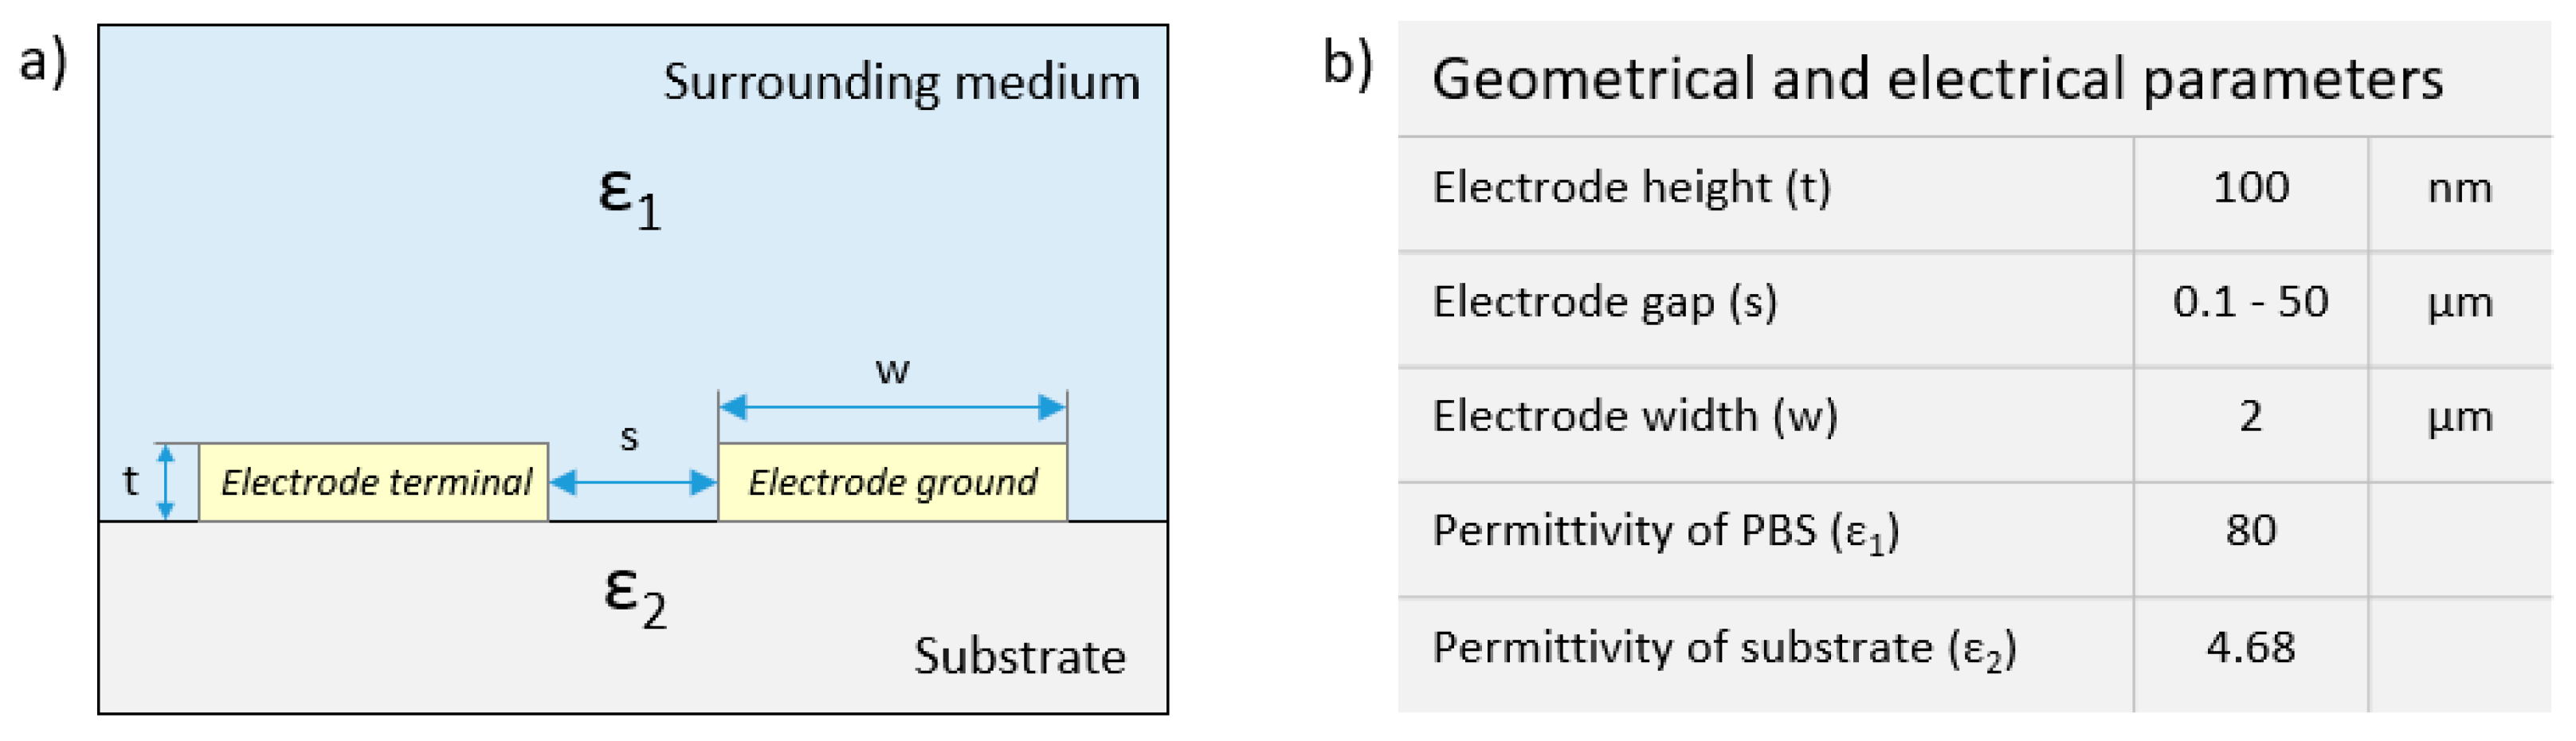
2.3. FEM Simulations of the Electric Field Strength

The numerical simulations were performed using COMSOL Multiphysics Version 5.3a (Stockholm, Sweden). To avoid long pre-processing, solving and post-processing periods, the IDA sensor geometry was simplified to a representative 2D model (see Figure 1a). In addition, the periodicity of the design allowed for a further reduction of the model to one pair of electrodes. However, to account for the remaining electrode fingers, periodic boundary conditions were applied. For the calculation of the electric field one electrode was set to terminal (V = 5 mV), one electrode to ground. The geometrical and electrical parameters used for the simulations are given in Figure 1b.

2.4. Electrochemical Impedance Spectroscopy of Gold IDAs

For the electrochemical impedance spectroscopy an Autolab PGSTAT12 (Metrohm, Vienna, Austria) with FRA2 module was used. The measurements were performed with 0 V DC bias and 5 mV AC in a frequency range from 10 Hz to 500 kHz in a two-electrode setup. 10 mM PBS buffer was used as measurement solution. The equivalent circuit fitting was done in NOVA 2.1.3 (Metrohm, Vienna).

2.5. On-Chip Enzyme Linked Immunosorption Assay (On-Chip ELISA)

To confirm the immobilization of ssDNA on the IDAs, an on-chip ELISA assay was performed. ssDNA immobilization was carried out as described in Section 2.2, followed by a blocking step with 1x Casein for 4 h. After rinsing with PBS and ultrapure water, the chips were incubated with 20 μL of Ab-HRP (1 μg/mL for 15 min). The chips were then rinsed again and incubated in a solution of 1.1 mg/mL ABTS and 1.25 mM hydrogen peroxide. The absorbance of the color reaction was analyzed after two hours reaction time at 415 nm wavelength using a photospectrometer (Hitachi U1800).

3. Results and Discussion

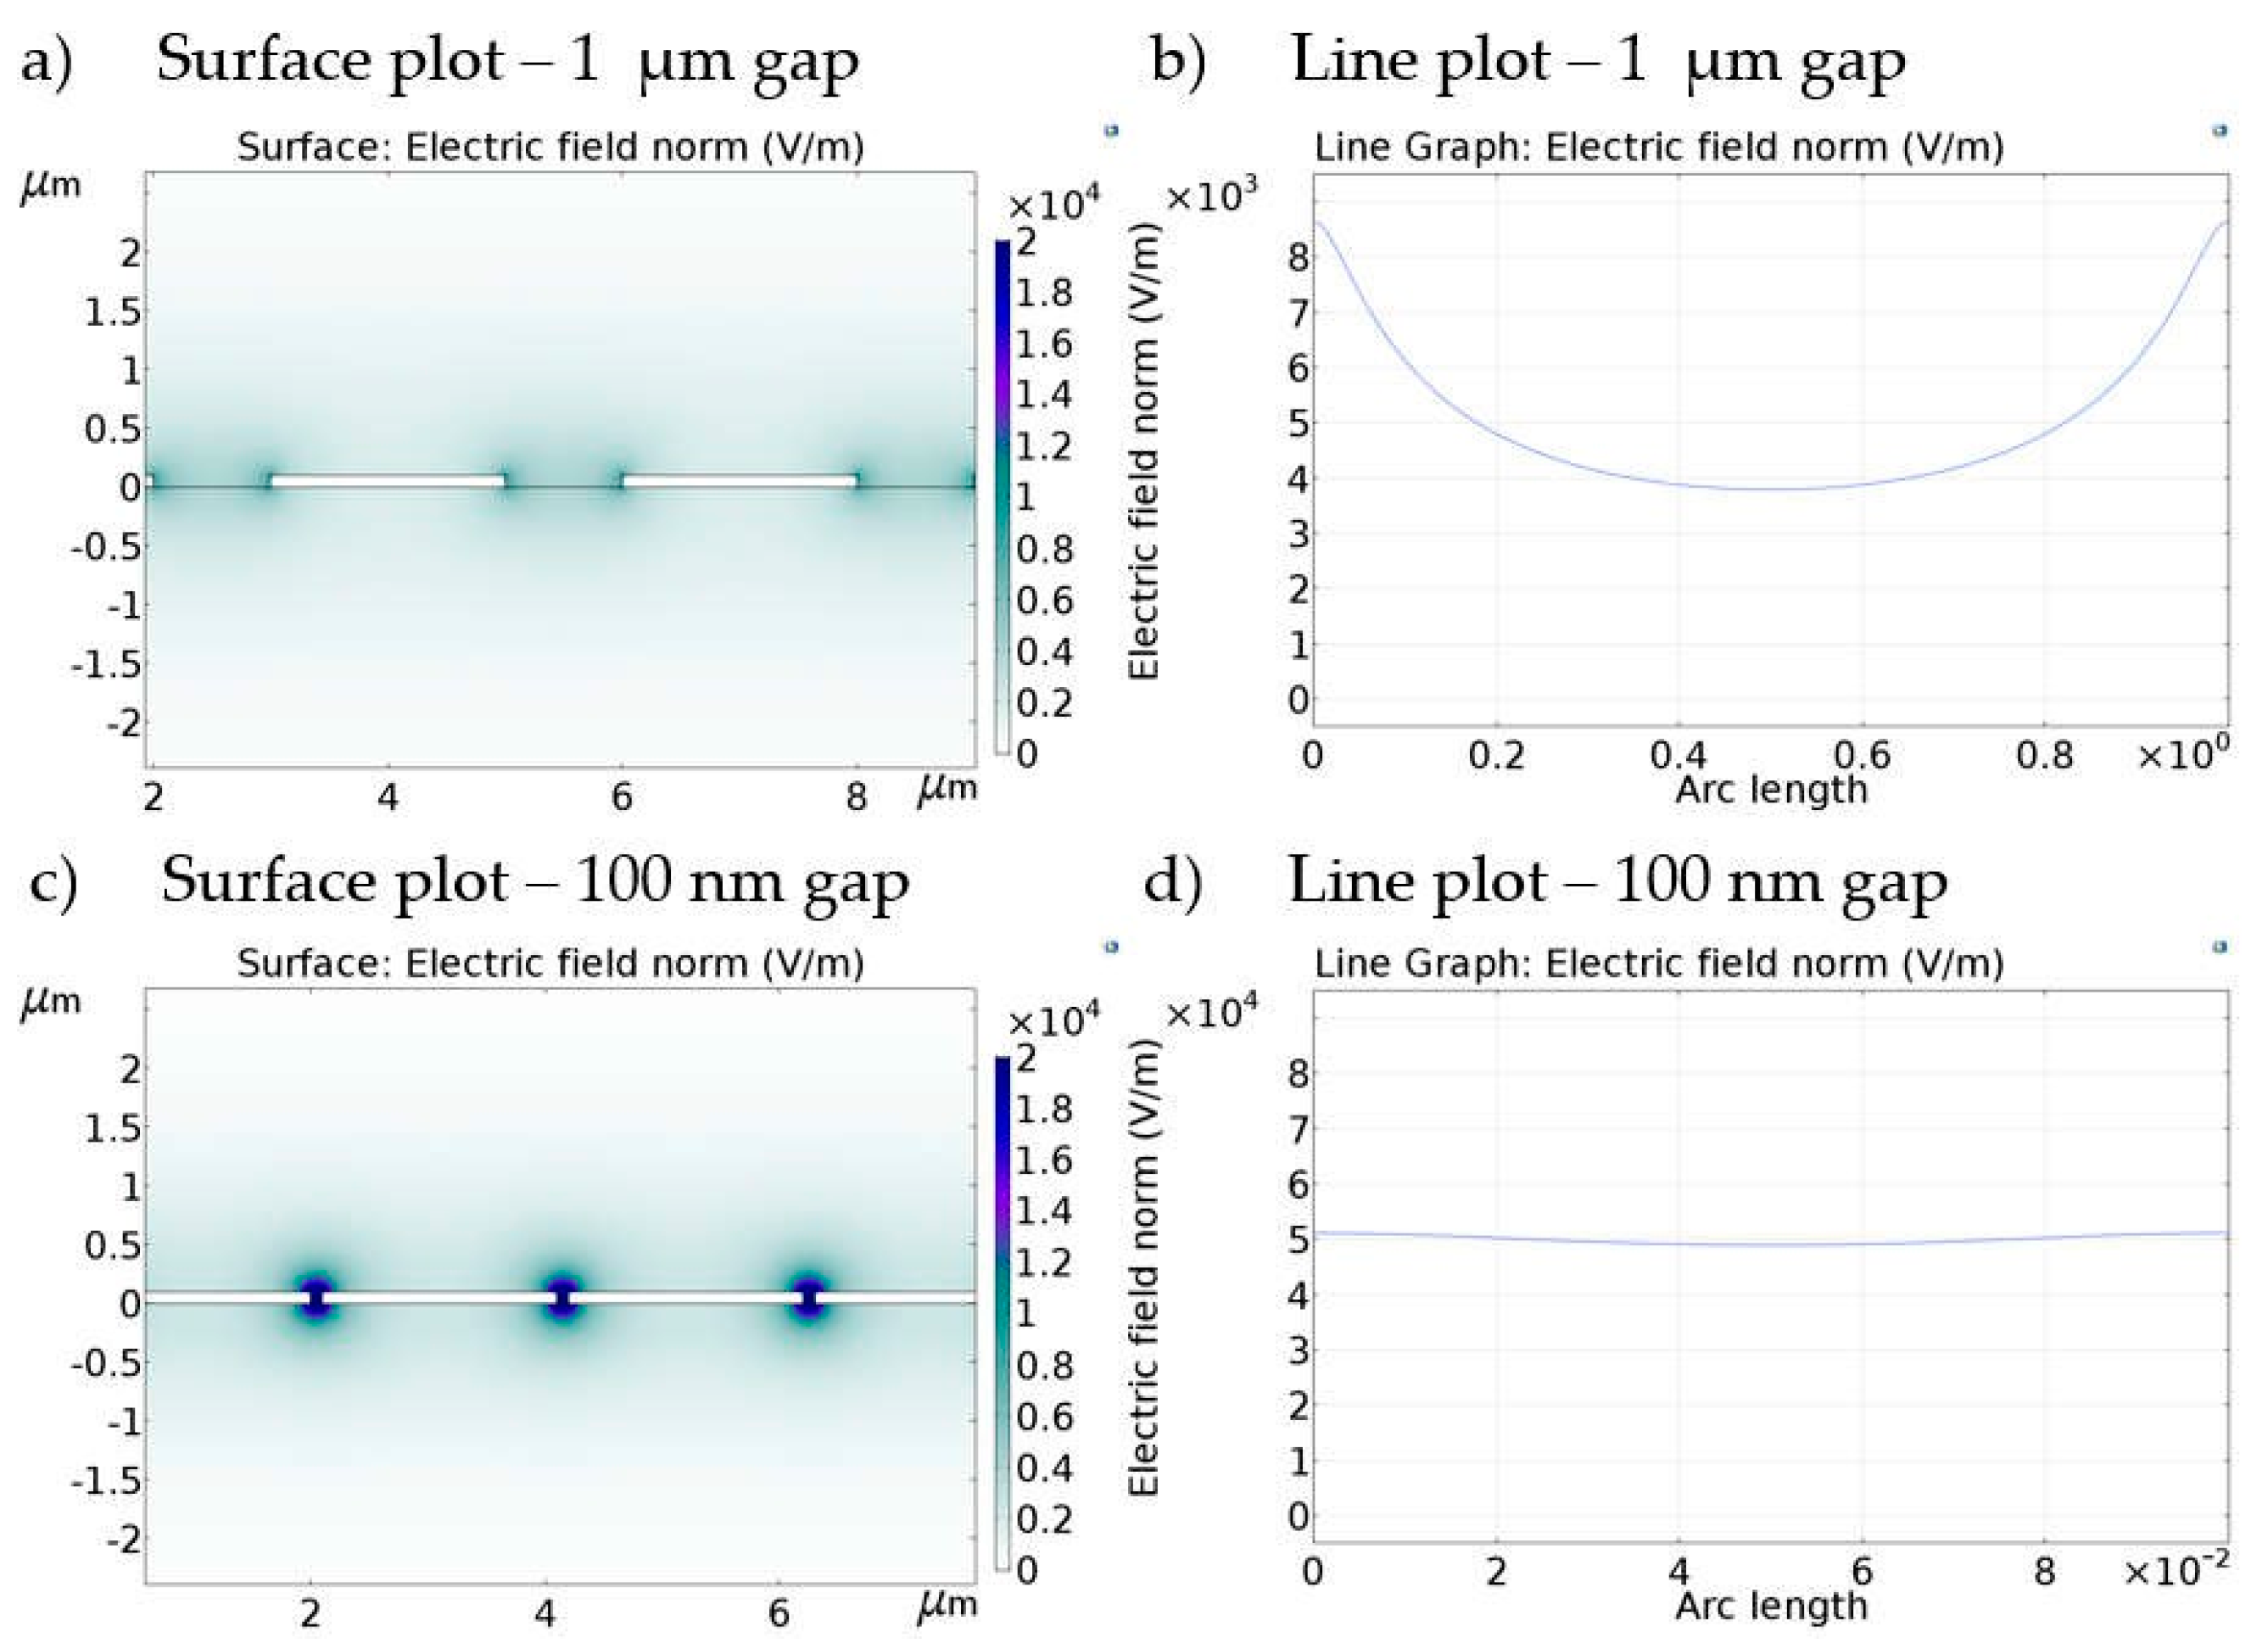
3.1. FEM Simulations

As Figure 2 demonstrates, the electric field magnitude between the electrodes increases with decreasing gap size. In addition, the field is more uniform for nanogap electrodes. At an electrode gap of 1 μm the electric field strength drops by approximately 50% in the middle of the gap, whereas in the 100 nm electrode gap this decrease amounts to only 5% (see Figure 2b,d).

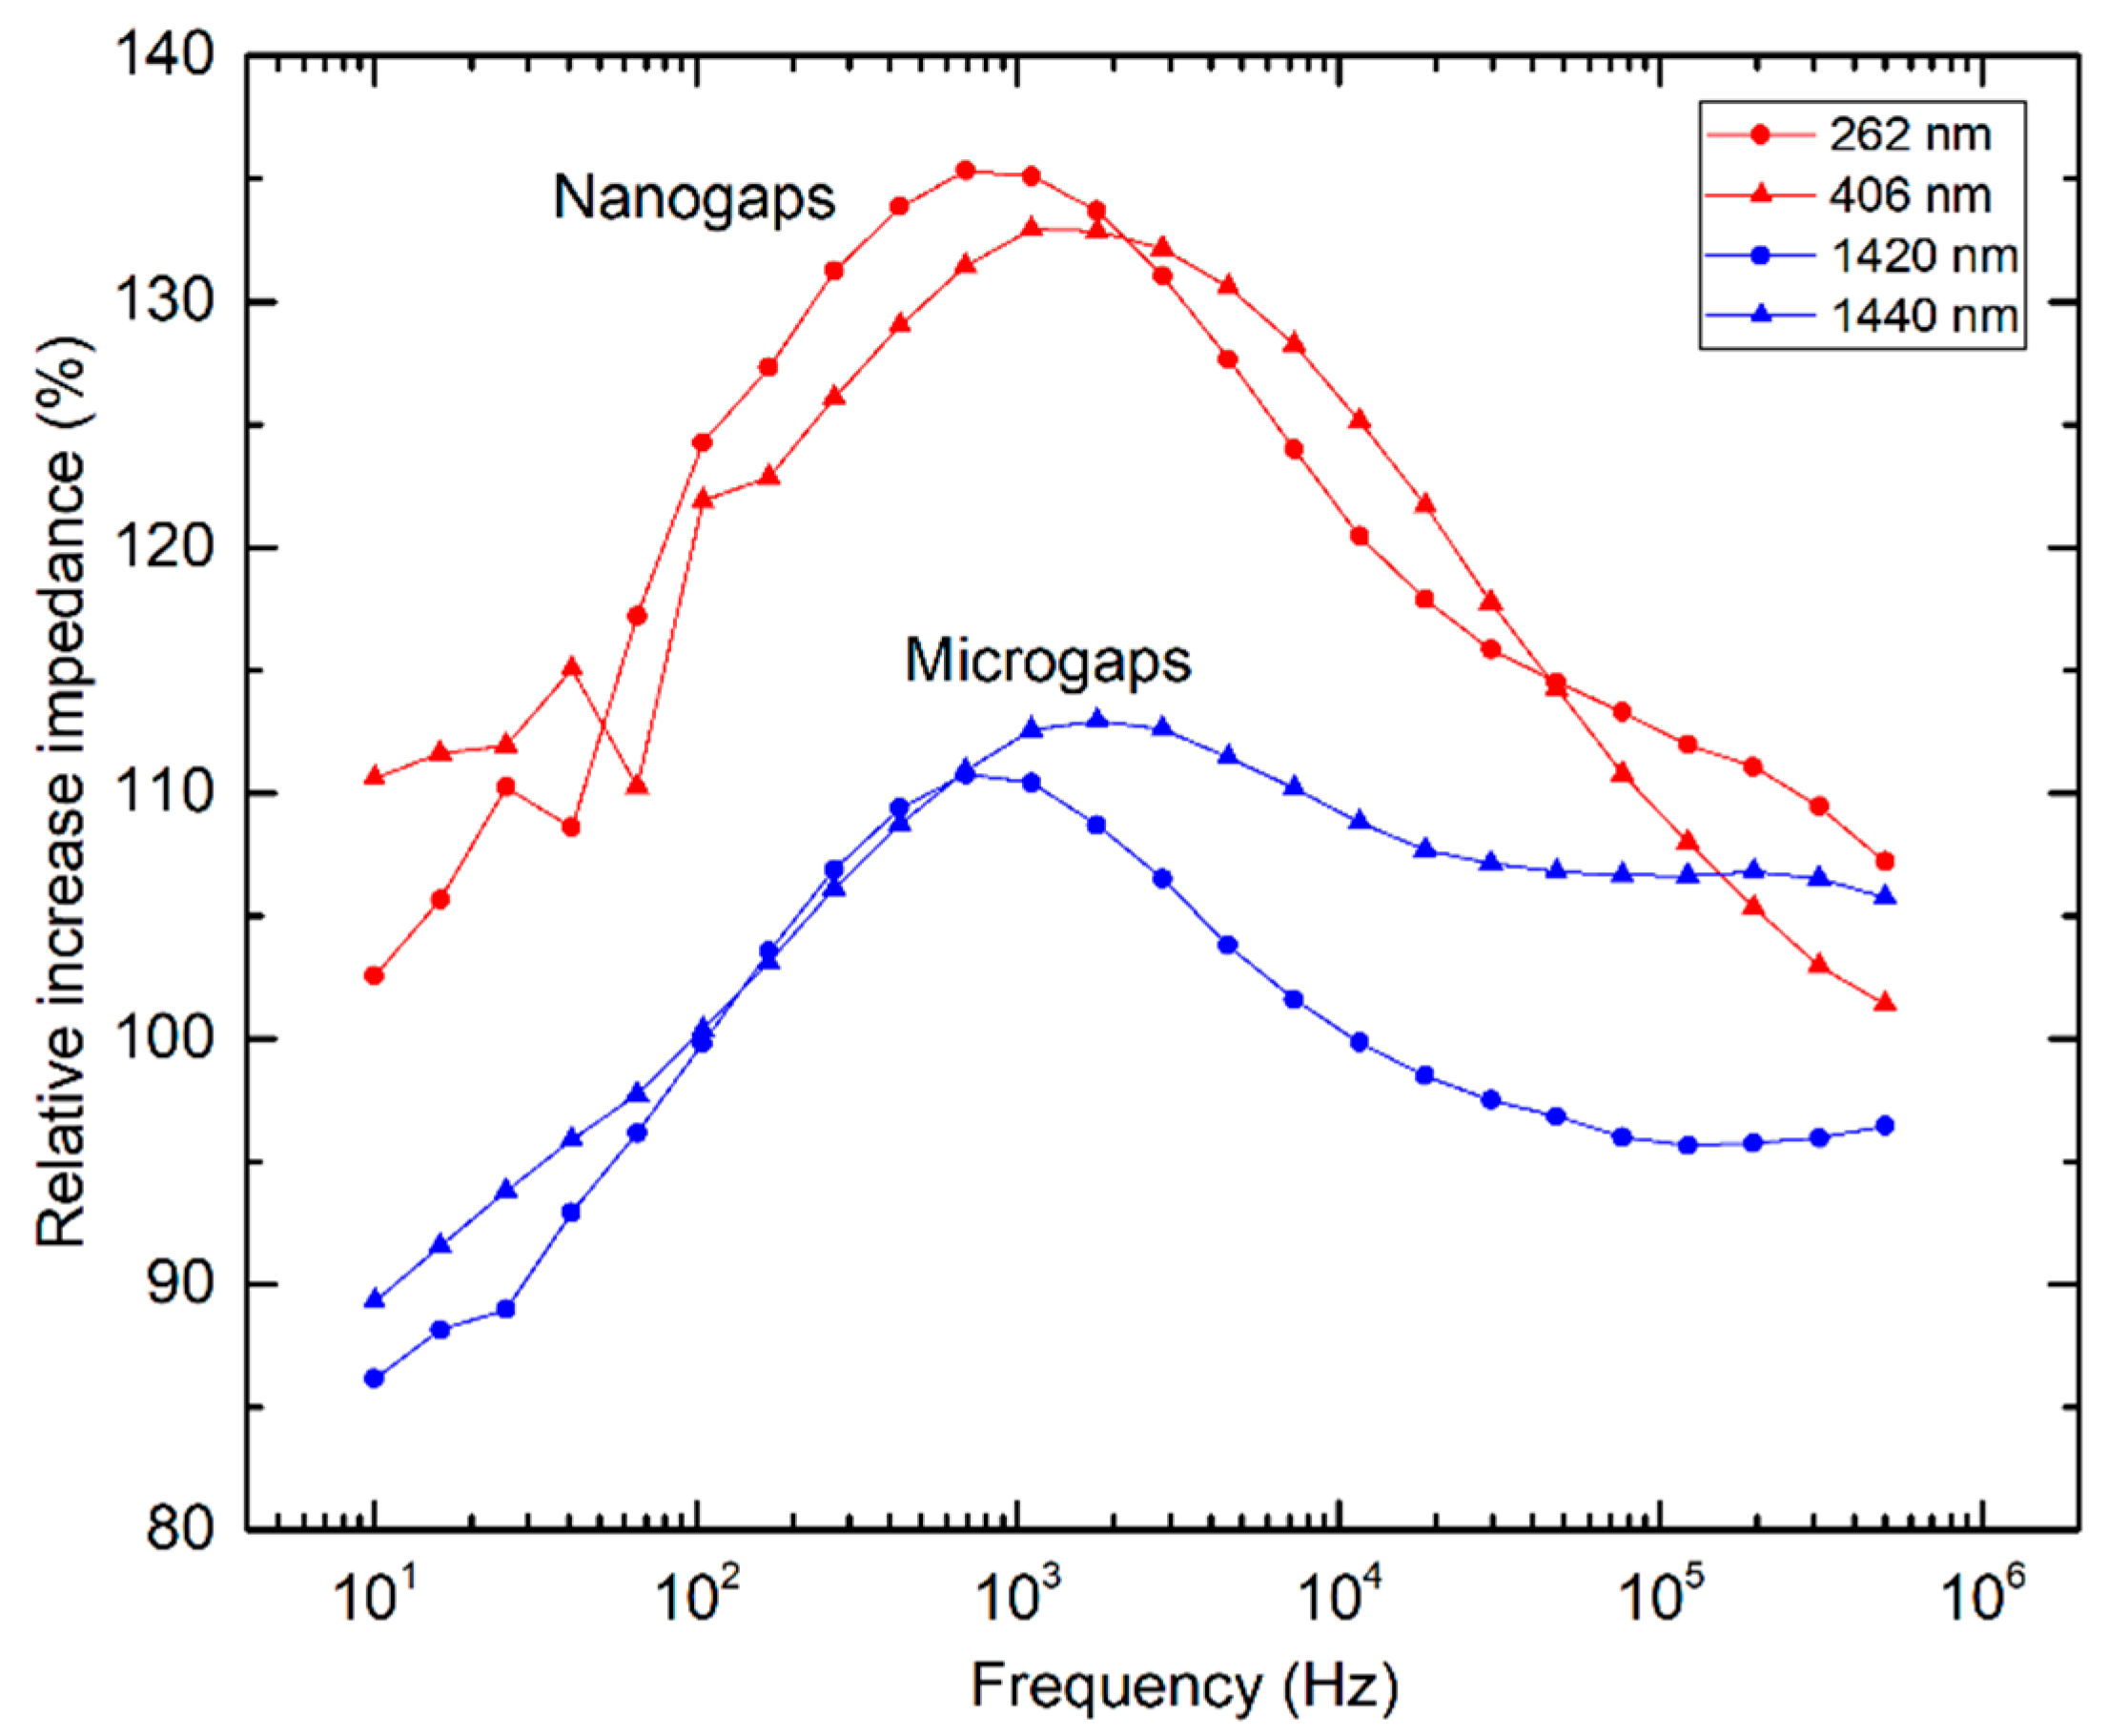
3.2. Impedimetric Characterization
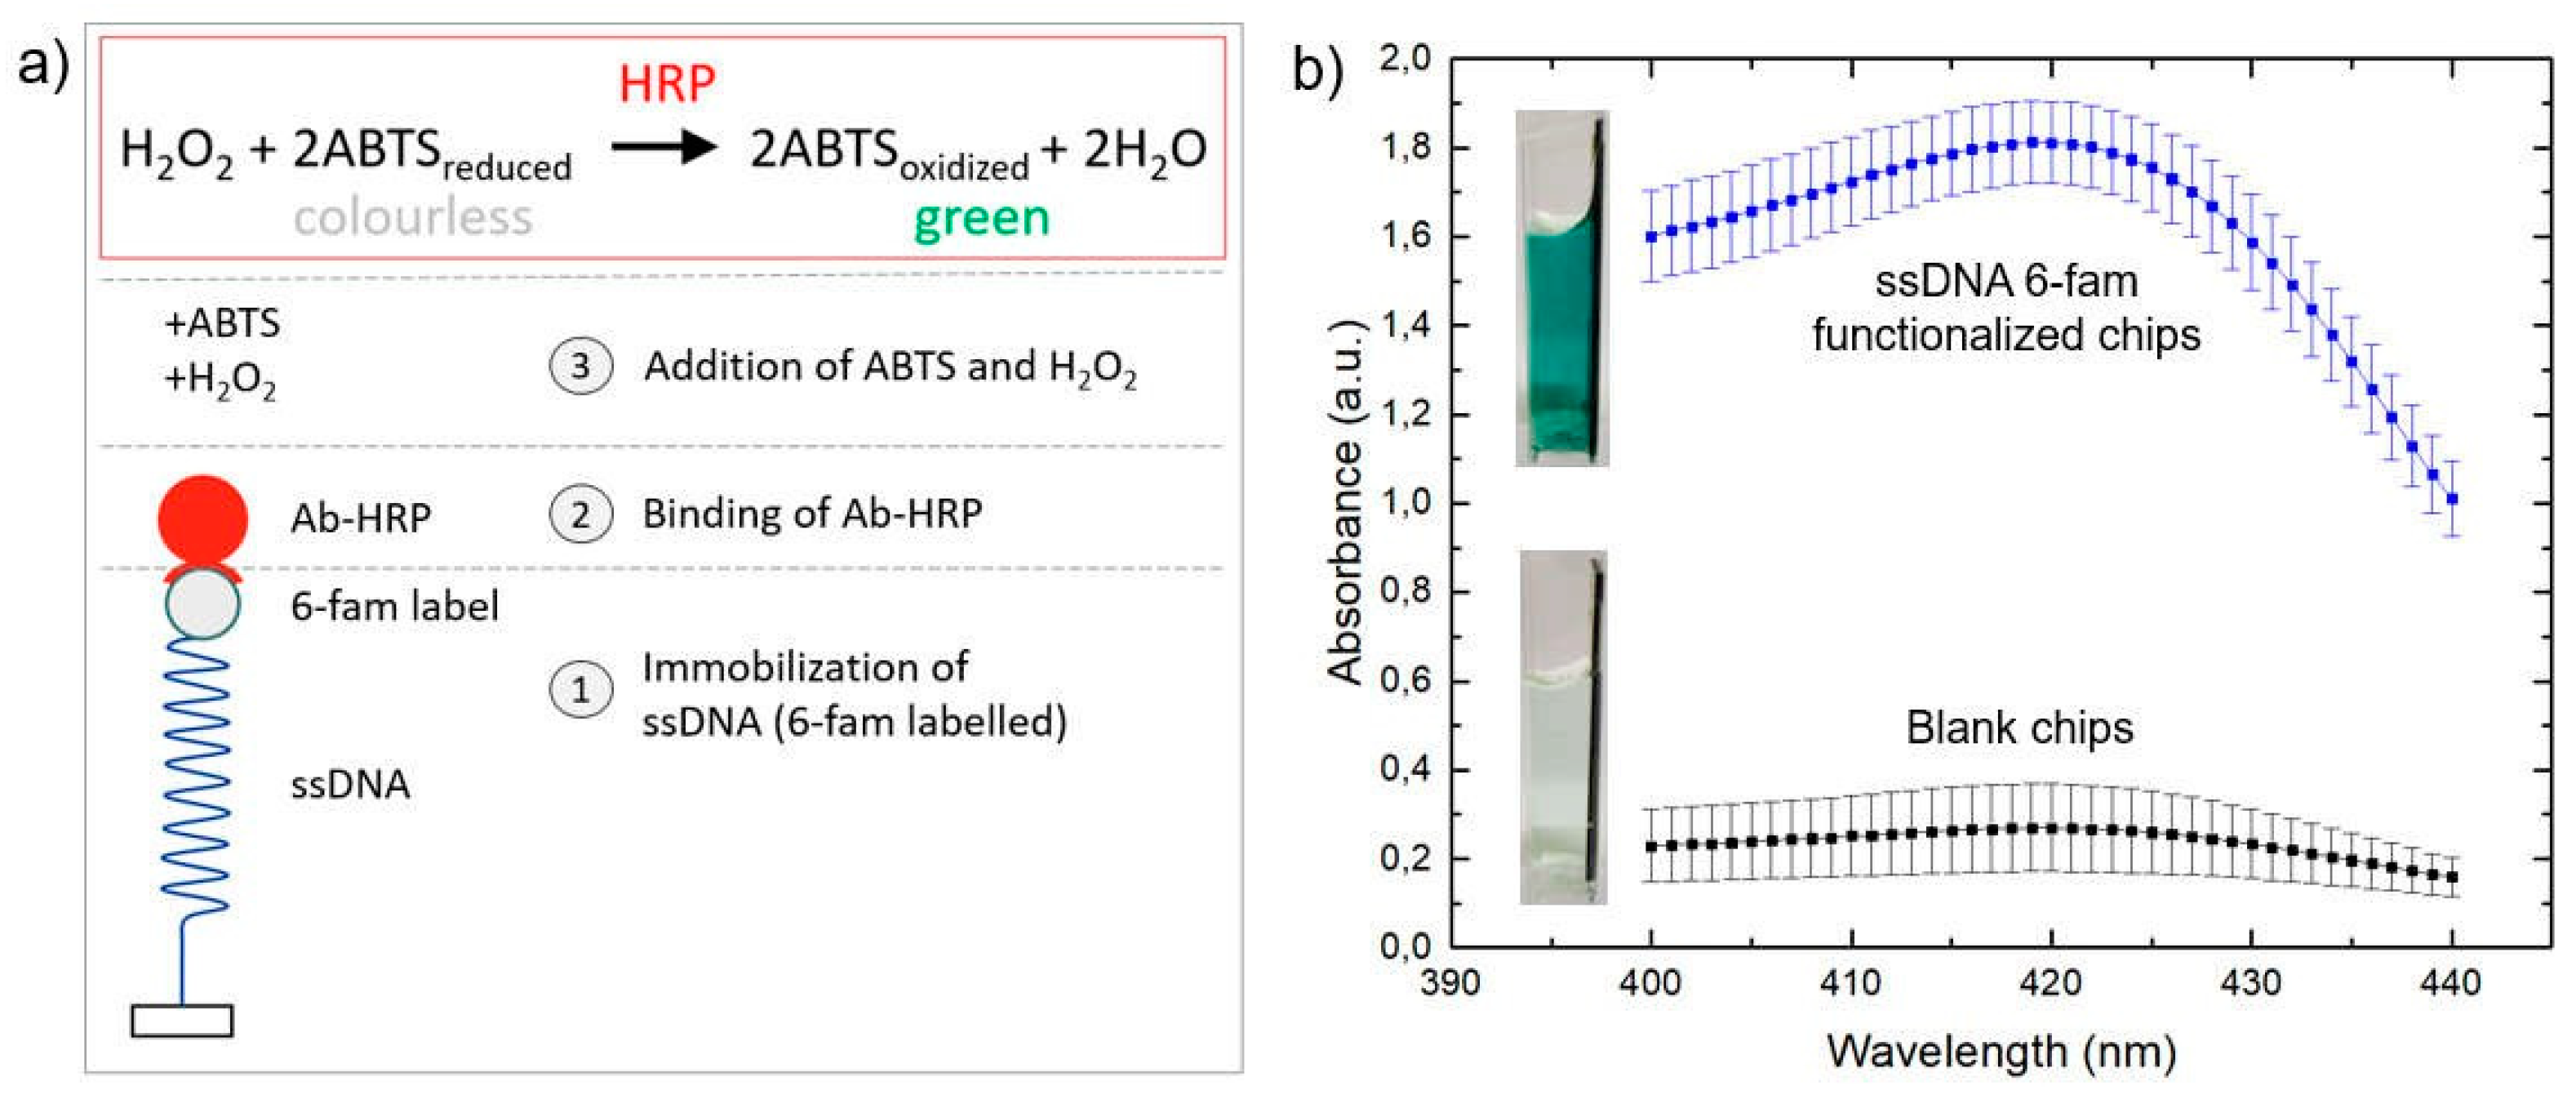
The sensitivity of electrodes of varying gap sizes was characterized by immobilizing ssDNA onto the gold electrodes and comparing the impedimetric response. As can be seen from Figure 3, ssDNA immobilization leads to an impedance increase of approximately 130% for nanogaps, in comparison to a 110% increase for electrodes with 1.4 μm sized gaps (fabricated by a lift-off free method). As the FEM simulations suggest, an even higher sensitivity is expected for 100 nm spaced IDAs, which have already been manufactured but not characterized yet.

3.3. On-Chip ELISA

To verify the successful immobilization of ssDNA on the electrodes of the gold IDA chips, an on-chip ELISA assay was performed. The absorbance spectrum in Figure 4 displays that the samples with immobilized ssDNA show a strong absorption at 414 nm. This indicates the successful immobilization of ssDNA to the gold IDAs. In contrast, on the blank samples (without ssDNA) nearly no Ab-HRP bound to the sensor surface and the absorbance is close to zero.

4. Conclusions

This study demonstrates that by scaling the electrode gap size from micro to nanometers, the sensitivity of impedimetric IDA sensors can be significantly increased. Simulations have shown that decreasing the gap size strongly increases the magnitude and uniformity of the electric field between the electrodes, both factors favoring the sensitivity for biomolecule binding. The impedimetric characterization of IDAs with various gap sizes has demonstrated that the smaller the gap between the IDA electrodes, the higher the impedance increase upon ssDNA immobilization. The successful ssDNA immobilization has been validated by an on-chip ELISA. As further steps, simulations and impedance characterizations will be performed for nanogaps of varying shape and geometry.

Acknowledgments

The authors thank the Austrian Science Fund (FWF) [I 3194 B26] and the German Research Foundation (DFG) for the funding of this work under grant numbers UR 70/10 01 and UR 70/12 01.

Conflicts of Interest

The authors declare no conflict of interest.

References

  1. Daniels, J.S.; Pourmand, N. Label-free impedance biosensors: Opportunities and challenges. Electroanalysis 2007, 19, 1239–1257. [Google Scholar] [CrossRef] [PubMed]
  2. Yusof, Y.B.; Yanagimoto, Y.; Uno, S.; Nakazato, K. Electrical characteristics of biomodified electrodes using nonfaradaic electrochemical impedance spectroscopy. World Acad. Sci. Eng. Technol. 2011, 73, 295–299. [Google Scholar]
  3. Singh, K.V.; Whited, A.M.; Ragineni, Y.; Barrett, T.W.; King, J.; Solanki, R. 3D nanogap interdigitated electrode array biosensors. Anal. Bioanal. Chem. 2010, 397, 1493–1502. [Google Scholar] [CrossRef] [PubMed]
  4. Partel, S.; Dincer, C.; Kasemann, S.; Kieninger, J.; Edlinger, J.; Urban, G. Lift-Off Free Fabrication Approach for Periodic Structures with Tunable Nano Gaps for Interdigitated Electrode Arrays. ACS Nano 2016, 10, 1086–1092. [Google Scholar] [CrossRef] [PubMed]
Figure 1. (a) Simplified 2D model of a blank finger pair of the IDA structure, not drawn to scale (b) Geometrical and electrical parameters used for the simulations.
Proceedings 02 00899 g001
Figure 2. Simulation of the electric field strength in the vicinity of the electrodes for (a) gaps in the micrometer range and (c) nanogap interdigitated electrodes. 1D plot along a cut line crossing the electrode gap for (b) micrometer sized electrodes and for (d) nanogaps.
Proceedings 02 00899 g002
Figure 3. Relative increase of impedance after ssDNA immobilization using IDA sensors with nanogaps (262 and 406 nm) and micrometer sized electrode gaps (1.42 and 1.44 μm).
Proceedings 02 00899 g003
Figure 4. (a) On-chip ELISA assay. Step 1: ssDNA immobilization onto the chip surface, Step 2: Ab- HRP binding to the 6-fam label, Step 3: ABTS and H2O2 are added inducing a reaction transforming ABTS to its oxidized green form, (b) Absorbance spectra of blank and ssDNA functionalized chips.
Proceedings 02 00899 g004
Publisher’s Note: MDPI stays neutral with regard to jurisdictional claims in published maps and institutional affiliations.

