Abstract
An existing phase-locked-loop (PLL) based contact-resonance measurement system is studied and optimized. Improvements to the electronics’ circuit to reduce both nonlinear behavior and noise are realized and experimentally tested. The improvements enable to analyze signals even at highly damped vibrations of the cantilever.
1. Introduction
The ongoing digitalization in the transition to industry 4.0 generates a strong demand for measurement systems, which are designed to monitor workpieces and equipment during production [1]. These systems must analyze large areas while maintaining high spatial resolution [2]. Tactile microcantilevers are promising in this regard. They can scan surfaces at up to 15 mm/s [3] while detecting height differences as low as 11 nm [4]. Operated in contact resonance (CR) mode, the cantilevers provide additional information about mechanical properties of the samples, such as the elasticity and viscosity [5].
2. Measurement Setup and Theory
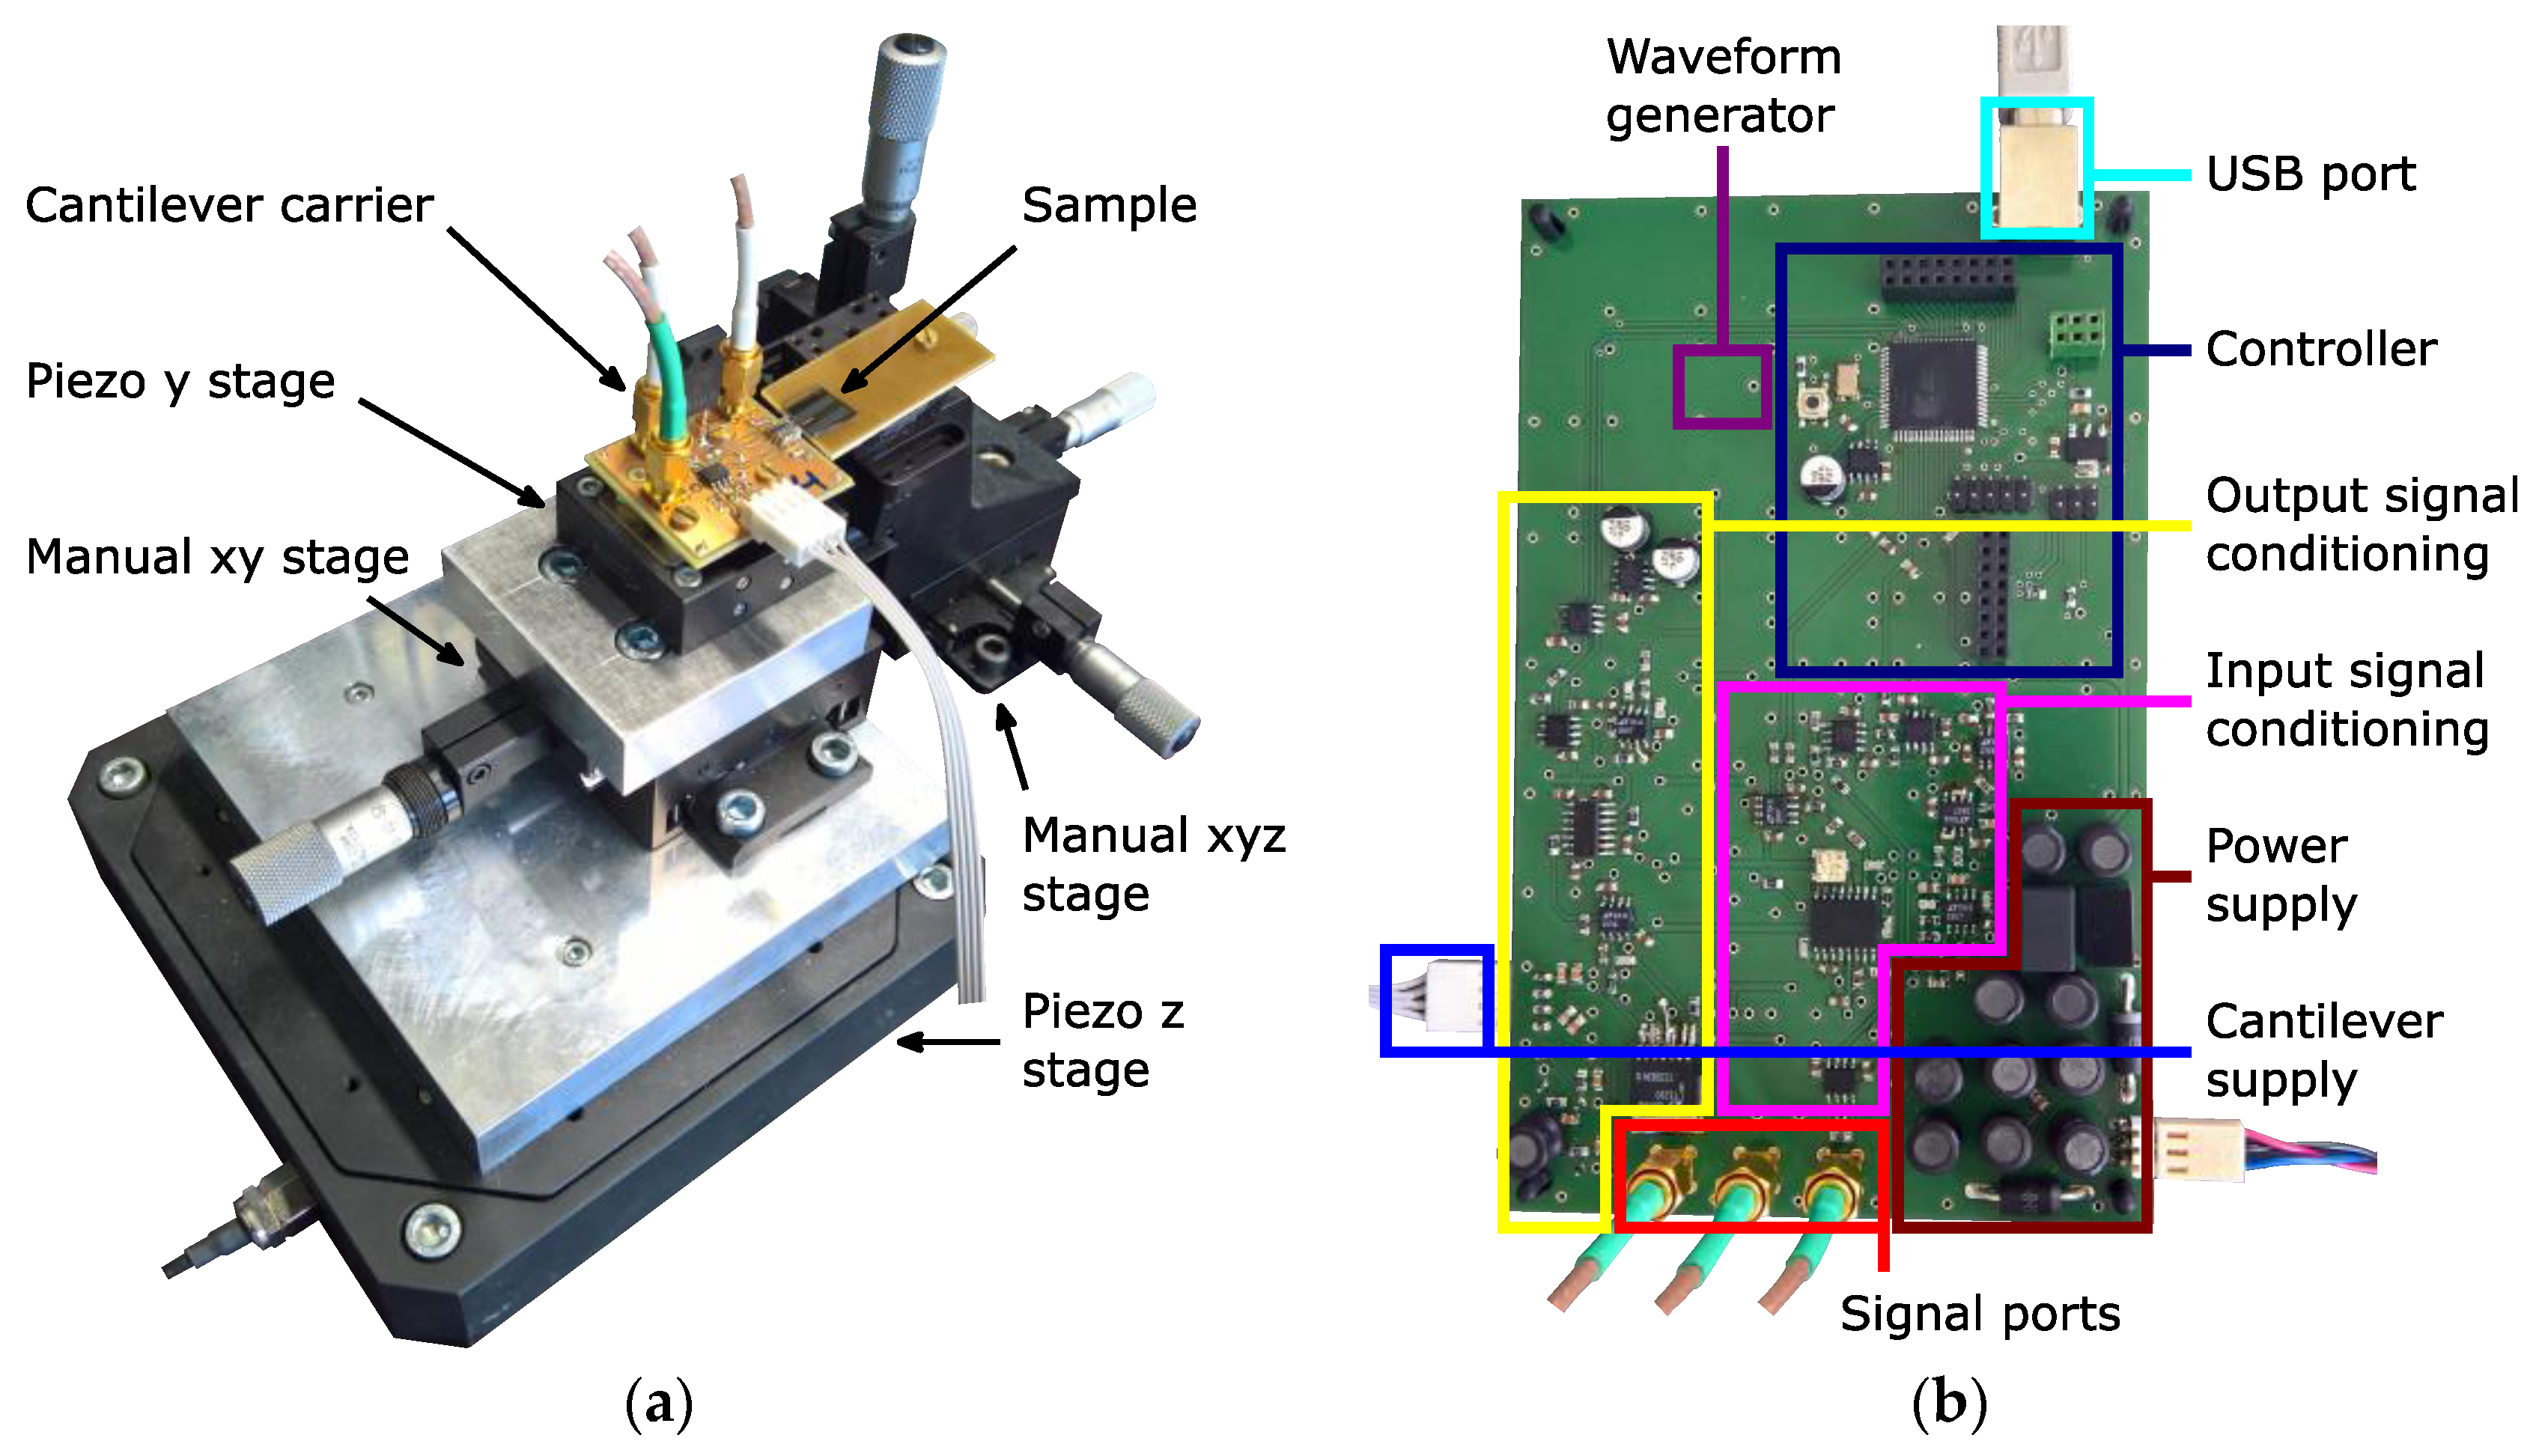
In this work, commercial 5-mm-long, 200-µm-wide and 50-µm-thick tactile microcantilevers (CAN-50-2-5), manufactured by CiS Forschungsinstitut für Mikrosensorik GmbH (Erfurt, Germany), are used [4]. They integrate a piezoresistive readout circuit near their base as well as a silicon tip at their free end. As depicted in Figure 1a, the cantilever probe is mounted on a so-called cantilever carrier. This small PCB provides the cantilever with signal ports, a PL055.30 piezo actuator by Physik Instrumente (PI) GmbH & Co. KG (Lederhose, Germany) and a preamplifier. The signal ports connect the cantilever to the measurement electronics shown in Figure 1b. The electronics supply the piezo actuator with an excitation signal and analyze the resulting output of the cantilever. Using the attached positioning system, the position of the probe can be adjusted manually in x- and y-direction. Additionally, the y- and z-position can be set digitally via a PI P-621.1CD piezo stage controlled by an PI E-750 Digital Piezo Controller and a PI P-518.ZCD piezo stage controlled by an PI E-753 Digital Piezo Controller respectively.
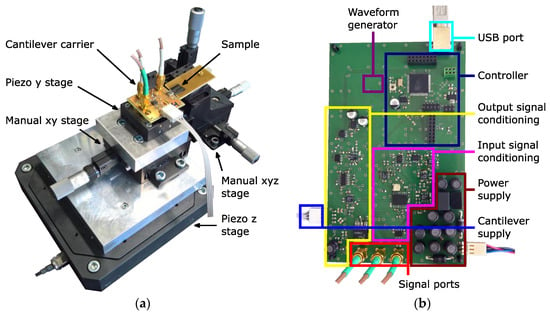
Figure 1.
Measurement setup. (a) Positioning stages, cantilever carrier and sample. (b) Homemade software PLL circuit.
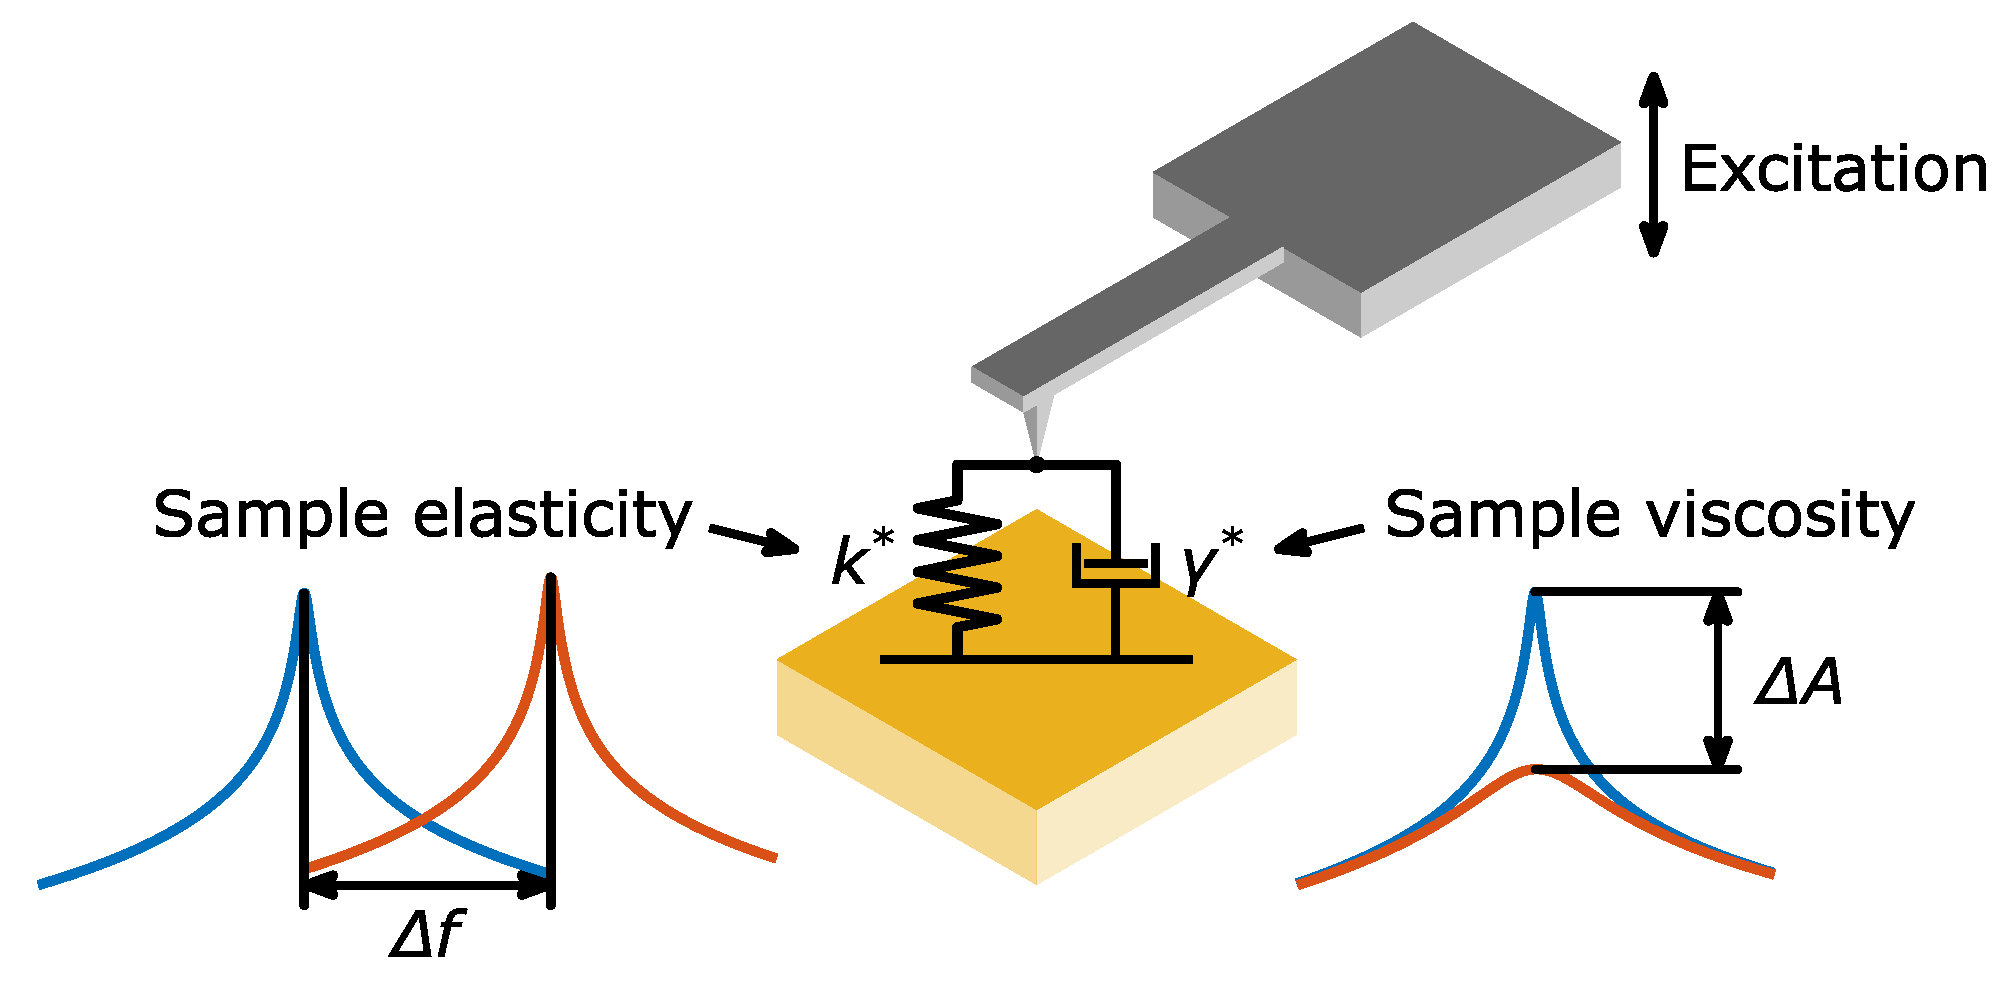
During measurements, the piezo stages are used to set a user-controllable static force, with which the cantilever presses against the sample. Once this force has been reached, the cantilever gets excited dynamically. As shown in Figure 2, the tip of the cantilever interacts with the surface of the samples, which shifts the resonance-frequency and -amplitude of the system. With the tip-sample interaction modeled as a spring-damper element, Bertke et al. [6] solved the cantilevers equation of motion. This reveals that every resonance peak corresponds to a −90° phase shift between response- and excitation signal. Instead of periodically performing frequency sweeps, it is therefore possible to find and track resonance frequencies by tracking the constant resonance phase. This can be done by the use of a phase-locked-loop (PLL).
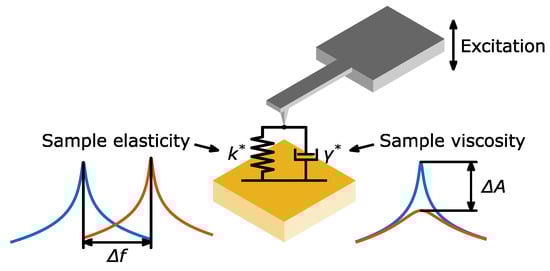
Figure 2.
Schematic of the measurement principle with the tip-sample interaction modeled as a spring-damper element. The contact stiffness is related to the sample elasticity and mainly affects the resonance frequency while the dampening coefficient is related to the viscosity and mainly affects the resonance amplitude (inspired by [5]).
3. Results
In [7], Bertke et al. present an analog PLL (APLL) based contact resonance measurement setup. Its characteristics are listed in Table 1. However, this setup has problems reaching the contact resonance frequency because of its limited phase detection range. To solve this issue, a microcontroller based PLL circuit is proposed.

Table 1.
Comparison between the measurement setups.
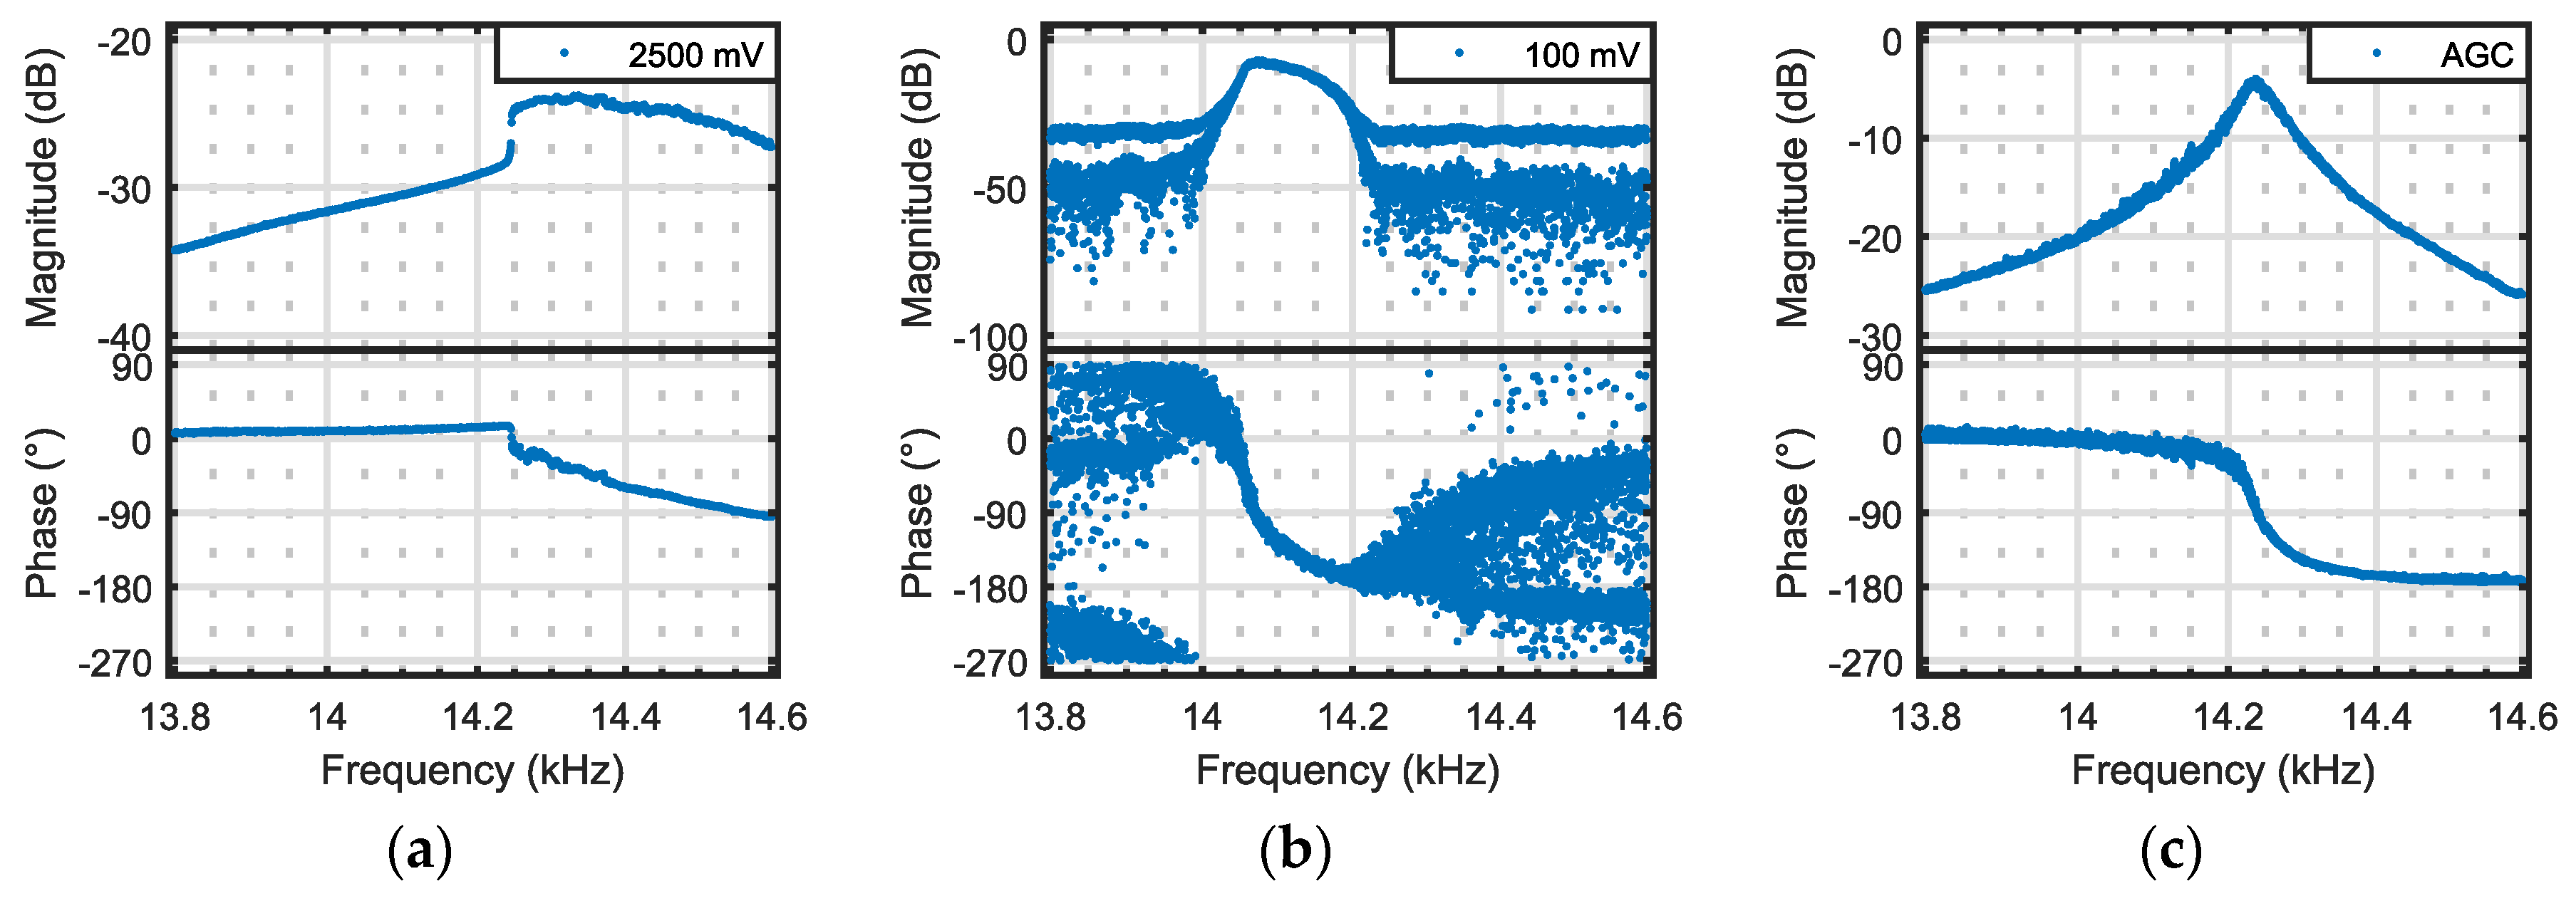
The goal of this work is to build a flexible measurement setup that can be adapted to evolving demands. For this reason, a software PLL (SPLL) based measurement system is used. The first version of the electronics (SPLL v1) tries to address the APLLs shortcomings: the phase detection range is expanded, the phase lock condition is made user controllable, the frequency range is broadened, and the sample rate is increased. However, as shown in Figure 3a, the excitation amplitude is too high and leads to nonlinear behavior of the frequency response [6,7]. It is therefore necessary to be able to control the applied excitation amplitude.
Figure 3.
Amplified CR frequency response of microprobes on a 1.3 µm thick polymer (AZ® 5214 E photoresist by Merck Performance Materials GmbH, Germany) film. Measured in the first out-of-plane vibration mode at approx. 60 µN of static force. Excitation amplitude given in each plot. (a) Measured using SPLL v1. (b) Measured using SPLL v2. (c) Measured using SPLL v3 employing the AGC capabilities of the electronics to reach a constant response amplitude of 50 mV.
This feature as well as several software improvements lead to the creation of SPLL v2. Measuring on the same sample as before, the frequency response shown in Figure 3b is acquired. Though reduced, nonlinear behavior can still be observed in the measured resonance peak shape. Hence, the excitation amplitude needs to be further reduced. This however increases the influence of noise. Even at 100 mV of excitation amplitude, the phase cannot be measured reliable at frequencies higher than 100 Hz removed from resonance. Using a PLL under these conditions leads to unstable results and is therefore not advised. The second out-of-plane vibration mode however allows for precise phase measurements higher than 1000 Hz removed from resonance. Analyzing thin PEDOT films in this vibration mode results in the measured resonance frequencies shown in Figure 4, revealing a linear decrease of with increasing film thickness.
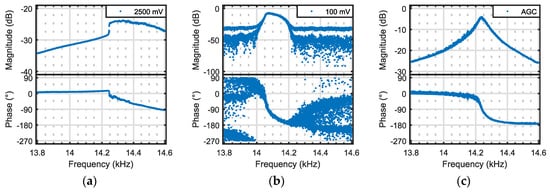
Figure 4.
Second-mode contact-resonance frequencies of thin PEDOT films, measured at approx. 170 µN of static force with 20 mV of excitation amplitude.
To enable measurements in the first out-of-plane vibration mode, a system is required which dynamically increases the excitation amplitude out of resonance, yet still provides amplitudes small enough to eliminate nonlinear behavior in resonance. This is done by utilizing an automatic gain control (AGC). The focus of SPLL v3 is integrating such a system. For this purpose, the analog signal conditioning is improved to allow for improved amplitude measurement and more accurate control over the excitation amplitude. Employing these AGC capabilities, the frequency response depicted in Figure 3c is acquired. It shows greatly reduced noise and no discernable nonlinear behavior.
4. Conclusions
The development of a software phase-locked-loop based contact-resonance measurement system was described. Three iterative versions of the electronics were tested, and their shortcomings discussed. By the second version, analyzing thin PEDOT films was possible. With a thickness resolution of ±15.5 nm, this system proved highly suitable for the determination of the thickness of thin polymer films. The current version additionally provides AGC capabilities, thereby allowing the system to analyze highly damped vibrations at frequencies far removed from resonance.
Author Contributions
M.F., M.B. and J.X. conceived and designed the experiments; M.F. designed the electronics; M.F. performed the experiments; M.F. analyzed the data; L.K. and M.B. contributed materials; M.F. wrote the paper; T.V. and E.P. supervised the research.
Acknowledgments
This project has received funding from the EMPIR programme co-financed by the Participating States and from the European Union’s Horizon 2020 research and innovation programme under No. 17IND05 MicroProbes. M. Bertke is grateful for funding from “Niedersächsisches Vorab”, Germany, through the “Quantum- and Nanometrology (QUANOMET)” initiative within the project of “NP 2-2”. Linus Krieg gratefully acknowledges support by the DFG Research Training Group GrK 1952/1 ‘Metrology for Complex Nanosystems’, the Braunschweig International Graduate School of Metrology B-IGSM, ‘Niedersächsisches Vorab’ through ‘Quantum- and Nano-Metrology (QUANOMET)’ initiative within the project NL-3 ‘Sensors’ and the DFG Research Unit FOR 1616: Dynamics and Interactions of Semiconductor Nanowires for Optoelectronics. J. Xu is grateful for support from the China Scholarship Council (CSC) under the Grant CSC No. 201506300019.
Conflicts of Interest
The authors declare no conflict of interest.
References
- Hofmann, E.; Rüsch, M. Industry 4.0 and the current status as well as future prospects on logistics. Comput. Ind. 2017, 89, 23–34. [Google Scholar] [CrossRef]
- Tapia, G.; Elwany, A. A Review on Process Monitoring and Control in Metal-Based Additive Manufacturing. J. Manuf. Sci. Eng. 2014, 136, 60801. [Google Scholar] [CrossRef]
- Wasisto, H.S.; Doering, L.; Brand, U.; Peiner, E. Ultra-high-speed cantilever tactile probe for high-aspect-ratio micro metrology. In Proceedings of the 2015 Transducers—2015 18th International Conference on Solid-State Sensors, Actuators and Microsystems (TRANSDUCERS), Anchorage, AK, USA, 21–25 June 2015; IEEE: Piscataway, NJ, USA, 2015; pp. 1061–1064. [Google Scholar] [CrossRef]
- Technische Beschreibung: Piezoresistiver Mikrotaster, CiS Forschungsinstitut für Mikrosensorik GmbH, Datasheet. Available online: https://www.cismst.org/fileadmin/user_upload/publikationen/cantilever.pdf (accessed on 16 April 2018).
- Kocun, M.; Ohler, B. Exploring Nanoscale Viscoelastic Properties. Imaging Microsc. 2013, 15, 22–24. [Google Scholar]
- Bertke, M.; Fahrbach, M.; Hamdana, G.; Xu, J.; Wasisto, H.S.; Peiner, E. Contact resonance spectroscopy for on-the-machine manufactory monitoring. Sens. Actuators A Phys. 2018, 279, 501–508. [Google Scholar] [CrossRef]
- Bertke, M.; Reinheimer, U.W.; Fahrbach, M.; Hamdana, G.; Wasisto, H.S.; Peiner, E. Piezo Resistive Read-Out Contact Resonance Spectroscopy for Material and Layer Analysis at High-Aspect-Ratio Geometries. Proceedings 2017, 1, 371. [Google Scholar] [CrossRef]
Publisher’s Note: MDPI stays neutral with regard to jurisdictional claims in published maps and institutional affiliations. |
© 2018 by the authors. Licensee MDPI, Basel, Switzerland. This article is an open access article distributed under the terms and conditions of the Creative Commons Attribution (CC BY) license (https://creativecommons.org/licenses/by/4.0/).