Abstract
In this work we present a complex, wireless, ambient energy powered and easy-to-use solution for vibration analysis. It is designed to incorporate the latest commercial technologies and achievements in the field of energy harvesting and wireless sensor networks with an emphasis on energy efficient spectrum estimation algorithms for embedded systems. This solution is realized on a small printed circuit board and contains all the necessary circuit components for hybrid energy harvesting; acceleration sensing; data acquisition, storing and analysis; and wireless communication. The on-board microcontroller was programmed to choose the most energy-efficient data handling algorithm (direct transfer or embedded analysis) based on the weighed combination of user settings and ambient energy. We tested and calibrated our system in laboratory environment with reference sensors, as well as in an engine room, simulating practical applications.
1. Introduction
Many applications we have today demand the presence of a battery in the system but there are certain cases when it is impossible to maintain the charging or the replacement of the batteries, or the conditions are such that the use of it would be dangerous. One of these is the wireless sensor network (WSN), which consists of numerous devices embedded with sensors that communicate with each other. One of the main challenges with a great amount of battery-powered electronics is charging or replacing all these batteries. Other scenarios include enclosed spaces, high temperatures, where a battery can’t survive. The solution is to incorporate energy harvesting into the system, which results in prolonged battery lifetime or might even replace it altogether [1].
During this research we focused on vibration energy harvesting and vibration analysis and created our device, which is able to utilize the energy of the same vibration source that it takes measurements of.
2. Materials and Methods
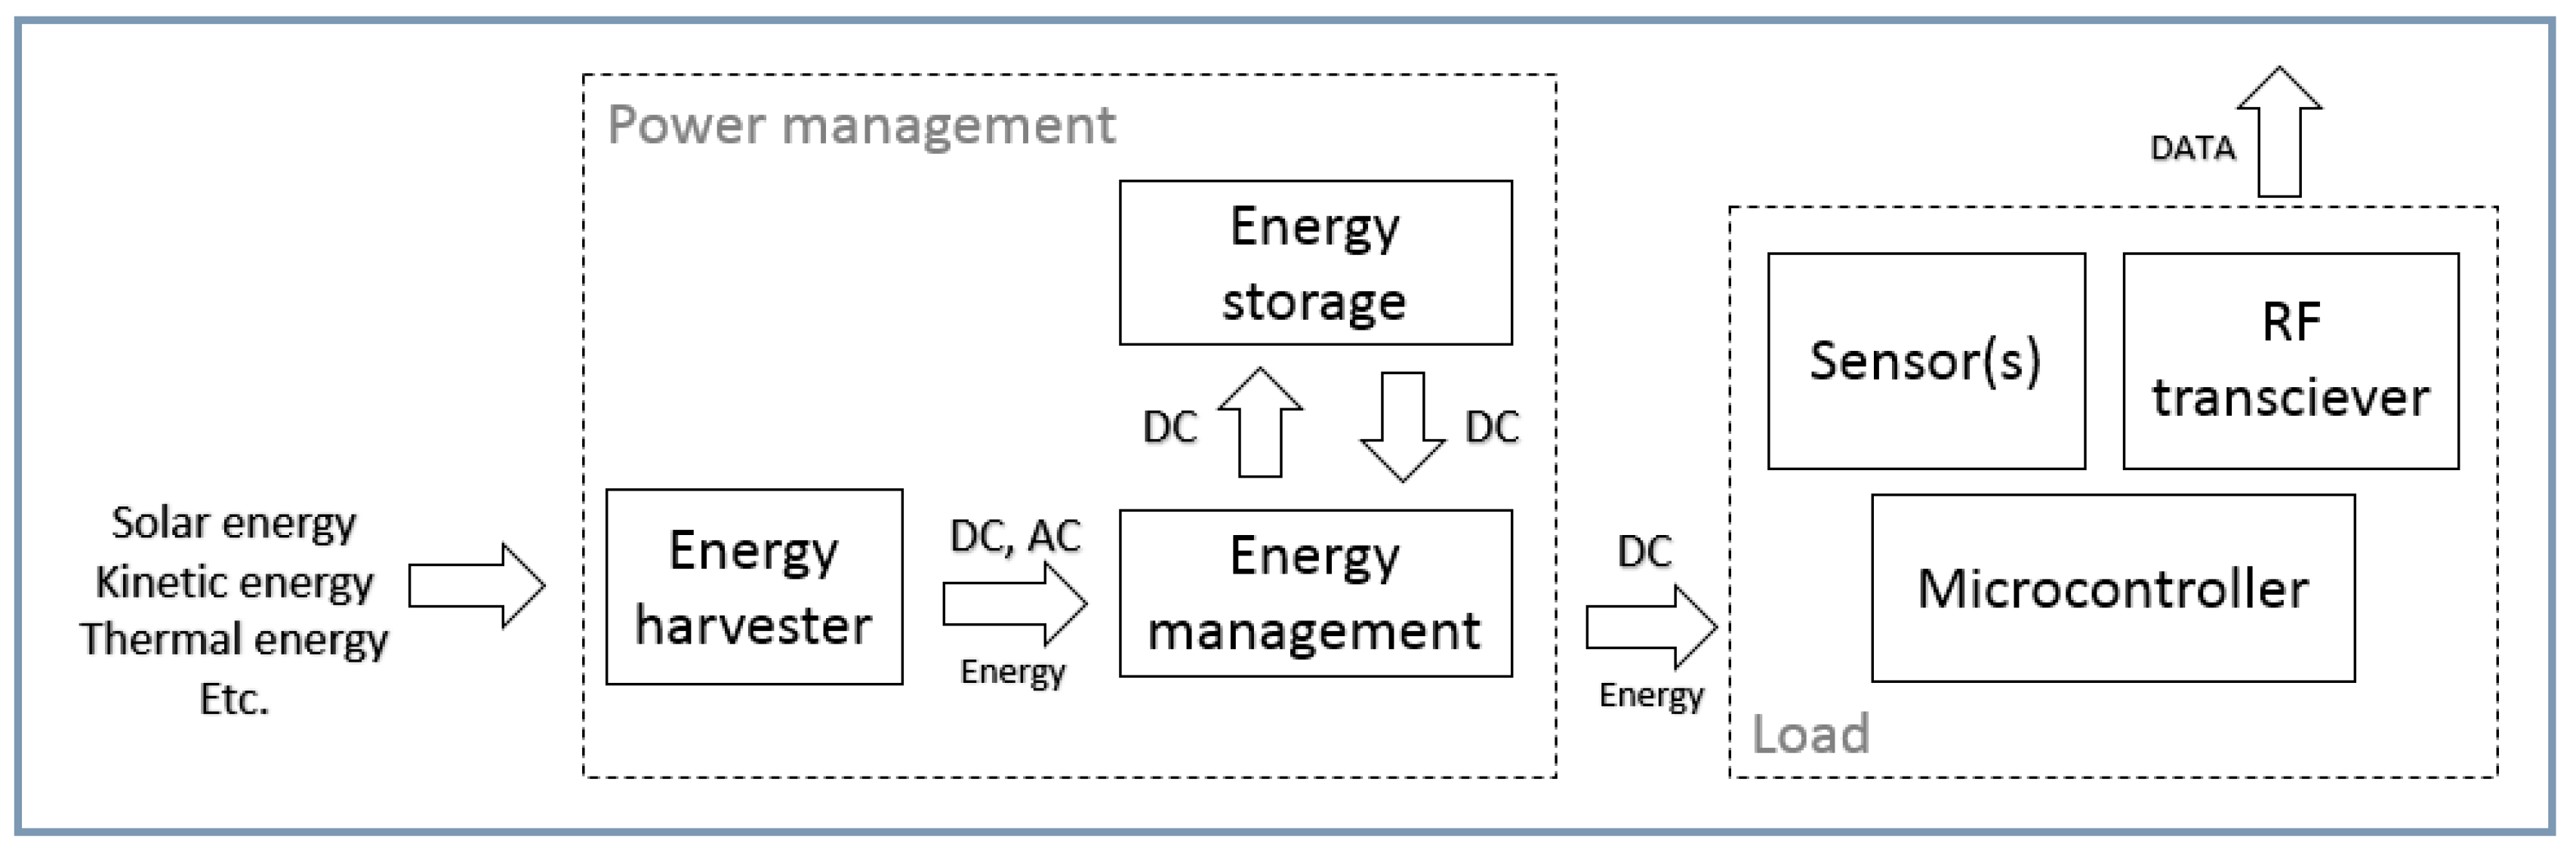
Our vibration analyser device consists of the following modules (Figure 1):
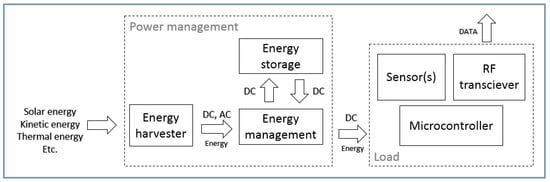
Figure 1.
Block diagram of the components of the vibration analyser.
- Power management circuit with boost-charger, buck converter and Graetz-bridge rectifier. It is possible to use two energy harvester power sources simultaneously, one with alternating current and the other with direct current (hybrid harvesting). Only one of the two sources can provide current at a time. The built-in MPPT algorithm is responsible to optimally harvest energy from different sources and conditions [2].
- Supercapacitor (470 mF) as the main energy storage component and a LiPo battery (190 mAh) as the backup. The main microcontroller continuously measure the voltage of both energy storage components and with the help of the power path control circuit—switches to the most suitable one (with a priority to the supercapacitor).
- Sensors that comprise of an accelerometer and a temperature-, and humidity sensor.
- RF transceiver that has a built in RF chip and a microcontroller used solely for handling RF transmission.
- The main microcontroller that acts as the master in the system. It initiates measurements, controls the power path, wakes up the RF module if necessary and does the spectrum (DFT—Discrete Fourier Transform) calculations.
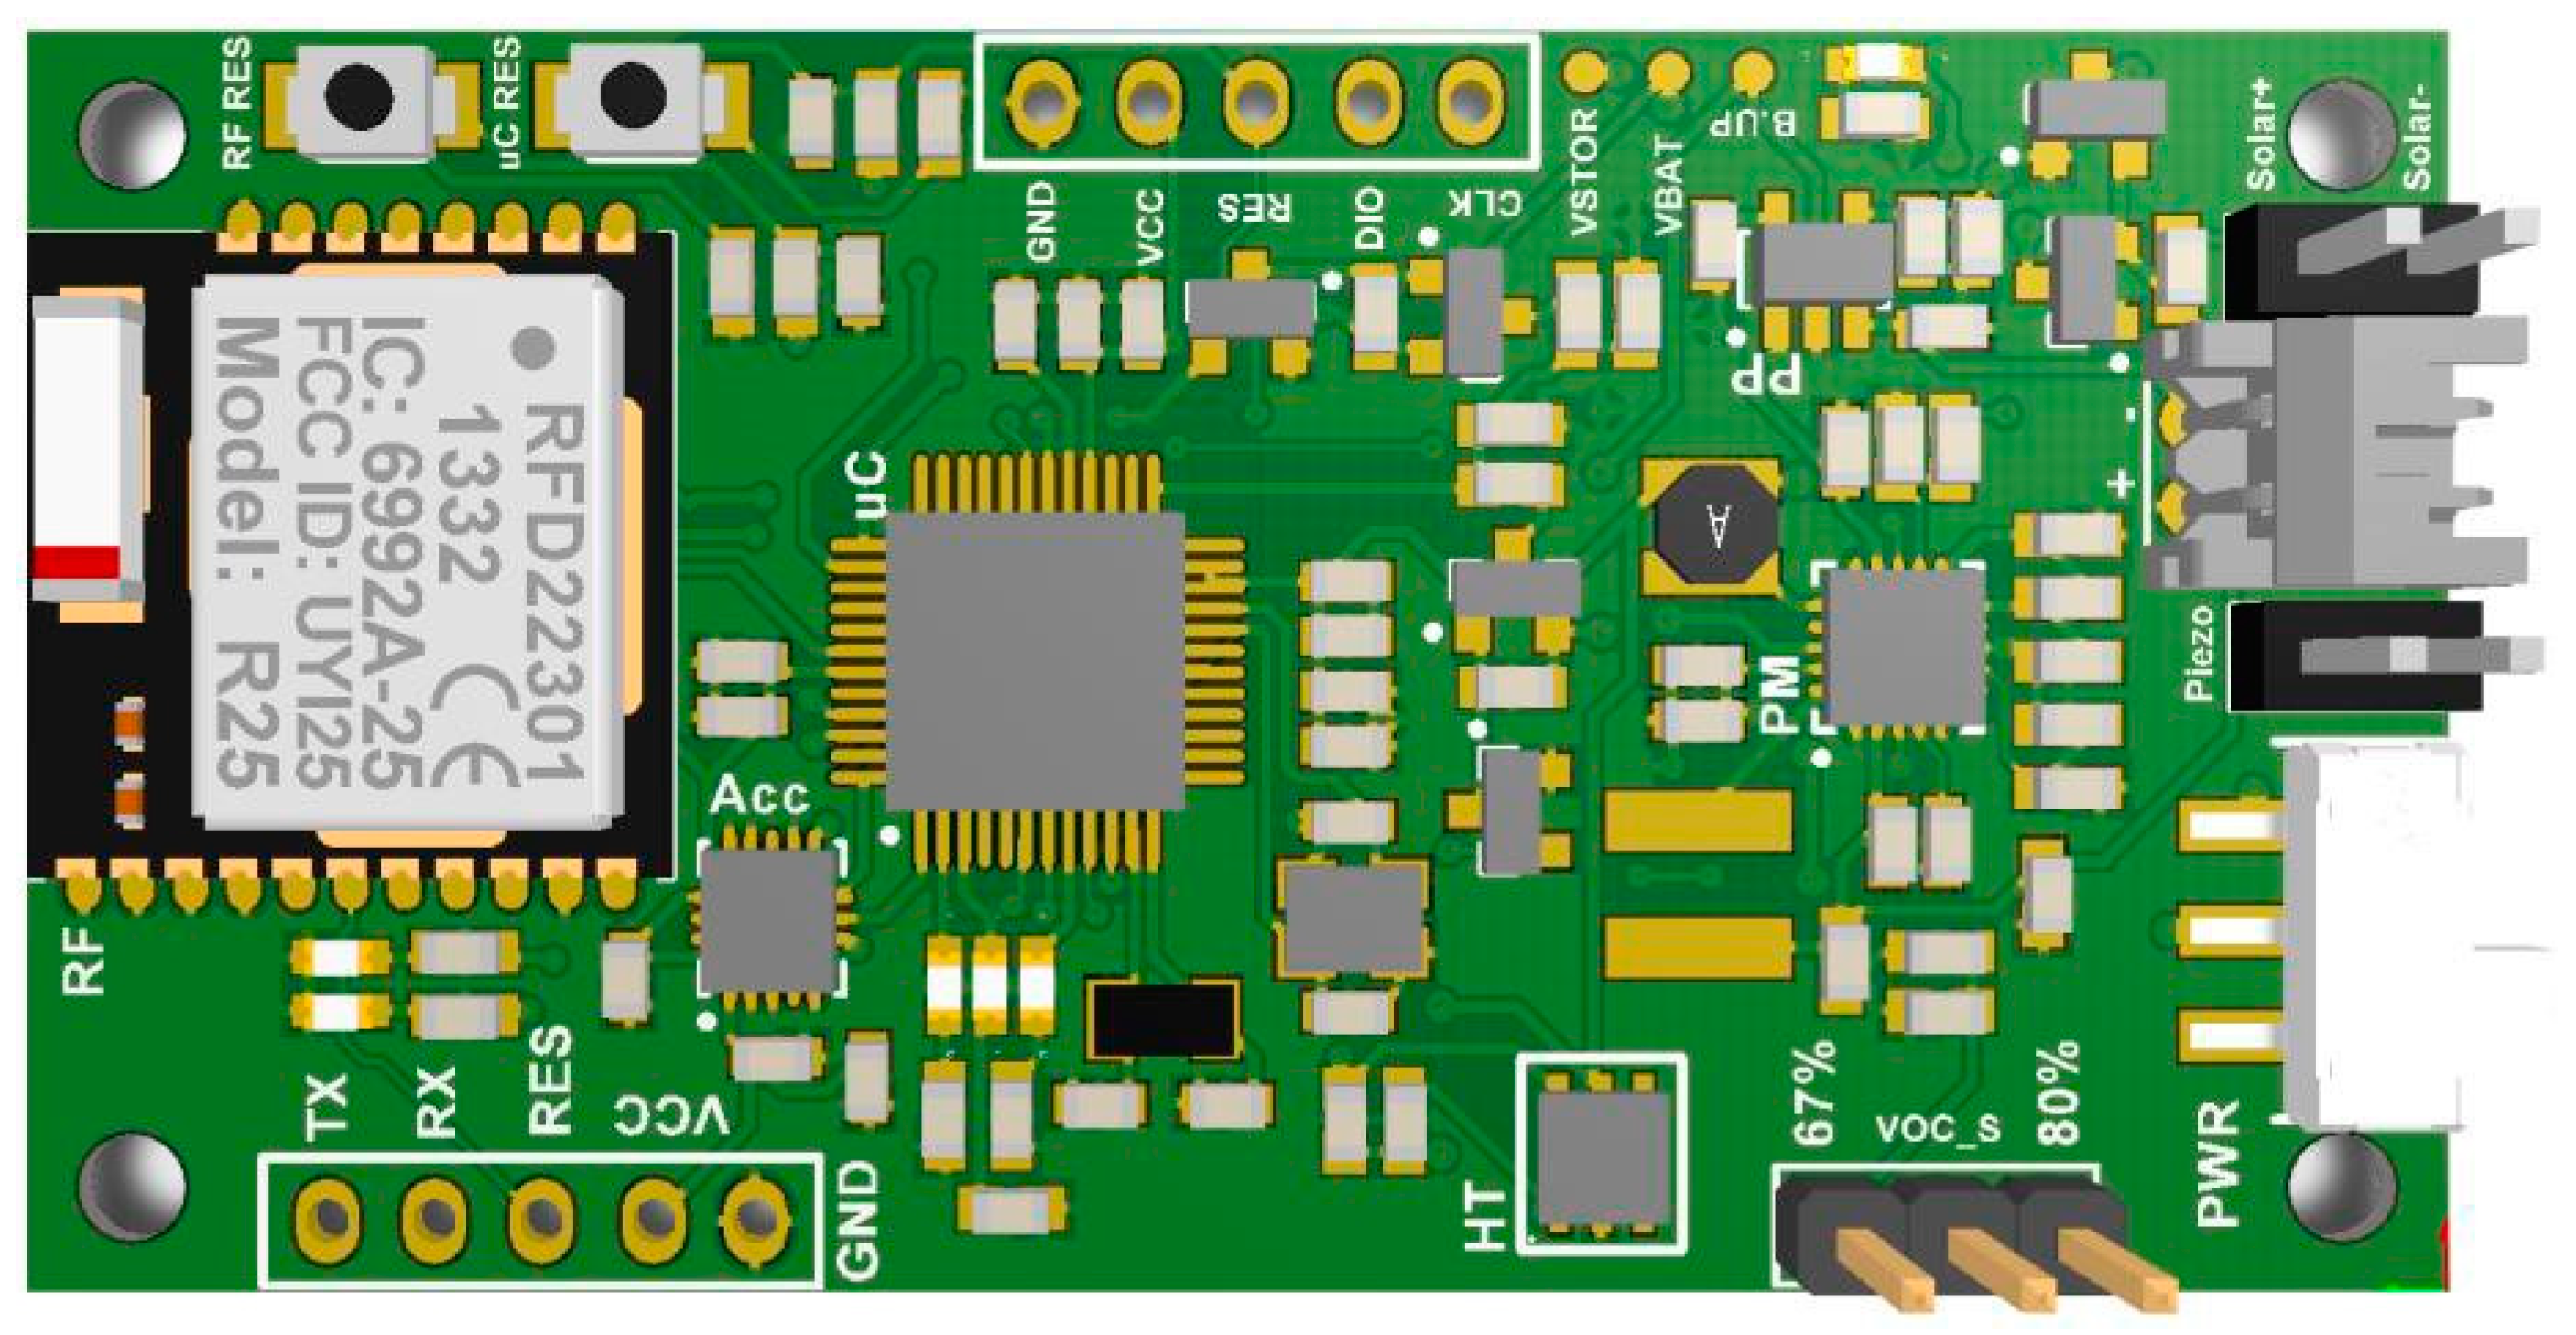
All of the modules mentioned above and shown in Figure 1 are connected together on a small (57.5 × 30 mm) printed circuit board that can be seen in Figure 2.

Figure 2.
3D view of the PCB (Printed Circuit Board) in Altium Designer. The dimensions of the PCB is 57.5 × 30 mm.
3. Results
The accelerometer onboard the PCB was tested in laboratory environment with the help of an (already calibrated) reference accelerometer and an electromagnetic vibration shaker.
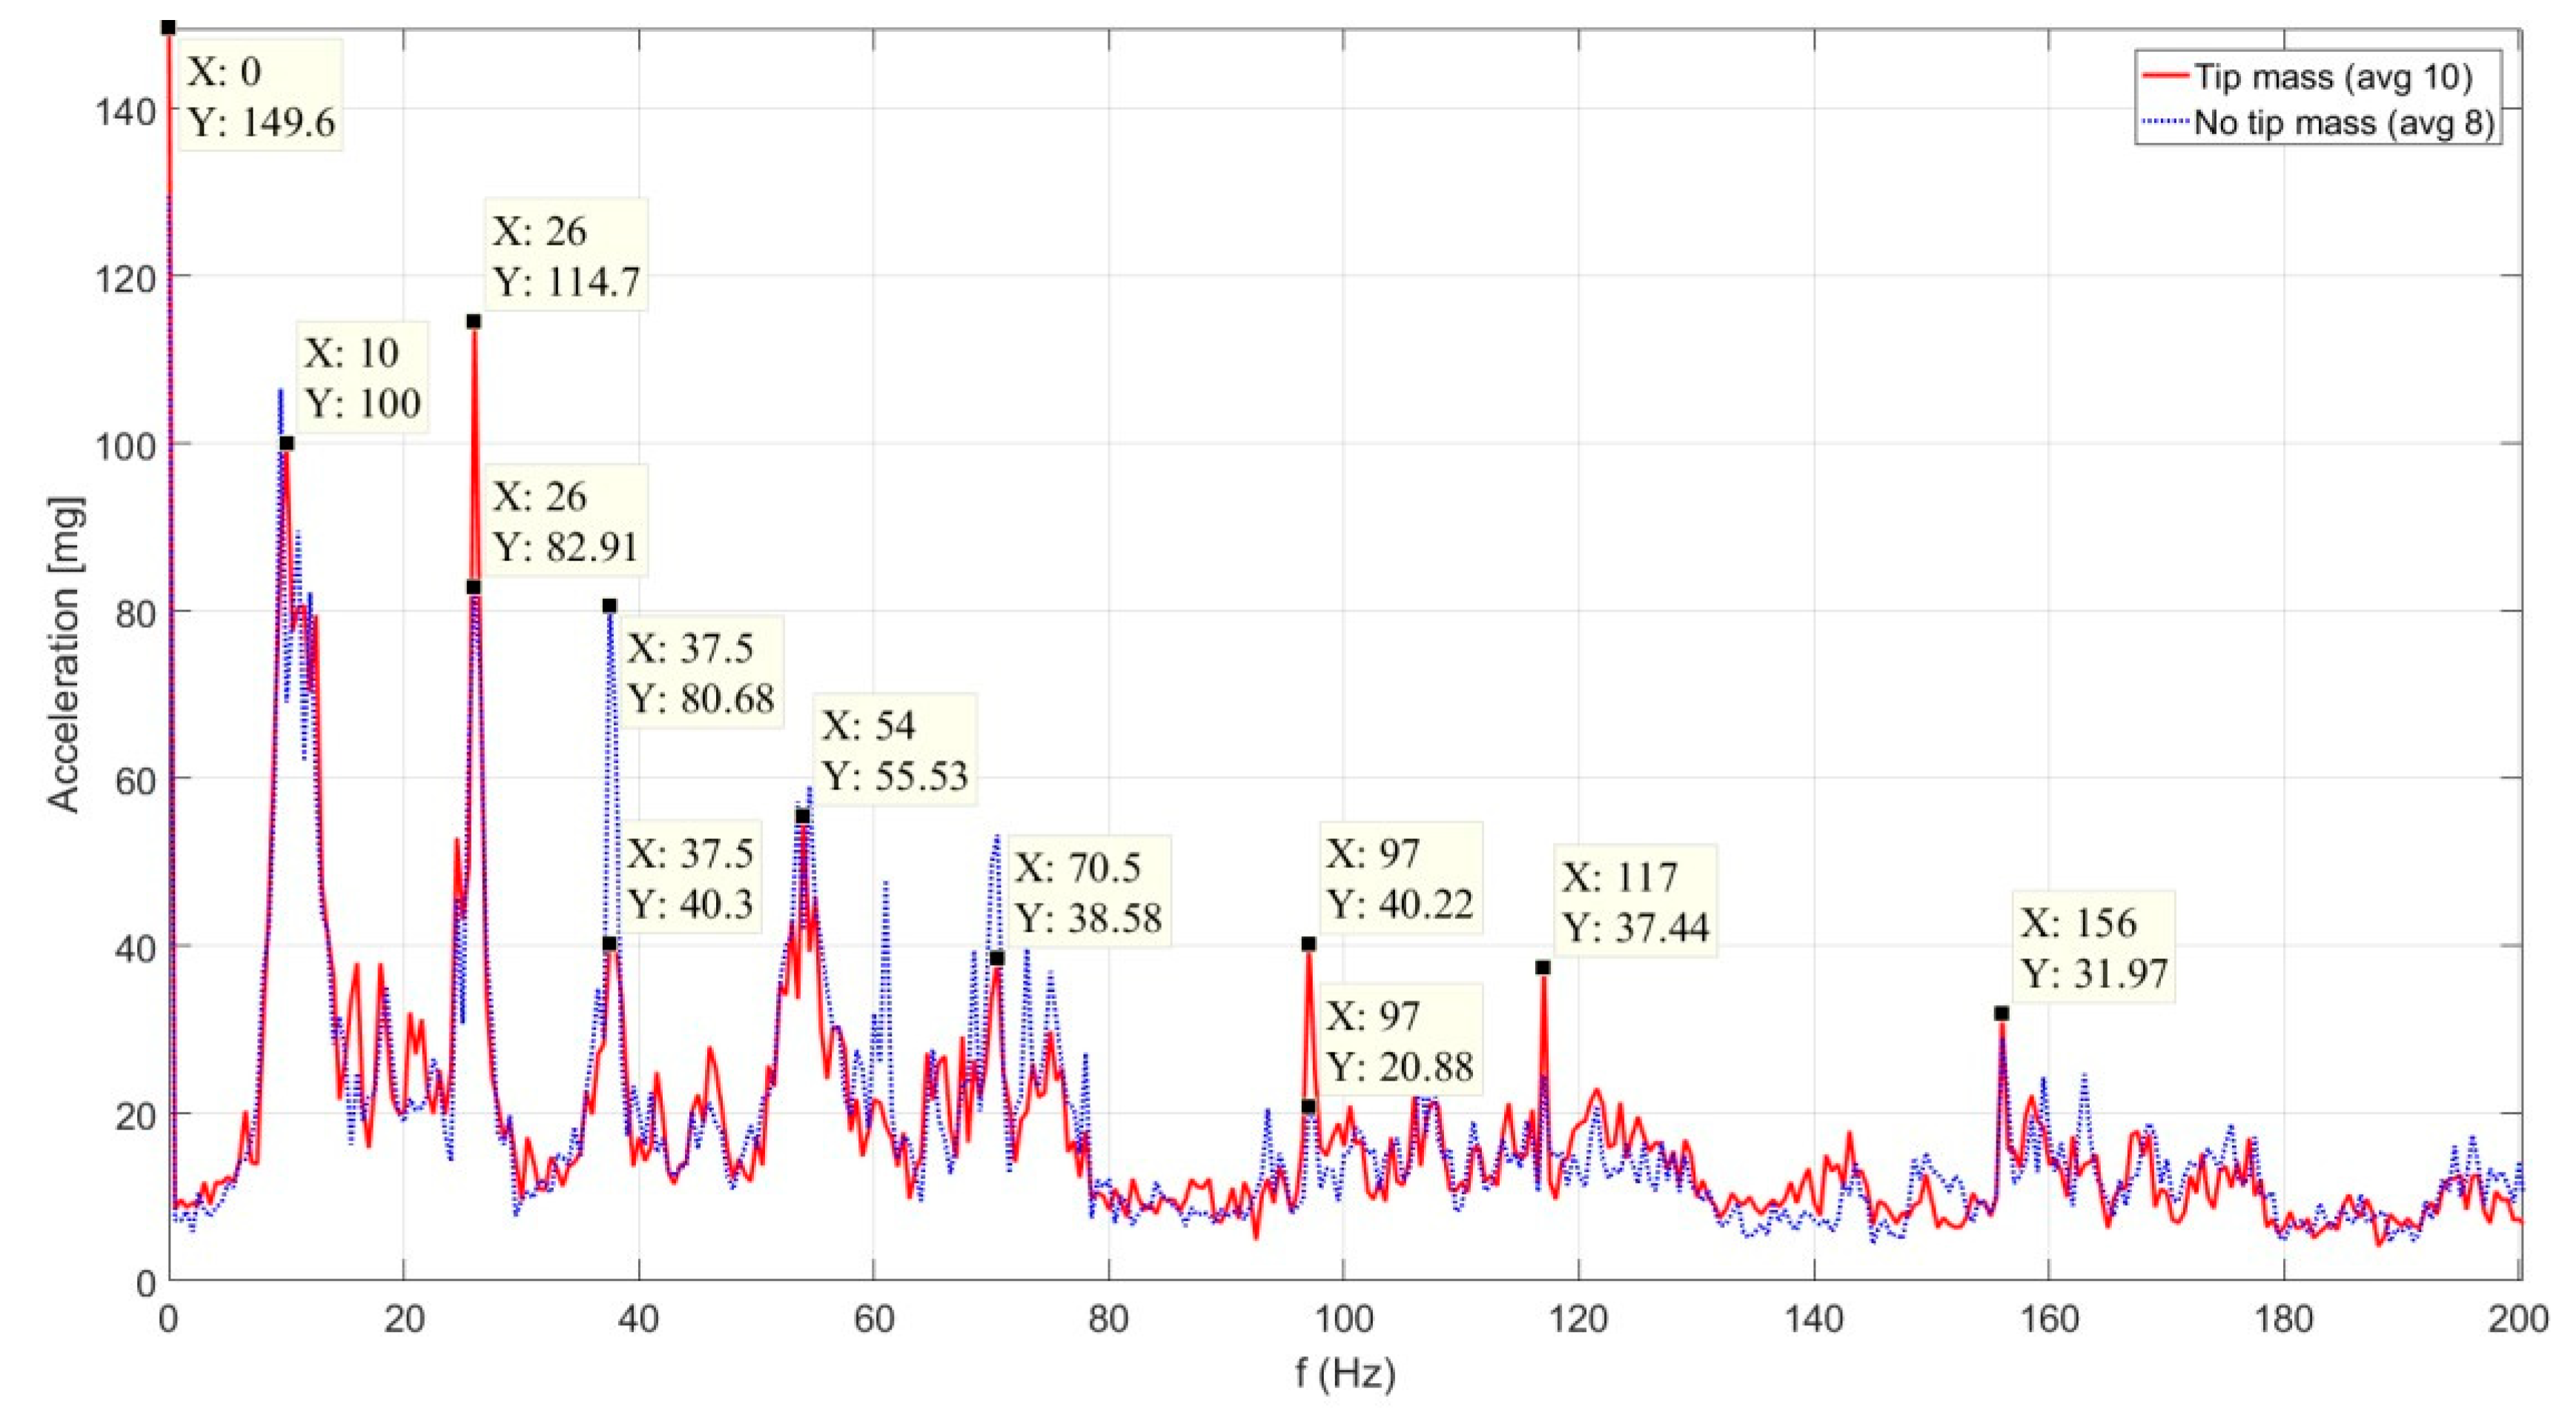
The device was tested not only in laboratory environment but also in an engine room, simulating real world applications. It was placed onto the sidewall of an air-circulating tube. The measurement seen on Figure 3 was taken with direct data sending measurement mode, meaning the acceleration data was sent to a computer and was later evaluated with Matlab. The result of the measurement—which is the amplitude spectrum of the inspected object—can be seen on Figure 3.
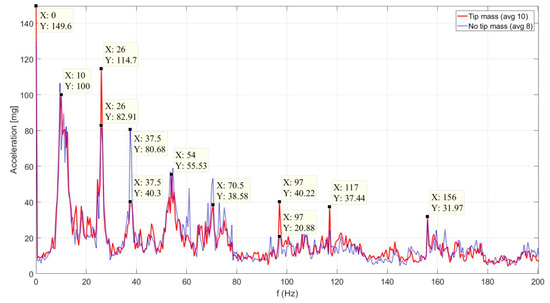
Figure 3.
Averaged, single-sided amplitude spectrum of the acceleration on the sidewall of an air-circulating tube within the engine room of the clean room belonging to MFA (Institute of Technical Physics and Materials Science). One of the configurations shows the spectrum when there was no tip mass on the piezoelectric cantilever (blue dashed line) and the other with a tip mass (red line).
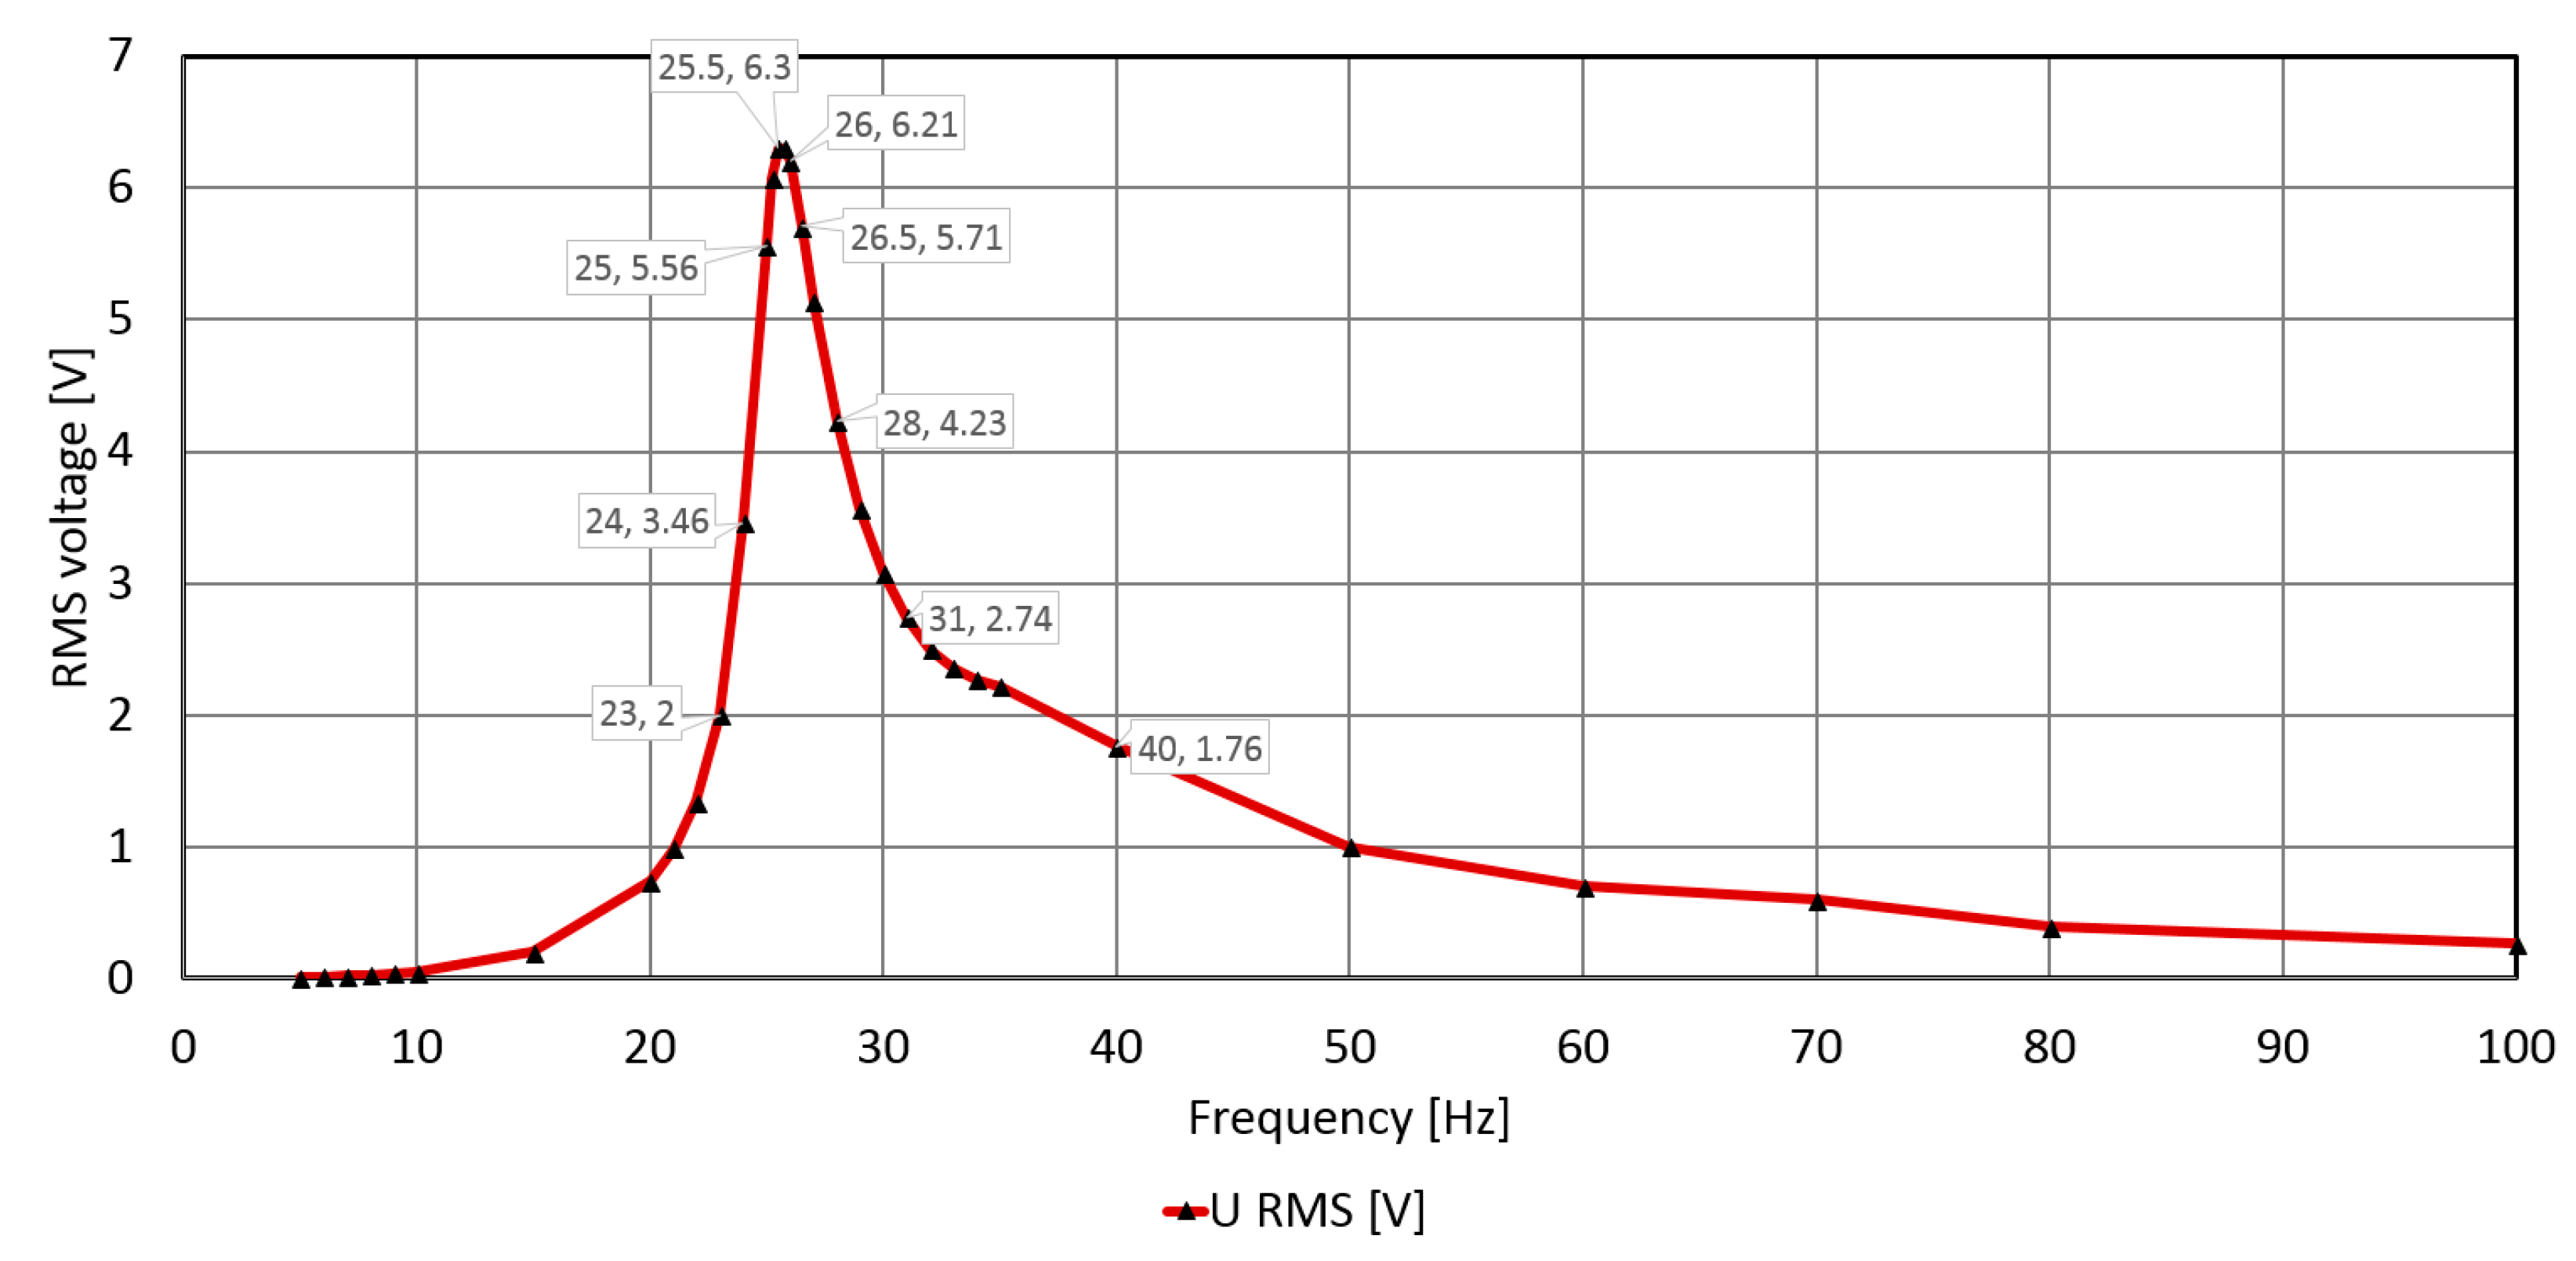
Based on Figure 3 piezoelectric cantilever was tuned to 26 Hz, the frequency component with one of the highest amplitude vibrations (Figure 4). Using linear piezoelectric energy harvesting our configuration was able to harvest up to 1 μW of energy.
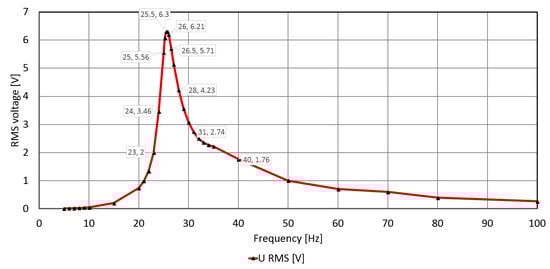
Figure 4.
Frequency response of the Mide PPA-1014 piezoelectric cantilever adjusted to 26 Hz. The measurement was taken on a vibration shaker with 250 mg acceleration excitation and with a resistive load on the piezoelectric output of 127.5 kΩ.
4. Discussion
The presented small device consists of commercially available components, provides an interface to study and test vibrational energy harvesters. In order to maximize the harvested energy, the main vibrational frequency of the piezoelectric cantilever can be tuned by a moving mass according to the environment and the conditions of the given application. The proposed system can aid the research of energy harvesting and provides an interface to test new energy harvesters. The system was designed to be easy-to-use for the user but at the same time deliver efficiency and complexity regarding the data handling.
Acknowledgments
This work was done in the frame of the NVKP_16-1-2016-0018 project financially supported by the Hungarian National Research, Development and Innovation Office.
Conflicts of Interest
The authors declare no conflict of interest. The founding sponsors had no role in the design of the study; in the collection, analyses, or interpretation of data; in the writing of the manuscript, and in the decision to publish the results.
References
- Priya, S.; Song, H.C.; Zhou, Y.; Varghese, R.; Chopra, A.; Kim, S.-G.; Kanno, I.; Wu, L.; Sam, H.D.; Ryu, J.; et al. A Review on Piezoelectric Energy Harvesting: Materials, Methods, and Circuits. Energy Harvest. Syst. 2017, 4, 3–39. [Google Scholar] [CrossRef]
- Bandyopadhyay, S.; Chandrakasan, A.P. Platform Architecture for Solar, Thermal, and Vibration Energy Combining with MPPT and Single Inductor. IEEE J. Solid State Circuits 2012, 47, 2199–2215. [Google Scholar] [CrossRef]
Publisher’s Note: MDPI stays neutral with regard to jurisdictional claims in published maps and institutional affiliations. |
© 2018 by the authors. Licensee MDPI, Basel, Switzerland. This article is an open access article distributed under the terms and conditions of the Creative Commons Attribution (CC BY) license (https://creativecommons.org/licenses/by/4.0/).